Methylmercury Exposure and Health Effects from Rice and Fish Consumption: A Review


Abstract
:1. The Toxicity of Methylmercury
1.1. Pathways of Human Exposures
1.2. Toxicokinetics
1.3. Biological Indicators
1.4. Health Effects
1.4.1. Neurological Effects
1.4.2. Renal Effects
1.4.3. Cardiovascular Effects
1.4.4. Reproductive Outcomes
1.4.5. Immune System Effects
2. MeHg in Rice and Risk Assessment
3. Hair MeHg levels
4. The Impacts of Nutrition and Co-Contaminants on MeHg Intoxication
4.1. Selenium
4.2. n-3 Long Chain Polyunsaturated Fatty Acids
4.3. Protein
4.4. Other Nutrients
4.5. Co-Contaminants
5. Conclusions and Future Perspectives
Acknowledgments
Reference
- Methylmercury; Environmental Health Criteria 101; WHO: Geneva, Switzerland, 1990.
- Mercury Study Report to the Congress, Volume V: Health Effects of Mercury and Mercury Compounds; United States Environmental Protection Agency: Washington, DC, USA, 1997.
- Toxicological Profile for Mercury; Agency for Toxic Substances and Disease Registry: Atlanta, GA, USA, 1999.
- National Research Council. Toxicological Effects of Methylmercury; National Academy Press: Washington, DC, USA, 2000. [Google Scholar]
- Clarkson, TW. The three modern faces of mercury. Environ. Health Perspect 2002, 110, 11–23. [Google Scholar]
- Clarkson, TW; Magos, L. The toxicology of mercury and its chemical compounds. Crit. Rev. Toxicol 2006, 36, 609–662. [Google Scholar]
- Mergler, D; Anderson, AH; Chan, HM; Mahaffey, RK; Murray, M; Sakamoto, M; Stern, HA. Methylmercury exposure and health effects in humans: a worldwide concern. AMBIO 2007, 36, 3–11. [Google Scholar]
- Hunter, D. Diseases of Occupations, 4th ed; Little Brown & Co: London, UK, 1969. [Google Scholar]
- Summary and Conclusions of the Sixty-First Meeting of the Joint FAO/WHO Expert Committee on Food Additives; Joint FAO/WHO Expert Committee on Food Additives: Rome, Italy, 2003.
- Harris, HH; Pickering, IJ; George, GN. The chemical form of mercury in fish. Science 2003, 301, 1203. [Google Scholar]
- Horvat, M; Nolde, N; Fajon, V; Jereb, V; Logar, M; Lojen, S; Jacimovic, R; Falnog, I; Qu, L; Faganeli, J; Drobne, D. Total mercury, methylmercury and selenium in mercury polluted areas in the province Guizhou, China. Sci. Total Environ 2003, 304, 231–256. [Google Scholar]
- Qiu, G; Feng, X; Wang, S; Shang, L. Environmental contamination of mercury from Hg-mining areas in Wuchuan, northeastern Guizhou, China. Environ. Pollut 2006, 142, 549–558. [Google Scholar]
- Feng, X; Li, P; Qiu, GL; Wang, SF; Li, GH; Shang, LH; Meng, B; Jiang, HM; Bai, WY; Li, ZG; Fu, XW. Human exposure to methylmercury through rice intake in mercury mining areas, Guizhou province, China. Environ. Sci. Technol 2008, 42, 326–332. [Google Scholar]
- Li, P; Feng, XB; Qiu, GL; Shang, LH; Wang, SF. Mercury exposure in the population from Wuchuan mercury mining area, Guizhou, China. Sci. Total Environ 2008, 395, 72–79. [Google Scholar]
- Qiu, G; Feng, X; Li, P; Wang, S; Li, G; Shang, L; Fu, X. Methylmercury accumulation in rice (Oryza sativa L) grown at abandoned mercury mines in Guizhou, China. J. Agr. Food Chem 2008, 56, 2465–2468. [Google Scholar]
- Ysart, G; Miller, P; Croasdale, M; Crews, H; Robb, P; Baxter, M; De L’Argy, C; Harrison, N. 1997 UK total diet study-dietary exposures to aluminium, arsenic, cadmium, chromium, copper, lead, mercury, nickel, selenium, tin, and zinc. Food Addit. Contam 2000, 17, 775–786. [Google Scholar]
- Lindberg, A; Bjornberg, KA; Vahter, M; Berglund, M. Exposure to methylmercury in non-fish-eating people in Sweden. Environ. Res 2004, 96, 28–33. [Google Scholar]
- Chapman, L; Chan, HM. The influence of nutrition on methyl mercury intoxication. Environ. Health Perspect 2000, 108, 29–56. [Google Scholar]
- Canuel, R; de Grosbois, SB; Atikesse, L; Lucotte, M; Arp, P; Ritchie, C; Mergler, D; Chan, HM; Amyot, M; Anderson, R. New evidence on variations of human body burden of methylmercury from fish consumption. Environ. Health Perspect 2006, 114, 302–306. [Google Scholar]
- Smith, JC; Allen, PV; Turner, MD; Most, B; Fisher, HL; Hall, LL. The kinetics of intravenously administered methyl mercury in man. Toxicol. Appl. Pharmacol 1994, 128, 251–256. [Google Scholar]
- Smith, JC; Farris, FF. Methyl mercury pharmacokinetics in man: a reevaluation. Toxicol. Appl. Pharmacol 1996, 137, 245–252. [Google Scholar]
- Stern, AH. A revised probabilistic estimate of the maternal methyl mercury intake dose corresponding to a measured cord blood mercury concentration. Environ. Health Perspect 2005, 113, 155–163. [Google Scholar]
- Ballatori, N; Clarkson, TW. Biliary secretion of glutathione and of glutathione-metal complexes. Fundam. Appl. Toxicol 1985, 5, 816–831. [Google Scholar]
- Ballatori, N; Gatmaitan, Z; Truong, AT. Impaired biliary excretion and whole body elimination of methylmercury in rats with congenital defect in biliary glutathione excretion. Hepatology 1995, 22, 1469–1473. [Google Scholar]
- Cernichiari, E; Brewer, R; Myers, GJ; Marsh, DO; Lapham, LW; Cox, C; Shamlaye, CF; Berlin, M; Davidson, PW; Clarkson, TW. Monitoring methylmercury during pregnancy: maternal hair predicts fetal brain exposure. Neurotoxicology 1995, 16, 711–716. [Google Scholar]
- Dolbec, J; Mergler, D; Larribe, F; Roulet, M; Lebel, J; Lucotte, M. Sequential analysis of hair mercury levels in relation to fish diet of an Amazonian population, Brazil. Sci. Total Environ 2001, 27, 87–97. [Google Scholar]
- Berglund, M; Lind, B; Bjornberg, KA; Palm, B; Einarsson, O; Vahter, M. Inter-individual variations of human mercury exposure biomarkers: a cross-sectional assessment. Environ. Health 2005, 4, 20. [Google Scholar]
- Lebel, J; Roulet, M; Mergler, D; Lucotte, M; Larribe, F. Fish diet and mercury exposure in a riparian Amazonian population. Water Air Soil Poll 1997, 97, 31–44. [Google Scholar]
- Morrissette, J; Takser, L; St-Amour, G; Smargiassi, A; Lafond, J; Mergler, D. Temporal variation of blood and hair mercury levels in pregnancy in relation to fish consumption history in a population living along the St. Lawrence River. Environ. Res 2004, 95, 363–374. [Google Scholar]
- Legrand, M; Lam, R; Jensen-Fontaine, M; Salin, ED; Chan, HM. Direct detection of mercury in single human hair strands by laser ablation inductively coupled plasma mass spectrometry (LA-ICP-MS). J. Anal. Atom. Spectrom 2004, 19, 1287–1288. [Google Scholar]
- Legrand, M; Passos, CJ; Mergler, D; Chan, HM. Biomonitoring of mercury exposure with single human hair strand. Environ. Sci. Technol 2005, 39, 4594–4598. [Google Scholar]
- Guallar, E; Sanz-Gallardo, MI; Van’t Veer, P; Bode, P; Aro, A; Gomez-Aracena, J; Kark, JD; Riemersma, RA; Martin-Moreno, J; Kok, F. Mercury fish oils, and the risk of myocardial infarction. N. Engl. J. Med 2002, 347, 1747–1754. [Google Scholar]
- Wickre, JB; Folt, CL; Sturup, S; Karagas, MR. Environmental exposure and fingernail analysis of arsenic and mercury in children and adults in a Nicaraguan gold mining community. Arch. Environ. Health 2004, 59, 400–409. [Google Scholar]
- Harada, M. Minamata disease: methylmercury poisoning in Japan caused by environmental pollution. Crit. Rev. Toxicol 1995, 25, 1–24. [Google Scholar]
- Clarkson, TW; Magos, L; Myers, GJ. The toxicology of mercury-current exposures and clinical manifestations. N. Engl. J. Med 2003, 349, 1731–1737. [Google Scholar]
- Lebel, J; Mergler, D; Lucotte, M; Amorim, M; Dolbec, J; Miranda, D; Arantes, G; Rheault, I; Pichet, P. Evidence of early nervous system dysfunction in Amazonian populations exposed to low-levels of methylmercury. Neurotoxicology 1996, 17, 157–167. [Google Scholar]
- Lebel, J; Mergler, D; Branches, F; Lucotte, M; Amorim, M; Larribe, F; Dolbec, J. Neurotoxic effects of low-level methylmercury contamination in the Amazonian Basin. Environ. Res 1998, 79, 20–32. [Google Scholar]
- Dolbec, J; Mergler, D; Sousa Passos, CJ; Sousa de Morais, S; Lebel, J. Methylmercury exposure affects motor performance of a riverine population of the Tapajos river, Brazilian Amazon. Int. Arch. Occup. Environ. Health 2000, 73, 195–203. [Google Scholar]
- Harada, M. Congenital Minamata disease: intrauterine methylmercury poisoning. Teratology 1978, 18, 285–288. [Google Scholar]
- Marsh, DO; Myers, GJ; Clarkson, TW; Amin-Zaki, L; Tikriti, S; Majeed, MA. Fetal methylmercury poisoning: clinical and toxicological data on 29 cases. Ann. Neurol 1980, 7, 348–353. [Google Scholar]
- Kjellstrom, T; Kennedy, S; Wallis, S; Mantell, C. Physical and Mental Development of Children with Prenatal Exposure to Mercury from Fish, Stage 1: Preliminary Test at Age 4; Report 3080; Natl. Swed. Environ. Protec. Bd.: Solna, Sweden, 1986. [Google Scholar]
- Kjellstrom, T; Kennedy, S; Wallis, S. Physical and Mental Development of Children with Prenatal Exposure to Mercury from Fish, Stage 2: Interviews and Psychological Tests at Age 6; Report 3642; Natl. Swed. Environ. Prot. Bd.: Solna, Sweden, 1989. [Google Scholar]
- Grandjean, P; Weihe, P; White, RF; Debes, F; Araki, S; Yokoyama, K; Murata, K; Sorensen, N; Dahl, R; Jorgensen, PJ. Cognitive deficit in 7-year-old children with prenatal exposure to methylmercury. Neurotoxicol. Teratol 1997, 19, 417–428. [Google Scholar]
- Grandjean, P; Weihe, P; White, RF; Debes, F. Cognitive performance of children prenatally exposed to ‘safe’ levels of methylmercury. Environ. Res 1998, 77, 165–172. [Google Scholar]
- Myers, GJ; Davidson, PW; Cox, C; Shamlaye, C; Palumbo, D; Cernichiari, E; Sloan-Reeves, J; Wilding, GE; Kost, J; Huang, L; Clarkson, TW. Prenatal methylmercury exposure from ocean fish consumption in the Seychelles Child Development Study. Lancet 2003, 361, 1686–1692. [Google Scholar]
- Myers, GJ; Marsh, DO; Cox, C; Davidson, PW; Shamlaye, CF; Tanner, MA; Choi, A; Cernichiari, E; Choisy, O; Clarkson, TW. A pilot neurodevelopmental study of Seychelles children following in utero exposure to methylmercury from a maternal fish diet. Neurotoxicology 1995, 16, 629–638. [Google Scholar]
- Tamashiro, H; Arakaki, M; Futatsuka, M; Lee, ES. Methylmercury exposure and mortality in southern Japan: A close look at causes of death. J. Epidemiol. Commun. H 1986, 40, 181–185. [Google Scholar]
- Chan, HM; Egeland, GM. Fish consumption, mercury exposure, and heart diseases. Nutr. Rev 2004, 62, 68–72. [Google Scholar]
- Stern, AH. A review of the studies of the cardiovascular health effects of methylmercury with consideration of their suitability for risk assessment. Environ. Res 2005, 98, 133–142. [Google Scholar]
- Rissanen, T; Voutilainen, S; Nyyssonen, K; Lakka, TA; Salonen, JT. Fish oil-derived fatty acids, docosahexaenoic acid and docosapentaenoic acid, and the risk of acute coronary events: the Kuopio ischaemic heart disease risk factor study. Circulation 2000, 102, 2677–2679. [Google Scholar]
- Salonen, JT; Seppanen, K; Lakka, TA; Salonen, R; Kaplan, GA. Mercury accumulation and accelerated progression of carotid atherosclerosis: a population-based prospective 4-year follow-up study in men in eastern Finland. Atherosclerosis 2000, 148, 265–273. [Google Scholar]
- Virtanen, JK; Voutilainen, S; Rissanen, TH; Mursu, J; Tuomainen, TP; Korhonen, MJ; Valkonen, VP; Seppanen, K; Laukkanen, JA; Salonen, JT. Mercury fish oils, and risk of acute coronary events and cardiovascular disease, coronary heart disease, and all-cause mortality in men in eastern Finland. Arterioscl. Throm. Vas 2005, 25, 228–233. [Google Scholar]
- Sakamoto, M; Nakano, A; Akagi, H. Declining Minamata male birth ratio associated with increased male fetal death due to heavy methylmercury pollution. Environ. Res 2001, 87, 92–98. [Google Scholar]
- Itai, Y; Fujino, T; Ueno, K; Motomatsu, Y. An epidemiological study of the incidence of abnormal pregnancy in areas heavily contaminated with methylmercury. Environ. Sci 2004, 11, 83–97. [Google Scholar]
- Hultman, P; Hansson-Georgiadis, H. Methyl mercury-induced autoimmunity in mice. Toxicol. Appl. Pharmacol 1999, 154, 203–211. [Google Scholar]
- Haggqvist, B; Havarinasab, S; Bjorn, E; Hultman, P. The immunosuppressive effect of methylmercury does not preclude development of autoimmunity in genetically susceptible mice. Toxicology 2005, 208, 149–164. [Google Scholar]
- Silbergeld, EK; Silva, IA; Nyland, JF. Mercury and autoimmunity: implications for occupational and environmental health. Toxicol. Appl. Pharmacol 2005, 207, 282–292. [Google Scholar]
- Tetens, I; Hels, O; Khan, NL; Thilsted, SH; Hassan, N. Ricebased diets in rural Bangladesh: How do different age and sex groups adapt to seasonal changes in energy intake. Am. J. Clin. Nutr 2003, 78, 406–413. [Google Scholar]
- Hels, O; Hassan, N; Tetens, I; Thilsted, SH. Food consumption, energy, and nutrient intake and nutritional status in rural Bangladesh: Changes from 1981–82 to 1995–96. Eur. J. Clin. Nutr 2003, 57, 586–594. [Google Scholar]
- Environmental Health Criteria 118-Inorganic Mercury; World Health Organization: Geneva, Switzerland, 1991.
- Shi, J; Liang, L; Jiang, G. Simultaneous determination of methylmercury and ethylmercury in rice by capillary gas chromatography coupled on-line with atomic fluorescence spectrometry. J. AOAC Int 2005, 88, 665–669. [Google Scholar]
- Gilmour, CC; Henry, EA. Mercury methylation in aquatic systems affected by acid deposition. Environ. Pollut 1991, 71, 131–169. [Google Scholar]
- Weber, JH. Review of possible paths for abiotic methylation of mercury (II) in the aquatic environment. Chemosphere 1993, 26, 2063–2077. [Google Scholar]
- Porvari, P; Verta, M. Methylmercury production in flooded soils: a laboratory study. Water Air Soil Poll 1995, 80, 765–773. [Google Scholar]
- Streets, D; Hao, J; Wu, Y; Jiang, J; Chan, M; Tian, H; Feng, X. Anthropogenic mercury emissions in China. Atmos. Environ 2005, 39, 7789–7806. [Google Scholar]
- Pacyna, E; Pacyna, J; Steenhuisen, F; Wilson, S. Global anthropogenic mercury emission inventory for 2000. Atmos. Environ 2006, 40, 4048–4063. [Google Scholar]
- Feng, X. Mercury pollution in China-an overview. In Dynamic of Mercury Pollution on Regional and Global Scales: Atmospheric Processes, Human Exposure around the World; Springer: Norwell, MA, USA, 2004; pp. 657–678. [Google Scholar]
- Feng, XB; Dai, QQ; Qiu, GL; Li, GH; He, L; Wang, DY. Gold mining related mercury contamination in Tongguan, Shaanxi Province, PR China. Appl. Geochem 2006, 21, 1955–1968. [Google Scholar]
- Li, P; Feng, X; Qiu, G; Shang, L; Li, Z. Mercury pollution in Asia: a review of the contaminated sites. J. Hazard. Mater 2009, 168, 591–601. [Google Scholar]
- Yan, H; Feng, X; Liu, T; Shang, L; Li, Z; Li, G. Present situation of fish mercury poHufion in heavily mercury-contaminated Baihua reservoir in Guizhou. Chinese J Eco 2008, 27, 1357–1361. [Google Scholar]
- Qiu, G; Feng, X; Wang, S; Fu, X; Shang, L. Mercury distribution and speciation in water and fish from abandoned Hg mines in Wanshan, Guizhou province, China. Sci. Total Environ 2009, 407, 5162–5168. [Google Scholar]
- Lu, Y; Yan, B; Li, H; Wang, M; Guo, L. The evolution rule and ecology risk assessment of mercury in fish of Songhua River. J Agro-Environ Sci 2008, 27, 2430–2433. [Google Scholar]
- Zhang, L; Wang, Q; Shao, Z. Mercury contamination of fish in the Di’er Songhua River of China: the present station and evolution law. Eco Environ 2005, 14, 190–194. [Google Scholar]
- Jin, L; Liang, L; Jiang, G; Xu, Y. Methylmercury, total mercury and total selenium in four common freshwater fish species from Ya-Er Lake, China. Environ. Geochem. Hlth 2006, 28, 401–407. [Google Scholar]
- Sun, J; Chen, C; Li, B; Li, Y; Wang, J; Gao, Y; Chai, Z. Analysis of total mercury and methylmercury concentrations in four commercially important freshwater fish species obtained from Beijing markets. J Hyg Res 2006, 35, 722–725. [Google Scholar]
- Shao, L; Shi, Z; Li, S; Xu, J. Study on methylmercury security in fish on the outskirt of Chengdu. J Anhui Agri Sci 2009, 37, 13649–13652. [Google Scholar]
- Zhang, L. A study on mercury contamination in fish from Qingdao City. Chinese Agr Sci Bull 2009, 25, 293–296. [Google Scholar]
- Jin, L; Xu, X. Methylmercury distribution in surface water and fish in the Three Gorge Reservior area. Resources Environ Yangtze Valley 1997, 16, 324–328. [Google Scholar]
- Cheng, J; Gao, L; Zhao, W; Liu, X; Sakamoto, M; Wang, W. Mercury levels in fisherman and their household members in Zhoushan, China: Impact of public health. Sci. Total Environ 2009, 407, 2625–2630. [Google Scholar]
- Li, S; Zhou, L; Wang, H; Liang, Y; Hu, J; Chang, J. Feeding habits and habitats preferences affecting mercury bioaccumulation in 37 subtropical fish species from Wujiang River, China. Ecotoxicology 2009, 18, 204–210. [Google Scholar]
- Liu, X; Cheng, J; Song, Y; Honda, S; Wang, L; Liu, Z. Mercury concentration in hair samples from Chinese people in coastal cities. J. Environ. Sci. China 2008, 20, 1258–1262. [Google Scholar]
- Li, Z; Wang, Q; Luo, Y. Exposure of the urban population to mercury in Changchun city, Northeast China. Environ. Geochem. Hlth 2006, 28, 61–66. [Google Scholar]
- Zhang, L; Wang, Q. Preliminary study on health risk from mercury exposure to residents of Wujiazhan town on the Di’er Songhua River, Northeast China. Environ. Geochem. Hlth 2006, 28, 67–71. [Google Scholar]
- Crump, KS; Kjellstrom, T; Shipp, AM; Silvers, A; Stewart, A. Influence of prenatal mercury exposure upon scholastic and psychological test performance: benchmark analysis of a New Zealand cohort. Risk Anal 1998, 18, 701–713. [Google Scholar]
- Marsh, DO; Clarkson, TW; Myers, GJ; Davidson, PW; Cox, C; Cernichiare, T; Tanner, MA; Lednar, W; Shamlaye, C; Choisy, O; Hoareau, C; Berlin, M. The Seychelles study of fetal methylmercury exposure and child development: introduction. Neurotoxicology 1995, 16, 583–596. [Google Scholar]
- Passos, C; Mergler, D. Human mercury exposure and adverse health effects in the Amazon: a review. Cad Saude Publica 2008, 24, S503–S520. [Google Scholar]
- Yasutake, A; Matsumoto, M; Yamaguchi, M; Hachiya, N. Current hair mercury levels in Japanese for estimation of methylmercury exposure. J. Health Sci 2004, 50, 120–125. [Google Scholar]
- Gao, Y; Yan, C; Tian, Y; Wang, Y; Xie, H; Zhou, X; Yu, X; Yu, X; Tong, S; Zhou, Q; Shen, X. Prenatal exposure to mercury and neurobehavioral development of neonates in Zhoushan City, China. Environ. Res 2007, 105, 390–399. [Google Scholar]
- Qiu, B; Guan, M; Hu, M; Shi, Y; Shi, L; Zhang, J; Bao, P; Li, Y; Shi, Y. The investigation of mercury content in fishermen’s hair after the pollution control in Songhua River. J Environ Health 1994, 11, 62–64. [Google Scholar]
- Li, P. Biogeochemical Cycle of Mercury and Human Exposure in Typical Artisanal Mercury Mining Areas, Guizhou Province. PhD Thesis, Graduate University of Chinese Academy of Sciences, Beijing, China, 2008; 78–81, (In Chinese with English abstract).
- Rayman, MP. The importance of selenium to human health. Lancet 2000, 356, 233–241. [Google Scholar] [Green Version]
- Magos, L. The absorption, distribution, and excretion of methyl mercury. In The Toxicity of Methyl Mercury; Eccles, U, Annau, Z, Eds.; Johns Hopkins: Baltimore, MD, USA, 1987; pp. 24–44. [Google Scholar]
- Chen, C; Yu, H; Zhao, J; Li, B; Qu, L; Liu, S; Zhang, P; Chai, Z. The roles of serum selenium and selenoproteins on mercury toxicity in environmental and occupational exposure. Environ. Health Perspect 2006, 114, 297–301. [Google Scholar]
- Choi, A; Budtz-Jorgensen, E; Jorgensen, P; Steuerwald, U; Debes, F; Weihe, P; Grandjean, P. Selenium as a potential protective factor against mercury developmental neurotoxicity. Environ. Res 2008, 107, 45–52. [Google Scholar]
- Magos, L. Overview on the protection given by selenium against mercurials. In Advances in Mercury Toxicology; Suzuki, T, Lmura, N, Clarkson, W, Eds.; Plenum Press: New York, NY, USA, 1991; pp. 289–297. [Google Scholar]
- Raymond, L; Ralston, N. Selenium’s importance in regulatory issues regarding mercury. Fuel Process. Technol 2009, 90, 1333–1338. [Google Scholar]
- Selenium—A Report of the International Programme on Chemical Safety; Environmental Health Criteria no 58; World Health Organization: Geneva, Switzerland, 1987.
- Rayman, MP; Infante, GH; Sargent, M. Foodchain selenium and human health: spotlight on speciation. Brit. J. Nutr 2008, 100, 238–253. [Google Scholar]
- Haratake, M; Takahashi, J; Ono, M; Nakayama, M. An assessment of Niboshi (a processed Japanese anchovy) as an effective food source of selenium. J. Health Sci 2007, 53, 457–463. [Google Scholar]
- Pappa, EC; Pappas, AC; Surai, PF. Selenium content in selected foods from the Greek marked and estimation of the daily intake. Sci. Total Environ 2006, 372, 100–108. [Google Scholar]
- McNaughton, SA; Marks, GC. Selenium content of Australian foods: a review of literature values. J. Food Compos. Anal 2002, 15, 169–182. [Google Scholar]
- Nutrient Database for Standard Reference Release 13.
- Choi, Y; Kim, J; Lee, H; Kim, C; Hwang, I; Park, H; Oh, C. Selenium content in representative Korean foods. J. Food Compos. Anal 2009, 22, 117–122. [Google Scholar]
- New Zealand Food Composition Database; New Zealand Institute for Crop and Food Research Limited, Ministry of Health: Christchurch, New Zealand, 2000.
- Lima, A; Sarkis, J; Shihomatsu, H; Muller, R. Mercury and selenium concentrations in fish samples from Cachoeira do Piria Municipality, Para State, Brazil. Environ. Res 2005, 97, 236–244. [Google Scholar]
- Williams, P; Lombi, N; Sun, G; Scheckel, K; Zhu, Y; Feng, X; Zhu, J; Carey, A; Adomako, E; Lawgali, Y; Deacon, C; Meharg, A. Selenium characterization in the global rice supply chain. Environ. Sci. Technol 2009, 43, 6024–6030. [Google Scholar]
- Lv, X; Shi, H; Sun, J; Huang, Y; Lu, G. Study of selenium content in rice in some areas of Jilin Province and its influence on health. China J Ctrl Endem Dis 2008, 23, 429–430. [Google Scholar]
- Chen, L; Yang, F; Zhang, Y; Hu, Q; Pan, G. Selenium analysis of some polished rice in China and effect of biological selenium-enriched fertilizers on level and chemical constitution of selenium in rice grains. Chinese J Rice Sci 2002, 16, 341–345. [Google Scholar]
- Zhen, Y; Cheng, Y; Pan, G; Li, L. Cd, Zn and Se content of the polished rice samples from some Chinese open markets and their relevance to food safety. J Safety Environ 2008, 8, 119–122. [Google Scholar]
- Cheng, Y; Zhen, Y; Pan, G; Li, L. Grain Cd, Zn, Se contents of rice and other cereals sampled in agro-food markets from Nanjing, China. Stu Trace Ele Health 2008, 25, 36–40. [Google Scholar]
- Zhang, L; Li, L; Pan, G. Variation of Cd, Zn, and Se contents of polished rice and the potential health risk for subsistence-diet farmers from typical areas of South China. Environ Sci 2009, 30, 2792–2797. [Google Scholar]
- Yu, G; Wen, Y; He, S; Zhang, L; Dong, H. Food selenium content and resident daily selenium intake in Guangzhou City. Chinese J Appl Eco 2007, 18, 2600–2604. [Google Scholar]
- Zhang, X; Liu, H; Li, J. Selenium content of common food and daily Se intake of resident in Taiyuan. Chinese J Public Health 1992, 11, 29–30. [Google Scholar]
- Tan, J; Zhu, W; Wang, W; Li, R; Hou, S; Wang, D; Yang, L. Selenium in soil and endemic diseases in China. Sci. Total Environ 2002, 284, 227–235. [Google Scholar]
- Zhu, J; Wang, N; Li, S; Li, L; Su, H; Liu, C. Distribution and transport of selenium in Yutangba, China: Impact of human activities. Sci. Total Environ 2008, 392, 251–260. [Google Scholar]
- Yang, G; Wang, S; Zhou, R; Sun, S. Endemic selenium intoxication of human in China. Am. J. Clin. Nutr 1983, 37, 872–881. [Google Scholar]
- Davidson, PW; Myers, GJ; Cox, C; Axtell, C; Shamlaye, C; Sloane-Reeves, J; Cernichiari, E; Needham, L; Choi, A; Wang, Y; Berlin, M; Clarkson, TW. Effects of prenatal and postnatal methylmercury exposure from fish consumption on neurodevelopmental outcomes at 66 months of age in the Seychelles Child Development Study. J. Am. Med. Assoc 1998, 280, 701–707. [Google Scholar]
- Axelrad, DA; Bellinger, DC; Ryan, LM; Woodruff, TJ. Dose-response relationship of prenatal mercury exposure and IQ: an integrative analysis of epidemiologic data. Environ. Health Perspect 2007, 115, 609–615. [Google Scholar]
- Strain, JJ; Davidson, P; Bonham, M; Duffy, E; Stokes-Riner, A; Thurston, S; Wallace, J; Robson, P; Shamlaye, C; Georger, L; Sloane-Reeves, J; Cernichiari, E; Canfield, R; Cox, C; Huang, L; Janciuras, J; Myers, G; Clarkson, T. Associations of maternal long-chain polyunsaturated fatty acids, methyl mercury, and infant development in the Seychelles Child Development Nutrition Study. Neurotoxicology 2008, 29, 776–782. [Google Scholar]
- Ginsberg, G; Toal, B. Quantitative approach for incorporating methylmercury risks and Omega-3 Fatty Acid benefits in developing species-specific fish consumption advice. Environ. Health Perspect 2009, 117, 267–275. [Google Scholar]
- Uauy, R; Hoffman, DR; Mena, P; Llanos, A; Birch, EE. Term infant studies of DHA and ARA supplementation on neurodevelopment: results of randomized controlled trials. J. Pediatr 2003, 143, S17–S25. [Google Scholar]
- Daniels, JL; Longnecker, MP; Rowland, AS; Golding, J. Fish intake during pregnancy and early cognitive development of offspring. Epidemiology 2004, 15, 394–402. [Google Scholar]
- Fleith, M; Clandinin, MT. Dietary PUFA for preterm and term infants: review of clinical studies. Crit. Rev. Food Sci 2005, 45, 205–229. [Google Scholar]
- Oken, E; Wright, RO; Kleinman, KP; Bellinger, D; Amarasiriwardena, CJ; Hu, H; Rich-Edwards, JW; Gillman, MW. Maternal fish consumption, hair mercury and infant cognition in a U.S. cohort. Environ. Health Perspect 2005, 113, 1376–1380. [Google Scholar]
- Oken, E; Radesky, JS; Wright, RO; Bellinger, DC; Amarasiriwardena, CJ; Kleinman, KP; Hu, H; Gillman, MW. Maternal fish intake during pregnancy, blood mercury levels, and child cognition at age 3 years in a US cohort. Am. J. Epidemiol 2008, 167, 1171–1181. [Google Scholar]
- Young, G; Conquer, J. Omega-3 fatty acids and neuropsychiatric disorders. Reprod. Nutr. Dev 2005, 45, 1–28. [Google Scholar]
- Calon, F; Cole, G. Neuroprotective action of omega-3 polyunsaturated fatty acids against neurodegenerative diseases. Evidence from animal studies. Prostaglandins Leukot Essent Fatty Acids 2007, 77, 287–293. [Google Scholar]
- Meyer, B; Mann, N; Lewis, J; Milligan, G; Sinclair, A; Howe, P. Dietary intakes and food sources of omega-6 and omega-3 polyunsaturated fatty acids. Lipids 2003, 38, 391–398. [Google Scholar]
- Sakamoto, M; Kubota, M; Liu, X; Murata, K; Nakai, K; Satoh, H. Maternal and fetal mercury and n-3 polyunsaturated fatty acids as a risk and benefit of fish consumption to fetus. Environ. Sci. Technol 2004, 38, 3860–3863. [Google Scholar]
- Wennberg, M; Bergdahl, AI; Stegmayr, B; Hallmans, G; Lundh, T; Skerfving, S; Stromberg, U; Vessby, B; Jansson, J. Fish intake, mercury, long-chain n-3 polyunsaturated fatty acids and risk of stroke in northern Sweden. Brit. J. Nutr 2007, 98, 1038–1045. [Google Scholar]
- Mahaffey, K; Clickner, R; Jeffries, R. Methylmercury and omega-3 fatty acids: Co-occurrence of dietary sources with emphasis on fish and shellfish. Environ. Res 2008, 107, 20–29. [Google Scholar]
- Tsuchiya, A; Hardy, J; Burbacher, MT; Faustman, ME; Marien, K. Fish intake guidelines: incorporating n-3 fatty acid intake and contaminant exposure in the Korean and Japanese communities. Am. J. Clin. Nutr 2008, 87, 1867–1875. [Google Scholar]
- Adachi, T; Yasutake, A; Hirayama, K. Influence of dietary protein levels on the fate of methylmercury and glutathione metabolism in mice. Toxicology 1992, 72, 17–26. [Google Scholar]
- Adachi, T; Yasutake, A; Hirayama, K. Influence of dietary protein and sulfur amino acids on the fate of methyl mercury in mice. Toxicology 1994, 93, 225–234. [Google Scholar]
- Adachi, T; Yasutake, A; Eto, K; Hirayama, K. Influence of dietary protein levels on the acute toxicity of methylmercury in mice. Toxicology 1996, 112, 11–17. [Google Scholar]
- Adachi, T; Hirayama, K. Dietary protein levels cause different effects of methionine supplement on the fate of methyl mercury in mice. Jpn. J. Toxic Environ. Health 1998, 44, 226–232. [Google Scholar]
- Shoaf, A; Jarmer, S; Harbison, R. Heavy metal inhibition of carnitine acetyltransferase activity in human placental syncytiotrophobast: possible site of action of HgCl2, CH3HgCl, and CdCl2. Teratogenesis Carcinogenesis Mutagenesis 1986, 6, 351–360. [Google Scholar]
- Aschner, M; Clarkson, TW. Mercury 203 distribution in pregnant and nonpregnant rats following systemic infusions with thiol-containing amino acids. Teratology 1987, 36, 321–328. [Google Scholar]
- Aschner, M; Clarkson, TW. Uptake of methylmercury in the rat brain, effects of amino acids. Brain Res 1988, 462, 31–39. [Google Scholar]
- Meydani, M; Meydani, S; Hathcock, J. Effects of dietary methionine, methylmercury, and atrazine on ex vivo synthesis of prostaglandin E1 and thromboxane B2. Prostaglandins Leukotr Med 1984, 14, 267–278. [Google Scholar]
- Wang, JP; Li, YN. Nutrient compositions of 11 kinds of fresh water fish in Zhejiang Province. Acta Nutrimenta Sinica 1997, 19, 477–461. [Google Scholar]
- Wang, R; Sun, WW; Li, P; Xiao, Z; Nie, GX. Analysis and comparison on nutritional compositions of ten species edible fishes in Xinxiang city. J Xinxiang Medical College 2007, 24, 596–598. [Google Scholar]
- Yang, YX; Wang, GY; Pan, XC. China Food Composition, 1st ed; Peking Medical University Press: Beijing, China, 2002; pp. 10–20. (In Chinese). [Google Scholar]
- Grantham-McGregor, S; Ani, C. A review of studies on the effect of iron deficiency on cognitive development in children. J. Nutr 2001, 131, 649S–668S. [Google Scholar]
- Dunstan, JA; Simmer, K; Dixon, G; Prescott, SL. Cognitive assessment at 2(1/2) years following fish oil supplementation in pregnancy: a randomized controlled trial. Arch. Dis. Child Fetal Neonatal Ed 2008, 93, F45–50. [Google Scholar]
- Zeisel, SH; Niculescu, MD. Perinatal choline influences brain structure and function. Nutr. Rev 2006, 64, 197–203. [Google Scholar]
- Budtz-Jorgensen, E; Grandjean, P; Weihe, P. Separation of risks and benefits of seafood intake. Environ. Health Perspect 2007, 115, 323–327. [Google Scholar]
- Cheng, Y; Dibley, MJ; Zhang, X; Zeng, L; Yan, H. Assessment of dietary intake among pregnant women in a rural area of western China. BMC Public Health 2009, 9, 222. [Google Scholar]
- Grandjean, P; Weihe, P; Burse, VW; Needham, LL; Storr-Hansen, E; Heinzow, B; Debes, F; Murata, K; Simonsen, H; Ellefsen, P; Budtz-Jørgensen, E; Keiding, N; White, R. Neurobehavioral deficits associated with PCB in 7-year-old children prenatally exposed to seafood neurotoxicants. Neurotoxicol. Teratol 2001, 23, 305–317. [Google Scholar]
- Budtz-Jorgensen, E; Keiding, N; Grandjean, P; White, RF. Methylmercury neurotoxicity independent of PCB exposure. Environ. Health Perspect 1999, 107, 236–237. [Google Scholar]
- Stewart, PW; Reihman, J; Lonky, EI; Darvill, TJ; Pagano, J. Cognitive development in preschool children prenatally exposed to PCBs and MeHg. Neurotoxicol. Teratol 2003, 25, 11–22. [Google Scholar]
- Fang, J; Wang, KX; Tang, JL; Wang, YM; Ren, SJ; Wu, HY; Wang, J. Copper, lead, zinc, cadmium, mercury, and arsenic in marine products of commerce from Zhejiang coastal area, China, May 1998. Bull. Environ. Contam. Toxicol 2004, 73, 583–590. [Google Scholar]
- Li, P; Feng, XB; Qiu, G; Fu, X; Sakamoto, M; Liu, XJ; Wang, DY. Mercury exposures and symptoms in smelting workers of artisanal mercury mines in Wuchuan, Guizhou, China. Environ. Res 2008, 107, 108–114. [Google Scholar]
- Pamphlett, R; Kum-Jew, S. Mercury vapor uptake into the nervous system of developing mice. Neurotoxicol. Teratol 2001, 23, 191–196. [Google Scholar]
- Takahashi, Y; Tsuruta, S; Hasegawa, J; Kameyama, Y; Yoshida, M. Release of mercury from dental amalgam fillings in pregnant rats and distribution of mercury in maternal and fetal tissues. Toxicology 2001, 163, 115–126. [Google Scholar]
- Takahashi, Y; Tsuruta, S; Arimoto, M; Tanaka, H; Yoshida, M. Placental transfer of mercury in pregnant rats which received dental amalgam restorations. Toxicology 2003, 185, 23–33. [Google Scholar]
- Fredriksson, A; Dencker, L; Archer, T; Danielsson, BR. Prenatal coexposure to metallic mercury vapor and methylmercury produce interactive behavioral changes in adult rats. Neurotoxicol. Teratol 1996, 18, 129–134. [Google Scholar]
- Ishitobi, H; Stern, S; Thurston, WS; Zareba, G; Langdon, M; Gelein, R; Weiss, B. Organic and inorganic mercury in neonatal rat brain after prenatal exposure to methylmercury and mercury vapor. Environ. Health Perspect 2010, 118, 242–248. [Google Scholar]


| Location | MeHg (ng·g−1) | THg (ng·g−1) | MeHg/THg (%) | Daily MeHg intake (μg·g−1·d−1) | Ref. |
|---|---|---|---|---|---|
| Qingzhen Hg polluted area | 0.71–28 | 2.53–33.5 | 28.1–83.7 | 0.005–0.19 | [11] |
| Wanshan Hg mining area | 8.03–144 | 11.1–569 | 5.46–72.6 | 0.05–0.96 | [11] |
| 1.9–27.6 | 4.9–214.7 | 2.4–75.1 | 0.01–0.21 | [13] | |
| 1.61–174 | 10.3–1120 | 1.4–93 | 0.016–1.74 | [15] | |
| Wuchuan Hg mining area | 4.2–18 | 9.1–570 | 2–66 | 0.04–0.18 | [12] |
| 3.1–13.4 | 6.0–113 | 6.0–83.6 | 0.03–0.12 | [14] | |
| Fifteen Chinese provinces | 1.9–10.5 | 6.3–39.3 | 7–44 | 0.02–0.105 | [61] |
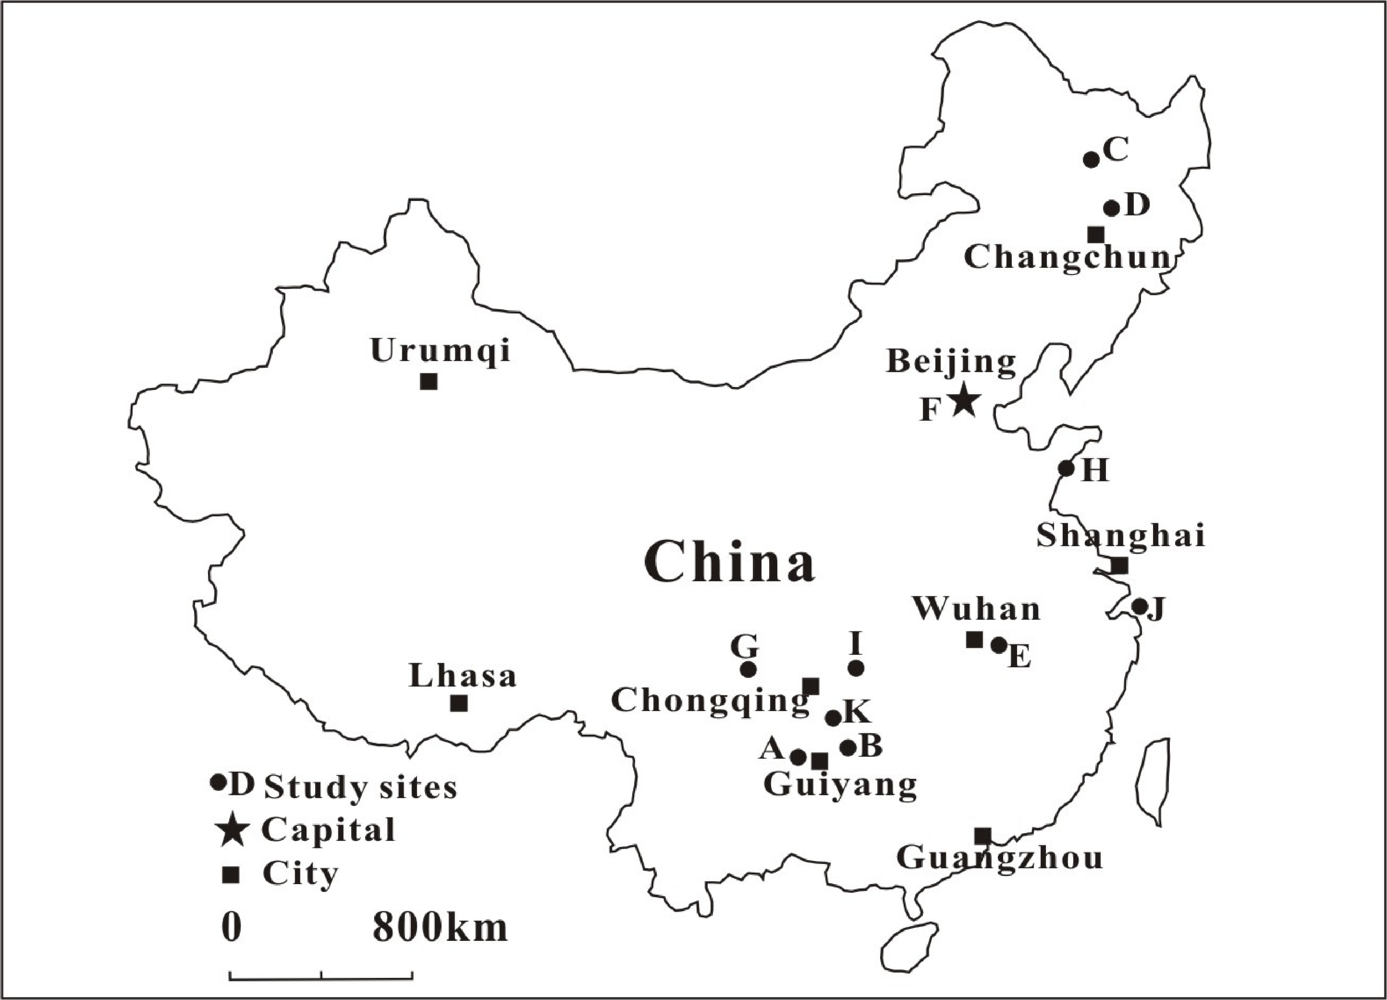
| Site | Location | Functional group | n | MeHg Mean (Range) | Remark | Ref. |
|---|---|---|---|---|---|---|
| A | Baihua Reservoir, Guizhou | 2, 3 | 64 | 0.011 (0.003–0.039) | Historically polluted by chemical plant | [70] |
| B | Wanshan Hg mining area, Guizhou | 3 | 12 | 0.060 (0.024–0.098) | Polluted by Hg mining | [71] |
| C | Songhua River, Northeastern China | 1 | 20 | 0.103–0.295* | Historically polluted by chemical plant | [72] |
| 2 | 89 | 0.088 (0.041–0.126)* | ||||
| 3 | 2 | 0.006* | ||||
| D | Di’er Songhua River, Northeastern China | 1, 2, 3 | 186 | 0.09 (0.002–0.66)* | Historically polluted by chemical plant | [73] |
| E | Ya-Er Lake, Hubei Province | 1, 2 | 40 | 0.18 (0.005–0. 64) | Historically polluted by chlor-alkali plant | [74] |
| F | Beijing | 1, 3 | 32 | 0.0026 (0.0005–0.0084) | Commercial fish in a market | [75] |
| G | Chengdu, Sichuan | 1 | 13 | 0.031 (0–0.117) | Fish collected from pound | [76] |
| 3 | 36 | 0.015 (0.002–0.037) | ||||
| H | Qingdao, Shandong | 1, 2, 3 | 102 | 0.049–0.15* | Commercial freshwater and ocean fish in market | [77] |
| I | The Three Gorges Reservoir | 1, 2 | 32 | 0.07–0.201 | In the middle part of Yangtze River | [78] |
| J | Zhoushan Island | 1, 2, 3 | 148 | 0.18 (0.01–0.59) | Freshwater and ocean fish | [79] |
| K | Wujiang River, Southwestern China | 1, 2 | 228 | 0.063 (?–0.58)* | The largest branch on southern bank of Yangtze River | [80] |
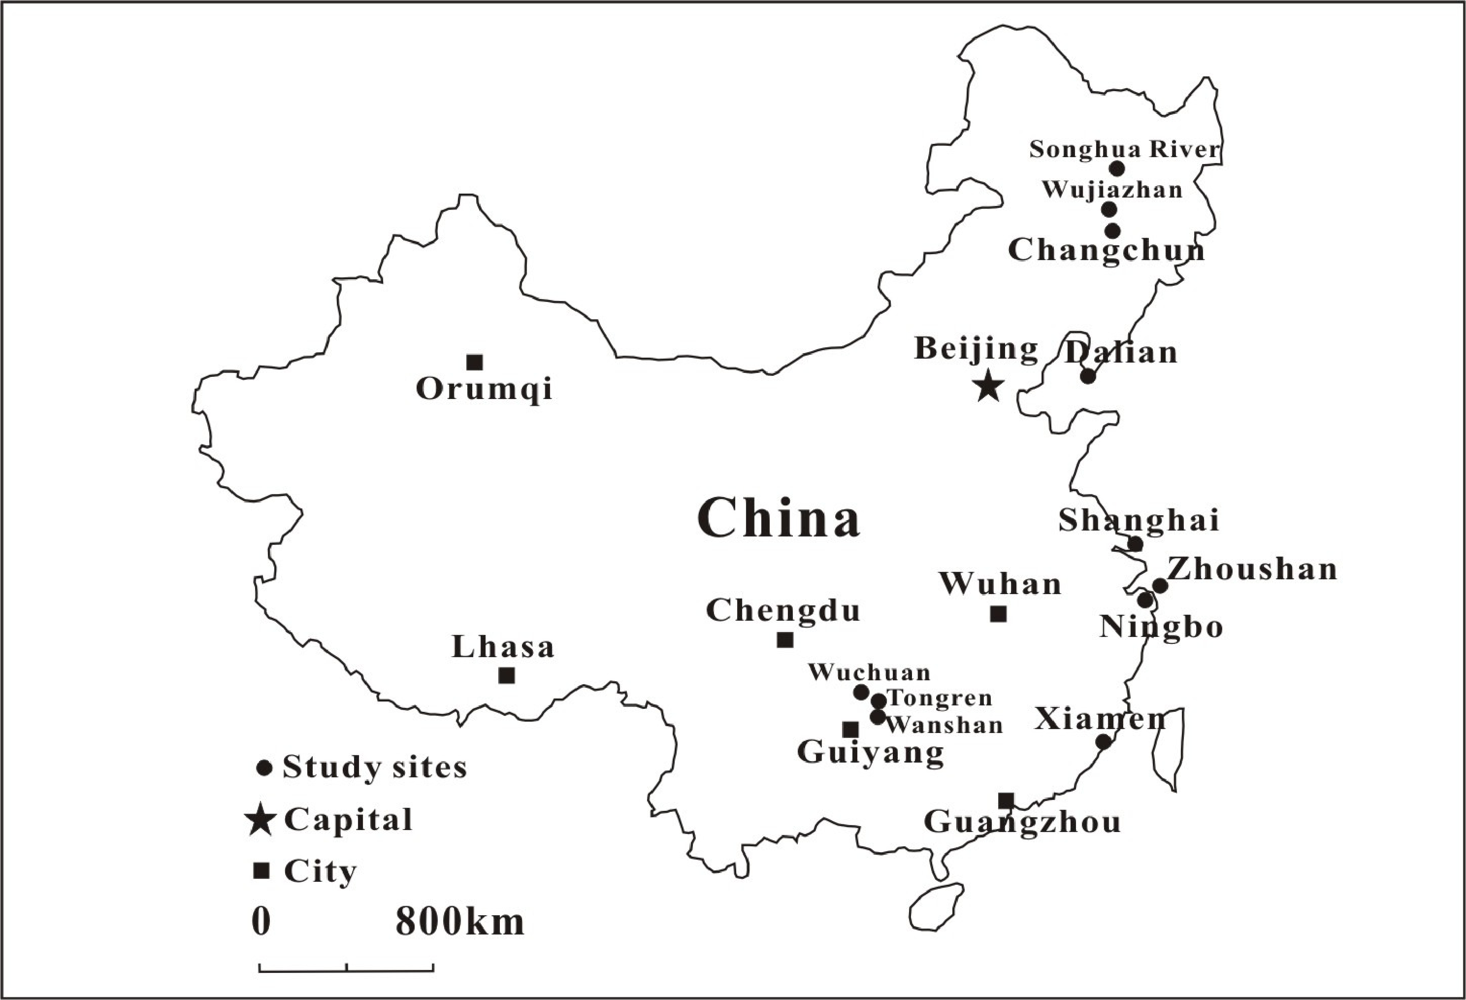
| Location | Subject | Exposure source | Hair Hg level/μg·g−1 Mean (Range) | Ref. |
|---|---|---|---|---|
| New Zealand | Mother-child pairs | Fish | MH 8.3 (6.0–86) | [41,42,84] |
| Faroe Islands | Pregnant women | Pilot whale | MH 4.3 (with a inter-quartile range of 2.6–7.7) | [43,44] |
| Seychelles | Mother-infant pairs | Fish | MH 5.9 (0.5–26.7) | [45,46, 85] |
| Amazon | Indigenous and riparian population | Fish | ≈15 | [86] |
| ≈2–3 | ||||
| Urban residents | ||||
| Nine prefectures in Japan | General population | Fish | Male 2.42 (0.10–29.4) | [87] |
| Female 1.37 (0.02–25.8) | ||||
| Zhoushan Island, China | Pregnant women | Fish | MH 1.25 (0.93–1.68) | [88] |
| General population | Fish | Fathers 3.8 (0.9–9.5)* | [79] | |
| Mothers 1.8 (0.3–4.1)* | ||||
| Children 1.7 (0.6–4.1)* | ||||
| Five coastal cities (Shanghai, Ningbo, Dalian, Xiamen, and Zhoushan) in China | General population | Fish | 0.83 (0.04–8.48) | [81] |
| Changchun, Northeastern China | Urban residents | Fish | 0.448 (0.092–10.5) | [82] |
| Wujiazhan, Di’er Songhua River, Northeast China | Riparian population | Fish | 0.648 (0.16–199) | [83] |
| Songhua River, Northeast China | Fishermen | Fish | 2.25 (0.02–18.1) | [89] |
| Wanshan Hg mining area, China | Local residents | Rice | 2.8 (0.8–5.6)* | [13] |
| 1.3 (0.2–3.6)* | ||||
| 1.5 (0.5–3.5)* | ||||
| Wuchuan Hg mining area,China | Local residents | Rice | 1.38 (0.45–5.89)* | [14] |
| Tongren Hg mining area, China | Local residents | Rice | 4.26 (1.87–10.6)* | [90] |
| 4.55 (2.29–9.55)* |
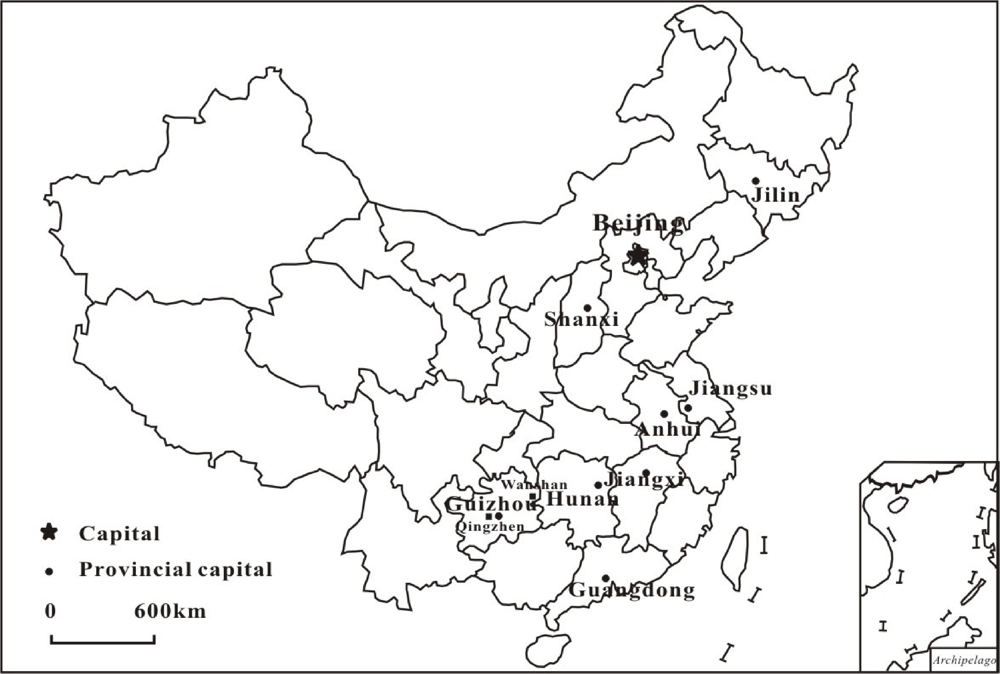
| Location | n | Mean ± S.D. | Range | Ref. |
|---|---|---|---|---|
| Jilin | 70 | 0.008 | [107] | |
| Jiangsu | 52 | 0.035 ± 0.009 | 0.015–0.056 | [108] |
| Eleven Provinces | 30 | 0.025 ± 0.011 | 0.011–0.055 | [108] |
| Whole China | 91 | 0.029 ± 0.019 | 0.004–0.111 | [109] |
| Nanjing, Jiangsu | 34 | 0.039 ± 0.029 | 0.002–0.202 | [110] |
| Jiangxi, Hunan, Anhui, and Guangdong | 70 | 0.028 ± 0.013 | 0.003–0.075 | [111] |
| Guangzhou, Guangdong | 25 | 0.058 ± 0.030 | 0.011–0.125 | [112] |
| Taiyuan, Shanxi | 17 | 0.037 | 0.015–0.062 | [113] |
| Wanshan, Guizhou | 6 | 0.4–1.06 | [11] | |
| Qingzhen, Guizhou | 4 | 0.24–1.01 | [11] | |
| Whole China | 523 | 0.088 | 0.002–1.37 | [106] |
© 2007 by the authors; licensee Molecular Diversity Preservation International, Basel, Switzerland. This article is an open-access article distributed under the terms and conditions of the Creative Commons Attribution license (http://creativecommons.org/licenses/by/3.0/).
Share and Cite
Li, P.; Feng, X.; Qiu, G. Methylmercury Exposure and Health Effects from Rice and Fish Consumption: A Review. Int. J. Environ. Res. Public Health 2010, 7, 2666-2691. https://doi.org/10.3390/ijerph7062666
Li P, Feng X, Qiu G. Methylmercury Exposure and Health Effects from Rice and Fish Consumption: A Review. International Journal of Environmental Research and Public Health. 2010; 7(6):2666-2691. https://doi.org/10.3390/ijerph7062666
Chicago/Turabian StyleLi, Ping, Xinbin Feng, and Guangle Qiu. 2010. "Methylmercury Exposure and Health Effects from Rice and Fish Consumption: A Review" International Journal of Environmental Research and Public Health 7, no. 6: 2666-2691. https://doi.org/10.3390/ijerph7062666
APA StyleLi, P., Feng, X., & Qiu, G. (2010). Methylmercury Exposure and Health Effects from Rice and Fish Consumption: A Review. International Journal of Environmental Research and Public Health, 7(6), 2666-2691. https://doi.org/10.3390/ijerph7062666