Effects of Changed Aircraft Noise Exposure on the Use of Outdoor Recreational Areas

Abstract
:1. Introduction and Review of the Literature
Objectives and Research Questions
Effects of Decreased Noise Exposure
Effects of Increased Noise Exposure
2. Method
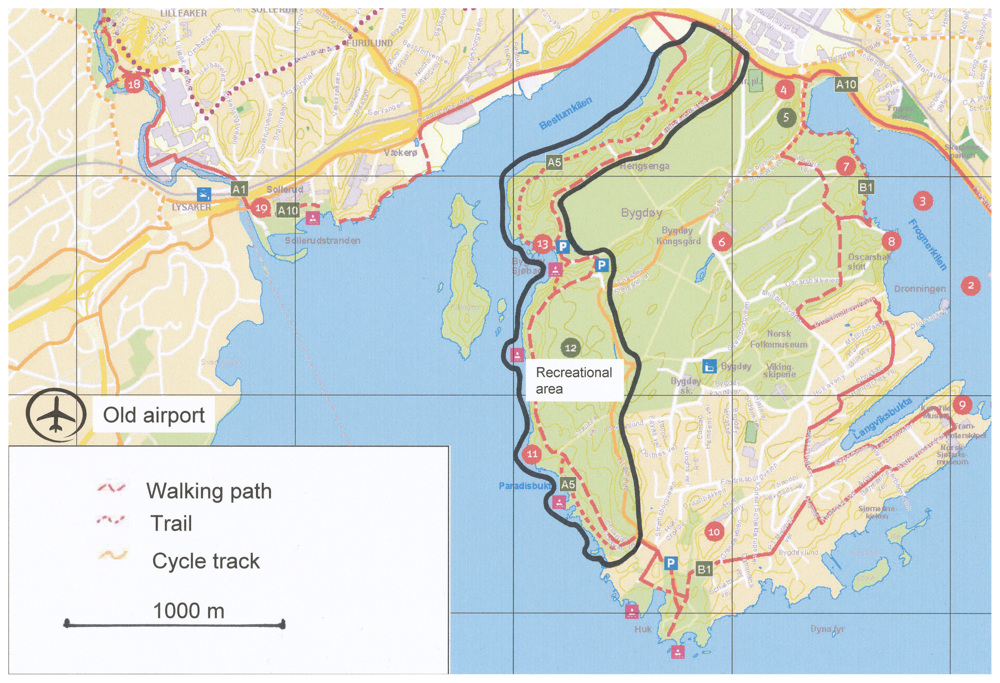
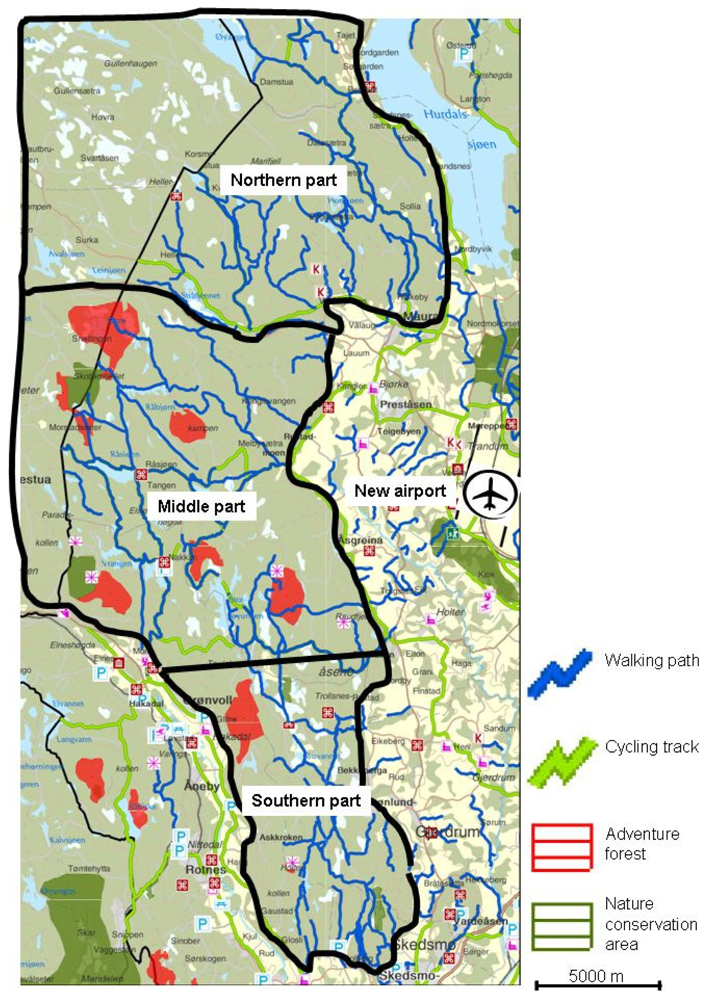
2.1. Study Areas
2.2. Procedure
2.3. Dropouts
2.4. Analyses and Variables
2.4.1. Analyses of Behavioural Responses to Decreased Noise Exposure
2.4.2. Analyses of Behavioural Responses to Increased Noise Exposure
3. Results
3.1. Effects of Decreased Noise Exposure
3.1.1. Changes in Frequency of Use, Visitors at Both t1 and t2
3.1.2. Aircraft Noise as a Reported Reason for Non-Use at t1 and Transition to Use at t2
3.1.3. Aircraft Noise as a Reason for Non-Use at t1, and Frequency of Use among New Visitors at t2
3.2. Effects of Increased Noise Exposure
3.2.1. Changes in Frequency of Use, Visitors at Both t1 and t2
3.2.2. Visitors’ Characteristics and Annoyance with Sound from Aircraft at t1
3.2.3. Visitors’ Characteristics at t1, and the Probability of Becoming a Non-Visitor at t2
3.2.4. Visitors’ Characteristics at t1 and Aircraft Noise as a Reason for Non-Use at t2
4. Discussion
4.1. Summary
4.2. The Use of Panel Data
4.3. Frequency of Use Following Decreased Noise Exposure in the Group Who Visited Both Years
4.4. Aircraft Noise as a Reason for Non-Use at t1 and the Prediction of Use at t2
4.5. Aircraft Noise as a Reason for Non-Use at t1 and Frequency of Use at t2
4.6. Frequency of Use Following Increased Noise Exposure in the Group Who Visited Both Years
4.7. Characteristics of Visitors Predicting Aircraft Noise Annoyance at t1
4.8. Visitor Characteristics at t1 and the Probability of Becoming a Non-Visitor at t2
4.9. Visitor Characteristics at t1 and Aircraft Noise as a Reason for Non-Use at t2
5. Concluding Remarks
Acknowledgements
References
- Driver, BL; Nash, R; Haas, G. Wilderness benefits: A state-of-knowledge review. In USDA Forest Service General Technical Report INT-220, Proceedings: National Wilderness Research Conference: Issues, State of Knowledge, Future Directions, Fort Collins, CO, USA, 23—36 July 1985; Intermountain Research Station USDA Forest Service: Ogden, UT, USA, 1987; pp. 294–319. [Google Scholar]
- Vaagbø, O. Den norske turkulturen: friluftslivets år 1993; FRIFO: Oslo, Norway , 1993. [Google Scholar]
- Vining, J; Fishwick, L. An exploratory study of outdoor recreation site choices. J. Leisure Res 1991, 23, 114–132. [Google Scholar]
- Tarrant, MA; Haas, GE; Manfredo, MJ. Factors affecting visitor evaluations of aircraft overflights of wilderness areas. Soc. Nat. Resour 1995, 8, 351–360. [Google Scholar]
- Fidell, S; Silvati, L; Howe, R; Pearsons, KS; Tabachnick, B; Knopf, RC; Gramann, J; Buchanan, T. Effects of aircraft overflights on wilderness recreationists. J. Acoust. Soc. Am 1996, 100, 2909–2918. [Google Scholar]
- Anderson, GS; Horonjeff, RD; Menge, CW; Miller, NP; Robert, WE; Rossano, C; Sanchez, G; Baumgartner, RM; McDonald, C. Dose-Response Relationships Derived from Data Collected at Grand Canyon, Haleakala and Hawaii Volcanoes National Parks; HMMH Report No. 290940.14, NPOA Report No. 93-6; National Park Service: Denver, CO, USA , 1993. [Google Scholar]
- Fleming, GG; Roof, CJ; Rapoza, AS; Read, DR; Webster, JC; Liebman, PC; Valihura, PJ; Lewis, KC; Schomer, PD; Plante, JA; Draper, JA. Development of Noise Dose/Visitor Response Relationships for the National Parks Overflight Rule: Bryce Canyon National Park Study. In FAA-AEE-98-01/DOT-VNTSC-FAA-98-6; US Department of Transportation, Federal Aviation Administration: Cambridge, MA, USA, 1998. [Google Scholar]
- Miller, NP; Anderson, GS; Horonjeff, RD; Thompson, RH. Mitigating the Effects of Military Aircraft Overflights on Recreational Users of Parks; AFRL-HE-WP-TR-2000-0034; Harris, Miller, Miller and Hanson, Inc: Lexington, MA, USA, 1999. [Google Scholar]
- Krog, NH; Aasvang, GM; Osmundsen, E; Engdahl, B. Effects of noise from military jets on hikers in a recreational area. Proceedings of Internoise, Nice, France, August 2000.
- Krog, NH; Engdahl, B. Annoyance with aircraft noise in local recreational areas, contingent on changes in exposure and other context variables. J. Acoust. Soc. Am 2004, 116, 323–333. [Google Scholar]
- Krog, NH; Engdahl, B. Annoyance with aircraft noise in local recreational areas and the recreationist’ noise situation at home. J. Acoust. Soc. Am 2005, 117, 221–231. [Google Scholar]
- Sutton, ST. Aircraft noise impacts: A case study in the glacier region of the west coast of New Zealand. Noise Control Eng. J 1999, 47, 87–90. [Google Scholar]
- Booth, K; Jones, NC; Devlin, PJ. Measuring the Effects of Aircraft Overflights on Recreationists in Natural Settings; Department of Conservation Technical Series 18; Department of Conservation: Wellington, New Zealand, 1999. [Google Scholar]
- McDonald, CD; Baumgarten, RM; Iachan, R. Aircraft Management Studies: National Park Service Visitors Survey; HMMH Report No. 290940.12; NPOA Report No. 94-2; National Park Service, U.S. Department of the Interior: Burlington, MA, USA, 1995. [Google Scholar]
- Gibbons, S; Ruddell, EJ. The effect of goal orientation and place dependence on select goal interference among winter backcountry users. Leisure Sci 1995, 17, 171–183. [Google Scholar]
- Lucas, RC. Wilderness perception and use—The example of the Boundary Waters Canoe Area. Nat. Resour. J 1964, 3, 394–411. [Google Scholar]
- Shelby, B. Contrasting recreational experiences—Motors and oars in the Grand-Canyon. J. Soil. Water Conserv 1980, 35, 129–131. [Google Scholar]
- Knopp, TB; Tyger, JD. A study of conflict in recreational land use—Snowmobiling vs. ski-touring. J. Leisure Res 1973, 5, 6–17. [Google Scholar]
- Jackson, EL; Wong, RAG. Perceived conflict between urban cross-country skiers and snowmobilers in Alberta. J. Leisure Res 1982, 14, 47–62. [Google Scholar]
- Vittersø, J; Chipeniuk, R; Skar, M; Vistad, OI. Recreational conflict is affective: The case of cross-country skiers and snowmobiles. Leisure Sci 2004, 26, 227–243. [Google Scholar]
- Jackson, EL. Will research on leisure constraints still be relevant in the twenty-first century? J. Leisure Res 2000, 32, 62–68. [Google Scholar]
- Jackson, EL. Leisure constraints/constrained leisure: Special issue introduction. J Leisure Res 1991, 23, 279–285, (also published in Leisure Sci, 1991, 13, 273–278). [Google Scholar]
- Jackson, EL. In the eye of the beholder: A comment on Samdahl & Jekubovich (1997), “A critique of leisure constraints: Comparative analyses and understandings.”. J. Leisure Res 1997, 29, 458–468. [Google Scholar]
- McClaskie, SL; Napier, TL; Christensen, JE. Factors influencing outdoor recreation participation: A state study. J. Leisure Res 1986, 18, 190–205. [Google Scholar]
- Jackson, EL. Recognizing patterns of leisure constraints: Results from alternative analyses. J. Leisure Res 1993, 25, 129–149. [Google Scholar]
- McGuire, FA; Dottavio, D; Oleary, JT. Constraints to participation in outdoor recreation across the life-span—A nationwide study of limitors and prohibitors. Gerontologist 1986, 26, 538–544. [Google Scholar]
- Tierney, PT; Dahl, R; Chavez, D. Cultural diversity in use of undeveloped natural areas by Los Angeles county residents. Tourism Manage 2001, 22, 271–277. [Google Scholar]
- Wright, BA; Goodale, TL. Beyond non-participation: Validation of interest and frequency of participation categories in constraints research. J. Leisure Res 1991, 23, 314–331. [Google Scholar]
- Jackson, EL; Dunn, E. Is constrained leisure an internally homogeneous concept. Leisure Sci 1991, 13, 167–184. [Google Scholar]
- Carroll, B; Alexandris, K. Perception of constraints and strength of motivation: Their relationship to recreational sport participation in Greece. J. Leisure Res 1997, 29, 279–299. [Google Scholar]
- Nadirova, N; Jackson, EL. Alternative criterion variables against which to assess the impacts of constraints to leisure. J. Leisure Res 2000, 32, 396–405. [Google Scholar]
- Jackson, EL. Geographical aspects of constraints on leisure and recreation. Can. Geogr.-Geogr. Can 1994, 38, 110–121. [Google Scholar]
- Alexandris, K; Tsorbatzoudis, C; Grouios, G. Perceived constraints on recreational sport participation: Investigating their relationship with intrinsic motivation, extrinsic motivation and amotivation. J. Leisure Res 2002, 34, 233–252. [Google Scholar]
- Hultsman, W. Recognizing patterns of leisure constraints: An extension of the exploration of dimensionality. J. Leisure Res 1995, 27, 228–244. [Google Scholar]
- Fedler, AJ; Ditton, RB. Dropping out and dropping in: A study of factors for changing recreational fishing participation. N. Am. J. Fish. Manage 2001, 21, 283–292. [Google Scholar]
- Bialeschki, MD; Henderson, KA. Constraints to trail use. J. Park Recreat. Admi 1988, 6, 20–28. [Google Scholar]
- Anderson, DH; Brown, PJ. The displacement process in recreation. J. Leisure Res 1984, 16, 61–73. [Google Scholar]
- Hall, T; Shelby, B. Temporal and spatial displacement: Evidence from a high-use reservoir and alternate sites. J. Leisure Res 2000, 32, 435–456. [Google Scholar]
- Shelby, B; Vaske, JJ. Resource and activity substitutes for recreational salmon fishing in New-Zealand. Leisure Sci 1991, 13, 21–32. [Google Scholar]
- Brunson, MW; Shelby, B. Recreation substitutability—A research agenda. Leisure Sci 1993, 15, 67–74. [Google Scholar]
- Kuentzel, WF; Heberlein, TA. More visitors, less crowding: Change and stability of norms over time at the Apostle Islands. J. Leisure Res 2003, 35, 349–371. [Google Scholar]
- Johnson, AK; Dawson, CP. An exploratory study of the complexities of coping behavior in Adirondack wilderness. Leisure Sci 2004, 26, 281–293. [Google Scholar]
- Becker, RH. Displacement of recreational users between the lower St Croix and upper Mississippi Rivers. J. Environ. Manage 1981, 13, 259–267. [Google Scholar]
- Vaske, J; Donnelly, MP; Heberlein, TA. Perception of crowding and resource quality by early and more recent visitors. Leisure Sci 1980, 3, 367–381. [Google Scholar]
- Miller, TA; McCool, SF. Coping with stress in outdoor recreational settings: An application of transactional stress theory. Leisure Sci 2003, 25, 257–275. [Google Scholar]
- Manning, RE; Valliere, WA. Coping in outdoor recreation: Causes and consequences of crowding and conflict among community residents. J. Leisure Res 2001, 33, 410–426. [Google Scholar]
- Shindler, B; Shelby, B. Product shift in recreation settings: Findings and implications from panel research. Leisure Sci 1995, 17, 91–107. [Google Scholar]
- Vorkinn, M. Visitor response to management regulations—A study among recreationists in Southern Norway. Environ. Manage 1998, 22, 737–746. [Google Scholar]
- Kuentzel, WF; Heberlein, TA. Cognitive and behavioral adaptations to perceived crowding: A panel study of coping and displacement. J. Leisure Res 1992, 24, 377–393. [Google Scholar]
- Shelby, B; Bregenzer, NS; Johnson, R. Displacement and product shift: Empirical evidence from Oregon rivers. J. Leisure Res 1988, 20, 274–288. [Google Scholar]
- Robertson, RA; Regula, JA. Recreational displacement and overall satisfaction: A study of Central Iowa’s licensed boaters. J. Leisure Res 1994, 26, 174–181. [Google Scholar]
- Aasvang, GM; Engdahl, B. Subjective responses to aircraft noise in an outdoor recreational setting: A combined field and laboratory study. J. Sound. Vib 2004, 76, 981–996. [Google Scholar]
- Krog, NH; Engdahl, B; Tambs, K. Effects of changed noise exposure on experiential qualities of outdoor recreational areas. Int. J. Environ. Res. Public Health 2010, 7, 3739–3759. [Google Scholar]
- Engdahl, B. Flystøy i rekreasjonsområdet på Bygdøy og Romeriksåsen. Analyse av lydopptak i forbindelse med en feltundersøkelse om effekt av flystøy i rekreasjons—og friluftsområder; Report No. 2; Norwegian Institute of Public Health: Oslo, Norway, 2001. [Google Scholar]
- Oslo kommune Friluftsetaten. Turkart Oslo vest. Available online: http://www.friluftsetaten.oslo.kommune.no/kart/byen/turkart/turkart_oslo_vest/ (accessed on 27 October 2010).
- Akershus fylkeskommune. Turkart Akershus. Available online: http://kartinakershus.akershus-fk.no/Turkart/ accessed on 27 October 2010.
- Jackson, EL; Scott, D. Jackson, EL, Burton, TL, Eds.; Constraints to leisure. In Leisure Studies Prospects for the Twenty-First Century; Venture Publishing: State College, PA, USA, 1999; pp. 299–321. [Google Scholar]
- Altman, DG. Practical Statistics for Medical Research; Chapman & Hall: London, UK, 1997. [Google Scholar]
- Kariel, HG. Factors affecting response to noise in outdoor recreational environments. Geographica 1990, 34, 142–149. [Google Scholar]
- Williams, DR; Patterson, ME; Roggenbuck, JW; Watson, AE. Beyond the commodity metaphor—Examining emotional and symbolic attachment to place. Leisure Sci 1992, 14, 29–46. [Google Scholar]
- Moore, RL; Graefe, AR. Attachments to recreation settings—The case of rail-trail users. Leisure Sci 1994, 16, 17–31. [Google Scholar]
- Vorkinn, M; Riese, H. Environmental concern in a local context—The significance of place attachment. Environ. Behav 2001, 33, 249–263. [Google Scholar]
- Williams, DR; Vaske, JJ. The measurement of place attachment: Validity and generalizability of a psychometric approach. Forest Sci 2003, 49, 830–840. [Google Scholar]
- Moore, RL; Scott, D. Place attachment and context: Comparing a park and a trail within. Forest Sci 2003, 49, 877–884. [Google Scholar]
- Kyle, G; Graefe, A; Manning, R; Bacon, J. Predictors of behavioral loyalty among hikers along the Appalachian Trail. Leisure Sci 2004, 26, 99–118. [Google Scholar]
- Ryan, RL. Exploring the effects of environmental experience on attachment to urban natural areas. Environ. Behav 2005, 37, 3–42. [Google Scholar]


| Bygdøy | Romeriksåsen | |||||||
|---|---|---|---|---|---|---|---|---|
| Visitors t1 | Non-visitors t1 | Visitors t1 | Non-visitors t1 | |||||
| 1,600 | 700 | 1,620 | 700 | |||||
| Vis. t2 1 | Non-vis. t2 | Vis. t2 | Non-vis. t2 | Vis. t2 | Non-vis. t2 | Vis. t2 | Non-vis. t2 | |
| 591 | 309 | 69 | 295 | 641 | 330 | 86 | 313 | |
| Sum t2 | 900 | 364 | 971 | 399 | ||||
Dropouts: | ||||||||
| Refused t12 | 216 | 145 | 85 | 73 | ||||
| Lost t23 | 434 | 157 | 483 | 167 | ||||
| Refused t24 | 50 | 34 | 81 | 61 | ||||
| Variables in the model | OR 2 | 95% CI 3 for OR |
|---|---|---|
| Too much aircraft noise | 1.584 | 0.704–3.565 |
| Prefer other areas | 0.731 | 0.408–1.312 |
| Personal reasons | 1.257 | 0.690–2.290 |
| Activity/area relevance | 0.980 | 0.540–1.776 |
| Area quality | 1.035 | 0.789–1.357 |
| Earlier experience with the area | 3.620** | 1.491–8.792 |
| Model (adj. R2 = 0.126) | Unst.B 2 | SE 3 | Beta 4 | t 5 |
|---|---|---|---|---|
| Constant | 0.988 | 0.350 | 2.83 | |
| Too much aircraft noise | 0.704 | 0.219 | 0.400* | 3.22 |
| Prefer other areas | −0.133 | 0.159 | −0.101 | −0.83 |
| Personal reasons | −0.006 | 0.172 | −0.004 | −0.03 |
| Activity/area relevance | −0.040 | 0.167 | −0.028 | −0.24 |
| Area quality | −0.122 | 0.079 | −0.190 | −1.54 |
| Earlier experience with the area | 0.457 | 0.262 | −0.200 | 1.74 |
| Model (adj. R2 = 0.039) | Romeriksåsen t1 (n = 971) | ||||
|---|---|---|---|---|---|
| Unst. B 2 | SE 3 | Beta 4 | t | ||
| Constant | 1.289 | 0.114 | 11.36 | ||
| Activities | Hunting or fishing | 0.201 | 0.074 | 0.109** | 2.71 |
| Bicycle riding | 0.126 | 0.061 | 0.068* | 2.05 | |
| Picking berries or mushrooms | 0.079 | 0.060 | 0.044 | 1.32 | |
| Hiking | 0.115 | 0.087 | 0.044 | 1.32 | |
| Bathing, sunbathing | 0.075 | 0.061 | 0.042 | 1.23 | |
| Running, jogging | 0.022 | 0.073 | 0.010 | 0.31 | |
| Picnic | −0.007 | 0.061 | −0.004 | −0.11 | |
| Other activities | 0.010 | 0.068 | 0.005 | 0.14 | |
| Reasons for Participation | The nature experience | 0.027 | 0.008 | 0.117*** | 3.54 |
| Excitement and mastering | −0.002 | 0.021 | −0.003 | −0.08 | |
| Fitness | −0.021 | 0.018 | −0.039 | −1.13 | |
| Be together with others | −0.025 | 0.018 | −0.045 | −1.38 | |
| Other variables | Frequency of use | 0.013 | 0.032 | 0.014 | 0.41 |
| Visited only the middle part | −0.079 | 0.068 | −0.043 | −1.16 | |
| Visited several parts | −0.168 | 0.084 | −0.070* | −2.00 | |
| Visited only the northern part | −0.268 | 0.093 | −0.101** | −2.88 | |
| Variables in the model | OR 2 | 95% CI 3 for OR | |
|---|---|---|---|
| Activities | Hunting or fishing | 1.007 | 0.687–1.475 |
| Bicycle riding | 0.786 | 0.569–1.086 | |
| Picking berries or mushrooms | 0.619** | 0.459–0.835 | |
| Hiking | 1.477 | 0.940–2.321 | |
| Bathing, sunbathing | 1.101 | 0.802–1.512 | |
| Running, jogging | 0.664* | 0.445–0.989 | |
| Picnic | 0.805 | 0.588–1.102 | |
| Other activities | 0.933 | 0.653–1.335 | |
| Reasons for participation | The nature experience | 0.973 | 0.936–1.012 |
| Excitement and mastering | 1.019 | 0.914–1.136 | |
| Fitness | 1.009 | 0.920–1.108 | |
| Be together with others | 1.042 | 0.951–1.143 | |
| Other variables | Frequency of use | 0.657*** | 0.556–0.777 |
| Visited only the middle part | 0.957 | 0.675–1.355 | |
| Visited several parts | 1.028 | 0.667–1.583 | |
| Visited only the northern part | 1.505 | 0.948–2.389 | |
| Variables in the model | OR 2 | 95% CI 3 for OR | |
|---|---|---|---|
| Activities | Hunting or fishing | 1.188 | 0.467–3.025 |
| Bicycle riding | 0.236** | 0.080–0.696 | |
| Picking berries or mushrooms | 0.964 | 0.471–1.973 | |
| Hiking | 1.076 | 0.329–3.519 | |
| Bathing, sunbathing | 1.210 | 0.564–2.598 | |
| Running, jogging | 1.553 | 0.542–4.445 | |
| Picnic | 0.647 | 0.283–1.475 | |
| Other activities | 1.455 | 0.593–3.569 | |
| Reasons for Participation | The nature experience | 1.171** | 1.051–1.305 |
| Excitement and mastering | 0.855 | 0.659–1.109 | |
| Fitness | 0.987 | 0.795–1.226 | |
| Be together with others | 0.983 | 0.781–1.238 | |
| Other variables | Frequency of use | 1.476* | 1.001–2.176 |
| Visited only the middle part | 0.689 | 0.282–1.686 | |
| Visited several parts | 0.506 | 0.151–1.691 | |
| Visited only the northern part | 2.522* | 1.035–6.149 | |
© 2010 by the authors; licensee Molecular Diversity Preservation International, Basel, Switzerland. This article is an open-access article distributed under the terms and conditions of the Creative Commons Attribution license (http://creativecommons.org/licenses/by/3.0/).
Share and Cite
Krog, N.H.; Engdahl, B.; Tambs, K. Effects of Changed Aircraft Noise Exposure on the Use of Outdoor Recreational Areas. Int. J. Environ. Res. Public Health 2010, 7, 3890-3915. https://doi.org/10.3390/ijerph7113890
Krog NH, Engdahl B, Tambs K. Effects of Changed Aircraft Noise Exposure on the Use of Outdoor Recreational Areas. International Journal of Environmental Research and Public Health. 2010; 7(11):3890-3915. https://doi.org/10.3390/ijerph7113890
Chicago/Turabian StyleKrog, Norun Hjertager, Bo Engdahl, and Kristian Tambs. 2010. "Effects of Changed Aircraft Noise Exposure on the Use of Outdoor Recreational Areas" International Journal of Environmental Research and Public Health 7, no. 11: 3890-3915. https://doi.org/10.3390/ijerph7113890