Article

Mapping Cigarettes Similarities using Cluster Analysis Methods

1
“Iuliu Hatieganu” University of Medicine and Pharmacy Cluj-Napoca, 6 Louis Pasteur, 400349 Cluj-Napoca, Romania
2
Technical University of Cluj-Napoca, 103-104 Muncii Bdv, 400641 Cluj-Napoca, Romania
*
Author to whom correspondence should be addressed.
Int. J. Environ. Res. Public Health 2007, 4(3), 233-242; https://doi.org/10.3390/ijerph2007030007
Submission received: 18 June 2007 / Accepted: 28 August 2007 / Published: 30 September 2007

Abstract

:
The aim of the research was to investigate the relationship and/or occurrences in and between chemical composition information (tar, nicotine, carbon monoxide), market information (brand, manufacturer, price), and public health information (class, health warning) as well as clustering of a sample of cigarette data. A number of thirty cigarette brands have been analyzed. Six categorical (cigarette brand, manufacturer, health warnings, class) and four continuous (tar, nicotine, carbon monoxide concentrations and package price) variables were collected for investigation of chemical composition, market information and public health information. Multiple linear regression and two clusterization techniques have been applied. The study revealed interesting remarks. The carbon monoxide concentration proved to be linked with tar and nicotine concentration. The applied clusterization methods identified groups of cigarette brands that shown similar characteristics. The tar and carbon monoxide concentrations were the main criteria used in clusterization. An analysis of a largest sample could reveal more relevant and useful information regarding the similarities between cigarette brands.

Introduction

Global consumption of cigarettes has been rising from the beginning of the 20th century. China, United States of America, Japan, Russia, and Indonesia are the top five countries on cigarette consumption [1]. The smoking prevalence in Romanian adults was of 21.4% (33.2% for male and 10.3% for female) between 2002 and 2005 [2]. In 2004, Romania was on the top three worldwide cigarette consumptions [3].
The compounds of the cigarette smoke and the effect of smoking are well known today. The cigarette smoke contains a number of four thousand compounds with different actions on human body [4, 5]. Today it was recognized that tobacco smoking is the major etiologic factor associated with cancer (lung cancer [6, 7], pancreatic cancer [8], gastric cancer [9], oral cancer [10], renal cancer [11], and breast cancer [12]). It is also known that the main addictive component, nicotine, is not a carcinogenic by itself [13].
Some counties introduced regulations on cigarette tar, nicotine and carbon monoxide in order to reduce the effect of these substances on human body. In the United States of America for example, the Federal Trade Commission has published standardized tar and nicotine ratings since 1967. The carbon monoxide rating has been introduced since 1980 for all cigarettes sell on American marked [14, 15].
In Romania, the cigarette market suffered some changes since 1st January 2007, when Romania becomes a European Union state, and some regulations entered into force. The tar, nicotine and carbon monoxide concentrations are printed on cigarettes packs as the World Health Organization Framework Convention on Tobacco Control recommended [16] and the Romanian laws and regulations [1719] imposed. The maximum concentration of tar (10 mg/cig), nicotine (1 mg/cig) and carbon monoxide (10 mg/cig) of the cigarettes sell or fabricated in Romania are also regulated through a number of laws [1719]. The health warnings and explanatory health messages could be found on the front and back sides of cigarette packs according with Romanian regulations [17, 20]. The advertising of tobacco products in cinema halls and of selling tobacco products to minors [2123] is under interdiction in Romania. Smoking in closed public places, educational and medical establishments [17, 18, 22, 23] is prohibiting in Romania.
Regarding the public information of smoking effects, two types of warning messages are imposed: general (“Smoking kills” with two variants: “Smoking can kill” – abbreviated as HW1 and “Smoking harms yourself and people around you” – abbreviated as HW2) and additional or explanatory health messages. The additional explanatory health message could be one of the following:
  • “Smokers died younger” – abbreviated as EHM01
  • “Smoking blocks blood circulation in arteries, induce heart and stroke attacks” – EHM02
  • “Smoking cause fatal lung cancer” – EHM03
  • “Smoking when pregnant harms your baby” – EHM04
  • “Protect children: don’t let them breathe your smoke” – EHM05
  • “Your physician or pharmacist can help you to quit smoking” – EHM06
  • “Cigarettes are addictive. Do not start to smoke!” – EHM07
  • “Quitting smoking decrease the risk of cardiac and lung fatal diseases” – EHM08
  • “Smoking can cause a painful and fatal dead” – EHM09
  • “For smoking cessation consult your physician or pharmacist” – EHM10
  • “Smoking slow down blood circulation and induce impotence” – EHM11
  • “Smoking induce skin aging” – EHM12
  • “Smoking can decrease sperm quality and fertility” – EHM13
  • “Cigarette smoke contains benzene, nitrosamines, formaldehyde and cyanides” – EHM14
The aim of the study was to investigate the relationship between chemical composition information (tar, nicotine, carbon monoxide), market information (brand, manufacturer, price), and public health information (class, health warning) by using multivariate and clustering techniques.

Material and Method

The material of the present research was represented by a sample of cigarette. The inclusion of the cigarette in the sample was performed based of the following inclusion criteria: filtered cigarettes; tar concentration printed on the packet; nicotine concentration printed on the packet; health warnings and explanatory health messages printed on the front and the back of the cigarette packet. A supermarket from Cluj-Napoca was chosen randomly from the total number of supermarkets and all cigarettes which accomplished the inclusion criteria were bought. The following quantitative and qualitative variables were collected: cigarette brand, manufacturer, price, (as market information); tar, nicotine concentration, and carbon monoxide concentration (as cigarette chemical composition); class, health warning, and explanatory health messages (as public health information).
The cigarettes were classified by applying the order no. 919/1997 specification. Based on the sugars, polyphones, tar (mg/cigarette) concentrations, free burning speed (mm/minute), cigarette length (mm), and filter length (mm) three classes of cigarettes were defined: superior, medium, and inferior [24].
Thirty cigarette packs manufactured by four manufacturers, British American Tobacco (BAT) - on Romanian market since 1997 [25], Philip Morris (PM) - on Romanian market since 2001 [26], Japan Tobacco (JT) - on Romanian market since 1995 [27], and Continental Tobacco [28], were included into analysis. The characteristics of the studied cigarette are presented in Table 1.
The relationship between chemical composition information (tar, nicotine, carbon monoxide) has been investigated by using multiple linear regression technique. Two-steps clustering and hierarchical cluster analysis techniques were used in characterization of market and public health information, as well as in clusterization of the entire collected data. The data were analyzed and summarized using SPSS 12.0 software. The confidence intervals at a significance level of 5% associated with the binomial distributed frequencies were calculated using dedicated software [29].

Results

Cigarettes Chemical Composition

The composition of tar, nicotine and carbon monoxide were investigated and descriptive characteristics are presented in Table 2.
A multivariate regression analysis has been performed in order to identify and to quantify the link between carbon monoxide as independent variable, and tar and nicotine as dependent variables. The regression analysis was applied on 29 sample data (the carbon monoxide information was not specified on pack no. 16 – Table 1). The following equation with associated statistics has been obtained:
[ CO ] mg = 1.78 + 1.08 * [ Tar ] mg 3.06 * [ Nicotine ] mg r = 0.9594 ; r 2 = 0.9205 ; r 2 adj = 0.9144 ; s = 0.68 ; n = 29 ; F = 150 ( p = 5.06 10 15 )
where,
  • [CO]mg = carbon monoxide concentration (mg); [Tar]mg = tar concentration (mg), [Nicotine]mg = nicotine concentration (mg),
  • r = correlation coefficient, r2 = determination coefficient; r2adj = adjusted correlation coefficient, s = standard error of estimate; n = sample size; F = Fisher parameter (significance).
Statistical parameters of the model presented in Eq.1 are presented in Table 3.
Based on the model from Eq.1 the carbon monoxide concentration for pack no. 16 has been estimated.
The given (as were printed on the packs) and expected values (as it resulted from regression model based on Eq.1), as well as the estimated value for omitted data (pack no. 16) are presented in Table 4. Averaging the last column of the table, the estimation error in terms of truncated values of 0.38 is obtained.
Based on the experience learned from Table 4, the carbon monoxide concentration was expressed in terms of a confidence interval (see Table 5). The probability was calculated as a continuous uniform variable between lowest and highest values.

Market Information

The studied cigarettes were produced by four manufacturers. The absolute and relative frequency of cigarette manufacturer and the 95% confidence interval associated to relative frequency are presented in Table 6.
The distributions of the generic brand of studied cigarette were: Pall Mall and Dunhill (4 packets, 95%CI [19]); Viceroy and Kent (3 packets, 95%CI [18]); Marlboro, Chesterfield, and Camel (2 packets), and Winchester, Vogue, Virginia, Rothmans, Parliament, Pannonia, MonteCarlo, Lucky Strike, LM, and Assos (1 packet). A statistical significant correlation has been identified between manufacturer and generic brand of the studied cigarettes (rSpearman = 0.8961, p < 0.05).
The cigarette price varied from 2.25 RON (Pannonia) to 5.77 RON (Virginia) with an average of 5.02 (standard deviation of 0.74) for the entire sample. The mean of price for the cigarette produced by BAT was statistical significant higher comparing with the mean price of the cigarette produced by JT (mBAT = 5.23, nBAT = 17, StdDevBAT = 0.5; mJT = 4.64, nJT = 4, StdDevJT = 0.47; t = 2.14, p = 0.04 – m = mean, StdDev = standard deviation).
The two-steps cluster technique has been applied on market information. Two clusters were identified. The manufacturer variable was the criteria used in clusterization: the first cluster comprised all cigarettes produces by British American Tobacco (seventeen), the second cluster comprised all cigarettes produced by Philip Morris (eight), Japan Tobacco (four), and Continental Tobacco (one). The price centroids on each cluster where as followed:
  • mean = 5.23 and standard deviation = 0.50 (first cluster)
  • mean = 4.74 and standard deviation = 0.92 (second cluster).
The manufacturer variable had a significant statistic cluster wise importance.

Public Health Information

Almost seventy-seven percent of studied cigarettes (twenty-three out of thirty, 95%CI [1727]) were classified as superior according with the quality, while twenty-three percent where classified as medium (seven brand, 95%CI [313]).
The distribution of the health warnings and explanatory health messages found on the studied cigarettes are presented in Table 7.
In order to identify the link between public health information variables the Spearman correlation coefficient was applied. A good correlation (r = 0.6042, p < 0.05) was obtained between class and explanatory health messages EHM13 (three cigarettes classified as medium class had this message printed on the pack, all being produced by BAT). No other significant correlations between public health information were obtained (r < 0.5, p > 0.05).

Two-Step Cluster Technique: Overall Analysis

All cigarette brands were valid for cluster analysis (the carbon monoxide concentration for Viceroy Ultra Light – BAT, see Table 1 was estimated based on Eq.1). One cluster has been identified. The centroids characteristics of the cluster are presented in Table 8. Note that there was not identified any categorical or continuous variable which to had statistical significant importance into clusterization.

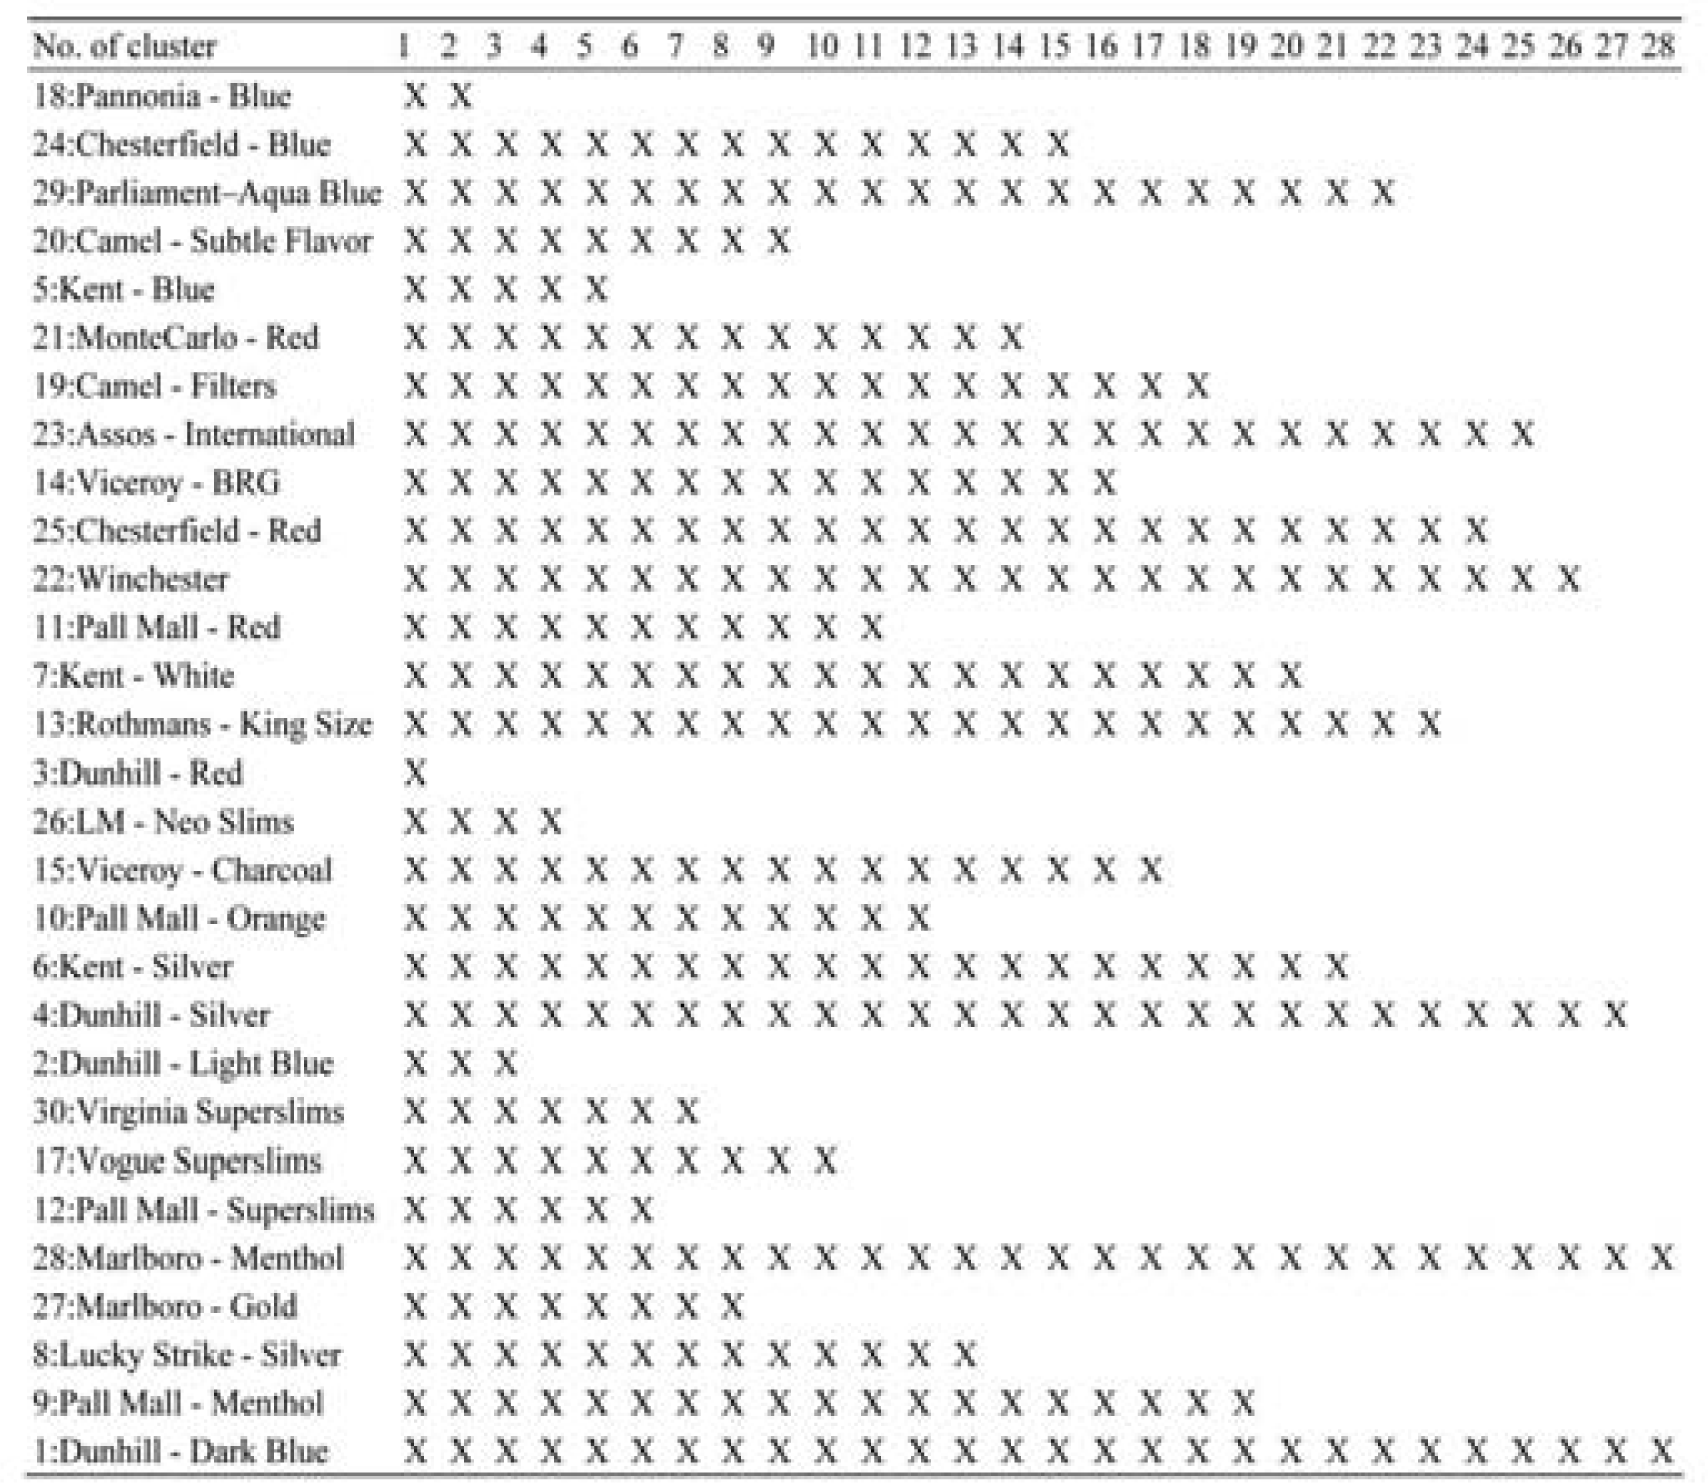
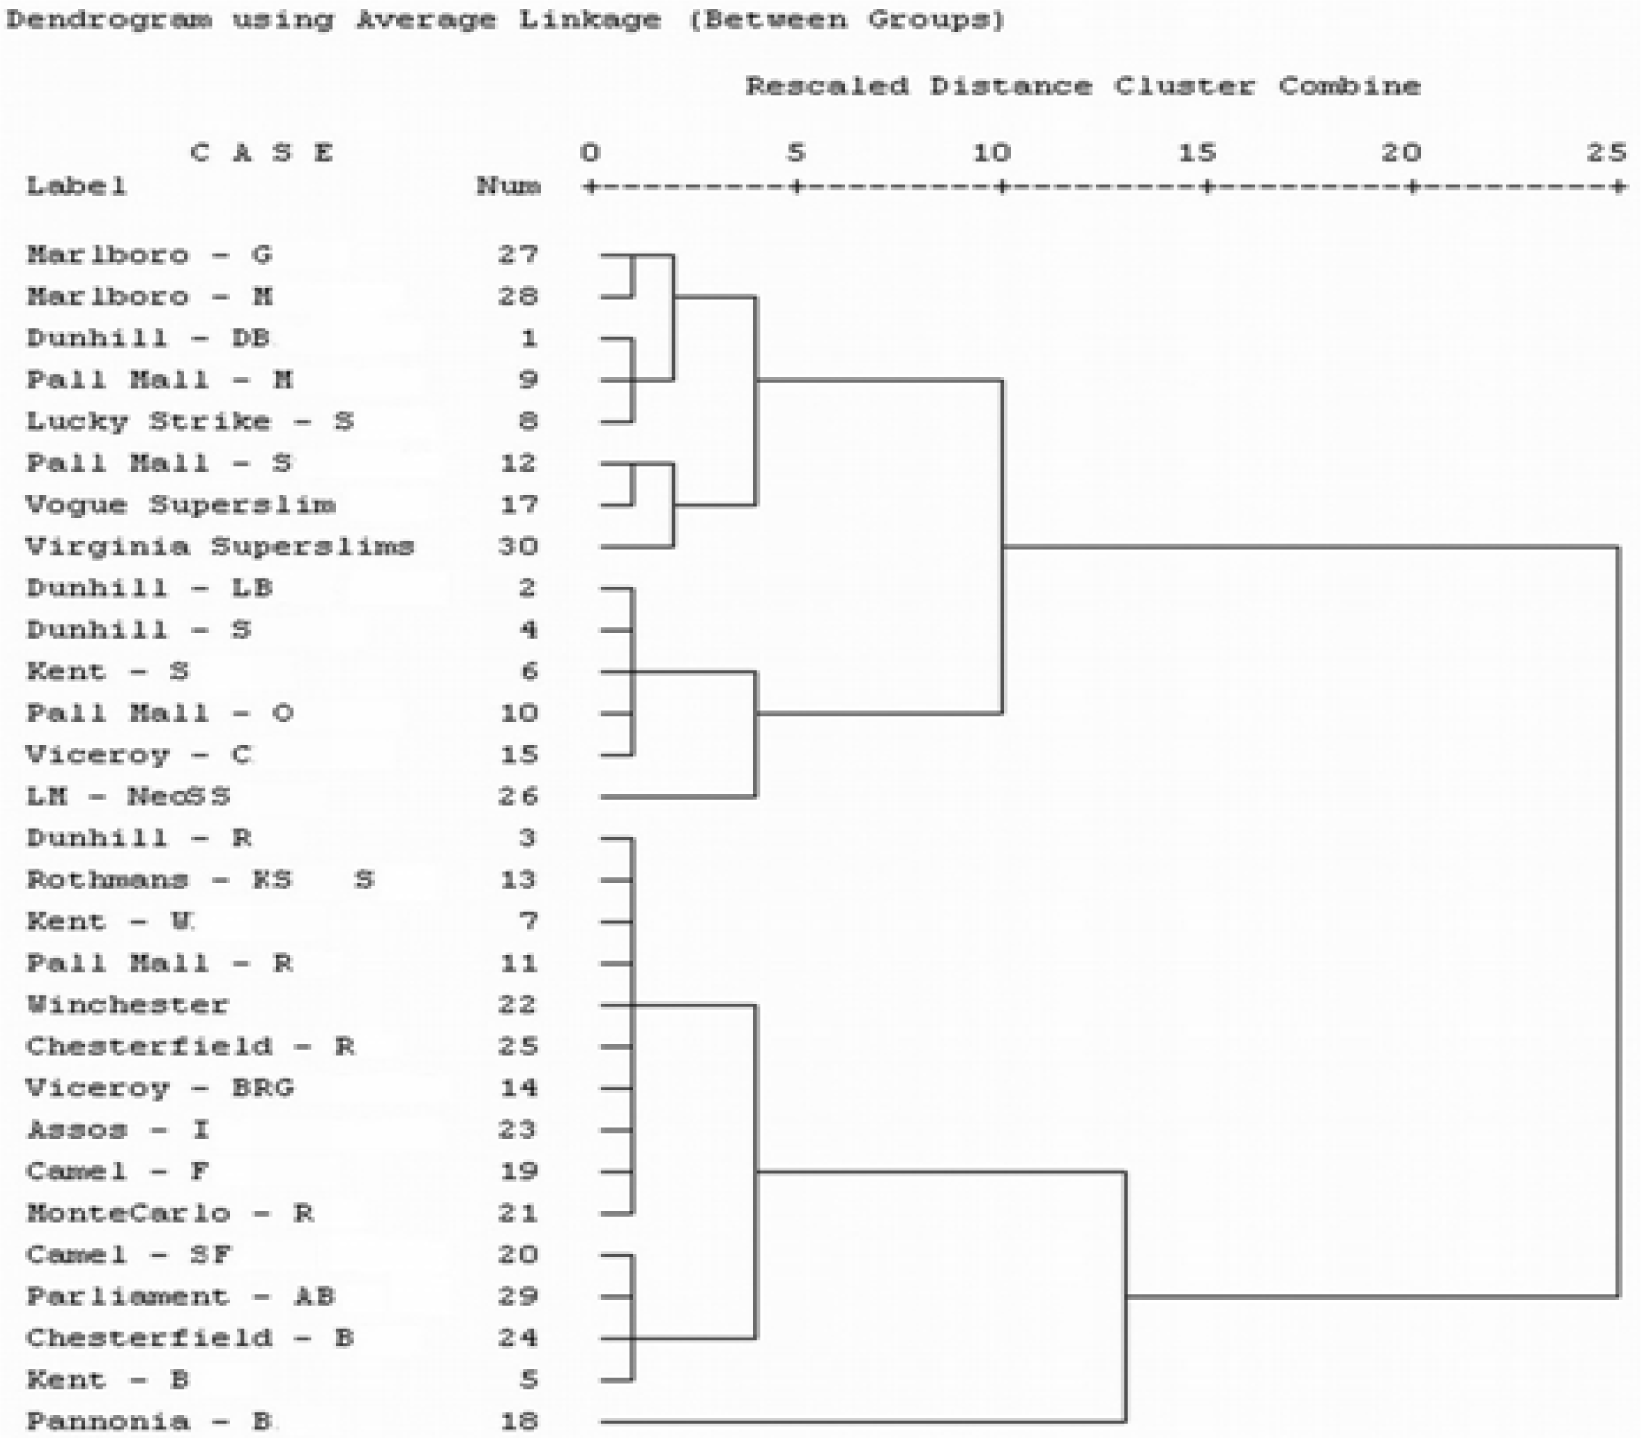
Hierarchical Cluster: Overall Analysis

Almost ninety-seven percent of the cigarette brands included into the study were valid and thus were included into the hierarchical cluster analysis (twenty-nine out of thirty). One brand has been excluded from this analysis due to the absence of carbon monoxide concentration printed on the pack (pack no. 16, see Table 1). The resulted average agglomeration schedule is presented in Table 9.
The horizontal icicle plot obtained on studied sample is presented in Figure 1 and the associated dendrogram in Figure 2.

Discussion

The aim of the research was reached. The chemical composition, market information, and health care information were analyzed. The results indicated that hierarchical cluster analysis is a multivariate method useful in analysis of investigated cigarettes as similar behaviors in terms of studied variables.
Regarding chemical composition of studied cigarettes the following observation can be made: (a) the tar concentrations varied from 1 mg to 12 mg (Pannonia, see Table 1), with a single exception greater than 10 mg (10 mg being the highest concentration accepted); the average of tar concentration was of 7.23 mg with a standard deviation of 2.69 mg; (b) the concentration of nicotine varied from 0.1 mg to 0.9 mg with an average of 0.63 mg and a standard deviation of 0.19 mg; (c) the concentration of carbon monoxide varied from 0.5 mg to 12 mg, with an average of 7.57 mg and a standard deviation of 2.84 mg. Thus, it can be say that the concentration of the tar and carbon monoxide were similar in terms of minimum value, maximum value, average and standard deviation. At least two explanations are plausible regarding the tar and carbon monoxide concentration of pack no. 18 (see Table 1, the single brand produce by Continental Tobacco) which are of 12 mg: the packet came from an older stock and when was produced the actual laws, ministerial orders and ordinances were unknown, or the Continental Tobacco produce and sell cigarettes with a higher tar and carbon monoxide concentrations than those imposed.
Regarding the carbon monoxide concentration, as it can be observed from Table 1, the Viceroy - Ultra Light brand did not had it printed on the packet. The Viceroy Ultra Light could be a less preferred brand by the Romanian smokers, and the packet could be from a previous stock in trade. As it can be observed from Eq.1, the concentration of carbon monoxide is in a linear relationship with tar and nicotine concentration. Almost ninety-two percent of carbon monoxide variation can be explained by its linear relationship with tar and nicotine variation. In other terms it can be say that the cigarettes with a high carbon monoxide concentration have also a high tar and nicotine concentration. Based on Eq.1 the carbon monoxide concentration was estimated for pack no. 16 – Table 1. The analysis of the Eq.1 shown a very good agreement between given values and expected values, taking into account that all values are discretized (being given with one digit precision, see Table 4). The estimated values gave the possibility to include all cigarettes in clusterization analysis.
Regarding the market information, it can be observed that the majority of the cigarettes included into the study were produced by the British American Tobacco (more than a half, seventeen out of thirty, see Table 6). These cigarettes proved to have a significant higher price comparing with Japan Tobacco manufacturer, result sustained also by the two-steps cluster analysis. Summarizing, it can be say that British American Tobacco has a monopoly on the cigarette market of the supermarket included into the study.
Analyzing the public health information regarding the health warnings and exploratory health messages printed on studied cigarette packs, twenty-nine packs were in conformity with the Romanian laws. The Viceroy - Ultra Light brand did not had any of the imposed general text on the packet but has a hybrid of the “Smoking harms yourself and people around you” as “Smoking harm sever your health”. Another observation that can be made refers the carbon monoxide concentration. If we analyzed the explanatory health messages (see Table 7) it can be observed that most frequent messages refer the child protection and the information regarding the cigarette smoke composition. However, a question which can be investigated in further researches is “What is the impact of the explanatory health messages on smoker’s behavior?”, “Which is the significance of the explanatory health messages from the smokers’ point of view?”.
An interesting result was obtained in the analysis of correlation applied on explanatory health messages and cigarette class: the message “Smoking can decrease the sperm quality and fertility” was significant correlated with cigarette class (all cigarette packs manufactured by BAT and classified as medium class had this explanatory health message). It can be say that the cigarettes produced by BAT and classified as medium on quality class had the above mentioned explanatory health message.
The two-steps cluster analysis applied to entire data set revealed that this is not a useful technique in characterization of variables included into analysis. The hierarchical cluster analysis applied on entire set of data revealed some interesting information about the studied variables. This analysis was applied on the valid sample of cigarettes (twenty-nine out of thirty – the pack no. 16 was excluded due to the missing carbon monoxide concentration) and took into consideration four continuous variables (tar, nicotine, and carbon monoxide concentrations, and price).
Analyzing the agglomeration schedule revealed that there is no difference between Marlboro - Gold and Marlboro - Menthol (Philip Morris) or between Dunhill -Silver and Dunhill - Light Blue (British American Tobacco). Note that these two brands (Marlboro - Gold and Marlboro – Silver, see Table 1) are identical in terms of tar, nicotine and carbon monoxide concentrations and have the same price. The same observation is true for Dunhill - Silver and Dunhill - Light Blue (see Table 1). Thus, it can be expected to found the Marlboro - Gold and Marlboro - Menthol in one cluster, and Dunhill – Light Blue and Dunhill Silver in another cluster (which it was happen, see Figure 2).
The difference between cigarettes brands as resulted from the agglomeration schedule were in eleven cases gave by the differences between prices. The ascending order according with the value of coefficients presented in agglomeration schedule (see Table 9) was: Pall Mall – Red & Winchester (0.004); Viceroy Blue-Red-Gold & Assos – International (0.010); Pall Mall – Red & Chesterfield – Red (0.013); Dunhill – Light Blue & Kent Silver (0.026); Pall Mall – Orange & Viceroy – Charcoal (0.130); Pall Mall – Red & Viceroy – Blue-Red-Gold (0.168); Camel - Subtle Flavour & Chesterfield – Blue (0.430); Pall Mall – Red & MonteCarlo – Red (0.491); Dunhill – Light Blue & Pall Mall – Orange (1.051); Dunhill – Red & Pall Mall – Red (1.247); and Pall Mall – Superslims & Vogue Superslims (1.464), respectively.
In five cases, the differences between pairs of cigarette brands were at the level of nicotine concentration and the price: Dunhill - Red & Rothmans – King Size (0.016); Camel - Subtle Flavor & Parliament - Aqua Blue (0.026); Dunhill – Dark Blue & Pall Mall – Menthol (0.042); Viceroy - Blue-Red-Gold & Camel – Filters (0.057), and Dunhill – Dark Blue & Lucky Strike – Silver (0.812), respectively.
The differences of carbon monoxide concentrations and prices classified on agglomeration schedule the Camel - Subtle Flavour and the Kent – Blue brands by a coefficient of 1.543.
The difference between cigarettes brands was in one case gave by the differences between tar and nicotine concentrations, and price (Dunhill – Red & Kent – Blue, with a coefficient of 5.246). Also in one case, the difference was at the level of carbon monoxide concentration and price (Kent – Blue & Camel – Subtle Flavours, 1.543). In three cases, the differences were at the level of tar and dioxide concentrations as well as prices (Dunhill – Light Blue & LM - Neo Slims, 5.319; Dunhill – Red & Pannonia – Blue, 19.917; Dunhill – Dark Blue & Dunhill – Red, 40.582).
Significant differences at the level of all studied variables were identified between the following pairs of brands: Dunhill – Dark Blue & Marlboro – Gold (2.370), Pall Mall – Superslims & Virginia Superslim (2.845), Dunhill – Dark Blue & Dunhill – Light Blue (15.246).
Looking at the icicle plot (Figure 1) it can be analyzed what happen at each clusterization step. At the start step (the one that is not represented on icicle plot, Table 9), each cigarette brand was a cluster unto itself (the number of clusters at the start point being equal with sample size). After the first step, the cigarette brands were ordered in the icicle plot according with their combination into clusters. Marlboro – Gold & Marlboro – Menthol form the first cluster, then Dunhill – Light Blue form other cluster, and so on, until all the clusters were formed.
The dendrogram presented in Figure 2 shown the ensemble picture of what really happed in clusterization. Six clusters were formatted at first step:
  • 1.1. One cluster that brings together ten cigarettes brands by including five British American Tobacco brands, three Japan Tobacco brands and two Philip Morris brands. The tar and carbon monoxide concentrations had the same values for all cigarette brands, the nicotine concentration varied from 0.7 to 0.9 mg.
  • 1.2. One cluster that brings together five British American Tobacco cigarette brands. The concentrations of tar, nicotine and carbon monoxide had identical values.
  • 1.3. One cluster that brings together two Philip Morris cigarette, one Japan Tobacco and one by the British American Tobacco. The tar concentrations were identical for all brands, the nicotine concentrations varied from 0.6 to 0.7 mg, and the carbon monoxide concentration varied from 9 to 10 mg.
  • 1.4. One cluster that brings together three British American Tobacco cigarette brands: the tar and carbon monoxide concentrations were identical for all brands and the nicotine concentrations varied from 0.6 to 0.8 mg.
  • 1.5. Two clusters that brings together:
    • ○ 1.5.a. Two Philip Morris cigarette brands. The tar, nicotine and carbon monoxide concentrations were identical for all brands included into this cluster.
    • ○ 1.5.b. Two British American Tobacco cigarette brands. The tar and carbon monoxide concentrations were identical for all brands and the nicotine concentrations varied from 0.6 to 0.8 mg.
For all clusters obtained in the first step the prices of the cigarette brands were different, shown that this variable was not took into consideration into clusters construction.
In the second step, at a short distance, two clusters were formed: one by joining the cluster 1.4. with the cluster 1.5.a. (2.1.), and other by joining the cluster 1.5.b. with Virginia Superslims brand (2.2.). Going further, at a distance less than five three clusters were formed based on the similarities between the brands: one by joining the cluster 2.1. with the cluster 2.2. (3.1.), one by joining the cluster 1.1. with the cluster 1.3. (3.2), and one by joining the cluster 1.2. with LM - Neo Slims brand (3.3). At this level just one cigarette brand was not joined with others (Pannonia – Blue, produced by the Continental Tobacco) at this level. At a rescaled distance of ten on dendrogram, the cluster 3.1. was joined together with the cluster 3.3 (4.). At a distance less than fifteen, the Pannonia – Blue brand was joined together with cluster 3.1 (5.). At the highest distance as possible, the cluster 4 was joined together with the cluster 5.
The forth cluster included the cigarette brands with a tar concentration less than or equal with 7 mg, a nicotine concentration less than or equal with 0.8 mg, and a carbon monoxide concentration less than or equal with 8 mg. The fifth cluster included the cigarette brands with a tar concentration greater than or equal with 8 mg, a nicotine concentration between 0.6 and 0.8 mg, and a carbon monoxide concentration greater than or equal with 9 mg.
The study has some limitations. The main limitation refers the number of the cigarette brands and manufacturer included into the study. The financial resources were limited and this lead to a limitation of the number of cigarette brands and/or manufacturers included into the analysis. The small numbers of cigarette brands of medium class and the absence of the cigarette brands of inferior class represent other limitation of the study (23 brands were classified in superior class, and 7 brands is medium class, as resulted from the application of research protocol).
Based on the obtained results the following concluding remarks can be done:
  • The carbon monoxide concentration is linear dependent by the tar and nicotine concentration.
  • A monopoly of the British American Tobacco was identified in the choused supermarket.
  • The prices of the cigarettes produced by the British American Tobacco were significantly statistic higher comparing with the prices of the cigarettes produce by the Japan Tobacco.
  • The most frequent warning message printed on the investigated cigarettes was “Smoking can kill”.
  • The most frequent explanatory health messages printed on the investigated cigarettes were “Protect children: don’t let them breathe your smoke” and “Cigarette smoke contains benzene, nitrosamines, formaldehyde and cyanides”.
  • Hierarchical cluster analysis proved to be a useful technique in investigation of similarities on studied variables. The main criteria used in clusterization were tar and carbon monoxide concentrations.
Even if the hierarchical cluster analysis could offer information about alikeness between cigarette brands produced by different manufacturer, a wide analysis which to include a large number of cigarette brands and other variables collected from smokers could reveals more relevant information. This research could be considered as a first step in grouping similar cigarette brands in such way that their interrelationships to be relevant. According with the future availability of funds and human resources, our desire is to carry on a deepen research by including of a larger number of cigarette brands and of data obtained from a survey of population which to analyze the impact of health warnings and explanatory health message on their smoking behavior.

List of Abbreviations

BAT
British American Tobacco
JT
Japan Tobacco
PM
Philip Morris
CT
Continental Tobacco
HW
Health Warning
EHM
Explanatory Health Message
Figure 1:. Horizontal icicle plot
Ijerph 04 00233f1
Figure 2:. Dendrogram (Average linkage between groups)
Ijerph 04 00233f2
Table 1:. Sample of investigated cigarettes
NoBrand - ClassBrand Serial No.TMTar (mg)Nicotine (mg)Carbon monoxide (mg)Price (RON)Class
1Dunhill - Dark BlueYA 00112466BAT70.885.56superior
2Dunhill - Light BlueYA 00460907BAT40.455.72superior
3Dunhill - RedBG 40180115BAT100.8105.72superior
4Dunhill - SilverBG 31416538BAT40.455.72superior
5Kent - BlueBG 30536922BAT80.7105.50superior
6Kent - SilverBH 36040416BAT40.455.56superior
7Kent - WhiteBH 05954810BAT100.7105.56superior
8Lucky Strike - SilverBG 53145741BAT70.684.69superior
9Pall Mall - MentholBG 60887308BAT70.685.60superior
10Pall Mall - OrangeBG 79156614BAT40.454.48superior
11Pall Mall - RedBG 44202018BAT100.8104.48superior
12Pall Mall - SuperslimBH 59927073BAT70.764.48superior
13Rothmans - King SizeBG 64837127BAT100.9105.64superior
14Viceroy - Blue-Red-GoldBG 14241889BAT100.8104.84medium
15Viceroy - CharcoalBG 54416312BAT40.454.84medium
16Viceroy - Ultra LightBG 28844119BAT60.5n.a.4.84medium
17Vogue - Superslim l’adorationBH 71897282BAT70.765.69superior
18Pannonia - BlueGA 02862705CT120.8122.25medium
19Camel - FiltersCD 85473545JT100.9105.00superior
20Camel - Subtle FlavourCD 95504258JT80.795.00superior
21MonteCarlo - RedCE 22688091JT100.8104.00medium
22WinchesterCD 06536628JT100.8104.54medium
23Assos - InternationalAE 81879118PM100.8104.74superior
24Chesterfield - BlueAE 83563255PM80.794.40superior
25Chesterfield - RedAE 62584893PM100.8104.40superior
26LM - Neo SlimsHA 01057618PM30.435.02medium
27Marlboro - GoldAF 30984093PM60.575.68superior
28Marlboro - MentholAF 06665930PM60.575.68superior
29Parliament - Aqua BlueAF 18821505PM80.695.10superior
30Virginia Superslims - MentholAF 32318179PM60.655.77superior
TM = Tobacco Manufacturer; BAT = British American Tobacco; JT = Japan Tobacco; PM = Philip Morris;
CT = Continental Tobacco; Class = cigarette quality class; n.a. = not available
Table 2:. Cigarette chemical composition: descriptive statistics
Variable name (unit)nMinMaxMeanStdErrStdDevVarSkewKurt
Tar (mg)301.0012.07.230.492.697.22−0.37−0.54
Nicotine (mg)300.100.900.630.030.190.04−0.73+0.15
Carbon monoxide (mg)290.5012.07.570.532.848.07−0.73−0.04
n = valid sample size; Min = minimum; Max = maximum; StErr = standard error;
StdDev = standard deviation; Var = variance; Skew = skewness; Kurt = kurtosis
Table 3:. Statistical characteristic of the regression model (Eq. 1)
CoefficientsStandard Errort-Statp-value
Intercept1.78 [0.63 – 2.93]0.563.180.0038
Tar1.08 [0.81 – 1.36]0.138.071.51·10−8
Nicotine−3.06 [−7.19 – 1.08]2.01−1.520.1408
Table 4:. Cigarette chemical composition: given vs. expected carbon monoxide
NoExpected COTruncated Expected COGiven CO|Truncated - Given|
16.892781
24.876550
310.13210100
44.876550
58.2788102
64.876551
710.43810100
87.5047.580.5
97.5047.580.5
104.876550
1110.13210100
127.198761
139.82610100
1410.13210100
154.876550
177.198761
1812.29212120
199.82610100
208.278891
2110.13210100
2210.13210100
2310.13210100
248.278891
2510.13210100
263.796431
276.73770
286.73770
298.584990
306.424651
166.737Xsee text
Table 5:. Expected carbon monoxide concentration: confidence interval
Expected95% Confidence Interval
LowestHighestTruncated lowestTruncated highest
6.736.357.1167
Calculation / Probability15 = 50 – 3560 = 110 – 5020%80%
Table 6:. Tested cigarettes: distribution of manufacturer
Absolute frequencyRelative frequency (%)95% CI
British American Tobacco1756.67[36.78 – 73.22]
Philip Morris826.67[13.44 – 46.56]
Japan Tobacco413.33[3.44 – 29.89]
Continental Tobacco13.33[0.11 – 16.56]
Total30100
95% CI = 95% confidence interval
Table 7:. Public health information: health warnings and explanatory health messages
Health WarningsAbbfa (fr- %)95% CIno
“Smoking can kill”HW116 (53.33)[10 – 22]
“Smoking harms yourself and people around you”HW213 (43.33)[8 – 19]
Missing data1 (3.33)n.a.

Total30 (100)

Explanatory Health Messages

“Protect children: don’t let them breathe your smoke”EHM055 (16.67)[2 – 10]
“Cigarette smoke contains benzene, nitrosamines, formaldehyde and cyanides”EHM145 (16.67)[2 – 10]
“Smoking clocks blood circulation in arteries, induce heart and stroke attacks”EHM024 (13.33)[1 – 9]
“Smoking can cause a painful and fatal dead”EHM093 (10.00)[1 – 8]
“Smoking can decrease the sperm quality and fertility”EHM133 (10.00)[1 – 8]
“Your physician or pharmacist can help you to quit smoking”EHM062 (6.67)n.a.
“Smoking slow down blood circulation and induce impotence”EHM112 (6.67)n.a.
“Smokers died younger”EHM012 (6.67)n.a.
“Cigarettes are addictive. Do not start to smoke!”EHM072 (6.67)n.a.
“Smoking when pregnant harm your baby”EHM041 (3.33)n.a.
“Quitting smoking decrease the risk of cardiac and lung fatal diseases”EHM081 (3.33)n.a.

Total30 (100)
fa = absolute frequency; fr = relative frequency; 95% CIno = 95% confidence interval expressed as number of packs
Table 8:. Two-steps cluster analysis: centroids
Tar (mg)Nicotine (mg)Carbon monoxide (mg)Price (RON)

ClusterMeanStdDevMeanStdDevMeanStdDevMeanStdDev
17.532.4600.6500.1657.972.2975.0170.744
Mean = average; StdDev = standard deviation
Table 9:. Hierarchical cluster analysis: agglomeration schedule.
StageClusterCo-efficientStage ClusterNext Stage
CombinedFirst Appears
Cluster 1Cluster 2Cluster1Cluster 2
127280.0000021
2240.000008
311220.004005
414230.0100011
511250.0133013
63130.016009
720290.0200014
8260.0262017
9370.0416018
10190.0420016
1114190.0574013
1210150.1300017
1311140.16851115
1420240.4307020
1511210.49113018
16180.81210021
172101.05181225
183111.24791524
1912171.4640022
205201.54301424
211272.37016123
2212302.84519023
231125.194212226
24355.246182027
252265.31917026
261215.246232528
2731819.91724028
281340.58226270

References

  1. Cigarette Consumption [online], http://www.who.int/tobacco/en/atlas8.pdf (accessed 28 Feb 2007).
  2. Romania. World Health Organization - Regional Office for Europe [online]. http://data.euro.who.int/tobacco/ (accessed 28 Feb 2007).
  3. Bánóczy, J; Squier, C. Smoking and disease. Eur. J. Dent. Educ. 2004, 8(4), 7–10, [Medline PMID: 14725647]. [Google Scholar]
  4. Green, CR; Schumacher, JN; Rodgman, A. The expansion of tobacco and its effect on cigarette mainstream smoke properties. Contributions to Tobacco Research 2007, 22(5), 317–345. [Google Scholar]
  5. Hunter, RD; Ekunwe, SIN; Dodor, DE; Hwang, H-M; Ekunwe, L. Bacillus subtilis is a potential degrader of pyrene and benzo[a]pyrene. Int. J. Environ. Res. Public Health 2005, 2(2), 267–271. [Google Scholar]
  6. Parascandola, M. Skepticism, statistical methods, and the cigarette: A historical analysis of a methodological debate. Perspect. Biol. Med. 2004, 47(2), 244–261, [Medline PMID: 15259206]. [Google Scholar]
  7. Tateishi, U; Kusumoto, M; Moriyama, N; Sofue, T. Overview of the relationship between the agents-smoking and lung cancer. Japanese Journal of Clinical Radiology 2001, 46(13), 1591–1597. [Google Scholar]
  8. Lowenfels, AB; Maisonneuve, P. Epidemiology and risk factors for pancreatic cancer. Best Pract. Res. Clin. Gastroenterol. 2006, 20(2), 197–209, [Medline PMID: 16549324]. [Google Scholar]
  9. Correa, P; Piazuelo, MB; Camargo, MC. The future of gastric cancer prevention. Gastric Cancer 2004, 7(1), 9–16, [Medline PMID: 15052434]. [Google Scholar]
  10. Sciubba, JJ. Oral cancer: The importance of early diagnosis and treatment. Am. J. Clin. Dermatol. 2001, 2(4), 239–251, [Medline PMID: 11705251]. [Google Scholar]
  11. McLaughlin, JK; Lipworth, L. Epidemiologic aspects of renal cell cancer. Semin. Oncol. 2000, 27(2), 115–123, [Medline PMID: 10768591]. [Google Scholar]
  12. Wolff, MS; Collman, GW; Barrett, JC; Huff, J. Breast cancer and environmental risk factors: Epidemiological and experimental findings. Annu. Rev. Pharmacol. Toxicol. 1996, 36, 573–596, [Medline PMID: 8725402]. [Google Scholar]
  13. Dasgupta, P; Chellappan, SP. Nicotine-mediated cell proliferation and angiogenesis: new twists to an old story. Cell Cycle 2006, 5(20), 2324–2328, [Medline PMID: 17102610]. [Google Scholar]
  14. Federal Trade Commission (US). Cigarettes: testing for tar and nicotine content. Fed. Regist. 1967, 32, 1178. [Google Scholar]
  15. Zacny, JP; Stitzer, ML. Human smoking patterns. National Cancer Institute (US), Ed.; In The FTC cigarette test method for determining tar, nicotine, and carbon monoxide yields of US cigarettes. National Cancer Institute Smoking and Tobacco Control Monograph 7; Bethesda (MD); National Institutes of Health; NIH Pub. No. #96–4028; 1996. [Google Scholar]
  16. Framework Convention on Tobacco Control [online], http://www.who.int/tobacco/fctc/text/en/fctc_en.pdf (accessed 20 Feb 2007).
  17. Law No. 349/2002 for preventing and combating the effects of the tobacco products use. [online in Romanian], http://www.fumat.ro/legislatie/legea349.htm (accessed 28 Feb 2007).
  18. Law No. 90/2004 for modifying and completing the Law No. 349/2002 for preventing and combating the effects of the tobacco products use [online in Romanian], http://www.cdep.ro/proiecte/2003/700/30/9/leg_pl739_03.pdf (accessed 28 Feb 2007).
  19. Law Draft b 767/2005 for modification and completion of the Laws No. 90/2004 and No. 349/2002, Available from: URL: http://www.fumat.ro/legislatie/b767din2005.pdf (accessed 28 Feb 2007).
  20. Ministerial Order no. 853/2000 regarding establishing of the health warning text and its dimension for tobacco advertising.[online in Romanian], http://www.fumat.ro/legislatie/ordonanta853.htm (accessed 28 Feb 2007).
  21. Law No. 148/2000 for establishing of the mandatory norms for advertising, teleshopping and sponsorship. [online in Romanian] http://www.fumat.ro/legislatie/legea148.htm (accessed 28 Feb 2007).
  22. Law No. 457/2004 – Tobacco advertising and sponsorship frame. [online in Romanian], http://www.fumat.ro/legislatie/Legea457din2004.pdf (accessed 28 Feb 2007).
  23. Governmental Ordinance No. 13/2003 for modifying and completing the Law No. 349/2002: establishing the norms for the smoking areas, complete ban for smoking in hospitals and health facilities [online in Romanian], http://www.fumat.ro/legislatie/ordonanta13.htm (accessed 3 Mar 2007).
  24. Ministerial Order No. 919/1997 regarding quality cigarette class classification [online in Romanian] http://premiersoft.iasi.rdsnet.ro/licitatii/despre/act.jsp?id=35889 (accessed 3 Mar 2007).
  25. British American Tobacco. © BAT, http://www.bat.com/ (accessed 22 Feb 2007).
  26. Philip Morris International. © Philip Morrison, http://www.philipmorrisinternational.com/ & http://www.philipmorris.com (accessed 22 Feb 2007).
  27. Japan Tobacco International. © JT, http://www.jti.com/ (accessed 22 Feb 2007).
  28. Continental Tobacco. © CT, http://www.continentaltobacco.com/ (accessed 6 Mar 2007).
  29. Binomial Distribution [online software]. ©2005 -AcademicDirect Library, http://l.academicdirect.org/Statistics/binomial_distribution/ (accessed 4 Mar 2007).

