Article

Air Quality Management Using Modern Remote Sensing and Spatial Technologies and Associated Societal Costs

Director, Center for Advanced Infrastructure Technology (CAIT), Carrier Hall 203, The University of Mississippi, University, MS 38677-1848, USA
Int. J. Environ. Res. Public Health 2006, 3(3), 235-243; https://doi.org/10.3390/ijerph2006030028
Submission received: 21 October 2005 / Accepted: 6 July 2006 / Published: 30 September 2006

Abstract

:
This paper presents a study of societal costs related to public health due to the degradation of air quality and the lack of physical activity, both affected by our built environment. The paper further shows road safety as another public health concern. Traffic fatalities are the number one cause of death in the world. Traffic accidents result in huge financial loss to the people involved and the related public health cost is a significant part of the total societal cost. Motor vehicle exhausts and industrial emissions, gasoline vapors, and chemical solvents as well as natural sources emit nitrogen oxides and volatile organic compounds, which are precursors to the formation of ground-level Ozone. High concentration values of ground-level Ozone in hot summer days produce smog and lead to respiratory problems and loss in worker’s productivity. These factors and associated economic costs to society are important in establishing public policy and decision-making for sustainable transportation and development of communities in both industrialized and developing countries. This paper presents new science models for predicting ground-level Ozone and related air quality degradation. The models include predictor variables of daily climatological data, traffic volume and mix, speed, aviation data, and emission inventory of point sources. These models have been implemented in the user friendly AQMAN computer program and used for a case study in Northern Mississippi. Life-cycle benefits from reduced societal costs can be used to implement sustainable transportation policies, enhance investment decision-making, and protect public health and the environment.

Introduction

Modern urban development in the 20th century has focused on the use of motor vehicles and migration of people from rural areas to cities and suburbs. Paved road density, an indicator of economic prosperity, is the highest (12,517 km per million inhabitants) for the United States followed by other industrialized countries; and it is below 1,000 km per million inhabitants for most developing countries [1]. During the last decade, the travel demand on the road infrastructure has increased more than its capacity. The Federal Highway Administration (FHWA) statistics show that the annual vehicle miles of travel (VMT) on the U.S. highways increased from 2,247 to 2,749 billion miles between 1992 and 2000 with only 0.2 percent increase in million lane miles [2]. The Interstate and national highway system comprises of only 4 percent of the total paved roads in the U.S.; however, approximately 43 percent of all VMT and 70 percent of all truck freights travel occur on this network annually. The same trend can be observed in other countries. The U.S. share is about 25 percent of the world petroleum consumption with 29 % increase during 1982–2002. As shown in Figure 1, transportation sector is 66.5 % of the U.S. petroleum consumption in 2002 [3]. On global level, it is expected that large developing countries such as China will exceed the U.S. share of petroleum consumption in the next 10–20 years. This trend is alarming because petroleum reserve will not last more than 50 years considering expected increase in the worldwide demand.
Vehicle ownership in the U.S. was the highest in the world at 130 million cars (about 27 % of the world total) and 77 million trucks (about 41 % of the world total) based on the 1996 statistics, compared to the next most prosperous and car loving country of Germany at 41 million cars and 4.3 million trucks [4]. The U.S share of automobiles in 2002 was 131 million at 22.5 percent and share of trucks increased to 91 million at 43 percent of the world total, while the truck and bus share of China increased to 10.5 million – the third highest in the world after the U.S. and Japan [3]. Rapidly developing economies, such as China, want to access greater personal mobility and car ownership for enhancing the quality of life in the same way the industrialized countries did in the last half century. This will lead to accelerated consumption of petroleum and degradation of air quality.
Congestion is another indication of the deficit between travel demand and capacity, which is measured in terms of traffic density or travel time. The U.S. General Accounting Office (GAO) reported that the interstate highways have become more congested than other similar roads [5]. The VMT increased at a rate four times higher than the concurrent rate of increase of population from 1990 to 2000. The overall density of traffic on interstates has increased 31.7 percent over the past decade. The travel time index, another measure of congestion, has increased 12 percent in the last decade [5]. This increment in congestion adversely affects user operating costs, safety, air quality, and increases the associated societal costs. Vehicle technology has improved the fuel efficiency and drastically reduced vehicular emissions over the last 30 years. However, mobile source emissions comprise a significant portion of all U.S. air pollution, and emission rates rise with higher VMT. For instance, the transportation sector contributed 56% of all NOx emissions in the U.S. in 2002.
The U.S. Environmental Protection Agency (EPA) and States have established air quality monitoring stations throughout the U.S. to reinforce the regulations of the 1970 Clean Air Act and its 1990 amendments. An area is in violation of the national air quality standard if the concentration level for the specified form of the standard and evaluation time frame is exceeded. Nitrogen oxides (NOx) and volatile organic compounds (VOC) form ground-level Ozone (O3) through a photochemical reaction involving sunlight and hot weather. Ozone and nitrogen dioxide (NO2) produce ‘smog’ which adversely affects public health, especially respiratory systems, and is a concern in urban areas nationwide and in some rural areas of Southeastern states. The EPA designations as of 15 June 2004, consists of 126 non-attainment areas based on the 8-hour ground-level Ozone standard, which include 474 counties and are home to 159 million people [6]. This shows the extent of air pollution in most urban areas in the U.S. These non-attainment areas may lose federal funding for construction of new transportation projects.
Air quality management strategies include emission control on industrial/point and mobile sources, improved fuel quality, congestion management, and sustainable urban growth. Transportation also has other secondary impacts, with both the lack of physical activity affecting people’s health and noise from pavement surface that is a concern in young children. This paper presents new science models and applications of modern remote sensing and geospatial technologies for predicting air pollution.
The objectives of this paper are to: (1) identify significant factors associated with transportation demand and the environment, public safety, and public health impacts of poor air quality, and (2) present new science models to assess air quality degradation and quantify related societal costs for enhancing environmentally sustainable decision-making process.

Factors Associated with Environmentally Sustainable Transportation

Uddin et al. [1] identified several factors related to road infrastructure and urbanization, which affect safety, environmental degradation, public health and related societal costs, quality of life, and social integration problems. These factors include: (1) traffic fatalities and injuries, (2) traffic related emissions and air pollution, (3) traffic related pavement noise impacts, (4) built environment impacts on physical inactivity, (5) built-up area effects on environment, (6) construction process and material resources, (7) energy demand and diminishing natural sources, and (8) landuse, urbanization, and social integration issues. Diminishing energy resources are equally important considerations for environmentally sustainable transportation policy and decision-making. Traffic related safety impacts should be the top concern in transportation investment decision-making process.

Safety Impacts of Traffic Related Crashes

The top indicator of road safety is the rate of traffic fatalities and crashes, which results in large user costs and non-user costs related to medical expenses and property damages. Few people realize this, but traffic fatalities are the number one cause of death in the world with 1.2 million deaths and 50 million injured each year. The World report on road traffic injury prevention, jointly issued by the World Health Organization (WHO) and the World Bank [7], underscores their concern that unsafe road traffic systems are seriously harming global public health and development. During 2002 in the U.S. 42,815 fatalities and almost 3 million injuries occurred on roads, which resulted in an estimated $230 billion financial loss. Accidents are caused by human factors, roadway design and in-service pavement conditions, weather and visibility problems, vehicle problems, and interaction of these factors. But in the developing world, the exponential growth of motorized transportation without effective infrastructure or safety laws in place has made these issues more dangerous. Rural roads in the U.S. serve 60 million people in rural America. Widely dispersed populations are connected by narrow two-lane highways in rural states. These rural states in the U.S. have been experiencing more fatal accident rates than larger metropolitan urban areas. For example, recent 2003 statistics show that Mississippi is the second deadliest state (30 fatalities per 100,000 inhabitants) after Wyoming [8]. New York and other urban states have one-third or less rate.
Of the 42,643 people killed on our nation’s highways in 2003, over 25,000 died when their vehicle left the lane and crashed because of the loss of control. In some cases the vehicle crossed the centerline and was involved in a head-on crash or opposite direction sideswipe. In others, the vehicle encroached onto the shoulder and beyond to rollover or impact one or more natural or man-made objects, such as utility poles, bridge walls, embankments, guardrails, parked vehicles, or trees. Roadside crashes account for one-third of all U.S. highways fatalities each year. Although rollovers occur in only 15 percent of roadside crashes, they are responsible for more than 25 percent of all roadside fatalities. Nearly 75 percent of all rollovers occur on rural two-lane roads that have limited right-of-way, and they were designed to meet older and less demanding standards [9] for geometrics and safety. In Mississippi, the second highest traffic fatality rate state, 80 % of motorists killed in crashes are unbelted [8]. Higher user costs are expected on Mississippi roads with unpaved and inadequately maintained shoulders due to flying stones, which often damage windshields. The traffic mortality cost is approximately 2 to 5 million dollars per case. Traffic related safety needs to be treated as a public health issue because thousands of people die each year, which result in the highest societal cost.

Built Environment Impacts on Physical Inactivity and Air Pollution

Automobile dependent urbanization in the U.S. and abroad has developed physically inactive lifestyle, which has increased the risk of preventable obesity, chronic disease, and premature mortality. Physical inactivity is a global public health threat leading to about 1.9 million deaths per year according to the WHO. A recent report by the Institute of Medicine of the National Academies examines the influence of the built environment on physical inactivity in the U.S. [10]. The report makes recommendations for selecting design strategies to increase physical activity and studying social marketing when changes are made to the built environment – whether retrofitting the existing facilities or constructing new developments and communities.
Built-up or constructed surface areas cause air temperatures to rise due to the heat conduction characteristics of these surfaces. On warm summer days the air in a city can be 3–4 °C (6–8 °F) hotter than its surrounding areas. These cities are called “Urban Heat-Islands” and generally lead to poor air quality and smog occurrences in hot summer days. In many areas of the nation, a warming of 2.2°C (4 °F) could increase O3 concentrations by about 5% [11]. The air quality modeling effort pursued in this study validates this concept for rural cities as well. Based on satellite imagery interpretation and geospatial analysis, the “heat-islands” effect has been found in the small rural town of Oxford in North Mississippi. These societal impacts are crucial in developing environmentally sustainable development policy and decision-making.

Air Pollution Impacts on Public Health

Transportation related emissions influence changes in the natural balance of the atmospheric air and cause adversely high level of air pollutants. Many damaging pollutants such as lead and sulfur are no problem now due to advancements in cleaner unleaded fuel, improved engine performance, use of catalytic converter, and stricter emission control regulations in the U.S. and Europe. Other emission levels have also dropped compared to the older vehicle models. However, many urban areas in the U.S. and several megacities of the world are currently affected by major air pollutants, such as ground-level O3, NO2, particulate matter (PM), and carbon monoxide (CO). Particulate matter 10 microns in aerodynamic diameter (PM10) or smaller are considered inhalable and have the greatest impact on public health. Particles 2.5 microns or smaller (PM2.5) are thought to be the most damaging [12]. A recent air quality trend analysis study of the Southeastern U.S. shows that poor air quality occurrences during summer time are mostly caused by episodes of high levels of O3 and PM2.5[13]. These pollutants cause serious morbidity and health hazards including respiratory problems, lung diseases, and risk of premature mortality. The level of vehicle emissions is higher in most developing countries due to lack of such regulated emission control programs.
Reductions in transportation emissions and subsequent improvements in air quality have been made in the U.S. through government enforcements of regulations and voluntary participation by the industry and the public. However, during the last 25 years the U.S. consumption of fuel and emissions levels has not been changed much due to the increase in car ownership, more travel mileage, and bigger market share of fuel gulping SUVs and pickup trucks that has risen to 34 % of combined vehicle fleet in 2002 [3]. On the other hand, the average gasoline consumption has remarkably decreased by more than 20 % in France over the same period [14]. This shows the consequence of national transportation policies over a long-range on fuel consumption and mobile emissions.
Economic analysis of transportation control measures (TCMs) and air quality mitigation programs require the determination of changes in the level of air pollution over certain periods and in specific areas. This evaluation can be done through a specialized monitoring program set up for a particular evaluation site or the use of reliable air quality modeling. Both of them are subjected to certain amounts of implementing, operating, and other associated costs. Therefore, the appropriate air quality evaluation method needs to be carefully selected for being both technically and economically sound. For example, the cost of two 3-month monitoring programs (one before and the other after implementation) to study effects on O3 formation would cost around $1,300,000 [15]. Because of this high monitoring cost, it is probably not practical for local transportation or air quality agencies to undertake such specialized monitoring programs. Therefore, a reliable air quality model would be an attractive alternative for assessing the effects of new transportation projects and TCMs on air quality, due to reasonable model calibration and operation costs, which are less than $50,000 for 3–4 months implementation time. The new science model for air pollution, presented in this paper, is the alternative simulation approach to estimate the impacts of TCM strategies and identify sites and locations for air quality monitoring.

Life-Cycle Analysis of Societal Costs and Economic Benefits

The application of the life-cycle economic analysis to infrastructure projects, especially to road infrastructure, is imperative for the project selection, planning, and programming. Agencies and decision-makers must conduct an evaluation of benefits and costs incurred by the development of a transportation facility in order to select the appropriate and feasible alternative. This economic analysis must include agency costs, user costs, and benefits. Furthermore, the analysis of different alternatives must be conducted over the same life-cycle period. Old practices of life-cycle cost analyses for road infrastructures considered only the evaluation of benefits and costs related to user operating costs, travel time, and delays. They did not consider the societal costs related to congestion and urban sprawl. Transportation-related air pollution degrades air quality and presents a quantifiable societal cost. Traffic mix and average travel speed are important parameters for this purpose. It has been shown that on typical roads diesel trucks produce 10 times more NOx than cars, and cars emit 2–3 times more CO than diesel trucks [16].

Evaluation of Societal Costs

These costs are related to the environmental impacts from transportation facilities. The vehicles that use transportation facilities emit pollutants into the atmosphere; therefore, these facilities have some impact on the air quality. In addition to adverse effects on human health, other societal costs caused from urban ambient air pollution include damage to buildings and vegetation, effect on visibility, and contribution to global greenhouse gas emissions. Murphy and Delucchi [17] stated that “from the 1920s to the 1960s, major decisions about building and financing highways were left to technical experts and engineers, who rarely if ever performed societal cost-benefit analyses.” However, in recent years, analysts and policymakers have become more interested to consider the complete societal cost aspect of motor vehicles. The approach most commonly used to evaluate these health effects of air pollution is first estimating the impact of a change in level of air pollution on health and then attributing a monetary value to medical costs related to the change in health. The total societal cost is about 33% of the full transportation costs in the U.S. and about 1/3rd of that is air pollution cost [17, 18]. In their study of societal costs, Small and Kazimi [19] concluded that the measurable costs of air pollution are high enough to justify substantial expenditures to control vehicle emission rates. Their estimated costs of motor vehicle emissions are based on the estimates of cost per ton to the emissions of a 1992 California fleet-average gasoline-powered car. Their study indicates that nearly half of this cost is from NOx, due largely to its role in particulate formulation [19].

Evaluation of Benefits

The development of a new transportation project or the rehabilitation of an existing highway should be assessed carefully so that it does not produce adverse effects on the environment, safety, and societal costs. Several benefits are expected. These benefits can accumulate from direct or indirect cost reductions. Some of the common benefits are listed below:
  • Reduction of accidents: An improved travel surface, the construction of a new intersection, or the construction of a new bypass are some projects that will reduce accidents and increase benefits.
  • Reduction of congestion: The first factor considered in the evaluation of benefits is the level of service (LOS). Increasing the number of lanes of an existing highway will improve the traffic flow, reduce the congestion, and provide better LOS.
  • Reduction of travel time: The travel time and the user costs are reduced due to an improved traffic flow or a new bypass.
  • Reduction of vehicle emissions: The improved traffic flow and reduced congestion will decrease the amount of vehicle emissions and air pollution.
  • Reduction of air pollutants: The reduction in air pollution will result in reduced public health costs. In addition, air pollution is harmful to agricultural products and ecosystems, and even deteriorates constructed materials and structures. The decrease in these undesirable consequences, therefore, can be considered as a benefit to the society [20].

Case Studies of Life-Cycle Societal Benefits and Costs

An example of life-cycle benefits and costs analysis considering the air quality is the case study of reducing heat and smog in the Los Angeles Basin [21]. The case study simulates the benefits from energy saving and O3 reduction as a result of “Cool Communities” strategy for Los Angeles. The key component of this strategy is to change the existing roofing and paving materials to more reflective materials in order to reduce the heat island effect in the Los Angeles area in a 15-year horizon. Examples of the key component include changing from a typical green or brown roof to a white roof and using concrete pavement in place of asphalt for typical roadways. In addition, the strategy is enforced by growing two or three additional low emitting trees at each house, or equivalent to 11 million shade trees for the entire Los Angeles Basin. The quantifiable benefits from this strategy include cooler air and surface temperatures, reduction in NOx emission, reduction in O3 exceedance, reduced air conditioning bills both directly and indirectly, and reduced health costs of O3. The results of the analysis show the benefit/cost ratio of approximately 10:1.
The EPA studied the benefits and costs of the Clean Air Act from 1970 to 2001 [22,23]. Several benefits are identified, which can be grouped into two major groups: health benefits and welfare benefits. Health benefits are defined as an avoidance of air pollution-related health effects, such as premature mortality, respiratory illness, and heart disease. Welfare benefits are accounted for when improved air quality reduces damage to measurable resources, including agriculture production and visibility. Table 1 presents major air pollutants and their effects on public health (in 1990 dollars) per unit of avoided effect for both health and welfare benefit groups. For instance, the benefit of having one person avoiding from chronic asthma, which is caused by O3, is $25,000 per year. Based on such data, one can calculate the total benefits and costs due to the change in air quality as a result of transportation improvement projects and pollution control measures.

Air Quality Modeling and Analysis Methodology

AQMAN Model Development

The Air Quality Modeling and ANalysis (AQMAN) object-oriented computer program code for the air concentration and pollutant dispersion model, presented in this paper, is based on the air pollutant data (O3, NO2) collected continuously by EPA monitoring stations in Tupelo and Hernando from 1996 to 2000. The daily maximum values of measured O3 concentrations in Tupelo and Hernando from 1996 to 2000 across a year shows a seasonal pattern. Plots of air temperature and vehicle emissions also indicate similar seasonal trends. The AQMAN model includes the following explanatory variables and several interaction terms based on a study area of 32-km radius.
  • Climatological data (air temperature, wind, precipitation, solar radiation, cloud cover)
  • Daily traffic data (volume, traffic mix, average speed of cars and trucks)
  • Daily vehicle emissions of VOC and NOx (function of vehicle model year in traffic mix)
  • Daily emission inventory estimates of VOC and NOx from industrial sources
  • Daily estimates of aircraft operations at airports in the study area
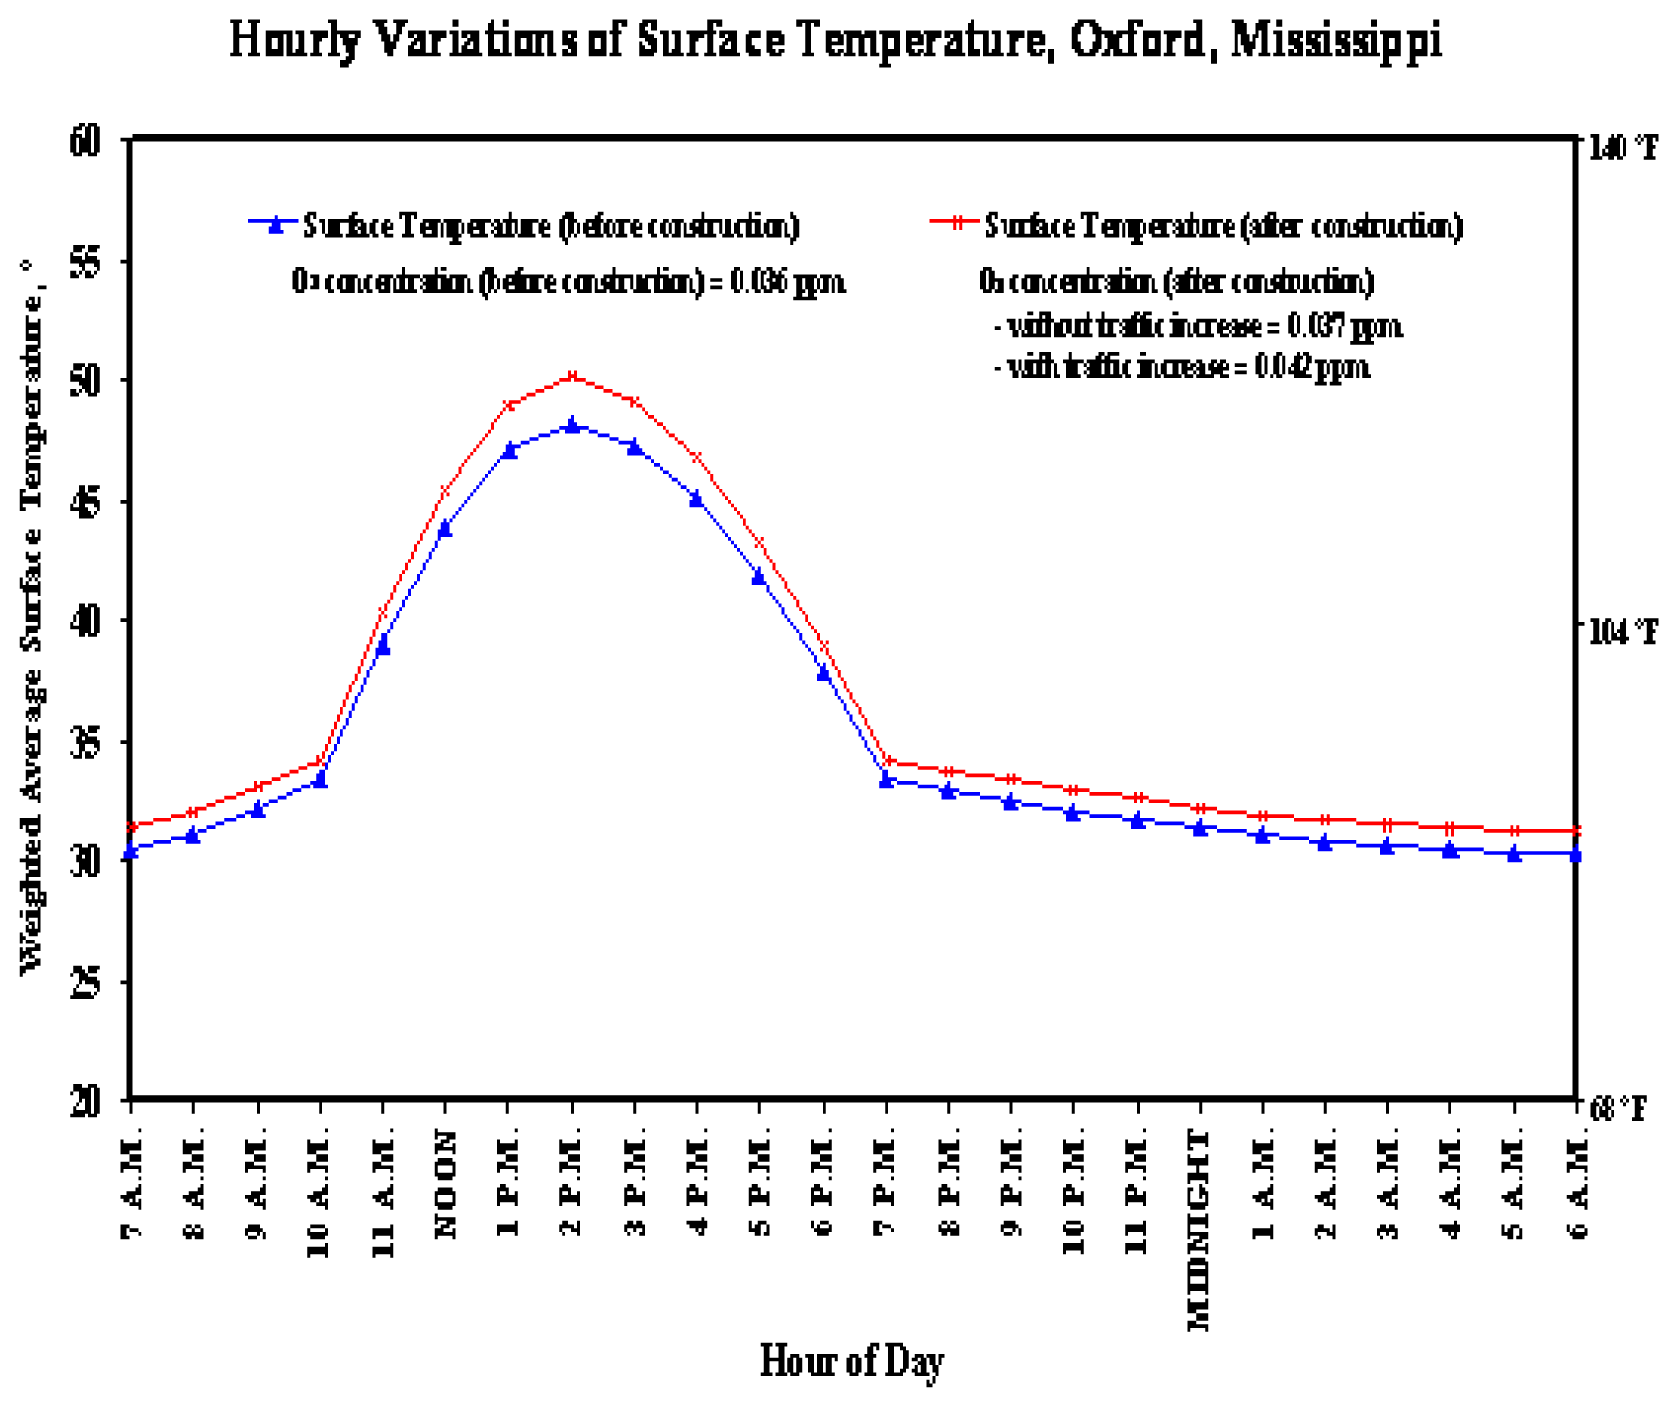
  • Daily surface temperature (weighted average from classification of surface types)
The plots of observed versus predicted O3 pollutant by the new science model are reasonably acceptable for the years 1996–2000 for Tupelo and Hernando. The correlation coefficient value (R = +0.74) is reasonable, when compared to the range of R values reported in other studies, where the prior-day O3 values were used. Therefore, the AQMAN model can be used for areas with no monitoring program. Details of the air quality model development and validation are described by Boriboonsomsin [24].

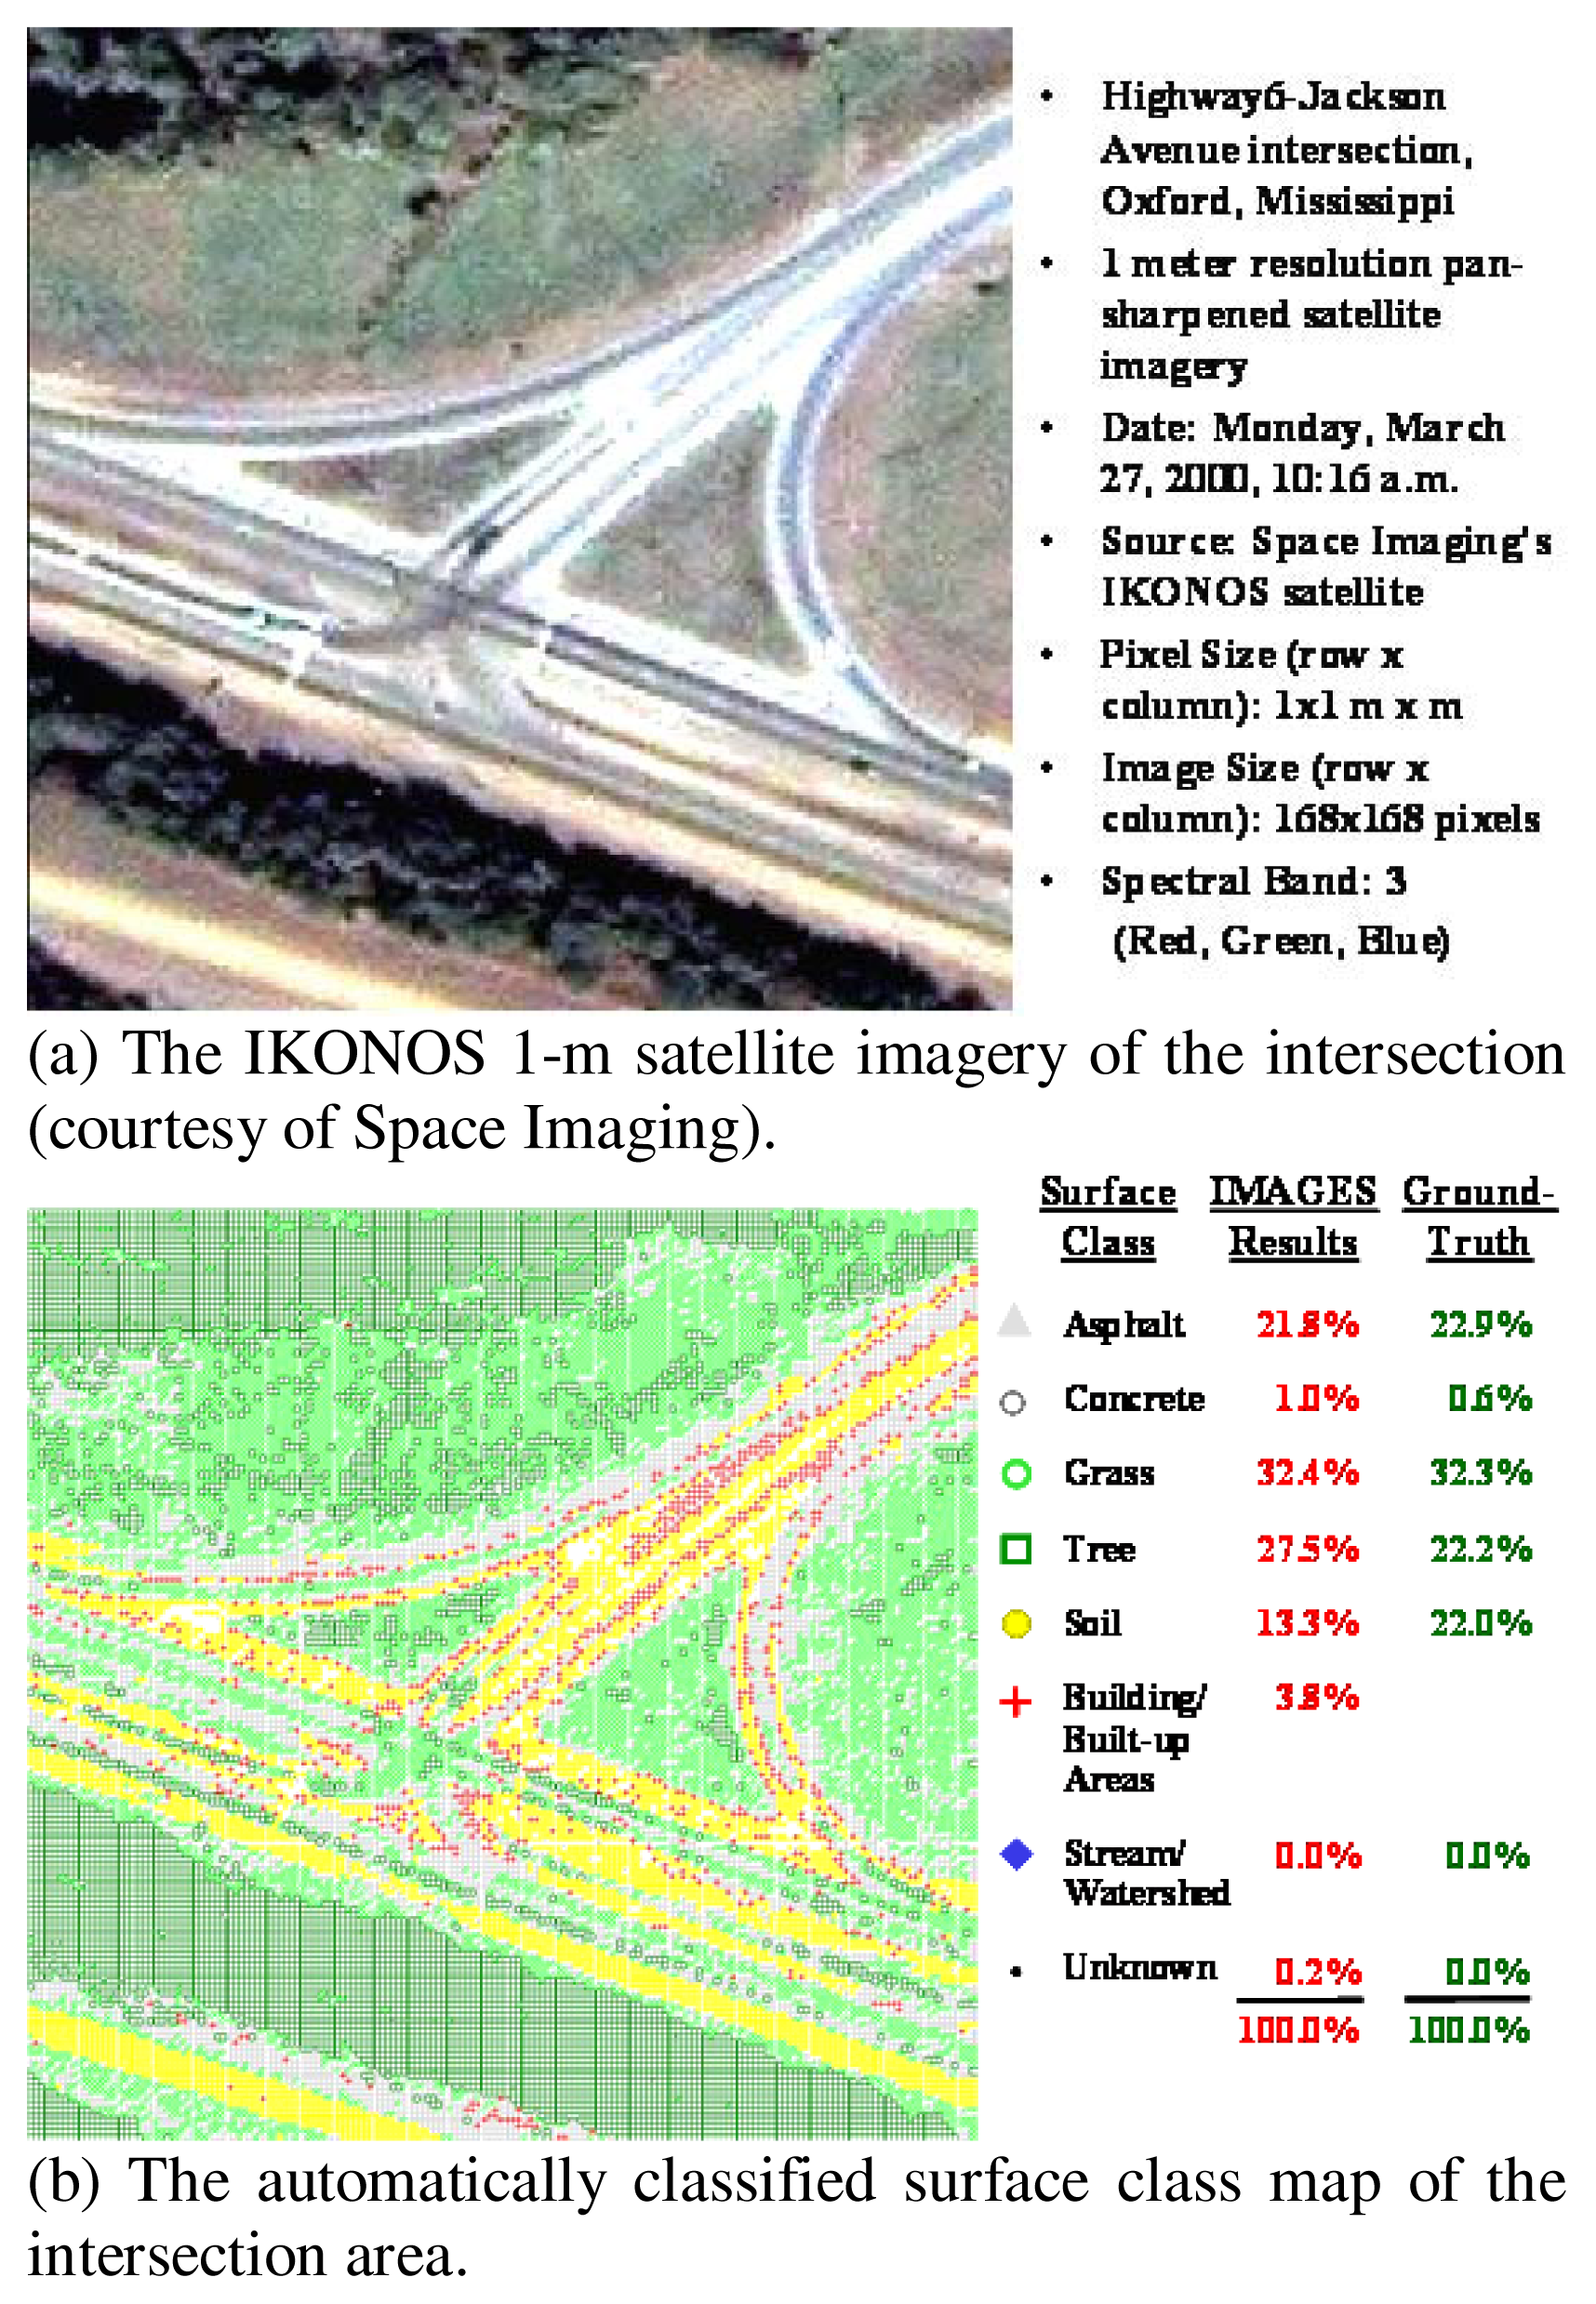
Application of Remote Sensing and Geospatial Technologies

The surface temperature variables in the O3 and NO2 models help to evaluate the adverse impact of built-up areas on “heat-island” effects. The weighted surface temperature is the average surface temperature value weighted by the proportion of each surface class in the study area. A methodology has been developed and implemented using geospatial analysis of high resolution remote sensing multispectral satellite imagery. The 1-m resolution IKONOS pan-sharpened multispectral imagery acquired for Oxford, Mississippi, on 27 March 2000, was used to discriminate different surface and landuse types. These surface types include: asphalt, concrete, buildings, soils, grass, trees and wooded areas, and water bodies. Three known supervised classification methods (minimum distance, mahalanobis distance, and maximum likelihood decision rules) gave low accuracy (36–44%) for classifying surface class tree. Therefore, a new methodology has been developed in this research based on the spectral reflectance values in each band to improve accuracy of surface classes. The concept of this methodology is to find the range of a spectral band that uniquely represents the desired surface class based on information available from images of selected areas with known groundtruth. The methodology of assigning the pixels on the image to the respective surface class has been implemented in a computer program called IMAGEry-based Surface classification (IMAGES). The results are used to predict surface temperature and shown using geospatial mapping. Details of these models are described by Boriboonsomsin [24]. Figure 2(a) shows the satellite imagery of the intersection of Highway 6 and Jackson Ave in Oxford that was used for one of the groundtruth studies. The automatically classified surface class map of the same area is shown in Figure 2(b).
The surface class data are used to predict surface temperature using climatological data for the study area. The results of 8 km × 8 km study area of oxford show that on a hot summer day the average surface temperature in the built-up area within the city has an average 9 °C higher surface temperature than the ambient air temperature. This shows the “heat-islands” effect for this small rural city. Another recent study shows that Ozone levels in New Orleans are significantly lower than Memphis and Jackson and PM2.5 is increasing in Jackson and New Orleans [13]. Recall that New Orleans is a bigger city with more traffic; however, it is surrounded by water bodies (Lake Pontchartrain and Mississippi River) and marsh lands extending to the Gulf of Mexico.

Results of a Case Study of the Impact of Built-up Area on Societal Costs

The impact of recent commercial developments in 2003 near West Oxford Exit of Highway 6 and Jackson Avenue road expansion from 3 to 5 lanes was analyzed for impacts on surface classes, air quality, and societal costs. This is the most dangerous and unsafe at-grade intersection in Oxford. All-way STOP sign was upgraded to protected traffic signal a few years ago. The area of the constructed surfaces (asphalt, concrete, and buildings) in 2003 has increased by 14.4%, replacing the areas of natural surfaces (grass, tree, and soil). The building area after the construction is almost three times of its area before the construction. Figure 3 shows the impact on hourly surface temperature variations on a hot summer day of 11 July 2003. The results show that, under the same climate conditions, the constructed surfaces in the new commercial complexes increase the weighted average surface temperature by 1.9°C (3.4°F), or equivalent to 3.9%. A higher weighted average surface temperature in the area raises the levels of O3 and NO2 concentrations. The results show 16.7 % increase in the ground-level O3 pollution (0.042 ppm in 2003) and 25% increase in NO2.
The AQMAN model results for this case study in 2003 are compared in Table 2 with the old status in 2001. The results show a differential societal cost of about $187,722 related to morbidity and lost productivity from increased air pollution. The air pollution societal cost is about 19 % of the total societal costs or 13 cents per vehicle in the study area. The total societal cost of is 68 cents per vehicle including about 4 times higher traffic accident cost. This societal cost is significantly higher than vehicle operating user costs, and it is not considered in traditional benefit and cost analysis for transportation projects [1]. The differential vehicle operating cost is insignificant for this case. Marginal vehicle operating cost is typically 19–24 cents per vehicle mile for city traffic and driving conditions [25]. This example demonstrates the adverse impact of commercial developments on air quality, and presents a rational method to quantify associated societal and economic impacts.

Discussions and Concluding Remarks

Costs associated with traffic fatalities and injuries are significantly higher than air pollution and other road user costs and should be treated as a public health issue. A significant amount of air pollutants comes from transportation-related mobile sources, including highway motor vehicles and aviation activities. Air pollution costs are generally related to vehicle-miles traveled at some estimated average fleet speed. This implies that urban areas with higher traffic volume and roadway lane miles will be associated with higher levels of pollution, especially during congestion conditions. If any of these areas monitored by the EPA exceeds the established pollution threshold standard, it may lose federal funding for construction of new transportation projects. This may adversely affect its prosperity and economic growth, which will increase societal costs due to lost revenues.
Traditional procedures of life-cycle cost analysis do not include the effects of safety and pollution in the analysis. The inclusion of the societal costs in a comprehensive life-cycle analysis will lead to a more meaningful and accurate analysis of the costs and benefits. It has been shown that the societal cost is 33% of the full transportation costs, which is significant. A comprehensive approach should be taken to analyze and solve these safety and health problems, and related costs should be used in life-cycle analyses. Candidate strategies for transportation and development projects should minimize adverse environmental impacts and improve safety. The best strategy should be selected based on the least life-cycle cost and maximum benefit after a comprehensive life-cycle analysis, while achieving the primary functions of the project.
The recommended countermeasures to the adverse effects of new built-up areas and resulting higher traffic volume on the air quality degradation include the use of cool roofing such as white-color roofing material, the use of concrete in place of asphalt for typical roadways and parking areas, and the plantation of “low-emitting” trees in new built-up areas. In addition, it is important to have good traffic flow and less periods of congestion. Sustainable transportation policies must consider the environment, transportation related health impacts, improved vehicles, and safe and improved roadways. This can be accomplished cost-effectively through effective infrastructure management systems and the use of modern remote sensing and geospatial technologies.
Figure 1. Distribution of petroleum consumption by end-use sector, 2002 [3].
Ijerph 03 00235f1
Figure 2. Intersection of Highway 6 and Jackson Ave in Oxford, Mississippi, used for one of the groundtruth studies.
Ijerph 03 00235f2
Figure 3. Hourly weighted average surface temperatures of the Highway 6-Jackson Avenue intersection area, Oxford, Mississippi, 11 July 2003.
Ijerph 03 00235f3
Table 1. Major air pollutants and their effects on public health [22, 23]
Air PollutantEndpoint of Public Health EffectEconomic Valuation -- mean estimate – (in 1990 dollars)
PMMortality$4,800,000per case*
PMChronic Bronchitis$260,000per case
OzoneChronic Asthma$25,000per case
PM, Ozone, NO2, SO2All Respiratory$6,900per case
PM, Ozone, NO2, SO2, COAll Cardiovascular$9,500per case
PM & OzoneEmergency Room visits for Asthma$ 194per case
PMAcute Bronchitis$45per case
PM & OzoneAcute Asthma; Respiratory Illness and Symptoms$32per case
PM, Ozone, NO2, SO2Acute Respiratory Symptoms$18per case
PMUpper Respiratory Symptoms$19per case
PMLower Respiratory Symptoms$12per case
PM & SO2Shortness of Breath, Chest Tightness, or Wheeze$5.30per day
PMWork Loss Days$83per day
PM & OzoneMild Restricted Activity Days$38per day

Welfare Benefits

DeciViewVisibility$14per unit change in DeciView
PMHousehold Soiling$2.50per household per PM10 change
OzoneDecreased Worker Productivity$1**
OzoneAgriculture (Net Surplus)Change in Economic Surplus
*Alternatively, equal to $293,000 for each life-year lost
**Decreased productivity valued as change in daily wages; $1 per worker per 10% increase in Ozone
Table 2. Societal costs from increased traffic and air pollution related to accident and public health effects.
Differential Societal Costs (Costs After – Costs Before)

ImpactEconomic Value, 2003 $
2 cases of chronic asthma121,998
48 cases of acute respiratory symptoms24,192
2 cases of acute cardiovascular symptoms36,774
Decrease in 1,511 outdoor workers productivity4,758
Traffic accident-related costs (81 % of total cost)807,202

Total cost, 2003$994,924
(19 % air pollution cost = 13 cents per vehicle)

Acknowledgements

This research was partially supported by a grant from the U.S. Department of Transportation Research and Special Program Administration through Mississippi State University. Thanks are due to Kanok Boriboonsomsin who developed some of the models, described in this paper, in his doctoral dissertation at the University of Mississippi. The contents of this paper reflect the views of the author who is responsible for the facts, findings, and data presented herein.

References

  1. Uddin, W.; Boriboonsomsin, K.; Garza, S. Transportation related environmental impacts and societal costs for life-cycle analysis of costs and benefits. IJP – International Journal of Pavements 2005, 4(1–2), 92–104. [Google Scholar]
  2. U.S. DOT: Federal Highway Administration, Fiscal year 2003 performance plan; Publication No. FHWA HCM-02-001; U.S. Department of Transportation, Federal Highway Administration, 2002.
  3. Stacy, C.D.; Diegel, S.W. Transportation energy data book: Edition 24. In ORNL-6793; Oak Ridge National Laboratory, 2003. [Google Scholar]
  4. Metschies, G.P. Fuel prices and taxation; GTZ: Germany, 1999. [Google Scholar]
  5. Physical conditions of the interstate highway system have improved, but congestion and other pressures continue. In Highway Infrastructure, Report Number GAO-02-1128T; General Accounting Office (GAO): Washington, DC, 2002.
  6. Environmental Protection Agency USA. 2003. http://www.epa.gov/air/airtrends/2003ozonereport/lookat2003.html#measuring.
  7. World Health Organization. World report on road traffic injury prevention. 2004. http://www.who.int/world-health-day/2004/infomaterials/world_report/en/summary_en_rev.pdf.
  8. Deadliest states for driving - Rural states, especially in the West, have the highest traffic fatality rates. CNN/Money. 2004. http://money.cnn.com/2004/08/26/pf/autos/state_traffic_deaths_table/index.htm.
  9. Strategies for improving roadside safety. In Research Results Digest 220; Transportation Research Board, National Research Council: Washington, DC, 1997.
  10. Does the built environment influence physical activity? Examining the evidence. In TRB Special Report 282; The National Academies Press: Washington, DC, 2005.
  11. Heat Island Group. http://eande.lbl.gov/HeatIsland/ Accessed April 2, 2003.
  12. U.S. Environmental Protection Agency. National air quality and emissions trends. Report, EPA-454/R-98-016. 1997. www.epa.gov/oar/aqtrnd97 Accessed on April 13, 2003.
  13. Rudolph, K. Air quality management in metropolitan urban areas of the South Central United States. In M.S. Graduate Report; Department of Civil Engineering, The University of Mississippi, 2005. [Google Scholar]
  14. Gires, Jean-Michel. Hydrocarbons challenges for long term sustainable transportation. Environment 2005 - International Conference On Sustainable Transportation in Developing Countries, Abu Dhabi, UAE; 2005. [Google Scholar]
  15. Estimating the public health benefits of proposed air pollution regulations. In National Research Council Report; The National Academies Press: Washington, D.C, 2002.
  16. Boriboonsomsin, K.; Uddin, W. A simplified methodology to estimate emissions from mobile sources for ambient air quality assessment. J Transportation Engineering 2006. [Google Scholar]
  17. Murphy, J.J.; Delucchi, M.A. A review of the literature on the social cost of motor vehicle use in the United States. J Transportation and Statistics 1998, 1(1), 15–42. [Google Scholar]
  18. Miller, P.; Moffet, J. The price of mobility: uncovering the hidden costs of transportation; New York, NY; Natural Resources Defense Council, 1993. [Google Scholar]
  19. Small, K.A.; Kazimi, C. On the costs of air pollution from motor vehicles. J Transportation Economics and Policy 1995. [Google Scholar]
  20. U.S. Department of Transportation. Indirect benefits, congestion mitigation and air quality improvement program. FHWA-PD-97-045 1997.
  21. Rosenfeld, A.; Akbari, H.; Taha, H.; Pomerantz, M. Cool roofs and pavements to help hot smoggy cities. Materials for the new millennium: Proceedings of the Fourth Materials Engineering Conference, Washington, DC; 1996; pp. 1–13. [Google Scholar]
  22. U.S. Environmental Protection Agency, The benefits and costs of the clean air act, 1970 to 1990. In Report, EPA-410-R-97-002, Final Report to U.S. Congress; 1997.
  23. U.S. Environmental Protection Agency, The benefits and costs of the clean air act, 1990 to 2010. In Report, EPA-410-R-99-001, Final Report to U.S. Congress; 1999.
  24. Boriboonsomsin, K. Transportation-related air quality modeling and analysis based on remote sensing and geospatial data. Ph.D. Dissertation, Department of Civil Engineering, The University of Mississippi, 2004. [Google Scholar]
  25. Barnes, G.; Langworthy, P. The per-mile costs of operating automobiles and trucks. Report No. MN/RC 2003-19; Minnesota Department of Transportation, 2003. http://www.lrrb.gen.mn.us/pdf/200319 Accessed on April 8, 2004.

