

Aircraft Noise Reduction Strategies and Analysis of the Effects


School of Mechanical and Electrical Engineering, Guangzhou University, 230 Wai Huan Xi Road, Guangzhou 510006, China
*
Author to whom correspondence should be addressed.
Int. J. Environ. Res. Public Health 2023, 20(2), 1352; https://doi.org/10.3390/ijerph20021352
Submission received: 7 December 2022
/
Revised: 4 January 2023
/
Accepted: 7 January 2023
/
Published: 11 January 2023
(This article belongs to the Special Issue Environmental Acoustics Assessments in Urban and Suburban Contexts)
Abstract
:In this study, six aircraft noise reduction strategies including the optimization of aircraft type, regulation of night flight number, optimization of flight procedure, modification of operating runway, land use planning and installation of sound insulation windows were proposed to alleviate the harmful impact of aircraft noise on the local area and population near Guangzhou Baiyun International Airport (BIA) in China. The effects of all proposed strategies except for land use planning and sound insulation windows were simulated and analyzed using CadnaA software. The results indicate that these noise reduction strategies have their own advantages and each of them can serve as an effective noise reduction measure for different applications. For instance, the replacement of noisy aircraft with low-noise aircraft can simultaneously reduce the area and population exposed to a high noise level, while the optimization of flight procedure can only reduce the population exposed under relatively low noise levels ( ≤ 75 dB). Nevertheless, the modification of operating runway is more effective in reducing the population suffering under high noise levels ( > 85 dB). Among these strategies, reducing the number of night flights is found to be most effective in reducing the overall noise-exposed area and population. Additionally, with the assistance of noise mapping, proper land use planning was suggested according to national standards, and the installation of sound insulation windows with different sound reduction grades can be determined for different areas impacted by the aircraft noise of BIA. It is believed that the results of this study can be applied as a reference in selecting suitable noise reduction strategies to improve the acoustic environment of a specific airport.
1. Introduction
According to the latest report of the International Air Transport Association [1], global air passenger traffic is expected to exceed the pre-pandemic level in 2024. A forecast report by Airbus [2] predicted that global air passenger traffic will continue to grow at an annual growth rate of 3.6% from 2019 to 2041. Therefore, the global air transport industry will continue to grow rapidly in the future, which will further aggravate global aircraft noise pollution. As we all know, aircraft noise will affect the health of residents around the airport. Existing research showed that aircraft noise will damage people’s hearing [3,4], increase level of worries [5,6], interfere with people’s sleep [7,8] and affect their mental health [9]. In addition, aircraft noise will increase the probability of attention deficit hyperactivity disorder among children [10] and even increase the risk of cardiovascular diseases such as hypertension and coronary heart disease [11,12].
Nowadays, countries all over the world have promulgated aircraft noise regulations to control aircraft noise pollution, which is forcing airports to adopt various noise reduction measures. For example, the European Union environmental noise regulation 2002/49/EC [13] requires Member States to update the noise map every five years to assess the pollution level of aircraft noise. Up to 2009, at least 615 airports around the world had conducted noise reduction measures; most of them were Western countries [14]. Some airports around the world use fines or impose noise taxes in order to encourage airlines to adopt quieter aircraft [15]. Sound insulation measures for surrounding buildings taken by several airports in Spain were able to reduce the impact of aircraft noise on communities [16]. The findings of Postorino et al. [17] and Prats et al. [18] showed that optimizing the takeoff track of aircraft could effectively reduce the impact of aircraft noise on the population in noise-sensitive areas. The investigation by Vogiatzis [19] and Licitra et al. [20] showed that properly extending the runway could reduce the noise-exposed population. In addition, reasonable land use planning can effectively control aircraft noise pollution and is advantageous to the sustainable development of the airport [19,21].
From the abovementioned studies, it can be seen that the majority of these studies are conducted in Western countries. Relevant studies in China are still scarce. Lei et al. [22] evaluated the aircraft noise impacts of the third runway in Pudong International Airport. Investigations including the influences of runway location, optimized land use, selection of low noise aircrafts and Fly Quit Program were conducted. It was suggested that the restriction of high-noise aircrafts and the applications of a quiet aircraft operation program should be adopted. The same conclusions were also reported by Zhang et al. [23]. In their study, the installation of soundproof windows was suggested to mitigate aircraft noise in residential areas near Beijing Capital Airport. It was found that the overall sound insulation can reach as high as 10 dBA. Chen et al. [24] reported that for existing airports, expansion of existing ones and construction of new airports, the most effective strategy to reduce the impact of aircraft noise on local residential buildings was to design a plan for proper land use.
Up to now, studies on applying different noise reduction strategies for aircraft noise in airports have been numerous. However, systematic investigation of different noise reduction strategies for a jumbo international aviation hub is still scarce. In the present study, six noise reduction strategies including the optimization of aircraft type, regulation of number of night flights, flight procedure, modification of operating runway, land use planning and the installation of sound insulation windows were proposed to reduce the impacts of aircraft noise on the area and population near Guangzhou Baiyun International Airport (BIA) which is the international aviation hub in South China [25]. In 2020, the air passenger traffic of BIA exceeded that of Atlanta Airport, becoming the busiest airport in the world [26]. In our previous study [27], it was found that the acoustic environment quality of BIA was marginally acceptable because about 22.22% and 25.46% of the total population around BIA were exposed to the weighted equivalent continuous perceived noise level () > 70 dB. This is the other motivation of the current study, to evaluate an effective strategy to improve the acoustic conditions of BIA. Furthermore, the results of this study can also provide useful noise reduction guidelines for other jumbo airports.
2. Methodologies and Discussion of the Results
2.1. Optimization of the Aircraft Type
The first strategy proposed to reduce aircraft noise is to optimize aircraft types in the takeoff and landing stages. In the present study, the flight data of BIA during the summer and winter from 14th to 20th December 2020 and from 25th to 31st March 2021 were respectively collected to analyze the aircraft types that were operating in the airport. As shown in Figure 1, the characteristics of the aircraft types during takeoff and landing at BIA are presented. For all these aircrafts, their respective models recorded in this study are tabulated in Table A1 in the Appendix A. It can be seen that the differences of the aircraft types during summer and winter are very similar for BIA. The main aircraft models are B737-800, A321-232, A320-211, A320-232, A330-343 and B787-8R. These aircraft types account for 86.64% and 85.40% of the total aircrafts during the summer and winter, respectively. Among them, B737-800 is the most popular aircraft type found in BIA (about 35%), and hence is supposed to exert a significant impact on the overall acoustic environment.
In order to assess the noise level of different aircraft types, the Noise–Power–Distance (NPD) measurement of the main aircraft types at BIA was analyzed using the data from the aircraft noise and performance (ANP) database (Eurocontrol Experimental Centre (EEC) [29]), as shown in Figure 2. It is obvious that at the same distance between the measurement point and the aircraft track (R), the effective perceived noise level () of B737-800 is at least 5 dB higher than that of A320-232, and 10 dB higher than that of B787-8R. It is suggested that replacing B737-800 (which is the main type in BIA) with low-noise aircraft types such as A320-232 or B787-8R could be a potential solution to improve the overall acoustic conditions of the airport. In order to match the passenger capacity and unit price of B737-800, the relative data of some popular aircraft types were sourced and summarized in Table 1. By combining Figure 2 and Table 1, A320-232 was finally selected as the candidate to replace B737-800 in the following noise level assessment.
With all the collected information, CadnaA software was then employed to construct noise maps before and after replacement with low-noise aircrafts. Details of the numerical methods can be found in the previous study [27].
Since the aircraft types in the summer and winter at BIA are quite similar, as shown in Figure 1, only the summer scenario was investigated. As shown in Table 2, and Figure 3 and Figure 4, the noise reduction effects due to the replacement of aircraft types during the summer are presented. As indicated, the overall area and population that are exposed to different noise levels are reduced significantly, implying that the strategy of using low-noise aircraft types can effectively reduce the noise level of BIA. In particular, the total exposed area and population with > 70 dB are decreased by 17.90% and 26.61%, respectively. Nevertheless, for residents who are living close to the runway of the airport and hence usually suffer from the high noise levels, i.e., > 85 dB, replacing the aircraft type will not help much. Overall, it is still worthwhile for BIA to formulate relevant measures to encourage airlines to adopt low-noise aircrafts in order to improve its acoustic conditions.
2.2. Regulation of Night Flight Numbers
The other practical scheme to alleviate the harmful effects of airport noise on nearby residents is to regulate the number of night flights [14,15]. In the present study, the influence of night flights on the overall of BIA was investigated. The assessment of was according to the national standard GB9661-88 [31], and the equation to calculate is shown in the equation below.
where is the energy average of effective perceived noise level, N1, N2 and N3 are the number of aircraft during the day (7:00∼19:00), evening (19:00∼22:00) and night (22:00∼7:00), respectively.
To conduct the analysis, the daily average number of flights at BIA was collected from the airport control center. The percentages of the number of flights in the day, evening and night are summarized in Figure 5. It is noted that, similar to the aircraft types in summer and winter, the percentages of the flight numbers in different time periods are similar in the summer and winter as well. In particular, night flights during summer and winter are 227 and 200, which correspond to 18.80% and 16.51% of the total flights, respectively. From the coefficients of Equation (1), it can be understood that the contribution of flight events at night on is much greater than that during the day and evening. Hence, although the percentage of flights at night is significantly lower than that in the daytime, the impact of flights at night is suggested to be much higher than those of daytime flights on the overall noise level of the airport. To investigate the influence of night flights, this study has evaluated the impacted area and population according to two scenarios as shown below. Although these two scenarios may not be feasible in practice immediately, the results can still be used as a reference for flight planning in future for similarly large airports.
- Practice 1: transfer 50% of night flights to day and evening;
- Practice 2: transfer all night flights to day and evening (implement a curfew).
Similar to Section 2.1, the noise maps of BIA under different numbers of night flights were simulated using CadnaA software. The results are demonstrated in Table 3, and Figure 6 and Figure 7. Again, only cases during summer were investigated due to the similar daily average numbers of flights in summer and winter. From Table 3, it can be found that with transferring half of night flights (Practice 1), the exposed area and population under > 70 dB can be decreased by 17.97% and 20.54%, respectively. With increasing , the effects of reducing night flights become more significant, i.e., under > 90 dB, the exposed population can be decreased by 77.42%, which is quite pronounced. By further transferring night flights to day and evening, i.e., in Practice 2, the exposed area and population can be further decreased as expected. The results show that in Practice 2 under > 70 dB, the exposed area and population can be reduced by 39.03% and 43.43%, respectively, which are about twice the effect of Practice 1. Particularly, for > 90 dB, there would be no people suffering under such a high noise level under Practice 2.
Figure 6 shows the space areas before and after the implementation of Practice 1 and 2 under > 70 dB. As can be seen, the main areas influenced by regulating night flight numbers are largely in the takeoff and approaching areas, while in the area that is close to the airport, that influence becomes negligible. It is suggested that the planning of flights should be considered together with land use planning in order to minimize the impact of aircraft noise. Figure 7 further illustrates the comparisons of the impacted area and population under different noise levels with/without the regulation of night flights. It is obvious that both the impacted area and population decrease with the decreasing of night flights, particularly for populations suffering under a higher noise level.
2.3. Optimization of the Flight Procedure
In general, people will be seriously affected by aircraft noise if an aircraft just flies over them. Hence, for an airport where thousands of flights take off or land daily, the nearby residents are more easily exposed to the aircraft noise. Logically, the total population that is affected by aircraft noise can be reduced if the aircraft avoids passing through the densely populated area near an airport. For BIA specifically, the buildings below the takeoff track of runway 02L/20R are sparsely distributed (refer to Section 2.1 in Lee et al. [27] for the details of this runway). Thus, the population affected by the aircraft noise of BIA can be reduced by optimizing the takeoff track of runway 02L/20R. As shown in Figure 8, optimized takeoff tracks in summer and winter were proposed according to current geographical conditions near BIA. In particular, the red solid line is the existing takeoff track, while the red dash line is the optimized takeoff track.
The modified flight procedure according to geographical conditions is as follows.
- 3.
- Summer: Change the flight procedures of T-20R-A, T-20R-B and T-20R-C (refer to Section 2.3 in Lee et al. [27] for the details of flight procedure) of runway 20R to “after taking off from runway 20R, turn left at 71° (turning radius = 2.0 km), then fly straightly......”, as shown in Figure 8a.
- 4.
- Winter: Change the flight procedures of T-02L-A, T-02L-B and T-02L-C of runway 02L to “after taking off from runway 02L, turn right at 61° (turning radius = 2.0 km), then fly straightly......”, as shown in Figure 8b.
With the information on existing and optimized takeoff tracks, noise reduction effects due to modified flight procedure in summer and winter were evaluated using CadnaA software. In Figure 8, the yellow solid line covers the area under > 70 dB for the existing takeoff track, and the yellow dashed line covers the area under > 70 dB for the optimized takeoff track. In Table 4, the differences of the impacted areas and populations under the existing and optimized tracks are summarized. It can be seen that the areas under different noise levels remain almost the same before and after the modified flight procedure. This is expected, since the overall flights and aircraft types are the same before and after the change in flight procedure. Nevertheless, the exposed populations in the noise-affected areas in summer and winter under > 70 dB can be reduced by 18.50% and 10.94%, respectively. This implies that a simple optimization of flight procedure can easily reduce the impact of aircraft noise on surrounding residents to a certain extent, which is quite promising. From Table 4, it can be also found that for the residents suffering under a higher (i.e., > 80 dB), the effects of the modified takeoff track become negligible. This is because, for populations who suffer under a higher , they are usually residing in areas close to the airport. Due to the nature of flight procedure, it is difficult to avoid aircraft noise in these areas by changing the path of a takeoff track.
2.4. Modification of the Operating Runway
As noticed in the aforementioned results, the main areas under high noise levels are often close to both ends of the runway. Hence, it is proposed to achieve better acoustic performance of the airport by regulating the operating scheme of the runways. In this study, the runway 20L/02R of BIA (for landing only) was taken as the objective to investigate aircraft noise under the modified operating schemes in summer and winter, as shown in Figure 9. Specifically, the modifications are aimed at making the actual operating runway closer to the airport itself so that the affected area under the propagation of aircraft noise at landing can be reduced. The proposed operating schemes of runway 20L/02R in summer and winter are as follows.
- It is assumed that runway 20L/02R (3800 m) can be extended in both south and north directions by 600 m, by which the extended runway is still located within the airport region, as shown in Figure 9;
- Summer: The wind is mainly blowing from south to north direction, BIA only uses the proposed new runway 20LN as shown in Figure 10. The white and black circles are the end of the landing and non-landing zones of the runway, respectively;
- Winter: The wind is mainly blowing from north to south direction, BIA is assumed to use the new runway 02RN as shown in Figure 11. The white and black circles are the end of the landing and non-landing zones of the runway, respectively.
It should be noted that the lengths of these modified operating runways are still 3800 m, meaning the operating runways 20L/02R are overall moved 600 m to the south and north directions during summer and winter, respectively. As shown in Figure 10 and Figure 11, it is obvious that by moving the runways in summer and winter, the areas covered by the noise profiles of higher noise levels such as = 85 dB and 90 dB are reduced significantly at the end of the landing zone (white circles). Consequently, the population exposed to high noise levels decreases significantly, as tabulated in Table 5. For instance, the exposed population in the area with > 85 dB decreases by 32.17% and 49.22% during summer and winter, respectively. In addition, no more people are exposed to noise levels higher than 90 dB. It is worth mentioning that although the non-landing zones (black circles) of the new runways (20LN/02RN) are closer to the residential buildings, the simulation results show that the noise profiles of the non-landing zones do not change significantly. This is because the taxiing distance required for an aircraft to land is always shorter than the length of the runway [32], so no aircraft is taxiing at the end of the non-landing zone. Figure 12 clearly indicates that the modification of the operating runway is more effective at alleviating unfavorable effects on the population that suffers under a high noise level (i.e., > 85dB). Hence, the application of such an approach would be superior when the population is dense at the near end of the landing zone.
![Ijerph 20 01352 g010]()
![Ijerph 20 01352 g011]()
![Ijerph 20 01352 g012]()
Figure 10.
Noise contours (a) before and (b) after runway extension during summer.

Figure 11.
Noise contours (a) before and (b) after runway extension during winter.

Figure 12.
Noise reduction rates by extending the runway during (a) summer and (b) winter.

2.5. Land Use Planning
To minimize the effects of aircraft noise on the surrounding areas of an airport, good land use planning is another active approach. Reasonable planning of land use can not only control aircraft noise pollution effectively, but also allows the harmonious development of the airport and society simultaneously. As shown in Figure 13, the existing land use map around BIA is plotted based on the categorization from Table A2. Based on the practices of the Federal Aviation Administration [33] and published methodology [34,35], the land use planning around BIA is determined as shown in Table 6. In this table, “Y” and “N” indicate that buildings are allowed and not allowed to be built, respectively. The numbers 20/25/30/35 indicate that the existing buildings in the area shall conduct noise reduction measures to make sure the differences between the outdoor and indoor noise levels shall reach at least 20/25/30/35dB, respectively. “N (20/25/30)” indicates that it is not allowed to construct new buildings. If the construction of a new building is necessary, the differences between the outdoor and indoor noise levels shall reach at least 20/25/30 dB for the new buildings. Furthermore, “M” in Table 6 indicates that the residents living in these areas should be relocated to avoid harmful effects from the high aircraft noise. With such analysis, relevant departments can properly plan the land use around BIA by referring to Figure 13 and Table 6.
2.6. Installation of Sound Insulation Windows
Aside from the aforementioned active approaches, a passive approach such as installing sound insulation windows could be another viable way, according to Section 2.5. In our previous studies [36,37], sound insulation windows have been successfully developed and employed to mitigate outdoor noise such as traffic noise in a residential building. Furthermore, in an effort to reduce the impact of outdoor aircraft noise, researchers have also tried to take similar sound insulation measures in airports in Spain [38]. In the present study, efforts have been also made to guide the installation of sound insulation windows near BIA according to the noise map obtained from the CadnaA analysis.
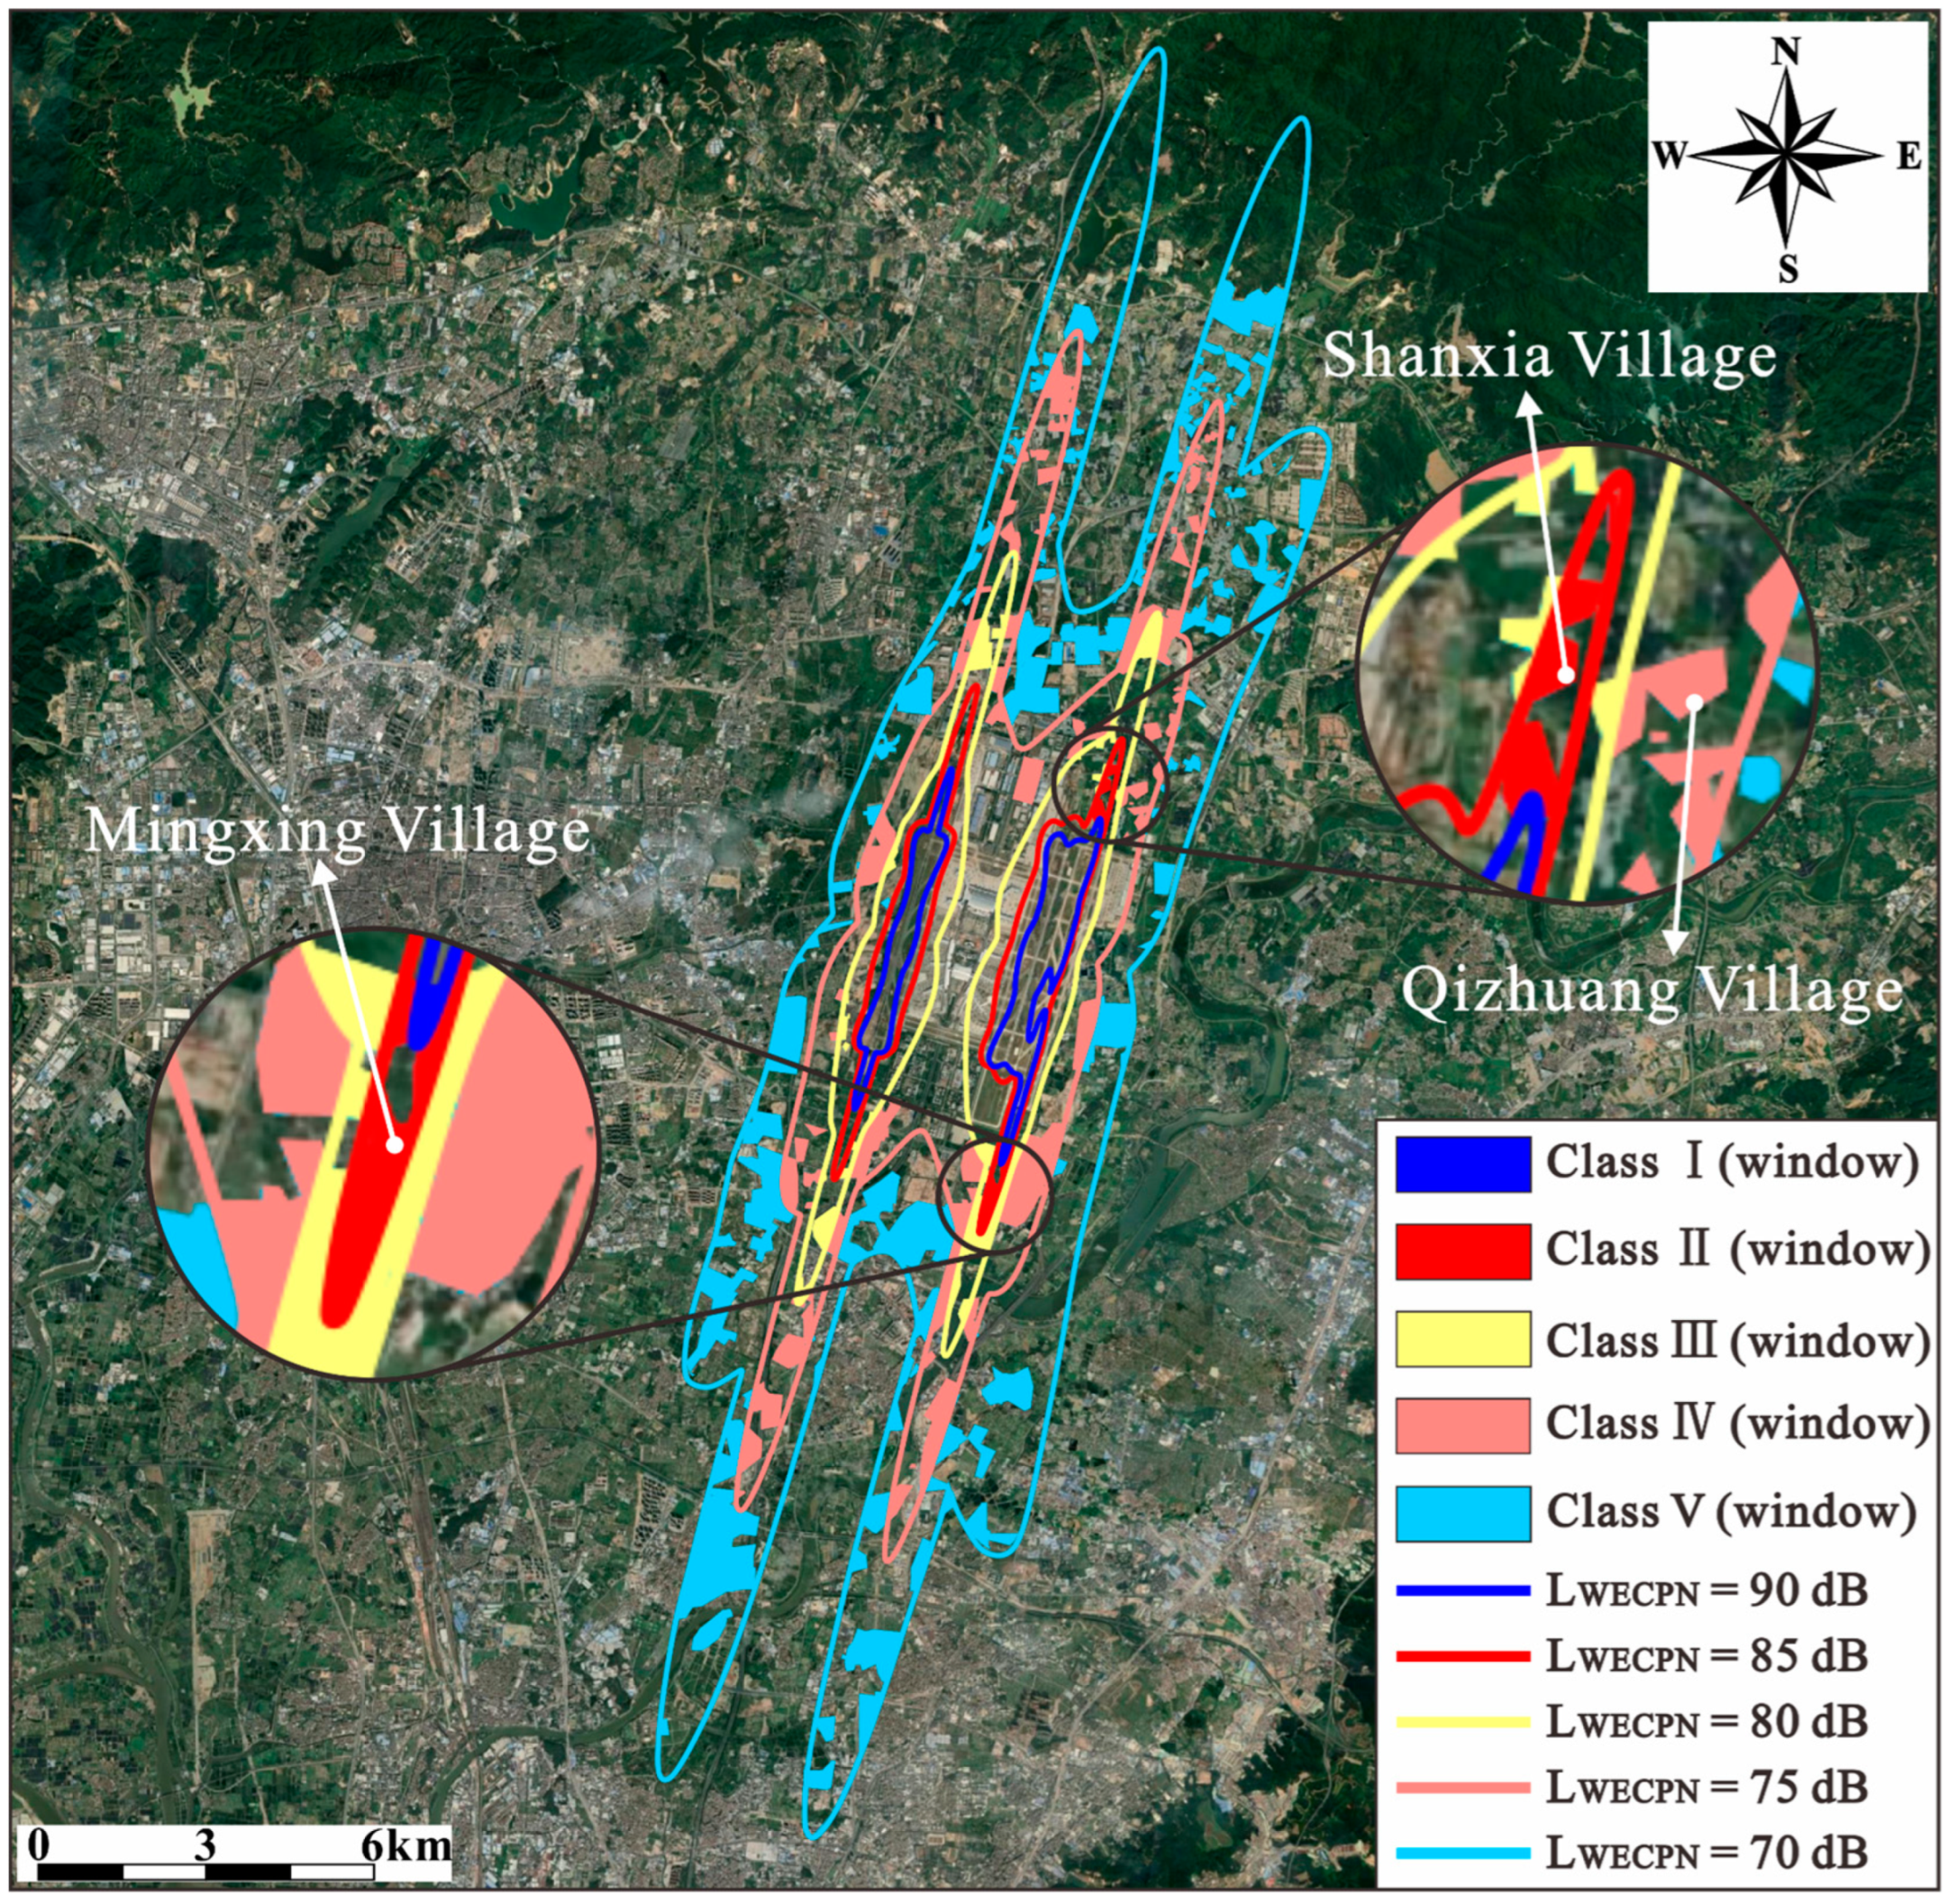
Table 7 tabulates the grades of sound insulation windows in terms of their weighted sound reduction index and their potential application areas based on . The standards of grades are according to the regulations of “Windows for Sound Insulation” (HJ/T17-1996) [39] and “Code for Design of Sound Insulation of Civil Buildings” (GB 50,118-2010) [40]. It should be noted that the sound insulation windows indicated in Table 7 are supposed to be installed in noise-sensitive buildings such as schools, hospitals, etc. As shown in Figure 14, with the assistance of the noise map, the grades of sound insulation windows to be installed in different areas surrounding BIA can be determined. In particular, the buildings in the areas usually suffering under high noise levels, such as those near both ends of runway 20L/02R, have been enlarged for a better view. As can be seen, for these areas at the ends of runway 20L/02R, better grades of sound insulation windows are necessary to protect people from the annoyance of aircraft noise indoors.
3. Conclusions
In this study, six noise reduction measures were proposed to improve the acoustic environment of an international jumbo airport (BIA). CadnaA software was the simulation platform used for the data analysis. The effectiveness of these strategies in reducing the impact of aircraft noise was assessed according to the exposed areas and populations under different noise levels. The results showed that by using low-noise aircraft (A320-232) instead of high-noise aircraft (B737-800), the area and population around BIA under different noise levels can be effectively reduced. Under the noise level > 70 dB, the overall exposed area and population can be decreased by 17.90% and 26.61%, respectively.
Reducing the number of night flights is found to be most significant factor in decreasing the overall noise level of BIA. In particular, the implementation of a curfew could reduce the noise-exposed area and population by 39.03% and 43.43%, respectively. In terms of the geographical conditions near BIA, change of flight procedures is an effective way to reduce the population under the noise level ranging from 70 dB to 75 dB (18.45% and 10.94%) during summer and winter, respectively. Nevertheless, this approach will not help in reducing the noise-exposed area. Based on the unique climate characteristics of BIA, the modified operating runway 02R/20L (extended at both ends) could greatly reduce the population suffering under a high noise level > 85 dB (32.17% and 49.22% reduction during summer and winter, respectively) without exceeding the airport region.
In addition, this study has also made an effort to construct a land use map around BIA and develop a new land use plan based on different land types. With such a plan, more people can be protected from being affected by aircraft noise. Furthermore, with the assistance of the noise map, the grades of sound insulation windows to be installed in different areas surrounding BIA can be determined according to the national standards. These results could be of great help for relevant departments to develop policies for existing or new buildings to adopt proper sound insulation windows to ensure healthy acoustic conditions in indoor environments. It is believed that the outcomes of the current study can not only be used as references to reduce the aircraft noise level of BIA, but also provide valuable guidelines for other large-scale airports to mitigate aircraft noise.
Author Contributions
Conceptualization, H.M.L.; methodology, L.Z.; software, L.Z.; validation, L.Z.; formal analysis, L.Z.; investigation, L.Z.; resources, H.M.L. and J.X.; data curation, L.Z.; writing—original draft preparation, H.M.L.; writing—review and editing, H.M.L.; visualization, J.X.; supervision, H.M.L. and J.X.; project administration, H.M.L.; funding acquisition, H.M.L. and J.X. All authors have read and agreed to the published version of the manuscript.
Funding
This research was funded by Natural Science Foundation of Guangdong Province (2019A1515012223, 2021A1515012269), National Natural Science Foundation of China (51908142) and Guangzhou Basic Research Program—City School (College) Joint Funding Project (202102010384, 202102010410).
Institutional Review Board Statement
Not applicable.
Informed Consent Statement
Not applicable.
Data Availability Statement
Data is contained within the article.
Conflicts of Interest
The authors declare no conflict of interest. The funders had no role in the design of the study; in the collection, analyses, or interpretation of data; in the writing of the manuscript, or in the decision to publish the results.
Nomenclature
| Symbol | |
| Weighted equivalent continuous perceived noise level | |
| R | The distance between the measurement point and the aircraft track |
| Effective perceived noise level | |
| Energy average of effective perceived noise level | |
| , , | The number of aircrafts during day (7:00∼19:00), evening (19:00∼22:00) and night (22:00∼7:00) |
| Weighted sound reduction index | |
| Noise limit of weighted equivalent continuous perceived noise level | |
| Noise limit of A-weighted maximum sound pressure level | |
| Abbreviations | |
| BIA | Guangzhou Baiyun International Airport |
| NPD | Noise–Power–Distance data |
| ANP | Aircraft noise and performance |
| EEC | Eurocontrol Experimental Centre |
Appendix A

Table A1.
Aircraft model at BIA [29].
Table A1.
Aircraft model at BIA [29].
| Type | Model |
|---|---|
| B737-800 | B737-800 |
| A320-211 | A320-231, A320-212, A320-214, A320-215, A320-216, A320-251N, A320-252N |
| A320-232 | A320-231, A320-232, A320-233, A320-271N |
| A321-232 | A21N, A321 |
| A330-343 | A330-243, A330-341, A330-342, A330-343 |
| B787-8R | B787-9, B787-8 |
Table A2.
Noise limits and sensitivity of different land types around the airport [41]. is the noise limit of weighted equivalent continuous perceived noise level. is the noise limit of A-weighted maximum sound pressure level.
Table A2.
Noise limits and sensitivity of different land types around the airport [41]. is the noise limit of weighted equivalent continuous perceived noise level. is the noise limit of A-weighted maximum sound pressure level.
| Land Type | Coverage | Sensitivity | Noise Limit | |
|---|---|---|---|---|
| I | Residential, school, hospital, etc. | Sensitive | = 70 dB | = 90 dBA |
| II | Administrative, commercial, etc. | Quite sensitive | = 75 dB | |
| III | Industry, warehousing, entertainment, park, plaza, etc. | Less sensitive | = 80 dB | - |
| IV | Transportation, public facilities, mining, agriculture, waters, etc. | Not sensitive | - | |
References
- Air Passenger Numbers to Recover in 2024. Available online: https://www.iata.org/en/pressroom/2022-releases/2022-03-01-01/ (accessed on 11 November 2022).
- Global Market Forecast 2022; Technical Report; Airbus: Toulouse, France, 2022.
- Sayed, A.A. A Case Study of Cairo Airport Noise for Preserving Worker’s Hearing in Egypt. Acta Acust. United Acust. 2014, 100, 118–125. [Google Scholar] [CrossRef]
- Chen, T.J.; Chen, S.; Hsieh, P.Y.; Chiang, H.C. Auditory Effects of Aircraft Noise on People Living Near an Airport. Arch. Environ. Health 1997, 52, 45–50. [Google Scholar] [CrossRef] [PubMed]
- Babisch, W.; Houthuijs, D.; Pershagen, G.; Cadum, E.; Katsouyanni, K.; Velonakis, M.; Dudley, M.L.; Marohn, H.; Swart, W.; Breugelmans, O.; et al. Annoyance due to aircraft noise has increased over the years—Results of the HYENA study. Environ. Int. 2009, 35, 1169–1176. [Google Scholar] [CrossRef] [PubMed]
- Di, G.; Liu, X.; Shi, X.; Li, Z.; Lin, Q. Investigation of the relationship between aircraft noise and community annoyance in China. Noise Health 2012, 14, 52–57. [Google Scholar]
- Kim, S.J.; Chai, S.K.; Lee, K.W.; Park, J.B.; Min, K.B.; Kil, H.G.; Lee, C.; Lee, K.J. Exposure–Response Relationship Between Aircraft Noise and Sleep Quality: A Community-based Cross-sectional Study. Osong Public Health Res. Perspect. 2014, 5, 108–114. [Google Scholar] [CrossRef] [Green Version]
- Nassur, A.M.; Lefèvre, M.; Laumon, B.; Léger, D.; Evrard, A.S. Aircraft Noise Exposure and Subjective Sleep Quality: The Results of the DEBATS Study in France. Behav. Sleep Med. 2019, 17, 502–513. [Google Scholar] [CrossRef] [Green Version]
- Wright, D.M.; Newell, K.; Maguire, A.; O’Reilly, D. Aircraft noise and self-assessed mental health around a regional urban airport: A population based record linkage study. Environ. Health 2018, 17, 74. [Google Scholar] [CrossRef] [Green Version]
- Haines, M.M.; Stansfeld, S.A.; Brentnall, S.; Head, J.; Berry, B.; Jiggins, M.; Hygge, S. The West London Schools Study: The effects of chronic aircraft noise exposure on child health. Psychol. Med. 2001, 31, 1385–1396. [Google Scholar] [CrossRef]
- Rosenlund, M.; Berglind, N.; Pershagen, G.; Jarup, L.; Bluhm, G. Increased prevalence of hypertension in a population exposed to aircraft noise. Occup. Environ. Med. 2001, 58, 769–773. [Google Scholar] [CrossRef] [Green Version]
- Hansell, A.L.; Blangiardo, M.; Fortunato, L.; Floud, S.; Hoogh, K.D.; Fecht, D.; Ghosh, R.E.; Laszlo, H.E.; Pearson, C.; Beale, L. Aircraft noise and cardiovascular disease near Heathrow airport in London: Small area study. Br. Med. J. 2014, 348, g3504. [Google Scholar] [CrossRef] [Green Version]
- Directive 2002/49/EC of the European Parliament and of the Council of 25 June 2002 Relating to the Assessment and Management of Environmental Noise Declaration by the Commission in the Conciliation Committee on the Directive Relating to the Assessment and Management of Environmental Noise; Technical Report; European Communities: Luxembourg, 2002.
- Netjasov, F. Contemporary measures for noise reduction in airport surroundings. Appl. Acoust. 2012, 73, 1076–1085. [Google Scholar] [CrossRef]
- Girvin, R. Aircraft noise-abatement and mitigation strategies. J. Air Transp. Manag. 2009, 15, 14–22. [Google Scholar] [CrossRef]
- Asensio, C.; Pavón, I.; Recuero, M.; Ausejo, M. Airport Noise Insulation Programs: The Spanish Case. Noise Vib. Worldw. 2012, 43, 8–15. [Google Scholar] [CrossRef]
- Postorino, M.N.; Mantecchini, L. A systematic approach to assess the effectiveness of airport noise mitigation strategies. J. Air Transp. Manag. 2016, 50, 71–82. [Google Scholar] [CrossRef]
- Prats, X.; Puig, V.; Quevedo, J. A multi-objective optimization strategy for designing aircraft noise abatement procedures. Case study at Girona airport. Transport. Res. Part D-Transport. Environ. 2011, 16, 31–41. [Google Scholar] [CrossRef]
- Vogiatzis, K. Airport environmental noise mapping and land use management as an environmental protection action policy tool. The case of the Larnaka International Airport (Cyprus). Sci. Total Environ. 2012, 424, 162–173. [Google Scholar] [CrossRef]
- Licitra, G.; Gagliardi, P.; Fredianelli, L.; Simonetti, D. Noise mitigation action plan of Pisa civil and military airport and its effects on people exposure. Appl. Acoust. 2014, 84, 25–36. [Google Scholar] [CrossRef]
- Sadr, M.K.; Nassiri, P.; Mohsen, H.; Masoud, M.; Alireza, G. Assessment of land use compatibility and noise pollution at Imam Khomeini International Airport. J. Air Transp. Manag. 2014, 34, 49–56. [Google Scholar] [CrossRef]
- Lei, B.; Yang, X.; Yang, J. Noise prediction and control of Pudong International Airport expansion project. Environ. Monit. Assess. 2009, 151, 1–8. [Google Scholar] [CrossRef]
- Zhang, Q.; Yan, G.; Fang, K. Noise environment near the airport and soundproof reconstruction of residences. Noise Vib. Control 2011, 31, 75–79. [Google Scholar]
- Chen, X.; Liu, F. Civil airports’ effect on environment and countermeasures –based on the example of noise. Sci. Technol. Western China 2009, 8, 2. [Google Scholar]
- Airport Overview. Available online: https://www.gbiac.net/byairport-web/menu/index?urlKey=airport-basic-facts_en (accessed on 11 November 2022).
- Guangzhou Baiyun International Airport Becomes World’s Busiest Airport in 2020. Available online: https://www.globaltimes.cn/page/202101/1213887.shtml (accessed on 11 November 2022).
- Xie, J.; Zhu, L.; Lee, H.M. Novel Methodologies for the Development of Large-Scale Airport Noise Map. Sustainability 2022, 14, 6573. [Google Scholar] [CrossRef]
- Guangzhou Baiyun International Airport. Available online: https://www.flightradar24.com/ (accessed on 11 November 2022).
- The Aircraft Noise and Performance (ANP) Database: An international data resource for aircraft noise modellers. Available online: https://www.aircraftnoisemodel.org/home (accessed on 16 October 2021).
- Aircraft Pricing. Available online: http://www.axonaviation.com/commercial-aircraft/aircraft-data/aircraft-pricing (accessed on 11 November 2022).
- Measurement of Aircraft Noise Around Airport; Technical Report GB9661-88; Ministry of Environmental Protection of the People’s Republic of China: Beijing, China, 1988.
- Landing Distance. Available online: https://mediawiki.ivao.aero/index.php?title=Landing_distance (accessed on 11 November 2022).
- Airport Noise Compatibility Planning; Technical Report 14 CFR Part 150; Federal Aviation Administration, Department of Transportation: Washington, DC, USA, 2011.
- Bai, L.; Li, Y.; Tian, A. Control Measures of Civil Airport Aircraft Noise Pollution. Pollut. Control Technol. 2010, 23, 82–84. [Google Scholar]
- Zhang, M.; Tian, T.; Cheng, S. Research on Sound Controlled Classification in Environmental Planning—A Case Study of Longjia Airport in Changchun City. Environ. Sci. Manag. 2016, 41, 31–36. [Google Scholar]
- Lee, H.M.; Haris, A.; Lim, K.M.; Xie, J.; Lee, H.P. Environmental Noise Mitigation by Plenum Window with Sonic Crystals and Jagged Flap. Fluct. Noise Lett. 2019, 18, 1950001. [Google Scholar] [CrossRef]
- Lee, H.M.; Wang, Z.; Lim, K.M.; Xie, J.; Lee, H.P. Novel plenum window with sonic crystals for indoor noise control. Appl. Acoust. 2020, 167, 107390. [Google Scholar] [CrossRef]
- Asensio, C.; Recuero, M.; Pavón, I. Citizens’ perception of the efficacy of airport noise insulation programmes in Spain. Appl. Acoust. 2014, 84, 107–115. [Google Scholar] [CrossRef]
- Windows for Sound Insulation; Technical Report HJ/T 17—1996; Ministry of Environmental Protection of the People’s Republic of China: Beijing, China, 1996.
- Code for Design of Sound Insulation of Civil Buildings; Technical Report GB 50118-2010; Ministry of Housing and Urban-Rural Development of the People’s Republic of China: Beijing, China, 2011.
- Environmental Quality Standard for Airplane Noise in the Vicinity of Airports (Second Solicit Opinion Draft); Technical Report; Ministry of Ecology and Environment of the People’s Republic of China: Beijing, China, 2017.
Figure 1.
Proportions of the aircraft types that take off and land at BIA during (a) summer and (b) winter [28].
Figure 1.
Proportions of the aircraft types that take off and land at BIA during (a) summer and (b) winter [28].

Figure 2.
NPD curve of the main aircraft types at BIA (thrust = 19,000 lb).

Figure 3.
Noise contours before and after using the low-noise aircraft type during summer.

Figure 4.
Noise reduction effects before and after using the low-noise aircraft type during summer: (a) area; (b) population.
Figure 4.
Noise reduction effects before and after using the low-noise aircraft type during summer: (a) area; (b) population.

Figure 5.
Proportions of the number of day, evening and night flights at BIA during (a) summer and (b) winter [28].
Figure 5.
Proportions of the number of day, evening and night flights at BIA during (a) summer and (b) winter [28].

Figure 6.
Noise contours before and after the reduction in night flights in two practices during summer.
Figure 6.
Noise contours before and after the reduction in night flights in two practices during summer.

Figure 7.
Noise reduction effects before and after the reduction in night flights in two stages during summer. (a) area (b) population.
Figure 7.
Noise reduction effects before and after the reduction in night flights in two stages during summer. (a) area (b) population.

Figure 8.
Noise contours before and after optimization of flight procedure during (a) summer and (b) winter.
Figure 8.
Noise contours before and after optimization of flight procedure during (a) summer and (b) winter.

Figure 9.
The proposed modification of the operating runway 02R/20L.

Figure 13.
Land use map around BIA.

Figure 14.
Areas around BIA where different grades of sound insulation windows are required.

Table 1.
Information on the main aircraft types at BIA [30].
Table 1.
Information on the main aircraft types at BIA [30].
| Type | Passenger Capacity (Person) | Price (USD) |
|---|---|---|
| B737-800 | 162 | 106 million |
| A320-211 | 150 | 98 million |
| A320-232 | 150 | 98 million |
| A321-232 | 185 | 115 million |
| A330-343 | 277 | 256 million |
| B787-8R | 242 | 248 million |
Table 2.
Noise reduction effects due to aircraft type optimization during summer.
| > 70 dB | > 75 dB | > 80 dB | > 85 dB | > 90 dB | ||
|---|---|---|---|---|---|---|
| Area () | Before | 83.885 | 38.813 | 16.925 | 7.165 | 2.960 |
| After | 68.872 | 32.553 | 14.307 | 6.022 | 2.526 | |
| Percentage | 17.90% | 16.13% | 15.47% | 15.95% | 14.66% | |
| Population (person) | Before | 194,842 | 75,514 | 13,414 | 1831 | 155 |
| After | 142,995 | 57,302 | 9016 | 1785 | 146 | |
| Percentage | 26.61% | 24.12% | 32.79% | 2.51% | 5.81% |
Table 3.
Noise reduction effects by reducing the number of night flights in two stages during summer. The exposed area and population before implementation of any noise reduction strategy (see Table 2) are not shown for brevity.
Table 3.
Noise reduction effects by reducing the number of night flights in two stages during summer. The exposed area and population before implementation of any noise reduction strategy (see Table 2) are not shown for brevity.
| > 70 dB | > 75 dB | > 80 dB | > 85 dB | > 90 dB | |||
|---|---|---|---|---|---|---|---|
| Practice 1 | Area () | After | 68.808 | 31.328 | 13.683 | 5.675 | 2.300 |
| Percentage | 17.97% | 19.29% | 19.16% | 20.80% | 22.30% | ||
| Population (person) | After | 154,814 | 54,225 | 5682 | 749 | 35 | |
| Percentage | 20.54% | 28.19% | 57.64% | 59.09% | 77.42% | ||
| Practice 2 | Area () | After | 51.148 | 23.225 | 10.040 | 4.037 | 1.573 |
| Percentage | 39.03% | 40.16% | 40.68% | 43.66% | 46.86% | ||
| Population (person) | After | 110,219 | 30,283 | 2793 | 312 | 0 | |
| Percentage | 43.43% | 59.90% | 79.18% | 82.96% | 100% | ||
Table 4.
Noise reduction effects by optimizing the flight procedure during summer and winter.
| > 70 dB | > 75 dB | > 80 dB | > 85 dB | > 90 dB | |||
|---|---|---|---|---|---|---|---|
| Summer | Area () | Before | 83.885 | 38.813 | 16.925 | 7.165 | 2.960 |
| After | 83.535 | 38.505 | 16.942 | 7.164 | 2.959 | ||
| Population (person) | Percentage | 0.42% | 0.79% | −0.10% | 0.01% | 0.03% | |
| Before | 194,842 | 75,514 | 13,414 | 1831 | 155 | ||
| After | 158,803 | 65,929 | 14,205 | 1831 | 155 | ||
| Percentage | 18.50% | 12.69% | −5.90% | 0% | 0% | ||
| Winter | Area () | Before | 78.386 | 36.249 | 15.790 | 6.536 | 2.594 |
| After | 79.913 | 36.745 | 15.957 | 6.582 | 2.610 | ||
| Population (person) | Percentage | −1.95% | −1.37% | −1.06% | −0.70% | −0.62% | |
| Before | 223,261 | 76,473 | 22,260 | 4033 | 436 | ||
| After | 198,830 | 75,579 | 22,288 | 4033 | 436 | ||
| Percentage | 10.94% | 1.17% | −0.13% | 0% | 0% |
Table 5.
Noise reduction effects by extending the runway during summer and winter.
| > 70 dB | > 75 dB | > 80 dB | > 85 dB | > 90 dB | |||
|---|---|---|---|---|---|---|---|
| Summer | Area () | Before | 83.885 | 38.813 | 16.925 | 7.165 | 2.960 |
| After | 83.263 | 38.445 | 16.712 | 7.119 | 3.038 | ||
| Percentage | 0.74% | 0.95% | 1.26% | 0.64% | −2.64% | ||
| Population (person) | Before | 194,842 | 75,514 | 13,414 | 1831 | 155 | |
| After | 195,191 | 74,721 | 11,901 | 1242 | 0 | ||
| Percentage | −0.18% | 1.05% | 11.28% | 32.17% | 100% | ||
| Winter | Area () | Before | 78.386 | 36.249 | 15.790 | 6.536 | 2.594 |
| After | 80.256 | 36.881 | 15.857 | 6.611 | 2.639 | ||
| Percentage | −2.39% | −1.74% | −0.42% | −1.15% | −1.73% | ||
| Population (person) | Before | 223,261 | 76,473 | 22,260 | 4033 | 436 | |
| After | 223,194 | 75,778 | 21,173 | 2048 | 0 | ||
| Percentage | 0.03% | 0.91% | 4.88% | 49.22% | 100% |
Table 6.
Land use planning under different noise levels () around BIA. “Existing” indicates the existing buildings, “new” indicates the new buildings.
Table 6.
Land use planning under different noise levels () around BIA. “Existing” indicates the existing buildings, “new” indicates the new buildings.
| Land Type | Cases | <70 dB | 70∼75 dB | 75∼80 dB | 80∼85 dB | 85∼90 dB | >90 dB |
|---|---|---|---|---|---|---|---|
| I | Existing | Y | 20 | 25 | 30 | M | M |
| New | Y | N (20) | N | N | N | N | |
| II | Existing | Y | Y | 25 | 30 | 35 | M |
| New | Y | Y | N (25) | N (30) | N | N | |
| III | Existing | Y | Y | Y | 25 | 30 | 35 |
| New | Y | Y | Y | N (25) | N (30) | N | |
| IV | New | Y | Y | Y | Y | Y | Y |
Disclaimer/Publisher’s Note: The statements, opinions and data contained in all publications are solely those of the individual author(s) and contributor(s) and not of MDPI and/or the editor(s). MDPI and/or the editor(s) disclaim responsibility for any injury to people or property resulting from any ideas, methods, instructions or products referred to in the content. |
© 2023 by the authors. Licensee MDPI, Basel, Switzerland. This article is an open access article distributed under the terms and conditions of the Creative Commons Attribution (CC BY) license (https://creativecommons.org/licenses/by/4.0/).
Share and Cite
MDPI and ACS Style
Xie, J.; Zhu, L.; Lee, H.M. Aircraft Noise Reduction Strategies and Analysis of the Effects. Int. J. Environ. Res. Public Health 2023, 20, 1352. https://doi.org/10.3390/ijerph20021352
AMA Style
Xie J, Zhu L, Lee HM. Aircraft Noise Reduction Strategies and Analysis of the Effects. International Journal of Environmental Research and Public Health. 2023; 20(2):1352. https://doi.org/10.3390/ijerph20021352
Chicago/Turabian StyleXie, Jinlong, Lei Zhu, and Hsiao Mun Lee. 2023. "Aircraft Noise Reduction Strategies and Analysis of the Effects" International Journal of Environmental Research and Public Health 20, no. 2: 1352. https://doi.org/10.3390/ijerph20021352
Note that from the first issue of 2016, this journal uses article numbers instead of page numbers. See further details here.