Seasonal Impacts of Particulate Matter Levels on Bike Sharing in Seoul, South Korea


Department of Urban Design and Planning, Hongik University, 94 Wausan-ro, Mapo-gu, Seoul 04066, Korea
Int. J. Environ. Res. Public Health 2020, 17(11), 3999; https://doi.org/10.3390/ijerph17113999
Submission received: 26 March 2020
/
Revised: 31 May 2020
/
Accepted: 2 June 2020
/
Published: 4 June 2020
(This article belongs to the Special Issue The Effects of Air Pollution and Traffic Exposure in the General Population)
Abstract
:Bike sharing is increasingly attracting more riders in cities around the world for its benefits regarding the urban environment and public health. The public bike sharing program of Seoul, South Korea, first launched in October 2015, is now widely spread around the city and serves more than 27,000 riders daily. However, concerns are being raised as rising air pollution levels in Seoul, represented by particulate matter (PM) levels, in recent years may negatively discourage citizens from using bike sharing. This study investigates the impact of PM10 and PM2.5 levels on bike sharing use in Seoul and seeks to identify any seasonal differences. A series of negative binomial regression models, which take into account control variables like weather conditions and calendar events, are adopted to empirically measure the impacts. Results show that the PM levels yield statistically significant negative impacts (p < 0.01) on bike sharing use throughout the year. The impacts are particularly stronger in winter and spring, when the PM levels are higher. Findings suggest that PM levels may operate as driving factors for bike sharing use in addition to meteorological conditions like temperature, humidity, and precipitation.
1. Introduction
The use of bike sharing as a means of transportation in urban areas throughout the world grew over the last few decades. Following some of its seminal initiators of Amsterdam in the 1960s and Copenhagen in the 1990s [1,2], recent successful implementations in Paris, Lyon, and London dispersed the program to a larger number of cities around the world that seek new means of urban transportation. Statistics testify that the number of bike sharing programs in operation worldwide more than doubled since 2014 and exceeds 1600 as of 2018, where the total number of public-use bicycles worldwide also more than doubled to 18.2 million in the same period [3]. Ease of use, lower prices than other means, lack of congestion, and marriage with smart phone technologies make bike sharing ubiquitous. It attracts numerous intracity travelers, as well as large investments from both public and private sectors [4,5].
There are some criticisms, which include its benefits toward the privileged and marginalization of lower classes [6,7,8,9], little impact on reducing automobile dependency [10,11], and increasing concerns of rider safety [12,13,14]. Nevertheless, bike sharing is known to produce a wide range of benefits as research suggests. It benefits the environment by reducing car dependency so as to curtail greenhouse gas emissions [4,15,16,17,18]. Somewhat related to the first, it also relieves traffic congestion [19,20]. Another is its health contributions to the prevention of diseases and deaths by promoting physical activities [16,17,21,22,23,24]. A fourth is the lower injury and fatality outcomes compared to non-sharing environments [24,25]. Lastly, bike sharing realizes a multifaceted sharing economy by allowing cities to function more efficiently [26,27,28].
These benefits encourage cities to adopt and promote bike sharing. In doing so, key concerns of planners and policymakers often target removing barriers and developing solutions based on the varying contexts each city faces. Research is producing empirical findings to support them. One frequently addressed issue is the supply of relevant road infrastructure to create a safer and more predictable riding environment for bike sharing users [29,30]. Another would be the selection of locations for bike sharing stations to provide the most optimum level of service and access within constraints [31,32,33].
Another growing body of interest lies in the weather conditions that affect bike sharing users and present contextual differences. Several studies carried out in North America found that high temperatures and low quantity of snow positively affect bike sharing [34,35]. On the other hand, a Brisbane study reported no significant effects of temperature because of the city’s subtropical climate, while wind and rain yielded negative effects [36]. One study from Cork, a medium-size city in Ireland, argued that warmer temperatures and longer hours of sunshine promote longer trips [37]. Another from Daejeon, South Korea noted that temperatures over 30 °C, precipitation, humidity, and wind speed negatively affect bike sharing users [38]. These studies in general commonly found that bad weather conditions have adverse effects on using bikes as a commuting mode with some variances between contexts [39,40,41,42,43].
A potential issue that receives less interest but requires further investigation is the impact of air pollution on bike sharing or using bikes in general. Many studies looked into exposure of bicyclists to air pollution [44,45,46]. On the other hand, only a handful studies reported that higher air pollution levels yield a significant negative impact on bike sharing [47] and that air quality improvement has a significant positive impact [48].
Building on what was addressed so far, this study looks into Seoul, South Korea, a relatively less studied and unknown city, which enjoys rapidly growing bike sharing but at the same time suffers from chronic high levels of air pollution, including particulate matter (PM) levels [49]. Specifically, it empirically investigates how PM10 (particles with diameters equal to or less than 10 micrometers) and PM2.5 (particles with diameters equal to or less than 2.5 micrometers) levels affect bike sharing use in Seoul daily. It also examines whether seasonal differences exist in the effects and takes into consideration the wide variance found in Seoul’s annual PM levels. Findings of this study may help unveil the relationship between PM levels and bike sharing. It may also inform transportation and environmental planning and policymaking to achieve a more livable urban environment.
2. Case Context
After the successful launch of South Korea’s first bike sharing program in Changwon in 2008 [1,50], that of Seoul, or Ddareungi in local terms, started its service in October 2015. As Figure 1 illustrates, the program showed rapid growth over the past few years. From 2016 to 2019, the total annual number of trips almost decupled. In 2019, the number exceeded 16.1 million. This is comparable to that of New York City’s Citi Bike which served 17.6 million trips in 2018 [51] and also that of London’s Santander Cycles which accommodated 10.5 million in the same year [52]. Figure 2 presents that around 20,000 shared bikes and 1537 stations distributed throughout Seoul are in operation as of mid-2019.
A closer look at Seoul’s bike sharing data presents clear seasonal fluctuations over the year. As Figure 3 shows, bike sharing use is the least in winter (December–February) with usually fewer than 20,000 trips daily, and it gradually increases through spring (March–May). During summer months (June–August), the use keeps increasing at first but decreases in August. In fall (September–November), bike sharing is the most used with up to more than 60,000 trips daily but decreases toward November.
One critical issue that Seoul is currently facing is the serious air pollution levels. The city’s PM10 and PM2.5 levels maintained considerably high levels in the past few years. Especially in 2018, as Figure 4 illustrates, the number of days with PM10 levels higher than 50 micrograms per cubic meter, a World Health Organization (WHO) guideline for 24-h mean (annual mean: 20 micrograms per cubic meter), was 91, and that with PM2.5 levels surpassing 25 micrograms per cubic meter, also a WHO guideline for 24-h mean (annual mean: 10 micrograms per cubic meter), was 124. The mean PM levels of Seoul are significantly higher than those of major cities in the Organization for Economic Co-operation and Development (OECD) member countries [49]. In 2016, the annual mean PM10 level of Seoul was 40 micrograms per cubic meter, while that of Paris was 28, that of London was 23, that of Hong Kong was 34, and that of Melbourne was 19. Likewise, the annual mean PM2.5 level was 23 micrograms per cubic meter, while that of Paris was 16, that of London was 12, that of Hong Kong was 23, and that of Melbourne was 8 in the same year [53].
Exposure to PM is associated with a number of adverse health outcomes, including cardiovascular [54,55,56,57] and respiratory diseases [58,59,60] and various types of cancer [61,62,63]. Impacts on children [64], pregnant women [65], and the elderly [66,67] are reported to be more severe. In this sense, a recent OECD report warns that, by 2060, 1109 premature deaths per every one million people due to serious air pollution is expected in South Korea if further policy measures are absent [68].
Clear seasonal fluctuations characterize Seoul’s PM levels. As Figure 4 presents, some months of the year show higher PM10 and PM2.5 levels than others. Recent reports by local scientists present that heating, electricity production, and manufacturing, all of which heavily rely on fossil fuel-based energy in several neighboring countries during colder seasons, as well as the prevailing westerly winds, are responsible for up to 82% of Seoul’s PM concentration in high-PM seasons and around 30% in low-PM seasons [69]. They suggest that such fluctuations increase difficulty, inconsistency, and uncertainty in understanding Seoul’s PM levels and establishing relevant strategies and policies [70,71]. For these reasons, there is a strong need to recognize the seasonal differences when addressing Seoul’s PM levels.
3. Methods
So as to examine the effects of PM levels on bike sharing use in Seoul, this study adopts a range of variables as Table 1 summarizes. The dependent variables include daily total number of trips, total traveled distances, and total traveled times. Data were downloaded from Seoul Open Data Plaza (https://data.seoul.go.kr/), a publicly accessible website run by the Seoul Metropolitan Government.
The independent variables are daily mean PM10 and PM2.5 levels of Seoul. The local government operates 50 air quality monitoring stations (BAM-1020, Met One Instruments, Inc. (Grants Pass, OR, USA)) as of 2019. They are relatively evenly distributed throughout the city and are installed on publicly owned land. The government averages readings from each station to come up with a representative PM10 and PM2.5 level value for Seoul. The Seoul Metropolitan Government Air Quality Information (http://cleanair.seoul.go.kr/) provides related data.
Building on findings from the existing literature, a number of control variables are considered which are daily mean temperature, precipitation, mean wind speed, and mean humidity. Heavy rain (1: daily precipitation ≥15 mm; 0: daily precipitation <15 mm) and weekday (1: weekday; 0: Saturday, Sunday, and public holidays) are included as dummy variables so as to incorporate their categorial effects. Related data were acquired from the Korea Meteorological Administration (https://data.kma.go.kr/), a central government-level public agency responsible for collecting and sharing meteorological information in South Korea and providing forecasts. Due to data availability and completeness issues, the year 2018 at the daily level was used for analysis, since the number of missing values in data from 2016 and 2017 was considerably large enough to potentially distort results.
The three dependent variables are provided as mostly positive integers and a small number of zeros. This results in the need to adopt statistical models that effectively deal with count data. Furthermore, all the dependent variables present over-dispersion, meaning that the conditional variance exceeds the conditional mean, and they require using negative binomial regression for statistical analysis instead of Poisson regression because the confidence intervals are more likely to be narrower. Negative binomial regression is a highly robust statistical model favored in a wide range of fields, and it was proven to be highly effective in a number of existing studies that shared similar research interests [32,34,38,72].
So as to recognize the seasonal variations in Seoul’s PM levels and bike sharing trips, the regression models are applied to each of the four seasons, as well as for the whole year for reference. To address the problem of multiple hypothesis testing, Bonferroni correction is followed in the regression models. Moreover, since PM10 and PM2.5 levels are usually strongly correlated to each other, each regression model includes only one of the two as the independent variable. To complement and confirm the significance of the regression models, sensitivity analysis which includes seasonal dummy variables with a multiplicative interaction term is carried out (see Appendix A).
4. Results and Discussion
4.1. Results
Table 2 summarizes descriptive statistics of all variables, as well as frequencies of dummy variables, for each season. As for all seasons, an average of 27,560 trips were made daily, each traveling more than 125 million meters and 757 thousand minutes in total. The average PM10 and PM2.5 levels were 39.7 and 22.8 micrograms per cubic meter, respectively. In spring, the total number of trips and the traveled distances and times were smaller than the annual average. On average, 22,833 trips traveled around 107 million meters for 682 thousand minutes daily. The average PM10 and PM2.5 levels in spring were above the yearly average at 48.7 and 27.5, respectively.
Bike sharing in summer was used more frequently and longer. An average of 36,353 trips were made daily, and the total traveled distances and times exceeded 169 million meters and one million minutes, respectively. The average PM10 levels remained below 28, and those of PM2.5 remained at 17.8.
In fall, the numbers peaked when the number of daily trips exceeded 42 thousand, traveled distances neared 194 million meters, and traveled times reached 1.15 million minutes, while the average PM10 and PM2.5 levels were 33.3 and 17.5, respectively.
Lastly, in winter, the overall numbers for bike sharing use fell sharply as the average daily number of trips dropped to 9257. Total traveled distances and times in this season were 31.5 million meters and 182 thousand minutes, respectively, and PM10 and PM2.5 levels rose to 49.2 and 28.7, respectively.
It is noteworthy that the standard deviations of the PM10 levels in summer (12.8) and of the PM2.5 levels in summer (9.4) and fall (12.6) are smaller than other seasons. This may result in regression coefficients being insignificant because of lack of information.
Table 3 presents negative binomial regression results in estimating bike sharing use for all seasons using PM10 level data. In all three cases, the mean PM10 level presents significantly negative impacts (p < 0.01) on bike sharing use. Specifically, for a one-unit increase in the mean PM10 level, the expected log count of the number of trips decreases by 0.0034, traveled distances decrease by 0.0043, and traveled times decrease by 0.0041. Similar findings are shown with PM2.5, as Table 4 suggests. Again, the mean PM2.5 level yields significant negative influences (p < 0.01) on bike sharing use. The regression coefficients in estimating number of trips, traveled distances, and traveled times are −0.0080, −0.0094, and −0.0087, respectively. It can be interpreted that, throughout the year, bike sharing use in all three ways is negatively affected by PM10 and PM2.5 levels and that the latter shows larger impacts. With regard to the control variables, temperature presents significant positive impacts (p < 0.01) on bike sharing use, while precipitation, wind speed, and humidity exhibit negative effects (p < 0.01) in all cases.
Results for spring slightly differ. As Table 5 suggests, when estimating bike sharing use with PM10 level data, significant negative impacts (p < 0.1) are found for traveled distances and times but not for the number of trips. For a one-unit increase in the mean PM10 level, the expected log count of traveled distances decreases by 0.0029 and that of traveled times decreases by 0.0027. Table 6 presents comparable results for PM2.5. Significant negative impacts (p < 0.1) of the mean PM2.5 level are evident for traveled distances and times, and the regression coefficients are −0.0043 and −0.0041, respectively, as opposed to the number of trips. In sum, higher PM levels may not influence bike sharing trip numbers but clearly reduce the lengths of each trip distance- and time-wise. Among the control variables, temperature shows significant (p < 0.01) positive impacts, and precipitation and humidity present significant negative influences (p < 0.01) in the two models. The impacts of wind speed are no longer statistically significant.
Estimation results for summer show considerable differences. As Table 7 and Table 8 commonly suggest, PM10 and PM2.5 levels no longer operate as critical influencers on bike sharing use. Rather, temperature, precipitation, and humidity all yield significant negative impacts (p < 0.01). Results suggest that bike sharing users are more sensitive to the hot and humid weather conditions of summer and less affected by the PM levels, which are the lowest on average among the four seasons.
Fall shows relatively similar results to summer. Table 9 and Table 10 present that PM10 and PM2.5 levels do not show any clear impacts on bike sharing use. As the temperatures gradually drop in this season, higher temperatures seem to be significant positive influencers (p < 0.01), while humidity significantly reduces the use (p < 0.01). Impacts of other control variables are minimal.
Estimation results for winter are clearly different from the other seasons. As Table 11 presents, the mean PM10 level shows significant negative impacts (p < 0.01) on bike sharing use. Specifically, for a one-unit increase in the mean PM10 level, the expected log count of the number of trips decreases by 0.0152, traveled distances decrease by 0.0165, and traveled times decrease by 0.0152. PM2.5 also shows significant negative impacts (p < 0.01) on all three dependent variables, as found in Table 12. For a one-unit increase in the mean PM2.5 level, the expected log count of the number of trips decreases by 0.0174, traveled distances decrease by 0.0191, and traveled times decrease by 0.0175, demonstrating relatively larger impacts than PM10. As for the control variables, temperature generates significant positive impacts (p < 0.01) while precipitation generates significant negative impacts (p < 0.01) in both cases.
4.2. Discussion
For a more compact discussion of the results, Table 13 summarizes the coefficients of the mean PM10 and PM2.5 levels in estimating bike sharing use from each of the 10 regression models. Both PM10 and PM2.5 levels present significant negative impacts on the number of bike sharing trips, traveled distances, and traveled times in all seasons and winter, while controlling for meteorological conditions. In spring, the PM10 and PM2.5 levels show significant negative impacts on traveled distances and times, while no significant impacts are identified in summer and fall.
These results evidently demonstrate the seasonal differences that exist in the impacts of PM levels on bike sharing use in Seoul. In general, bike sharing users are largely affected by PM levels in high-PM seasons like spring and winter but not as so in low-PM seasons like summer and fall. Between spring and winter, the negative impacts of PM levels are more apparent and sizable in winter even though the mean PM10 and PM2.5 levels of the two seasons do not differ considerably from each other, as previously shown in Table 2. This may be attributed to the temperate weather conditions in spring, making bike sharing users relatively less concerned about air quality.
One noteworthy finding from the series of negative binomial regression results is the strong impacts of meteorological conditions. Similar to what previous studies identified [38,40,43], temperature was found to be statistically significant in all cases, and precipitation and relative humidity were statistically significant in a number of cases. Many of their regression coefficients presented larger impacts than those of PM10 and PM2.5 levels. Especially in summer, temperature, precipitation, and humidity strongly discourage bike sharing use, while PM levels do not make any difference. However, this does not indicate that the PM impacts are relatively minor but that they may also operate as key factors for bike sharing use in spring and winter in addition to meteorological conditions.
5. Conclusions
This study investigated how PM10 and PM2.5 levels affect bike sharing use in Seoul, South Korea, a city that experiences rapidly increasing use of bike sharing and high PM levels all year round. It also examined whether seasonal differences in the effects exist. A series of estimations using negative binomial regression models present that PM10 and PM2.5 levels negatively affect bike sharing use in winter and mostly in spring, when the PM levels are generally higher, as well as in all seasons, but show no significant impacts in summer and fall, when the levels are lower. In addition, significant impacts of meteorological conditions on bike sharing are clearly witnessed throughout the year.
There are several shortcomings of this study. It investigated only for one year due to data issues. This may weaken generalizability of the findings so as to be applied elsewhere or other times. Additional concerns, including personal preferences of bike sharing users the spatial variation of PM in Seoul, which may also affect bike sharing use, were not considered. The study did not also incorporate road congestion or safety concerns, both of which may considerably affect bike sharing use. Another shortcoming would be that the seasonal approach taken by this study may not successfully reveal critical conditions like very high-PM events which may yield different outcomes. Lastly, no distinction was made between work and non-work rides, which may yield differing outcomes when analyzed using hourly data, suggesting the need for further investigation. Future research may consider incorporating these issues into analysis, as well as considering adopting lag models to measure PM’s temporal impacts.
However, this study makes several contributions to the literature. It is one of the very first studies to empirically identify the impacts of air pollution in addition to meteorological conditions on bike sharing, and de facto the first for Seoul, taking the city’s seasonal fluctuations in PM levels and bike sharing use into account. Furthermore, it successfully unveils differences in the seasonal impacts, as well as those between the impacts of PM10 and PM2.5 levels. As a seminal research, it triggers further in-depth investigation in the near future at various levels using a wider range of information.
This study suggests some useful implications for planners and policymakers. It requires stronger omnidirectional measures to be adopted in cities to combat the high concentration of air pollutants. It also presents the need to actively address critical constraints like air pollution when promoting bike sharing and calls for seasonal approaches in developing solutions. Installing various infrastructures for bike lanes, such as buffers like half-walls or planters between car lanes [73] and street trees with high PM absorption capacities [74,75], would decrease concerns during high-PM seasons.
Funding
This work was supported by the Ministry of Education of the Republic of Korea and the National Research Foundation of Korea (NRF-2018S1A3A2075332).
Acknowledgments
The author thanks Shinah Park for her kind assistance.
Conflicts of Interest
The author declares no conflict of interest.
Appendix A

Table A1.
Estimation results for bike sharing using multiplicative interaction variables for seasons and PM10 level data.
Table A1.
Estimation results for bike sharing using multiplicative interaction variables for seasons and PM10 level data.
| Total Number of Trips | Total Traveled Distances | Total Traveled Times | ||||
|---|---|---|---|---|---|---|
| Coeff. | p | Coeff. | p | Coeff. | p | |
| Mean PM10 level | −0.0031 ** | 0.011 | −0.0033 ** | 0.034 | −0.0026 * | 0.068 |
| (Mean PM10 level) × (Summer) | −0.0041 * | 0.080 | −0.0074 *** | 0.009 | −0.0086 *** | 0.001 |
| (Mean PM10 level) × (Fall) | 0.0125 *** | 0.000 | 0.0117 *** | 0.000 | 0.0101 *** | 0.000 |
| (Mean PM10 level) × (Winter) | −0.0049 *** | 0.002 | −0.0071 *** | 0.000 | −0.0078 *** | 0.000 |
| Mean temperature | 0.0534 *** | 0.000 | 0.0668 *** | 0.000 | 0.0685 *** | 0.000 |
| Precipitation | −0.0182 *** | 0.000 | −0.0206 *** | 0.000 | −0.0224 *** | 0.000 |
| Heavy rain | 0.0308 | 0.870 | 0.0887 | 0.707 | 0.1488 | 0.504 |
| Mean wind speed | −0.0975 ** | 0.033 | −0.1187 ** | 0.038 | −0.1119 ** | 0.036 |
| Mean humidity | 0.0192 *** | 0.000 | −0.0120 *** | 0.000 | −0.0118 *** | 0.000 |
| Weekday | 0.1092 ** | 0.049 | −0.0375 | 0.586 | −0.1251 * | 0.051 |
| N | 365 | 365 | 365 | |||
| 2 Log Likelihood | −7760.657 | −13,974.815 | −10,202.575 | |||
| Akaike information criterion | 7784.7 | 13,998.8 | 10,266.6 | |||
* p < 0.1, ** p < 0.05, *** p < 0.01.
Table A2.
Estimation results for bike sharing using multiplicative interaction variables for seasons and PM2.5 level data.
Table A2.
Estimation results for bike sharing using multiplicative interaction variables for seasons and PM2.5 level data.
| Total Number of Trips | Total Traveled Distances | Total Traveled Times | ||||
|---|---|---|---|---|---|---|
| Coeff. | p | Coeff. | p | Coeff. | p | |
| Mean PM2.5 level | −0.0048 ** | 0.015 | −0.0046 * | 0.062 | −0.0034 | 0.141 |
| (Mean PM2.5 level) × (Summer) | −0.0058 * | 0.096 | −0.0108 ** | 0.012 | −0.0126 *** | 0.001 |
| (Mean PM2.5 level) × (Fall) | 0.0228 *** | 0.000 | 0.0213 *** | 0.000 | 0.0186 *** | 0.000 |
| (Mean PM2.5 level) × (Winter) | −0.0067 *** | 0.007 | −0.0098 *** | 0.001 | −0.0109 *** | 0.000 |
| Mean temperature | 0.0551 *** | 0.000 | 0.0688 *** | 0.000 | 0.0706 *** | 0.000 |
| Precipitation | −0.0181 *** | 0.000 | −0.0206 *** | 0.000 | −0.0223 *** | 0.000 |
| Heavy rain | 0.0344 | 0.857 | 0.0918 | 0.701 | 0.1523 | 0.499 |
| Mean wind speed | −0.1104 ** | 0.019 | −0.1337 ** | 0.023 | −0.1246 ** | 0.023 |
| Mean humidity | −0.0102 *** | 0.000 | −0.0118 *** | 0.000 | −0.0117 *** | 0.000 |
| Weekday | 0.1126 ** | 0.043 | −0.0349 | 0.615 | −0.1227 * | 0.058 |
| N | 365 | 365 | 365 | |||
| 2 Log Likelihood | −7764.990 | −13,979.984 | −10,208.968 | |||
| Akaike information criterion | 7789.0 | 14,004.0 | 10,233.0 | |||
* p < 0.1, ** p < 0.05, *** p < 0.01.
References
- Shaheen, S.A.; Guzman, S.; Zhang, H. Bikesharing in Europe, the Americas, and Asia: Past, Present, and Future. Transp. Res. Rec. 2010, 2143, 159–167. [Google Scholar] [CrossRef] [Green Version]
- DeMaio, P. Bike-sharing: History, Impacts, Models of Provision, and Future. J. Public Transp. 2009, 12, 41–56. [Google Scholar] [CrossRef]
- Bhardwaj, P.; Gal, S. The number of Bike-Sharing Programs Worldwide Has Doubled Since 2014—And the Number of Public Bikes Has Increased Almost 20-Fold. Available online: https://www.businessinsider.com/bike-sharing-programs-doubled-since-2014-public-bikes-charts-2018-7 (accessed on 25 February 2020).
- Fishman, E.; Washington, S.; Haworth, N. Bike Share: A Synthesis of the Literature. Transp. Rev. 2013, 33, 148–165. [Google Scholar] [CrossRef] [Green Version]
- Pucher, J.; Buehler, R. City Cycling; MIT Press: Cambridge, MA, USA, 2012; ISBN 978-0-262-30499-3. [Google Scholar]
- De Chardon, C.M. The contradictions of bike-share benefits, purposes and outcomes. Transp. Res. Part A Policy Pract. 2019, 121, 401–419. [Google Scholar] [CrossRef]
- Hoffmann, M.L. Bike Lanes Are White Lanes: Bicycle Advocacy and Urban Planning; University of Nebraska Press: Lincoln, NE, Canada, 2016; ISBN 978-0-8032-8822-5. [Google Scholar]
- Ogilvie, F.; Goodman, A. Inequalities in usage of a public bicycle sharing scheme: Socio-demographic predictors of uptake and usage of the London (UK) cycle hire scheme. Prev. Med. 2012, 55, 40–45. [Google Scholar] [CrossRef] [PubMed] [Green Version]
- Hosford, K.; Winters, M. Who Are Public Bicycle Share Programs Serving? An Evaluation of the Equity of Spatial Access to Bicycle Share Service Areas in Canadian Cities. Transp. Res. Rec. 2018, 2672, 42–50. [Google Scholar] [CrossRef]
- Audikana, A.; Ravalet, E.; Baranger, V.; Kaufmann, V. Implementing bikesharing systems in small cities: Evidence from the Swiss experience. Transp. Policy 2017, 55, 18–28. [Google Scholar] [CrossRef]
- Jurdak, R. The Impact of Cost and Network Topology on Urban Mobility: A Study of Public Bicycle Usage in 2 U.S. Cities. PLoS ONE 2013, 8, 1–6. [Google Scholar] [CrossRef]
- Shaheen, S.A.; Martin, E.W.; Cohen, A.P.; Finson, R.S. Public Bikesharing in North America: Early Operator and User Understanding; Mineta Transportation Institute: San Jose, CA, USA, 2012. [Google Scholar]
- Fishman, E.; Washington, S.; Haworth, N. Barriers and facilitators to public bicycle scheme use: A qualitative approach. Transp. Res. Part F Traffic Psychol. Behav. 2012, 15, 686–698. [Google Scholar] [CrossRef] [Green Version]
- Basch, C.H.; Zagnit, E.A.; Rajan, S.; Ethan, D.; Basch, C.E. Helmet Use Among Cyclists in New York City. J. Community Health 2014, 39, 956–958. [Google Scholar] [CrossRef]
- Zhang, Y.; Mi, Z. Environmental benefits of bike sharing: A big data-based analysis. Appl. Energy 2018, 220, 296–301. [Google Scholar] [CrossRef]
- Johansson, C.; Lövenheim, B.; Schantz, P.; Wahlgren, L.; Almström, P.; Markstedt, A.; Strömgren, M.; Forsberg, B.; Sommar, J.N. Impacts on air pollution and health by changing commuting from car to bicycle. Sci. Total Environ. 2017, 584–585, 55–63. [Google Scholar] [CrossRef] [PubMed]
- Lindsay, G.; Macmillan, A.; Woodward, A. Moving urban trips from cars to bicycles: Impact on health and emissions. Aust. N. Z. J. Public Health 2011, 35, 54–60. [Google Scholar] [CrossRef] [PubMed]
- Shaheen, S.A.; Cohen, A.P.; Martin, E.W. Public Bikesharing in North America: Early Operator Understanding and Emerging Trends. Transp. Res. Rec. 2013, 2387, 83–92. [Google Scholar] [CrossRef]
- Wang, M.; Zhou, X. Bike-sharing systems and congestion: Evidence from US cities. J. Transp. Geogr. 2017, 65, 147–154. [Google Scholar] [CrossRef]
- Hamilton, T.L.; Wichman, C.J. Bicycle infrastructure and traffic congestion: Evidence from DC’s Capital Bikeshare. J. Environ. Econ. Manag. 2018, 87, 72–93. [Google Scholar] [CrossRef]
- Otero, I.; Nieuwenhuijsen, M.J.; Rojas-Rueda, D. Health impacts of bike sharing systems in Europe. Environ. Int. 2018, 115, 387–394. [Google Scholar] [CrossRef]
- Huy, C.; Becker, S.; Gomolinsky, U.; Klein, T.; Thiel, A. Health, Medical Risk Factors, and Bicycle Use in Everyday Life in the Over-50 Population. J. Aging Phys. Act. 2008, 16, 454–464. [Google Scholar] [CrossRef] [Green Version]
- Rojas-Rueda, D.; de Nazelle, A.; Tainio, M.; Nieuwenhuijsen, M.J. The health risks and benefits of cycling in urban environments compared with car use: Health impact assessment study. BMJ 2011, 343. [Google Scholar] [CrossRef] [Green Version]
- Woodcock, J.; Tainio, M.; Cheshire, J.; O’Brien, O.; Goodman, A. Health effects of the London bicycle sharing system: Health impact modelling study. BMJ 2014, 348. [Google Scholar] [CrossRef] [Green Version]
- Fishman, E.; Schepers, P. Global bike share: What the data tells us about road safety. J. Saf. Res. 2016, 56, 41–45. [Google Scholar] [CrossRef] [PubMed]
- Bullock, C.; Brereton, F.; Bailey, S. The economic contribution of public bike-share to the sustainability and efficient functioning of cities. Sustain. Cities Soc. 2017, 28, 76–87. [Google Scholar] [CrossRef]
- Qiu, L.Y.; He, L.Y. Bike Sharing and the Economy, the Environment, and Health-Related Externalities. Sustainability 2018, 10, 1145. [Google Scholar] [CrossRef] [Green Version]
- Cohen, B.; Kietzmann, J. Ride On! Mobility Business Models for the Sharing Economy. Organ. Environ. 2014, 27, 279–296. [Google Scholar] [CrossRef]
- Lee, K.H.; Won, D.H.; Ko, E.J. The multiple impacts of the neighbourhood environment on the use of public bicycles by residents: An empirical study of Changwon in Korea. Int. J. Urban Sci. 2015, 19, 224–237. [Google Scholar] [CrossRef]
- Duthie, J.; Brady, J.F.; Mills, A.F.; Machemehl, R.B. Effects of On-Street Bicycle Facility Configuration on Bicyclist and Motorist Behavior. Transp. Res. Rec. 2010, 2190, 37–44. [Google Scholar] [CrossRef]
- García-Palomares, J.C.; Gutiérrez, J.; Latorre, M. Optimizing the location of stations in bike-sharing programs: A GIS approach. Appl. Geogr. 2012, 35, 235–246. [Google Scholar] [CrossRef]
- Wang, X.; Greg, L.; Schoner, J.E.; Harrison, A. Modeling Bike Share Station Activity: Effects of Nearby Businesses and Jobs on Trips to and from Stations. J. Urban Plan. Dev. 2016, 142, 04015001. [Google Scholar] [CrossRef] [Green Version]
- Frade, I.; Ribeiro, A. Bike-sharing stations: A maximal covering location approach. Transp. Res. Part A Policy Pract. 2015, 82, 216–227. [Google Scholar] [CrossRef]
- Gebhart, K.; Noland, R.B. The impact of weather conditions on bikeshare trips in Washington, DC. Transportation 2014, 41, 1205–1225. [Google Scholar] [CrossRef]
- El-Assi, W.; Salah Mahmoud, M.; Nurul Habib, K. Effects of built environment and weather on bike sharing demand: A station level analysis of commercial bike sharing in Toronto. Transportation 2017, 44, 589–613. [Google Scholar] [CrossRef]
- Corcoran, J.; Li, T.; Rohde, D.; Charles-Edwards, E.; Mateo-Babiano, D. Spatio-temporal patterns of a Public Bicycle Sharing Program: The effect of weather and calendar events. J. Transp. Geogr. 2014, 41, 292–305. [Google Scholar] [CrossRef]
- Caulfield, B.; O’Mahony, M.; Brazil, W.; Weldon, P. Examining usage patterns of a bike-sharing scheme in a medium sized city. Transp. Res. Part A Policy Pract. 2017, 100, 152–161. [Google Scholar] [CrossRef]
- Kim, K. Investigation on the effects of weather and calendar events on bike-sharing according to the trip patterns of bike rentals of stations. J. Transp. Geogr. 2018, 66, 309–320. [Google Scholar] [CrossRef]
- Martens, K. The bicycle as a feedering mode: Experiences from three European countries. Transp. Res. Part D Transp. Environ. 2004, 9, 281–294. [Google Scholar] [CrossRef]
- Nankervis, M. The effect of weather and climate on bicycle commuting. Transp. Res. Part A Policy Pract. 1999, 33, 417–431. [Google Scholar] [CrossRef]
- Bergström, A.; Magnusson, R. Potential of transferring car trips to bicycle during winter. Transp. Res. Part A Policy Pract. 2003, 37, 649–666. [Google Scholar] [CrossRef]
- Flynn, B.S.; Dana, G.S.; Sears, J.; Aultman-Hall, L. Weather factor impacts on commuting to work by bicycle. Prev. Med. 2012, 54, 122–124. [Google Scholar] [CrossRef]
- Kim, H.; Macdonald, E. Does Wind Discourage Sustainable Transportation Mode Choice? Findings from San Francisco, California, USA. Sustainability 2016, 8, 257. [Google Scholar] [CrossRef] [Green Version]
- MacNaughton, P.; Melly, S.; Vallarino, J.; Adamkiewicz, G.; Spengler, J.D. Impact of bicycle route type on exposure to traffic-related air pollution. Sci. Total Environ. 2014, 490, 37–43. [Google Scholar] [CrossRef] [Green Version]
- Liu, Y.; Lan, B.; Shirai, J.; Austin, E.; Yang, C.; Seto, E. Exposures to Air Pollution and Noise from Multi-Modal Commuting in a Chinese City. Int. J. Environ. Res. Public Health 2019, 16, 2539. [Google Scholar] [CrossRef] [Green Version]
- Apparicio, P.; Carrier, M.; Gelb, J.; Séguin, A.M.; Kingham, S. Cyclists’ exposure to air pollution and road traffic noise in central city neighbourhoods of Montreal. J. Transp. Geogr. 2016, 57, 63–69. [Google Scholar] [CrossRef] [Green Version]
- Li, W.; Kamargianni, M. Providing quantified evidence to policy makers for promoting bike-sharing in heavily air-polluted cities: A mode choice model and policy simulation for Taiyuan-China. Transp. Res. Part A Policy Pract. 2018, 111, 277–291. [Google Scholar] [CrossRef]
- Li, W.; Kamargianni, M. Air Pollution and Seasonality Effects on Mode Choice in China. Transp. Res. Rec. 2017, 2634, 101–109. [Google Scholar] [CrossRef]
- OECD. How’s Life? 2020: Measuring Well-Being; OECD Publishing: Paris, France, 2020. [Google Scholar]
- Yoon, G.; Chow, J.Y.J. Unlimited-ride bike-share pass pricing revenue management for casual riders using only public data. Int. J. Transp. Sci. Technol. 2020, 9, 159–169. [Google Scholar] [CrossRef]
- Citi Bike System Data. Available online: http://www.citibikenyc.com/system-data (accessed on 1 March 2020).
- Transport for London Santander Cycles Achieves a Record Breaking Year. Available online: https://tfl.gov.uk/info-for/media/press-releases/2018/december/santander-cycles-achieves-a-record-breaking-year (accessed on 1 March 2020).
- World Health Organization WHO Global Ambient Air Quality Database (Update 2018). Available online: http://www.who.int/airpollution/data/cities/en/ (accessed on 9 February 2020).
- Martinelli, N.; Olivieri, O.; Girelli, D. Air particulate matter and cardiovascular disease: A narrative review. Eur. J. Intern. Med. 2013, 24, 295–302. [Google Scholar] [CrossRef]
- Polichetti, G.; Cocco, S.; Spinali, A.; Trimarco, V.; Nunziata, A. Effects of particulate matter (PM10, PM2.5 and PM1) on the cardiovascular system. Toxicology 2009, 261, 1–8. [Google Scholar] [CrossRef]
- Zhang, Y.; Guo, Y.; Li, G.; Zhou, J.; Jin, X.; Wang, W.; Pan, X. The spatial characteristics of ambient particulate matter and daily mortality in the urban area of Beijing, China. Sci. Total Environ. 2012, 435, 14–20. [Google Scholar] [CrossRef]
- Fang, S.C.; Cassidy, A.; Christiani, D.C. A Systematic Review of Occupational Exposure to Particulate Matter and Cardiovascular Disease. Int. J. Environ. Res. Public Health 2010, 7, 1773–1806. [Google Scholar] [CrossRef]
- Xu, Q.; Li, X.; Wang, S.; Wang, C.; Huang, F.; Gao, Q.; Wu, L.; Tao, L.; Guo, J.; Wang, W.; et al. Fine Particulate Air Pollution and Hospital Emergency Room Visits for Respiratory Disease in Urban Areas in Beijing, China, in 2013. PLoS ONE 2016, 11, e0153099. [Google Scholar] [CrossRef]
- Fang, X.; Fang, B.; Wang, C.; Xia, T.; Bottai, M.; Fang, F.; Cao, Y. Comparison of Frequentist and Bayesian Generalized Additive Models for Assessing the Association between Daily Exposure to Fine Particles and Respiratory Mortality: A Simulation Study. Int. J. Environ. Res. Public Health 2019, 16, 746. [Google Scholar] [CrossRef] [PubMed] [Green Version]
- Nkhama, E.; Ndhlovu, M.; Dvonch, J.T.; Lynam, M.; Mentz, G.; Siziya, S.; Voyi, K. Effects of Airborne Particulate Matter on Respiratory Health in a Community near a Cement Factory in Chilanga, Zambia: Results from a Panel Study. Int. J. Environ. Res. Public Health 2017, 14, 1351. [Google Scholar] [CrossRef] [PubMed] [Green Version]
- Hu, H.; Dailey, A.B.; Kan, H.; Xu, X. The effect of atmospheric particulate matter on survival of breast cancer among US females. Breast Cancer Res. Treat. 2013, 139, 217–226. [Google Scholar] [CrossRef] [PubMed]
- Chen, X.; Zhang, L.; Huang, J.; Song, F.; Zhang, L.; Qian, Z.; Trevathan, E.; Mao, H.; Han, B.; Vaughn, M.; et al. Long-term exposure to urban air pollution and lung cancer mortality: A 12-year cohort study in Northern China. Sci. Total Environ. 2016, 571, 855–861. [Google Scholar] [CrossRef]
- Scungio, M.; Stabile, L.; Rizza, V.; Pacitto, A.; Russi, A.; Buonanno, G. Lung cancer risk assessment due to traffic-generated particles exposure in urban street canyons: A numerical modelling approach. Sci. Total Environ. 2018, 631–632, 1109–1116. [Google Scholar] [CrossRef]
- Roy, A.; Hu, W.; Wei, F.; Korn, L.; Chapman, R.S.; Zhang, J.J. Ambient particulate matter and lung function growth in Chinese children. Epidemiology 2012, 23, 464–472. [Google Scholar] [CrossRef] [Green Version]
- Zhu, X.; Liu, Y.; Chen, Y.; Yao, C.; Che, Z.; Cao, J. Maternal exposure to fine particulate matter (PM2.5) and pregnancy outcomes: A meta-analysis. Environ. Sci. Pollut. Res. 2015, 22, 3383–3396. [Google Scholar] [CrossRef]
- Ranft, U.; Schikowski, T.; Sugiri, D.; Krutmann, J.; Krämer, U. Long-term exposure to traffic-related particulate matter impairs cognitive function in the elderly. Environ. Res. 2009, 109, 1004–1011. [Google Scholar] [CrossRef]
- Janssen, N.A.H.; de Hartog, J.J.; Hoek, G.; Brunekreef, B.; Lanki, T.; Timonen, K.L.; Pekkanen, J. Personal Exposure to Fine Particulate Matter in Elderly Subjects: Relation between Personal, Indoor, and Outdoor Concentrations. J. Air Waste Manag. Assoc. 2000, 50, 1133–1143. [Google Scholar] [CrossRef]
- OECD. The Economic Consequences of Outdoor Air Pollution; OECD Publishing: Paris, France, 2016. [Google Scholar]
- Ministry of Environment. Ministry of Environment Comprehensive Plan for Managing Particulate Matter (2020–2024); Ministry of Environment: Sejong, South Korea, 2019.
- Kim, H.C.; Kim, S.; Kim, B.U.; Jin, C.S.; Hong, S.; Park, R.; Son, S.W.; Bae, C.; Bae, M.; Song, C.K.; et al. Recent increase of surface particulate matter concentrations in the Seoul Metropolitan Area, Korea. Sci. Rep. 2017, 7, 4710. [Google Scholar] [CrossRef] [Green Version]
- Kim, B.; Yoon, E.J.; Kim, S.; Lee, D.K. The Effects of Risk Perceptions Related to Particulate Matter on Outdoor Activity Satisfaction in South Korea. Int. J. Environ. Res. Public Health 2020, 17, 1613. [Google Scholar] [CrossRef] [Green Version]
- Ashqar, H.I.; Elhenawy, M.; Rakha, H.A. Modeling bike counts in a bike-sharing system considering the effect of weather conditions. Case Stud. Transp. Policy 2019, 7, 261–268. [Google Scholar] [CrossRef]
- McNeil, N.; Monsere, C.M.; Dill, J. Influence of Bike Lane Buffer Types on Perceived Comfort and Safety of Bicyclists and Potential Bicyclists. Transp. Res. Rec. 2015, 2520, 132–142. [Google Scholar] [CrossRef]
- Lu, S.; Yang, X.; Li, S.; Chen, B.; Jiang, Y.; Wang, D.; Xu, L. Effects of plant leaf surface and different pollution levels on PM2.5 adsorption capacity. Urban For. Urban Green. 2018, 34, 64–70. [Google Scholar] [CrossRef]
- Zhao, X.; Yan, H.; Liu, M.; Kang, L.; Yu, J.; Yang, R. Relationship between PM2.5 adsorption and leaf surface morphology in ten urban tree species in Shenyang, China. Energy Sources Part A Recovery Util. Environ. Eff. 2019, 41, 1029–1039. [Google Scholar] [CrossRef]
Figure 1.
Annual bike sharing trips in Seoul. Data sources: Seoul Institute (https://www.si.re.kr/) and Seoul Facilities Corporation (http://www.sisul.or.kr/).
Figure 1.
Annual bike sharing trips in Seoul. Data sources: Seoul Institute (https://www.si.re.kr/) and Seoul Facilities Corporation (http://www.sisul.or.kr/).
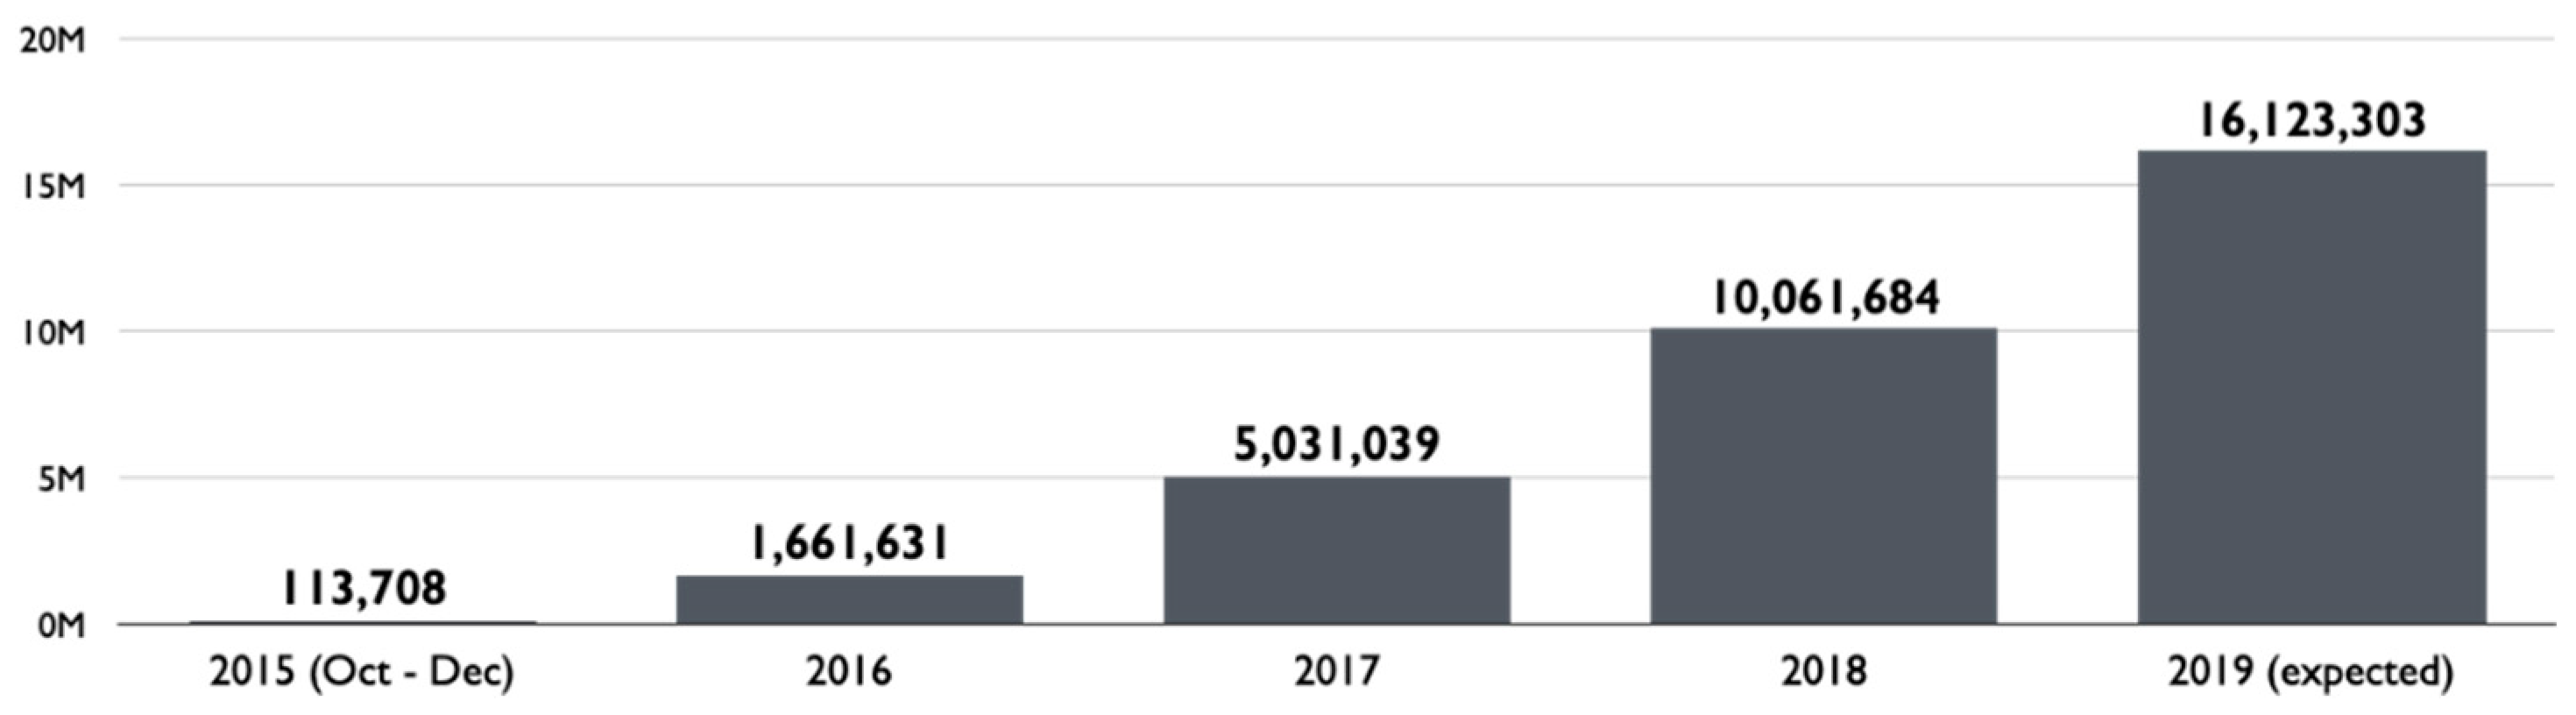
Figure 2.
(a) A bike sharing station in Seoul; (b) locations of bike sharing stations in Seoul as of mid-2019.
Figure 2.
(a) A bike sharing station in Seoul; (b) locations of bike sharing stations in Seoul as of mid-2019.
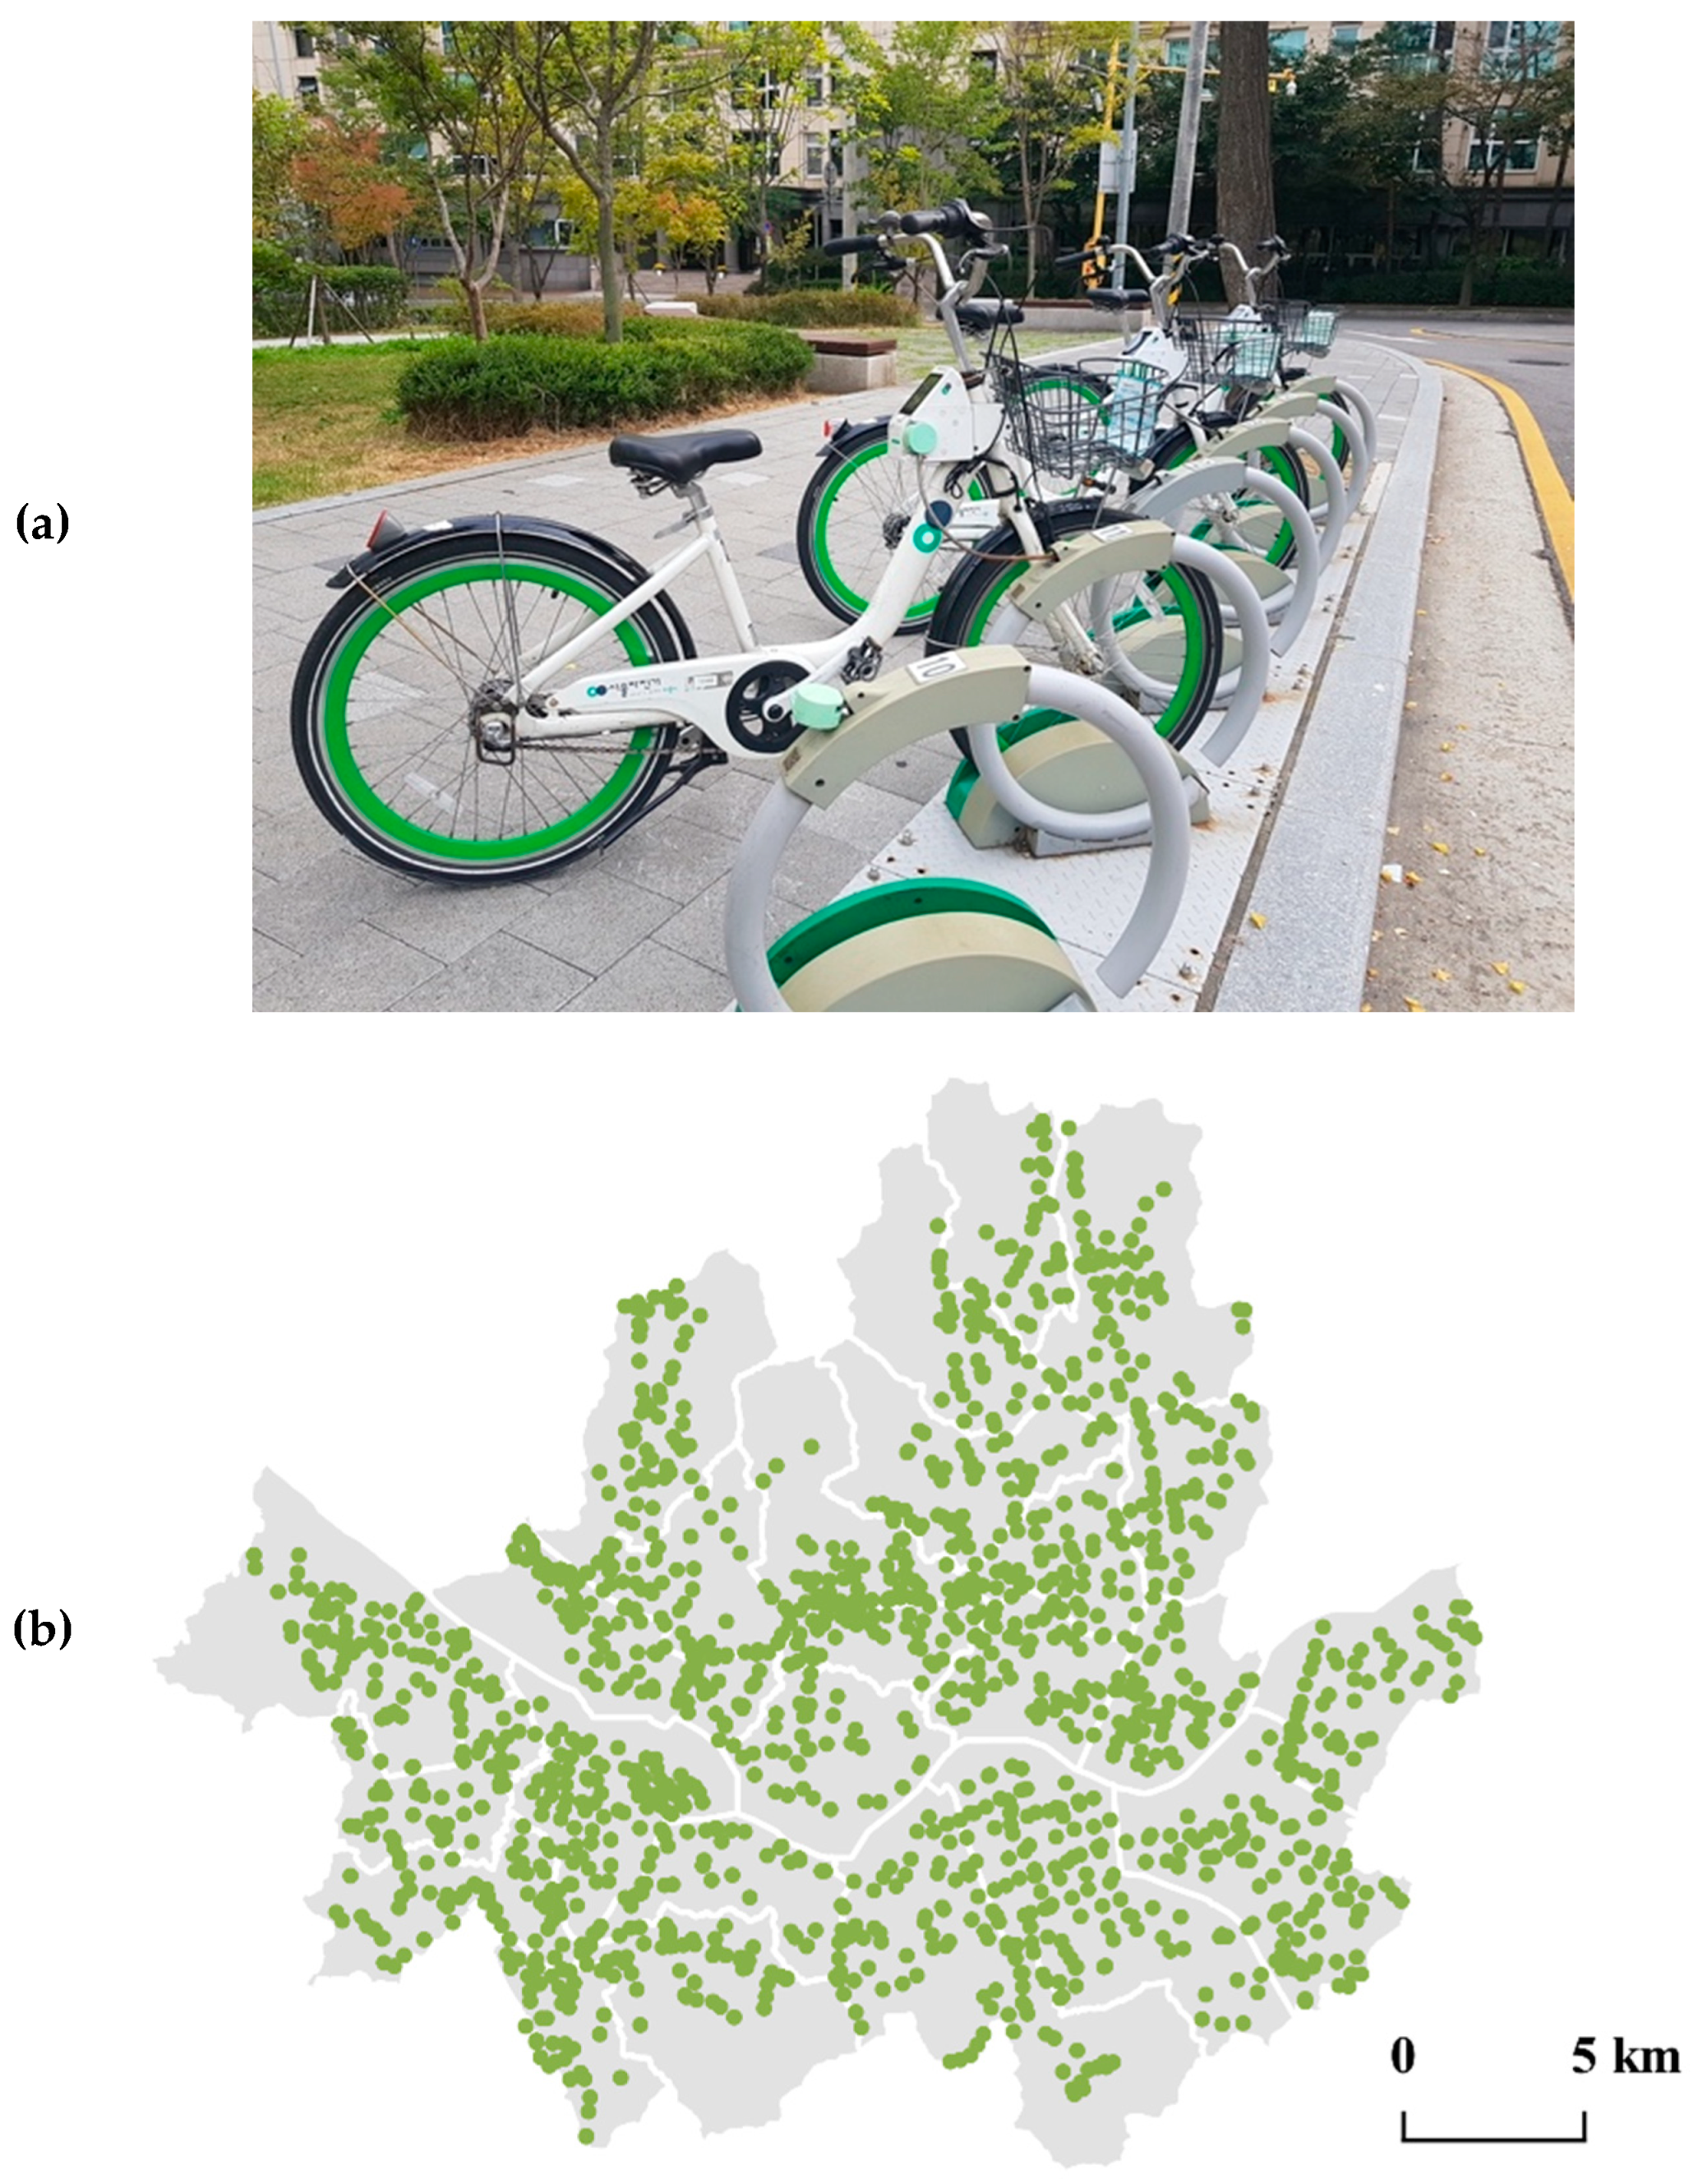
Figure 3.
Daily bike sharing trips of Seoul in 2018. Data source: Seoul Open Data Plaza (https://data.seoul.go.kr/).
Figure 3.
Daily bike sharing trips of Seoul in 2018. Data source: Seoul Open Data Plaza (https://data.seoul.go.kr/).
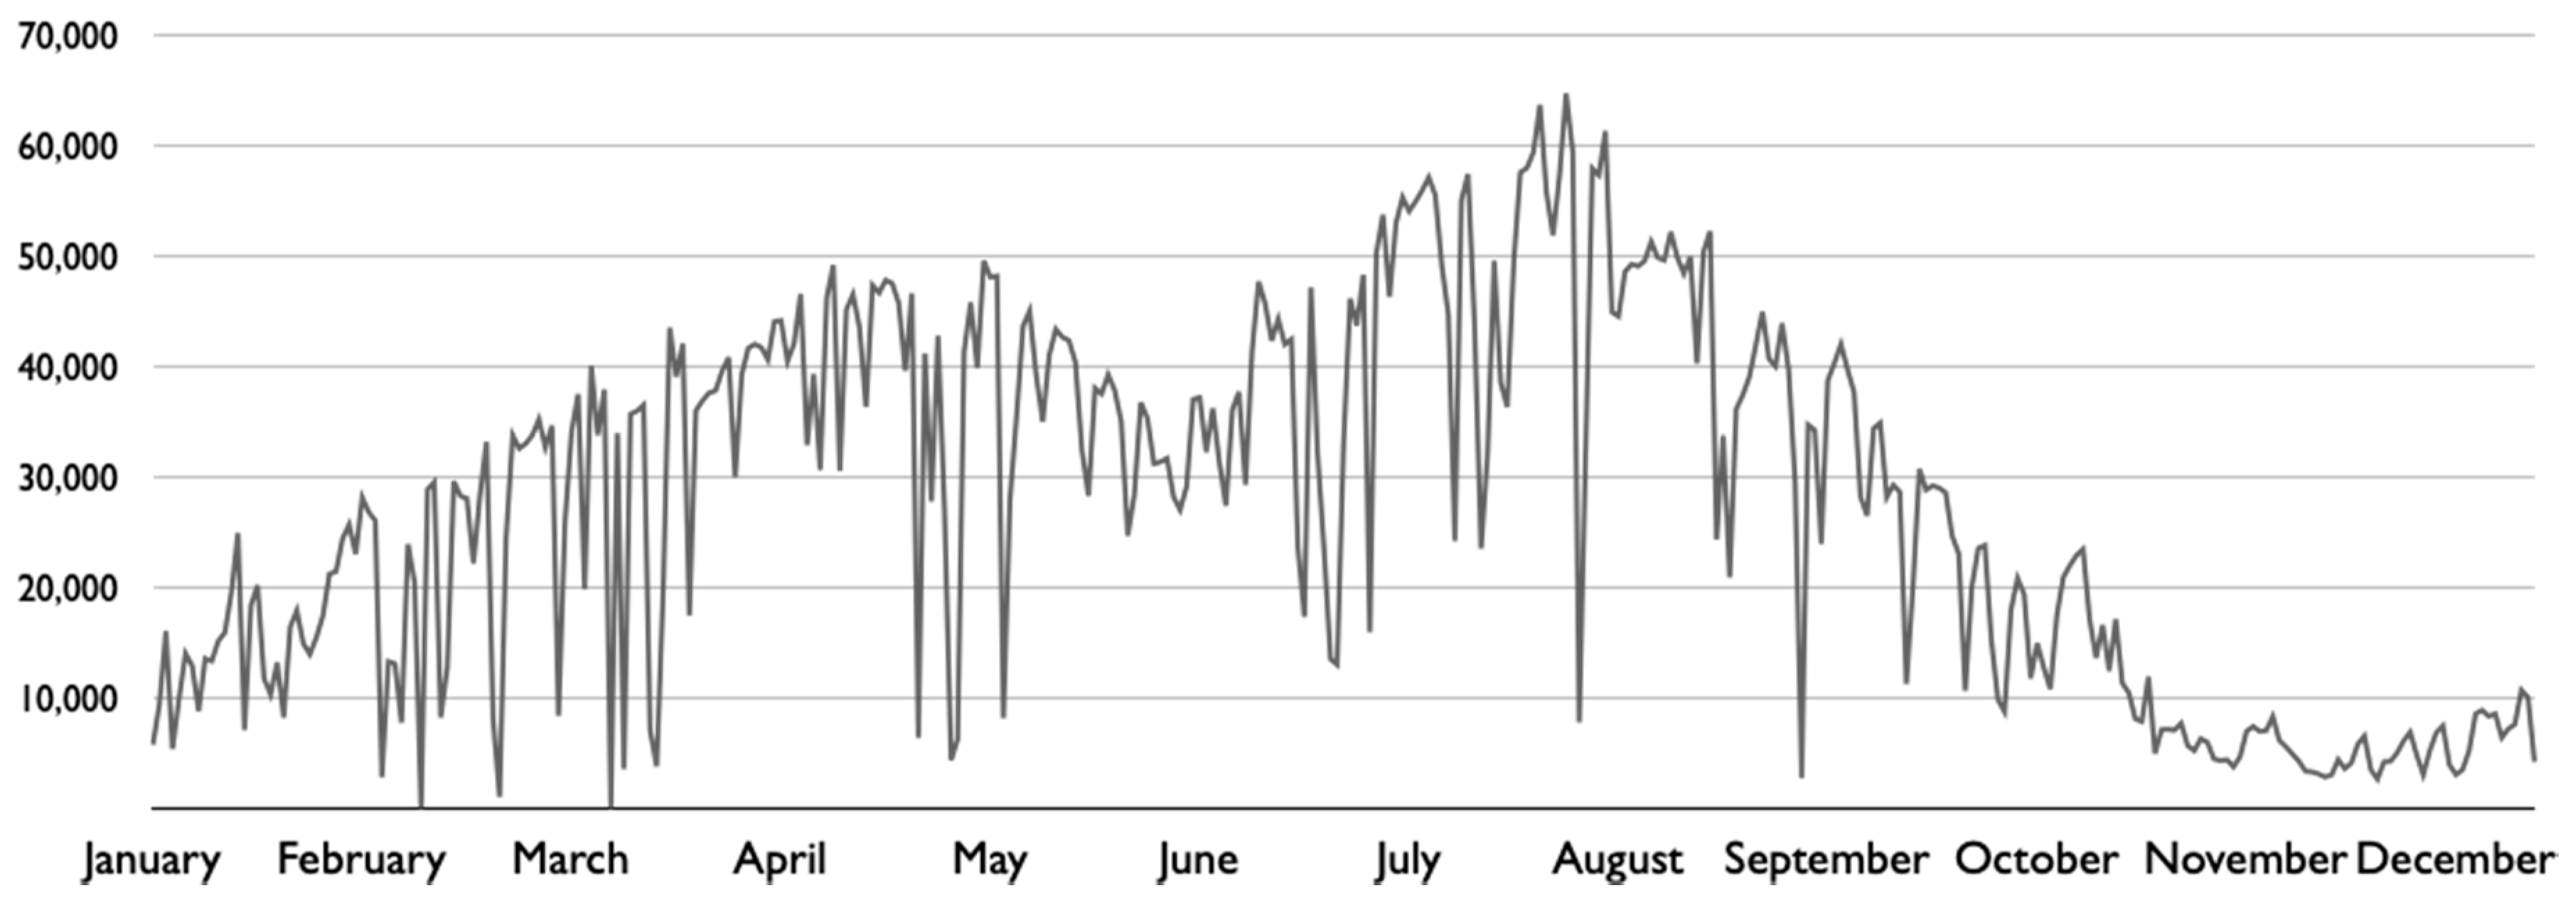
Figure 4.
Daily mean particulate matter (PM) levels of Seoul in 2018: (a) PM10; (b) PM2.5. Data source: Seoul Metropolitan Government Air Quality Information (http://cleanair.seoul.go.kr/). Note: Seoul Metropolitan Government uses daily average concentrations of all stations in Seoul as the representative PM level of the city.
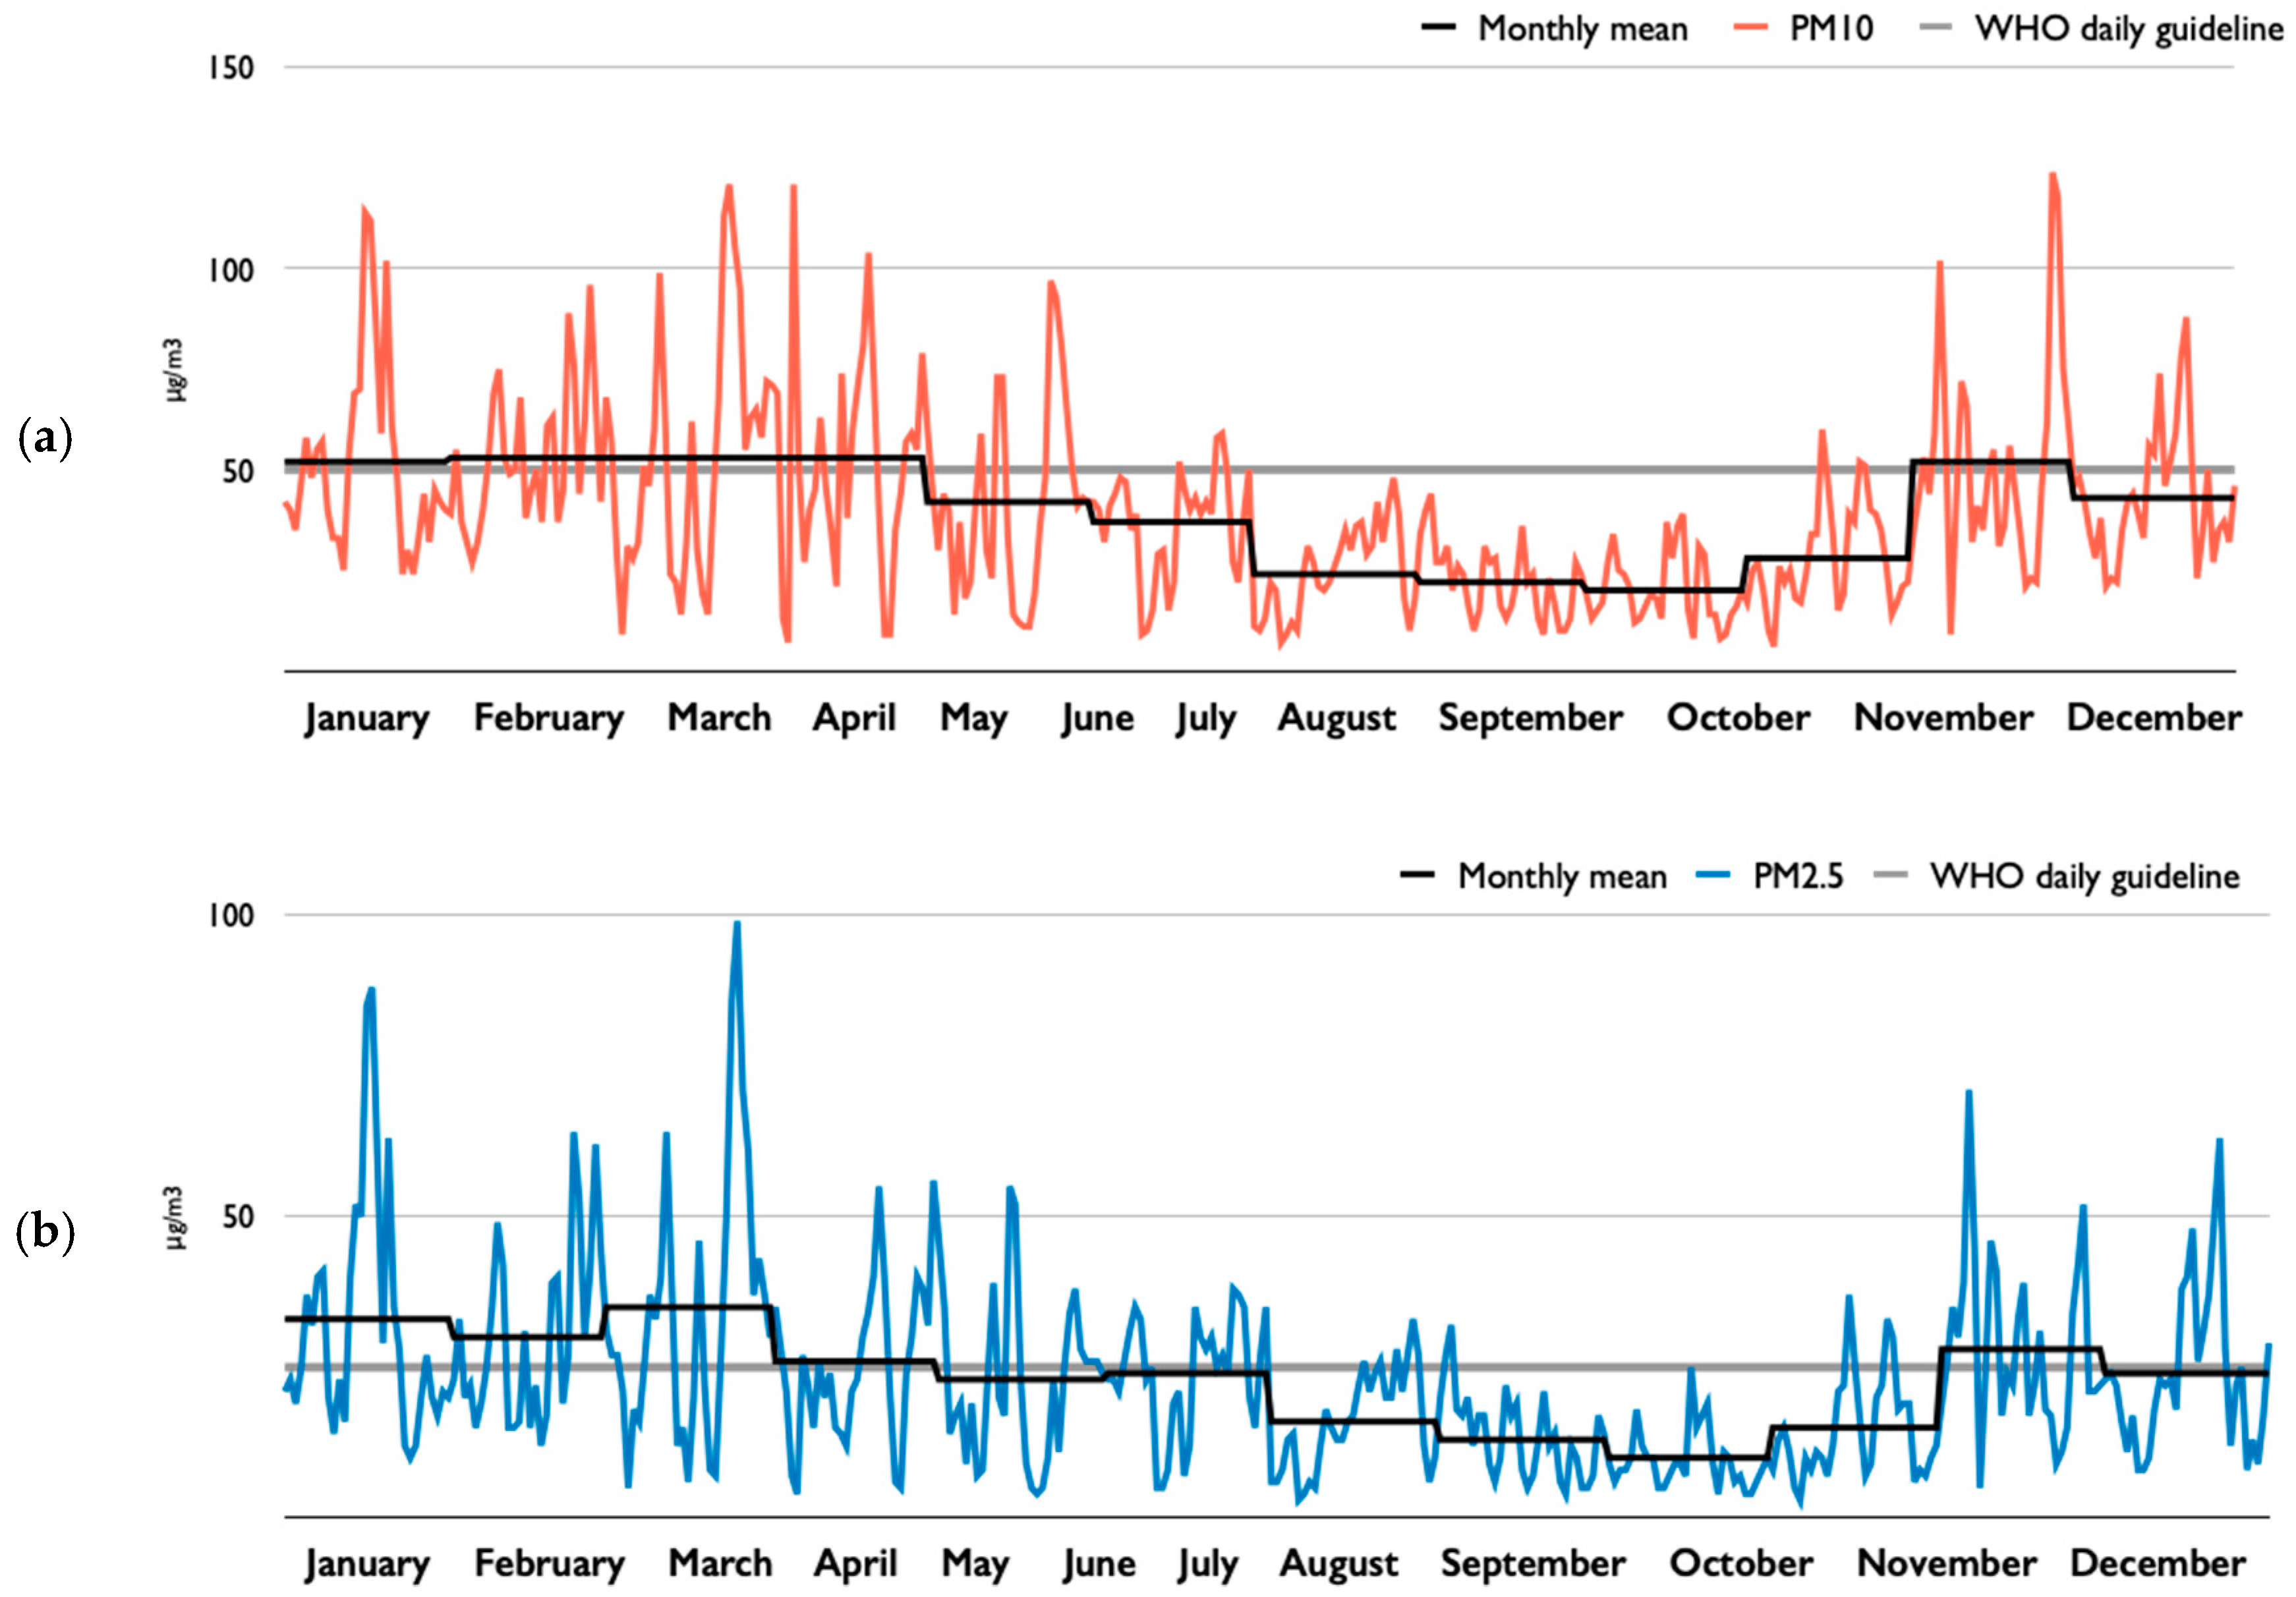
Table 1.
List of variables used in this study a.
| Variable | Unit | Data Source | |
|---|---|---|---|
| Dependent variables | Total number of trips | - | Seoul Open Data Plaza |
| Total traveled distances | meter | ||
| Total traveled times | minute | ||
| Independent variables | Mean PM10 level | μg/m3 | Seoul Metropolitan Government Air Quality Information |
| Mean PM2.5 level | μg/m3 | ||
| Control variables | Mean temperature | °C | Korea Meteorological Administration |
| Precipitation | mm | ||
| Heavy rain b | 1: precipitation ≥ 15; 0: precipitation < 15 | ||
| Mean wind speed | m/s | ||
| Mean humidity | % | ||
| Weekday b | 1: weekday; 0: Saturday, Sunday, and public holidays | ||
Notes: a All variables are measured daily; b dummy variable.
Table 2.
Descriptive statistics of variables by season.
| Season | Variable | Mean or Frequency | SD | Min | Max |
|---|---|---|---|---|---|
| All seasons | Total number of trips | 27,560 | 16,575 | 1036 | 64,644 |
| Total traveled distances (million meters) | 125 | 86 | 3 | 390 | |
| Total traveled times (thousand minutes) | 757 | 544 | 19 | 2486 | |
| Mean PM10 level (μg/m3) | 39.7 | 23.1 | 6 | 124 | |
| Mean PM2.5 level (μg/m3) | 22.8 | 15.3 | 3 | 99 | |
| Mean temperature (°C) | 13.0 | 11.5 | −14.8 | 33.7 | |
| Precipitation (mm) | 3.5 | 12.0 | 0 | 97 | |
| Heavy rain 1 | 23 | - | - | - | |
| Mean wind speed (m/s) | 1.7 | 0.6 | 0.7 | 4.1 | |
| Mean humidity (%) | 57.5 | 15.1 | 23 | 97 | |
| Weekday 1 | 261 | - | - | - | |
| Spring | Total number of trips | 22,883 | 11,550 | 1036 | 43,468 |
| Total traveled distances (million meters) | 107 | 62 | 3 | 252 | |
| Total traveled times (thousand minutes) | 682 | 419 | 19 | 1800 | |
| Mean PM10 level (μg/m3) | 48.7 | 27.6 | 7 | 121 | |
| Mean PM2.5 level (μg/m3) | 27.5 | 17.9 | 4 | 99 | |
| Mean temperature (°C) | 13.1 | 5.7 | −0.7 | 23.2 | |
| Precipitation (mm) | 4.5 | 12.7 | 0 | 83 | |
| Heavy rain 1 | 8 | - | - | - | |
| Mean wind speed (m/s) | 1.9 | 0.6 | 0.9 | 4.1 | |
| Mean humidity (%) | 59.2 | 16.3 | 23 | 97 | |
| Weekday 1 | 64 | - | - | - | |
| Summer | Total number of trips | 36,352 | 10,248 | 4357 | 49,519 |
| Total traveled distances (million meters) | 169 | 54 | 18 | 275 | |
| Total traveled times (thousand minutes) | 1018 | 370 | 102 | 1784 | |
| Mean PM10 level (μg/m3) | 27.8 | 12.8 | 7 | 59 | |
| Mean PM2.5 level (μg/m3) | 17.8 | 9.4 | 3 | 38 | |
| Mean temperature (°C) | 26.6 | 3.7 | 20.2 | 33.7 | |
| Precipitation (mm) | 6.1 | 17.1 | 0 | 61 | |
| Heavy rain 1 | 10 | - | - | - | |
| Mean wind speed (m/s) | 1.6 | 0.4 | 0.7 | 2.6 | |
| Mean humidity (%) | 65.1 | 12.8 | 39 | 95 | |
| Weekday 1 | 66 | - | - | - | |
| Fall | Total number of trips | 42,004 | 13,130 | 2728 | 64,644 |
| Total traveled distances (million meters) | 194 | 80 | 8 | 390 | |
| Total traveled times (thousand minutes) | 1153 | 543 | 44 | 2486 | |
| Mean PM10 level (μg/m3) | 33.3 | 22.1 | 6 | 124 | |
| Mean PM2.5 level (μg/m3) | 17.5 | 12.6 | 3 | 71 | |
| Mean temperature (°C) | 14.1 | 6.4 | 1.9 | 25.5 | |
| Precipitation (mm) | 2.8 | 10.2 | 0 | 64 | |
| Heavy rain 1 | 4 | - | - | - | |
| Mean wind speed (m/s) | 1.5 | 0.5 | 0.9 | 3.2 | |
| Mean humidity (%) | 59.2 | 12.4 | 27 | 94 | |
| Weekday 1 | 65 | - | - | - | |
| Winter | Total number of trips | 9256 | 6107 | 2640 | 24,620 |
| Total traveled distances (million meters) | 32 | 22 | 8 | 99 | |
| Total traveled times (thousand minutes) | 182 | 122 | 46 | 575 | |
| Mean PM10 level (μg/m3) | 49.2 | 19.9 | 21 | 114 | |
| Mean PM2.5 level (μg/m3) | 28.7 | 16.5 | 8 | 88 | |
| Mean temperature (°C) | −2.1 | 5.5 | −14.8 | 11.5 | |
| Precipitation (mm) | 0.6 | 2.9 | 0 | 25 | |
| Heavy rain 1 | 1 | - | - | - | |
| Mean wind speed (m/s) | 1.9 | 0.8 | 0.7 | 3.8 | |
| Mean humidity (%) | 46.3 | 12.1 | 26 | 87 | |
| Weekday 1 | 64 | - | - | - |
1 Dummy variables.
Table 3.
Estimation results for bike sharing use using PM10 level data in all seasons.
| Total Number of Trips | Total Traveled Distances | Total Traveled Times | ||||
|---|---|---|---|---|---|---|
| Coeff. | p | Coeff. | p | Coeff. | p | |
| Mean PM10 level | −0.0034 ** | 0.011 | −0.0043 ** | 0.007 | −0.0041 ** | 0.007 |
| Mean temperature | 0.0527 *** | 0.000 | 0.0663 *** | 0.000 | 0.0686 *** | 0.000 |
| Precipitation | −0.0192 *** | 0.000 | −0.0215 *** | 0.000 | −0.0231 *** | 0.000 |
| Heavy rain | −0.1121 | 0.613 | −0.0531 | 0.842 | 0.0252 | 0.20 |
| Mean wind speed | −0.2036 *** | 0.000 | −0.2213 *** | 0.000 | −0.2001 *** | 0.000 |
| Mean humidity | −0.0075 *** | 0.004 | −0.0094 *** | 0.003 | −0.0097 *** | 0.001 |
| Weekday | 0.1157 | 0.071 | −0.0376 | 0.626 | −0.1341 | 0.065 |
| N | 365 | 365 | 365 | |||
| 2 Log Likelihood | −7871.343 | −14,064.148 | −10,298.510 | |||
| AIC | 7889.3 | 14,082 | 10,317 | |||
** p < 0.05, *** p < 0.01. Note: Bonferroni-corrected p-values are applied to remove the problem of multiple hypothesis testing.
Table 4.
Estimation results for bike sharing use using PM2.5 level data in all seasons.
| Total Number of Trips | Total Traveled Distances | Total Traveled Times | ||||
|---|---|---|---|---|---|---|
| Coeff. | p | Coeff. | p | Coeff. | p | |
| Mean PM2.5 level | −0.0080 *** | 0.000 | −0.0094 *** | 0.000 | −0.0087 *** | 0.000 |
| Mean temperature | 0.0512 *** | 0.000 | 0.0647 *** | 0.000 | 0.0672 *** | 0.000 |
| Precipitation | −0.0203 *** | 0.000 | −0.0227 *** | 0.000 | −0.0243 *** | 0.000 |
| Heavy rain | −0.1283 | 0.558 | −0.0684 | 0.795 | 0.0133 | 0.957 |
| Mean wind speed | −0.2278 *** | 0.000 | −0.2479 *** | 0.000 | −0.2250 *** | 0.000 |
| Mean humidity | −0.0055 * | 0.035 | −0.0073 ** | 0.022 | −0.0076 ** | 0.010 |
| Weekday | 0.1037 | 0.102 | −0.0525 | 0.492 | −0.1484 * | 0.039 |
| N | 365 | 365 | 365 | |||
| 2 Log Likelihood | −7862.803 | −14,056.852 | −10,291.406 | |||
| Akaike information criterion | 7880.8 | 14,075 | 10,309 | |||
* p < 0.1, ** p < 0.05, *** p < 0.01. Note: Bonferroni-corrected p-values are applied to remove the problem of multiple hypothesis testing.
Table 5.
Estimation results for bike sharing use using PM10 level data in spring.
| Total Number of Trips | Total Traveled Distances | Total Traveled Times | ||||
|---|---|---|---|---|---|---|
| Coeff. | p | Coeff. | p | Coeff. | p | |
| Mean PM10 level | −0.0016 | 0.146 | −0.0029 * | 0.028 | −0.0027 * | 0.043 |
| Mean temperature | 0.0766 *** | 0.000 | 0.0878 *** | 0.000 | 0.0904 *** | 0.000 |
| Precipitation | −0.0332 *** | 0.000 | −0.0399 *** | 0.000 | −0.0388 *** | 0.000 |
| Heavy rain | 0.2009 | 0.264 | 0.3107 | 0.142 | 0.2927 | 0.187 |
| Mean wind speed | 0.0191 | 0.719 | −0.0197 | 0.752 | −0.0202 | 0.757 |
| Mean humidity | −0.0108 *** | 0.000 | −0.0128 *** | 0.000 | −0.0124 *** | 0.000 |
| Weekday | 0.0648 | 0.309 | −0.1177 | 0.116 | −0.2431 *** | 0.002 |
| N | 90 | 90 | 90 | |||
| 2 Log Likelihood | −1793.18 | −3334.478 | −2430.358 | |||
| Akaike information criterion | 1811.2 | 3352.5 | 2448.4 | |||
* p < 0.1, *** p < 0.01. Note: Bonferroni-corrected p-values are applied to remove the problem of multiple hypothesis testing.
Table 6.
Estimation results for bike sharing use using PM2.5 level data in spring.
| Total Number of Trips | Total Traveled Distances | Total Traveled Times | ||||
|---|---|---|---|---|---|---|
| Coeff. | p | Coeff. | p | Coeff. | p | |
| Mean PM2.5 level | −0.0025 | 0.128 | −0.0043 * | 0.030 | −0.0041 * | 0.048 |
| Mean temperature | 0.0757 *** | 0.000 | 0.0862 *** | 0.000 | 0.0889 *** | 0.000 |
| Precipitation | −0.0335 *** | 0.000 | −0.0403 *** | 0.000 | −0.0392 *** | 0.000 |
| Heavy rain | 0.2059 | 0.251 | 0.3227 | 0.127 | 0.3061 | 0.167 |
| Mean wind speed | 0.0014 | 0.979 | −0.0498 | 0.428 | −0.0492 | 0.455 |
| Mean humidity | −0.0104 *** | 0.000 | −0.0121 *** | 0.000 | −0.0118 *** | 0.000 |
| Weekday | 0.0608 | 0.339 | −0.1243 | 0.098 | −0.2500 *** | 0.002 |
| N | 90 | 90 | 90 | |||
| 2 Log Likelihood | −1793.002 | −3334.58 | −2430.548 | |||
| Akaike information criterion | 1811.0 | 3352.6 | 2448.5 | |||
* p < 0.1, *** p < 0.01. Note: Bonferroni-corrected p-values are applied to remove the problem of multiple hypothesis testing.
Table 7.
Estimation results for bike sharing use using PM10 level data in summer.
| Total Number of Trips | Total Traveled Distances | Total Traveled Times | ||||
|---|---|---|---|---|---|---|
| Coeff. | p | Coeff. | p | Coeff. | p | |
| Mean PM10 level | 0.0009 | 0.633 | 0.0002 | 0.928 | 0.0006 | 0.792 |
| Mean temperature | −0.0260 *** | 0 | −0.0332 *** | 0 | −0.0454 *** | 0.000 |
| Precipitation | −0.0178 *** | 0 | −0.0197 *** | 0 | −0.0212 *** | 0.000 |
| Heavy rain | 0.0245 | 0.859 | −0.0055 | 0.973 | −0.0004 | 0.998 |
| Mean wind speed | −0.0187 | 0.748 | −0.0187 | 0.782 | −0.0267 | 0.693 |
| Mean humidity | −0.0077 *** | 0.002 | −0.0087 *** | 0.002 | −0.0105 *** | 0.000 |
| Weekday | 0.1384 ** | 0.011 | 0.0190 | 0.763 | −0.0486 | 0.441 |
| N | 92 | 92 | 92 | |||
| 2 Log Likelihood | −1904.752 | −3483.012 | −2539.546 | |||
| Akaike information criterion | 1922.8 | 3501 | 2557.5 | |||
** p < 0.05, *** p < 0.01. Note: Bonferroni-corrected p-values are applied to remove the problem of multiple hypothesis testing.
Table 8.
Estimation results for bike sharing use using PM2.5 level data in summer.
| Total Number of Trips | Total Traveled Distances | Total Traveled Times | ||||
|---|---|---|---|---|---|---|
| Coeff. | p | Coeff. | p | Coeff. | p | |
| Mean PM2.5 level | 0.0007 | 0.789 | −0.0003 | 0.925 | 0.0002 | 0.944 |
| Mean temperature | −0.0262 *** | 0 | −0.0333 *** | 0 | −0.0456 *** | 0.000 |
| Precipitation | −0.0178 *** | 0 | −0.0197 *** | 0 | −0.0213 *** | 0.000 |
| Heavy rain | 0.0217 | 0.875 | −0.0089 | 0.956 | −0.0038 | 0.981 |
| Mean wind speed | −0.0167 | 0.773 | −0.0170 | 0.801 | −0.0246 | 0.715 |
| Mean humidity | −0.0077 *** | 0.001 | −0.0087 *** | 0.002 | −0.0105 *** | 0.000 |
| Weekday | 0.1394 ** | 0.010 | 0.0201 | 0.749 | −0.0474 | 0.452 |
| N | 92 | 92 | 92 | |||
| 2 Log Likelihood | −1904.901 | −3483.011 | −2539.607 | |||
| Akaike information criterion | 1922.9 | 3501 | 2557.6 | |||
** p < 0.05, *** p < 0.01. Note: Bonferroni-corrected p-values are applied to remove the problem of multiple hypothesis testing.
Table 9.
Estimation results for bike sharing use using PM10 level data in fall.
| Total Number of Trips | Total Traveled Distances | Total Traveled Times | ||||
|---|---|---|---|---|---|---|
| Coeff. | p | Coeff. | p | Coeff. | p | |
| Mean PM10 level | −0.0003 | 0.853 | −0.0017 | 0.315 | −0.0020 | 0.281 |
| Mean temperature | 0.0367 *** | 0 | 0.0531 *** | 0 | 0.0597 *** | 0.000 |
| Precipitation | −0.0074 | 0.399 | −0.0003 | 0.979 | 0.0042 | 0.717 |
| Heavy rain | −0.5192 | 0.198 | −0.8230 | 0.090 | −0.9827 | 0.062 |
| Mean wind speed | −0.0383 | 0.500 | −0.0621 | 0.364 | −0.0754 | 0.308 |
| Mean humidity | −0.0122 *** | 0 | −0.0169 *** | 0 | −0.0189 *** | 0.000 |
| Weekday | 0.0485 | 0.401 | −0.0784 | 0.265 | −0.1729 ** | 0.023 |
| N | 91 | 91 | 91 | |||
| 2 Log Likelihood | −1930.961 | −3493.132 | −2571.092 | |||
| Akaike information criterion | 1949 | 3511.1 | 2589.1 | |||
** p < 0.05, *** p < 0.01. Note: Bonferroni-corrected p-values are applied to remove the problem of multiple hypothesis testing.
Table 10.
Estimation results for bike sharing use using PM2.5 level data in fall.
| Total Number of Trips | Total Traveled Distances | Total Traveled Times | ||||
|---|---|---|---|---|---|---|
| Coeff. | p | Coeff. | p | Coeff. | p | |
| Mean PM2.5 level | 0.0026 | 0.362 | 0.0005 | 0.883 | 0.0005 | 0.900 |
| Mean temperature | 0.0398 *** | 0 | 0.0567 *** | 0 | 0.0638 *** | 0.000 |
| Precipitation | −0.0045 | 0.617 | 0.0026 | 0.811 | 0.0075 | 0.527 |
| Heavy rain | −0.5932 | 0.142 | −0.8990 | 0.067 | −1.0728 * | 0.043 |
| Mean wind speed | −0.0222 | 0.703 | −0.0477 | 0.499 | −0.0599 | 0.433 |
| Mean humidity | 0.0140 *** | 0 | −0.0182 *** | 0 | −0.0204 *** | 0.000 |
| Weekday | 0.0519 | 0.372 | −0.0777 | 0.272 | −0.1718 ** | 0.025 |
| N | 91 | 91 | 91 | |||
| 2 Log Likelihood | −1930.163 | −3483.008 | −2572.10 | |||
| Akaike information criterion | 1948.2 | 3501 | 2557.6 | |||
* p < 0.1, ** p < 0.05, *** p < 0.01. Note: Bonferroni-corrected p-values are applied to remove the problem of multiple hypothesis testing.
Table 11.
Estimation results for bike sharing use using PM10 level data in winter.
| Total Number of Trips | Total Traveled Distances | Total Traveled Times | ||||
|---|---|---|---|---|---|---|
| Coeff. | p | Coeff. | p | Coeff. | p | |
| Mean PM10 level | −0.0152 *** | 0 | −0.0165 *** | 0 | −0.0152 *** | 0.000 |
| Mean temperature | 0.1110 *** | 0 | 0.1330 ** | 0 | 0.1285 *** | 0.000 |
| Precipitation | −0.1240 ** | 0.013 | −0.1337 ** | 0.005 | −0.1318 *** | 0.003 |
| Heavy rain | 1.9941 | 0.101 | 2.1959 | 0.060 | 2.0818 | 0.051 |
| Mean wind speed | −0.0304 | 0.650. | −0.0403 | 0.529 | −0.0314 | 0.591 |
| Mean humidity | −0.0062 | 0.298 | −0.0094 | 0.103 | −0.0080 | 0.125 |
| Weekday | 0.2774 ** | 0.005 | 0.1680 | 0.077 | 0.1607 | 0.064 |
| N | 90 | 90 | 90 | |||
| 2 Log Likelihood | −1712.240 | −3162.796 | −2222.028 | |||
| Akaike information criterion | 1730.2 | 3180.8 | 2240 | |||
** p < 0.05, *** p < 0.01. Note: Bonferroni-corrected p-values are applied to remove the problem of multiple hypothesis testing.
Table 12.
Estimation results for bike sharing use using PM2.5 level data in winter.
| Total Number of Trips | Total Traveled Distances | Total Traveled Times | ||||
|---|---|---|---|---|---|---|
| Coeff. | p | Coeff. | p | Coeff. | p | |
| Mean PM2.5 level | −0.0174 *** | 0 | −0.0191 *** | 0 | −0.0175 *** | 0.000 |
| Mean temperature | 0.1012 *** | 0 | 0.1224 *** | 0 | 0.1187 *** | 0.000 |
| Precipitation | −0.1212 ** | 0.019 | −0.1314 ** | 0.008 | −0.1290 *** | 0.005 |
| Heavy rain | 1.9035 | 0.128 | 2.1141 | 0.079 | 1.9939 | 0.070 |
| Mean wind speed | −0.0747 | 0.289 | −0.0893 | 0.188 | −0.0761 | 0.219 |
| Mean humidity | −0.0041 | 0.530 | −0.0069 | 0.270 | −0.0059 | 0.303 |
| Weekday | 0.2790 ** | 0.006 | 0.1691 | 0.083 | 0.1618 | 0.069 |
| N | 90 | 90 | 90 | |||
| 2 Log Likelihood | −1715.924 | −3167.469 | −2226.91 | |||
| Akaike information criterion | 1733.9 | 3185.5 | 2244.9 | |||
** p < 0.05, *** p < 0.01. Note: Bonferroni-corrected p-values are applied to remove the problem of multiple hypothesis testing.
Table 13.
Summary of regression coefficients of mean PM10 and PM2.5 levels.
| Season | PM | Total Number of Trips | Total Traveled Distances | Total Traveled Times |
|---|---|---|---|---|
| All seasons | Mean PM10 level | −0.0034 ** | −0.0043 *** | −0.0041 *** |
| Mean PM2.5 level | −0.0080 *** | −0.0094 *** | −0.0087 *** | |
| Spring | Mean PM10 level | −0.0016 | −0.0029 * | −0.0027 * |
| Mean PM2.5 level | −0.0025 | −0.0043 * | −0.0041 * | |
| Summer | Mean PM10 level | 0.0009 | 0.0002 | 0.0006 |
| Mean PM2.5 level | 0.0007 | −0.0003 | 0.0002 | |
| Fall | Mean PM10 level | −0.0003 | −0.0017 | −0.0020 |
| Mean PM2.5 level | 0.0026 | 0.0005 | 0.0005 | |
| Winter | Mean PM10 level | −0.0152 *** | −0.0165 *** | −0.0152 *** |
| Mean PM2.5 level | −0.0174 *** | −0.0191 *** | −0.0175 *** |
* p < 0.1, ** p < 0.05, *** p < 0.01. Note: Bonferroni-corrected p-values are applied to remove the problem of multiple hypothesis testing.
© 2020 by the author. Licensee MDPI, Basel, Switzerland. This article is an open access article distributed under the terms and conditions of the Creative Commons Attribution (CC BY) license (http://creativecommons.org/licenses/by/4.0/).
Share and Cite
MDPI and ACS Style
Kim, H. Seasonal Impacts of Particulate Matter Levels on Bike Sharing in Seoul, South Korea. Int. J. Environ. Res. Public Health 2020, 17, 3999. https://doi.org/10.3390/ijerph17113999
AMA Style
Kim H. Seasonal Impacts of Particulate Matter Levels on Bike Sharing in Seoul, South Korea. International Journal of Environmental Research and Public Health. 2020; 17(11):3999. https://doi.org/10.3390/ijerph17113999
Chicago/Turabian StyleKim, Hyungkyoo. 2020. "Seasonal Impacts of Particulate Matter Levels on Bike Sharing in Seoul, South Korea" International Journal of Environmental Research and Public Health 17, no. 11: 3999. https://doi.org/10.3390/ijerph17113999
Note that from the first issue of 2016, this journal uses article numbers instead of page numbers. See further details here.