Article

Threshold Effects of PM2.5 Exposure on Particle-Related Mortality in China

1
Department of Applied Economics, National Chung Hsing University, Taichung 402, Taiwan
2
Institute of Economics, Academia Sinica, Taipei 11529, Taiwan
3
Department of Agricultural Economics, National Taiwan University, Taipei 10617, Taiwan
*
Author to whom correspondence should be addressed.
Int. J. Environ. Res. Public Health 2019, 16(19), 3549; https://doi.org/10.3390/ijerph16193549
Submission received: 5 August 2019 / Revised: 18 September 2019 / Accepted: 20 September 2019 / Published: 22 September 2019
(This article belongs to the Section Climate Change)

Abstract

:
Ambient air pollution from energy use and other sources is a major environmental risk factor in the incidence and progression of serious diseases, such as cardiovascular and respiratory diseases. This study elucidates the health effects of energy consumption from air pollution in China based on multiple threshold effects of the population-weighted exposure to PM2.5 (fine particles less than 2.5 microns in diameter) on particle-related mortality rate. We firstly estimate the causal relationship between coal consumption and PM2.5 in China for 2004–2010 using a panel regression model. Panel threshold models are applied to access the non-linear relationships between PM2.5 and cause-specific mortality rates that indicate the health effects are dependent on the PM2.5 ranges. By combining these steps, we calculate the health impacts of coal consumption based on threshold effects of PM2.5. We find that a 1% coal consumption increase induces a 0.23% increase in PM2.5. A triple threshold effect is found between PM2.5 and cardiovascular mortality; for example, increasing PM2.5 exposure causes cardiovascular mortality rate to increase when PM2.5 lies in 17.7–21.6 μg/m3 and 21.6–34.3 μg/m3, with the estimated increments being 0.81% and 0.26%, respectively, corresponding to 1% PM2.5 increase. A single threshold effect of SO2 on respiratory mortality rate is identified and allows the estimation of the mortality effects of PM2.5 regarding the two regimes of SO2. Finally, we access the health impacts of coal consumption under specific estimated thresholds. This study provides a better understanding of sources contributing to related-air pollution mortality. The multi-threshold effect of PM2.5 could be considered for further applications in harmonizing emission standards in China and other developing countries.

1. Introduction

PM 2.5 is derived predominantly from principal air pollution that is caused directly by gases like nitrogen oxides ( NO x ), sulfur dioxide ( SO 2 ), and carbon monoxide (CO) from fuel combustion emission in power generation, manufacturing, transportation, etc. Since PM 2.5 could infiltrate deeply into the gas-exchange region of the lungs, and smaller particles can cross alveolar membrane into the blood vessels [1,2,3], it is the most health-damaging particle, and tends to be associated with the mortality risks from cardiovascular disease [4,5,6,7,8] and respiratory system diseases [9,10,11,12,13].
In China, known to be the largest developing country in the world, a heavy reliance on coal as a cheap and major source of energy for maintaining essential industrial activities, for instance, operating coal-fired power plants, is considered to be the main source of gaseous air pollutants, including PM 2.5 . Such a strong causal relationship between coal burning and increasing PM 2.5 in China has been proved in previous studies [14,15,16]. As a result, air quality degradation in China related to high levels of PM 2.5 has put huge pressures on the environment and public health. According to the National Bureau of Statistics of China, cardiovascular disease and respiratory disease ranked among the top five causes of death at the national level from 2000–2015. Because of the seriousness of and popular interest in air pollution and mortality, accumulating studies have investigated PM 2.5 and found significant impacts on fatal damage to the cardiovascular system and respiratory disease [17,18,19]. As can be seen, there is a transitive relationship between coal consumption, PM 2.5 and human mortality that could be studied further and more integratedly. In other words, instead of directly studying the association between consumption of coal and health consequences, the impacts of energy consumption on mortality rates could be clarified through the health effects of PM 2.5 to gain a better understanding of the sources contributing to air pollution and polluted air-related mortality.
Regarding the determination of the relationship between mortality and fine particulate matter, many researchers initially focused on the shape of the concentration-response curve to reveal that the relationship between mortality and exposure to PM 2.5 is nonlinear and speculated that one or more PM 2.5 segments (thresholds) might exist. This has inspired epidemiologic studies to model the health effects of fine particulate matter using a variety of methods supporting nonlinearities. However, prior findings remain inconsistent: some studies have indicated that the concentration-response curve is close to linear [20,21,22], while others found evidence of nonlinearity [23,24,25], and there is still no clear evidence that supports the existence of PM 2.5 thresholds, to our knowledge.
The traditional approach on the shapes of concentration-response (C-R) determines PM 2.5 threshold levels exogenously, which may create some problems, such as being unable to obtain confidence intervals for threshold, and the estimates may be sensitive to the chosen threshold level [26,27] or ignoring exposure estimation errors while estimating average exposure concentration led to low-dose nonlinearities or thresholds being obscured [28]. This paper employs Hansen [26] threshold model to estimate the relationship between PM 2.5 and particle-related mortality in China on a national scale. Specifically, we use panel threshold models to test whether there are threshold effects between PM 2.5 and mortality, search for two or more regimes endogenously, and then estimate the effect of different pollutant regimes on mortality.
In light of the importance of identifying threshold effects of PM 2.5 on human health, and inferring the health impacts of coal consumption from air pollution based on PM 2.5 thresholds, the specific objectives of this research are, firstly, (1) to estimate PM 2.5 caused by energy consumption in China; then (2) to elucidate how exposure to PM 2.5 influences cause-specific mortality rate with threshold effects; and, finally, (3) to explore the relationship between energy consumption and mortality rate through PM 2.5 health impacts.
To fulfil research objectives, this paper is constructed as follows. We firstly introduce the research background and review the literature. In the next section, we discuss panel data models for examining the impact of coal consumption on PM 2.5 and panel threshold regression models for estimating the effects of PM 2.5 on mortality rate. Then, we discuss the data set. Finally, the empirical results of each model and two-stage approach are interpreted, and some concluding remarks are presented.

2. Research Background

2.1. Energy Consumption and P M 2.5

As a basic concern about air quality in China, high concentrations of PM 2.5 are believed to be closely related to coal consumption, which is the primary source of energy in the country. During 2000–2015, alongside the massive industrialization and urbanization, China consumed about 2.1 billion tons of coal, of more than 3 billion tons of SCE (standard coal equivalent) of the total energy consumption annually, which accounts for 70%. Among economic sectors, the coal-consuming industries such as coal-fired power plants (50% of consumed coal), cement, iron and steel, building, and coal conversion have consumed 85.8% of the total coal [29]. Coal-burning is considered the largest contributor to ambient PM 2.5 , since it negatively contributes about 40% to the PM 2.5 population exposure in China [30]. Many papers have provided clear evidence to support the causal relationship between coal combustion and PM 2.5 [14,15,16]. In addition to coal-burning-related causes, consumption of other fossil fuels and its products such as diesel oil, or gasoline also significantly contribute to ambient PM 2.5 [31,32,33]. Based on these studies, energy consumption, especially for coal, gasoline, and diesel oil, are the major factors affecting the concentration of PM 2.5 in China.
Other factors contributing to elevated levels of PM 2.5 are also determined. For example, since unpaved road dust emissions also significantly contribute to particulate matter concentrations [34,35], we add the data of per capita area of paved road and expect a negative sign on its coefficient. Meteorological factors including temperature, precipitation, and humidity are also used as the controlling variables, because significant correlations between these climatic factors and PM 2.5 level have been found previously [36,37,38]. In addition, since China was elected as the host country for the 2008 Summer Olympic Games, Chinese officials imposed many stringent emission limits on vehicles, industry, construction activities, and on fuel consumption in the most air-polluted regions. It is believed that there has been a major change in air quality in China, and therefore, we use a dummy variable of time (before and after 2008) to clarify this.

2.2. P M 2.5 and Mortality

Many studies have been published asserting significant connections between PM 2.5 and human health with respect to short- and long-term effects in large Chinese cities. Specifically, for estimating air pollution short-term effects, Kan, London, Chen, Zhang, Song, Zhao, Jiang and Chen [19] indicated that in Shanghai, an increase of 10 μ g / m 3 in the 2-day moving average concentration of PM 2.5   corresponded to 0.36%, 0.41%, and 0.95% increase of total, cardiovascular, and respiratory mortality. For Shenyang city, Ma, Chen, Pan, Xu, Song, Chen and Kan [18] estimated that the risk of mortality of all-causes, cardiovascular, and respiratory increased by 0.49%, 0.53%, and 0.97%, respectively, in response to a 10 μ g / m 3 PM 2.5   increase. Another study conducted by Yang, Peng, Huang, Chen, Xu, Chen and Kan [17] provided more evidence that supports for short-term health effect of air pollution by showing that a 10 μ g / m 3   increase in PM 2.5 causes a 1.22% (95% CI: 0.63, 1.68) and 0.97% (95% CI: 0.16, 1.79) in cardiovascular and respiratory mortality in Guangzhou.
Due to the lack of PM 2.5 data for the period prior to 2013, the ability to investigate the long-term effect of PM 2.5 on human health is limited in China. Thus, the health impacts of PM 10 pollution have been studied instead. For instance, retrospective cohort studies investigated by Zhang, et al. [39] and Dong, et al. [40] found that in Shenyang, China, a 10 μ g / m 3 increase in   PM 10 leads to an increase of 67% in deaths caused by respiratory disease and a 55% increase in cardiovascular mortality. Regarding other countries, the long-term health effects of PM 2.5 have also been widely studied, such as in the US, Canada, Netherlands, etc.
In addition to PM-related causes, mortality related to cardiovascular and respiratory diseases is also associated with increased concentrations of nitrogen dioxide ( NO 2 ) and sulfur dioxide ( SO 2 ). These associations have also been widely investigated by previous studies [41,42,43,44,45,46].

2.3. The Relationship between P M 2.5 and Mortality Rate

Back to empirical studies from the literature, a class of nonlinear exposure-response models has been applied to access the concentration-response relationship. Schwartz, Laden and Zanobetti [22] developed smooth functions using data of PM 2.5 and daily deaths for six US cities and showed that the least-square fit of a linear association and no sign of a threshold. This finding is consistent with a previous result, applying a different methodology with PM 10 , Daniels, Dominici, Samet and Zeger [20] developed spline and threshold exposure-response models using daily time-series data for the 20 largest US cities and found that the association appeared to be linear. A similar approach was employed by Samoli, Analitis, Touloumi, Schwartz, Anderson, Sunyer, Bisanti, Zmirou, Vonk and Pekkanen [21] to estimate the relationship between ambient particles and daily mortality in 22 European cities, with the results indicating that the spline curves were roughly linear, but also suggesting that a threshold model would be reasonable for respiratory mortality cases.
Even though many studies have reported a linear relationship without threshold when modeling the concentration-response curve, accumulating studies have still made an effort to identify nonlinearity relations between fine particles and mortality with a variety of methodologies applied. Krewski, Jerrett, Burnett, Ma, Hughes, Shi, Turner, Pope III, Thurston and Calle [23] and Crouse, Peters, van Donkelaar, Goldberg, Villeneuve, Brion, Khan, Atari, Jerrett and Pope III [24] used the logarithm of fine particulate matter in the Cox survival models and showed that the log models were a better predictor of PM 2.5 -related mortality. Using a meta-regression approach, Burnett, Pope III, Ezzati, Olives, Lim, Mehta, Shin, Singh, Hubbell and Brauer [25] suggested fitting an integrated exposure-response (IER) model by incorporating information on risk from other sources of PM 2.5 to demonstrate that the PM 2.5 -mortality association is nonlinear and more complex than assessments from concentration in logarithm form. Apte, et al. [47] also applied the IER model to access how mortality from PM 2.5 could be reduced in response to improvements in air quality; the global concentration-mortality relationships were found to be nonlinear, especially for mortality of stroke and ischemic heart disease. In addition, Yu and Chien [13] used a spatiotemporal structured additive regression model to examine the concentration-response (C-R) relation between respiratory visits and PM 2.5 . The results emphasized a non-linearity of the respiratory health effects of PM 2.5 on humans.
As a result, there is still no consensus on the shape of the concentration-mortality relationship, and no clear evidence supports the existence of PM 2.5 thresholds to our knowledge. A recent study by Cox [28] has re-examined the shapes of C-R for PM 2.5 with well-defined response thresholds and concluded that ignoring exposure estimation errors while estimating average exposure concentration has led to low-dose nonlinearities or thresholds being obscured. More appropriate approaches are required in modeling the association. Hansen [26] suggested a threshold regression technique for panel data model to test for threshold effects and to search for two or more regimes endogenously. In this study, we examine the health impacts of air pollution in China on a national scale by estimating the association between cause-specific mortalities for cardiovascular and respiratory diseases and annual average population-weighted exposure to PM 2.5 using Panel Threshold Models as an econometric approach.
The major purpose here is to directly access the statistical significance of the multi-threshold effect of   PM 2.5   on air pollution-related mortality. The second objective of the study is to provide a better understanding of the sources contributing to   PM 2.5 and mortality by estimating the health impacts of coal consumption in China based on the multi-threshold effects of   PM 2.5 and SO 2 .

3. Methodology

3.1. Panel Regression Model

To depict the relationship between coal consumption and air pollution from different time periods and locations, a multiple panel regression model is estimated in Logarithmic form. The population-weighted exposure to PM 2.5 is considered to be a dependent variable, while six factors (coal consumption, gasoline and diesel consumption, area of paved road per capita, temperature, precipitation, and humidity) are selected as main explanatory variables, since they are closely related to China air pollution and have frequently been used in the literature as discussed in the previous section.
The panel regression model that elucidates the relationship between fuel consumption and population-weighted exposure to   PM 2.5 is as follows:
L n P M 2.5 i t   = β 0 + β 1 L n C o a l _ c o n s i t +   β 2 B 08 + β 3 L n G a s D i e _ c o n s i t + β 4 L n P a v e d R d i t + β 5 L n T e m p i t + β 6 L n P r e c p i t + β 7 L n H u m i d i t +   ε i t
for a balanced panel, where i and t denote province and time (year), P M 2.5 i t is the regional population-weighted exposure to fine particulate matter, C o a l _ c o n s i t is the coal consumption by region, B 08 : a dummy variable that will be 1 if the data set is from 2004–2008, G a s D i e _ c o n s i t is the summation of regional consumption of gasoline and diesel oil, P a v e d R d i t is per capita area of paved road, T e m p i t is average temperature, P r e c p i t is average precipitation and H u m i d i t is average relative humidity, and ε i t is the error term.

3.2. Panel Threshold Models

3.2.1. Theoretical Model

This study employs Hansen’s panel threshold regression model in natural logarithmic form to further investigate the threshold effect of fine particulate matter on mortality rate.
The structure of the single panel threshold model is as follow:
y i t = μ i + β 1 x i t I ( q i t γ ) + β 2 x i t I ( q i t > γ ) + ϵ i t  
where the data are from a balanced panel, i and t denote indexes of the individual ( 1 i N )   and the time ( 1 t T ) , respectively; y i t and the threshold variable, q i t , are scalars; x i t is a k vector of explanation variables; I ( ) is an indicator function; μ i is the fixed effect (or heterogeneity of individuals); and the error term, ϵ i t , is assumed to be independent and identically distributed, ϵ i t ~ i i d ( 0 , σ 2 ) . Equation (2) can be written as follows:
y i t = μ i + β x i t ( γ ) + ϵ i t
where β x i t ( γ ) = { β 1 x i t I ( q i t γ ) β 2 x i t I ( q i t > γ )
The data are separated into two regimes, whereby the threshold variable, q i t , is less than or greater than the threshold value, γ . The two regimes have different regression slopes, β 1 and β 2 , respectively.
Hansen extended the panel threshold model with more than one threshold, where the threshold value, γ 1 , is less than γ 2 , as follows:
y i t = μ i + β 1 x i t I ( q i t γ 1 ) + β 2 x i t I ( γ 1 < q i t γ 2 ) + β 3 x i t I ( q i t > γ 2 ) + e i t )
For more specific details on the model and threshold test, refer to Hansen [26].

3.2.2. Empirical Model

For choosing an appropriate threshold variable for specific mortality rate, we consider comparing the health impacts of different air pollutants on mortality. In addition to significant mortality effects of PM 2.5 on both of cardiovascular mortality and respiratory mortality discussed, many previous papers have shown that SO 2 has the highest degree of impact compared to PM 2.5 and NO 2 in terms of respiratory mortality [48,49]. Hence, we decided to choose PM 2.5 for depicting the threshold effect on the cardiovascular mortality rate, and SO 2 is chosen as the threshold variable for estimating the health effect regarding respiratory mortality. In each model, three air pollutants ( PM 2.5 , NO 2 , SO 2 ) are selected as the main explanatory variables. The gross regional product (GRP) is also used, as a socioeconomic factor that is believed to influence the public health. The specific structure of the panel threshold models will be presented in this section.
We firstly apply the threshold test on PM 2.5 for the mortality rate of cardiovascular to see whether any threshold relationship exists. The version with more regime-dependent coefficients enables estimating the health impacts of different air pollutants including PM 2.5 , SO 2 , and NO 2 , under each certain level of PM 2.5 for individual thresholds. Suppose a triple threshold effect were found between cardiovascular mortality rate and PM 2.5 , the panel threshold model would be as follows:
L n M O T 1 i t = μ i   +   ( α 1 L n P M 2.5 i t 1   +   β 1 L n S O 2 i t 1   +   θ 1 . L n N O 2 i t 1 ) I ( L n P M 2.5 i t 1 γ 1 ) +   ( α 2 L n P M 2.5 i t 1   +   β 2 L n S O 2 i t 1 +   θ 2 . L n N O 2 i t 1 ) I ( γ 1 < L n PM 2.5 it 1 γ 2 )   +   ( α 3 L n P M 2.5 i t 1 +   β 3 L n S O 2 i t 1   +   θ 3 . L n N O 2 i t 1 ) I ( γ 2 < L n PM 2.5 it 1 γ 3 ) +   ( α 4 L n P M 2.5 i t 1   +   β 4 L n S O 2 i t 1 +   θ 4 . L n N O 2 i t 1 ) I ( L n P M 2.5 i t 1 > γ 3 )   +   φ 3 . L n G R P i t 1   +   ϵ it
Regarding respiratory mortality rate, we develop a panel threshold model to find PM 2.5 health effects under specific thresholds of SO 2 emission level, as follows (supposing we found a single threshold effect for SO 2 ):
L n M O T 2 i t = μ i   +   α 1 L n P M 2.5 i t 1 I ( L n S O 2 i t 1 r )   +   α 2 L n P M 2.5 i t 1 I ( L n S O 2 i t 1 > r ) +   θ 1 . L n S O 2 i t 1   +   θ 2 . L n N O 2 i t 1   +   θ 3 . L n G R P i t 1   +   ε i t
where i and t denote province and time (year), M O T k i t   is the cause-specific mortality rate, which is M O T 1 i t   for cardiovascular mortality rate and M O T 2 i t for respiratory disease mortality rate, μ i is the fixed effect (controlling for the heterogeneity of individual regions), P M 2.5 i t is the population-weighted exposure to PM 2.5 , S O 2 i t is the volume of regional S O 2 emission, N O 2 i t is the average concentration of N O 2 , G R P is the gross regional product which refers to the final products at market prices produced by all resident units in a province during a certain period of time, we make the calculation using 2005 as the base year, and ε i t , ϵ i t are the error terms. The right-hand-side variables interpret the lagged effects of the independent variables on cause-specific mortality. The estimated health effect threshold equation allows mortality rate to vary as it crosses three thresholds of   PM 2.5 , as shown in the results in the later section.
This study focuses on estimating the health impacts of air pollution based on the threshold effect of   PM 2.5 , thereby using the unit of PM 2.5   as 10 μ g / m 3 not be appropriate, since this may create some complicated cases for explanation. For example, increasing a 10 μ g / m 3 unit could move PM 2.5 level from a low threshold to higher thresholds, with different health impacts for each. Hence, we use the natural logarithmic form for the models and will interpret the percentage change in mortality rate by a 1% PM 2.5 increase.

3.3. Data Set

In this study, we use the data of annual population-weighted PM 2.5 exposure of 30 Chinese provinces and municipalities estimated by a team of US scientists and provided by Hsu [50]. The 30 Chinese provinces are Beijing, Tianjin, Hebei, Shanxi, Inner Mongolia, Liaoning, Jilin, Heilongjiang, Shanghai, Jiangsu, Zhejiang, Anhui, Fujian, Jiangxi, Shandong, Henan, Hubei, Hunan, Guangdong, Guangxi, Hainan, Sichuan, Guizhou, Yunnan, Tibet, Shaanxi, Gansu, Qinghai, Ningxia, and Xinjiang. Population-weighted PM 2.5 exposure for a specific province is calculated by multiplying the satellite-estimated PM 2.5 concentration for each grid cell by the percentage of province population that lives within that grid cell and producing an average for all the grid cells within a province: PW − PM 2.5 = i = 1 n ( PM i P i   i = 1 n P i   ) , where PM i   is defined as the i t h pixel value of satellite PM 2.5 concentration, P i is the population density of the i t h grid cell of a certain province, which is divided by n grid cells [51]. As can be seen from the formula, that PW- PM 2.5 implies that the exposure to PM 2.5   in highly populated areas is greater than that in regions with sparse density. This indicator is more telling of actual exposure to PM 2.5 and more in line with actual pollution situation compared to per capita PM 2.5 concentration [51]. Hence, it would be appropriate for investigating the health consequences of poor air quality.
Data on other air pollutants (i.e., SO 2   emission, NO 2 concentration), energy consumption (i.e., consumption of coal; total consumption of gasoline and diesel oil), meteorological conditions (i.e., average temperature, relative humidity and precipitation), per capita area of paved road, and socioeconomic factors, i.e., gross regional product (GRP), were retrieved from the National Bureau of Statistics of China [52]. Table 1 displays descriptive statistics on these variables. The mean annual PM 2.5 level of China is 27.26 μ g / m 3 and most provinces and municipalities exceed the PM 2.5 standard level proposed by WHO, which is set at 10 μ g / m 3 .
The mortality estimates for specific causes including cardiovascular mortality and respiratory mortality are provided by the Institute for Health Metrics and Evaluation, University of Washington, Seattle, USA under the Global of Burden Disease Study 2013 [53]. Due to the lack of frequent yearly data of mortality estimates, we convert the data in 5-year intervals provided into annual datasets using the Geometric Power Series simulation method. Once annual cause-specific mortality estimates have been simulated, the mortality rate of each province is calculated by dividing mortality estimates by the average population of the province, and then multiplying by 100,000. Provincial average population data is released by the National Bureau Statistical of China. Table 2 displays descriptive statistics for variables those are used for estimating the threshold effects of PM 2.5 on mortality rate.
Using the ggplot2 package in R-studio, we map the annual coal consumption and population-weighted exposure to PM 2.5 concentration data to provide a visualization of spatial distribution and temporal changes for a 5-year time trend. In Figure 1, we can partially observe the correlation between consumption of coal and fine particle pollution through the similarities in the intensity of the color mapped.

4. Results

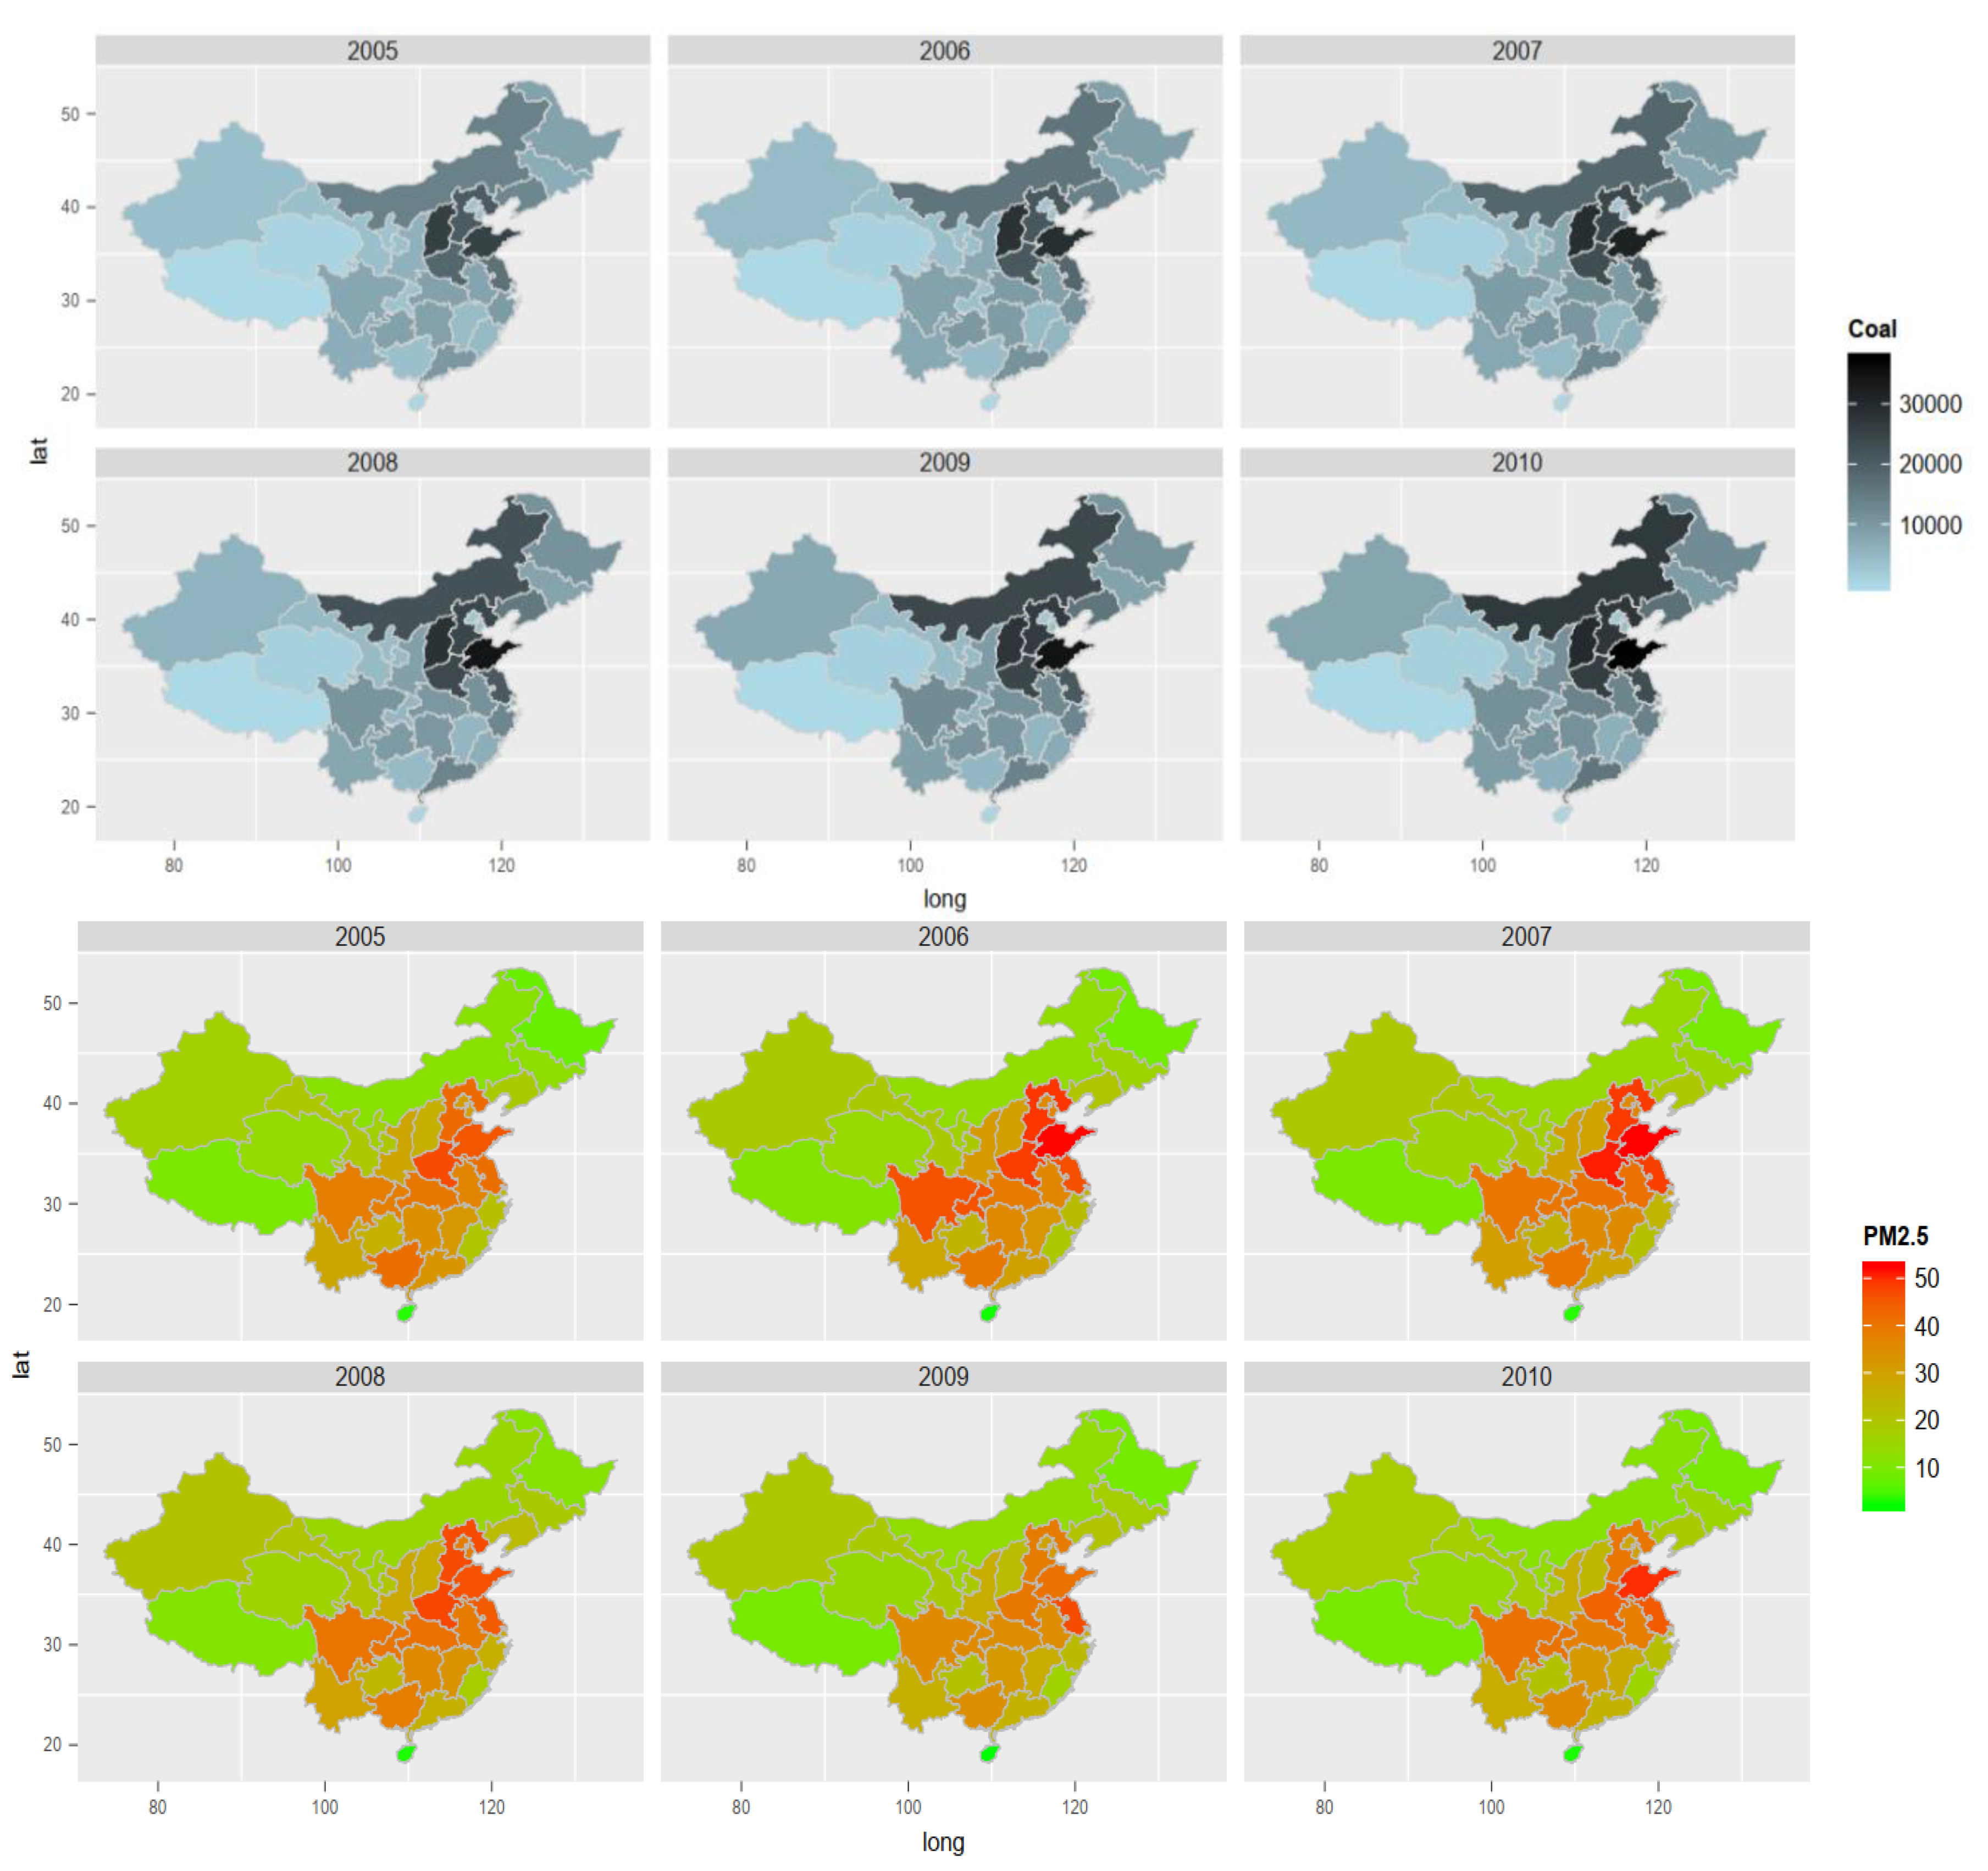
4.1. Estimating the Environmental Impacts of Fossil Fuel Consumption

To deal with common panel data problems such as heteroscedasticity, autocorrelation, or cross-correlation in cross-sectional units at the same point in time, we run pooled ordinary least squares (OLS), fixed effects (FE) model, and random effects (RE) model. The results of F test, LM test indicate that fixed effects model and random effects model are both better than the pooled model. Since the balanced panel data has 29 cross-sections and only 7 years, the sum squares of residuals decreased tremendously, leading to an increase of adjusted R 2 in the fixed effects model. Therefore, technically, the adjusted R 2 of FE model is always higher than in RE model assuming the same specification. We depend on the Hausman test, and its results show that the random effects model is the most appropriate model for our data. The estimated parameters for the panel multiple regression are displayed in Table 3.
At a significance level of 1%, we find that a 1% coal consumption increase leads to a 0.23% increase in population-weighted exposure to   PM 2.5 . The volume of gasoline and diesel oil consumption has been found with a positive effect on PM 2.5 with a 0.065% increase in PM 2.5 concentration if there is a 1% consumption of gasoline and diesel increase. We also find that estimated coefficient results of three meteorological variables are all significant at 1% and 5%, showing us the strong sensitivity of population-weighted PM 2.5 exposure to climate change. Temperature and relative humidity are positively correlated with PM 2.5 , while average precipitation and PM 2.5 have a negative correlation. These estimated results have similar trends with the results in another research that using an 11-year observational record over the contiguous US [37].
In addition, the estimated coefficient of dummy variable B08 indicates that the difference in population-weighted PM 2.5 exposure before and after 2008, year the Olympics were held, is statistically significant at 1% level and the concentration of PM 2.5 after 2008 is lower than in 2004–2008 by about 14.5%. This means the achievements from China’s efforts in providing a better air quality during the 2008 Olympic Games are significant.

4.2. Estimating Multiple Threshold Effects of P M 2.5 on Mortality

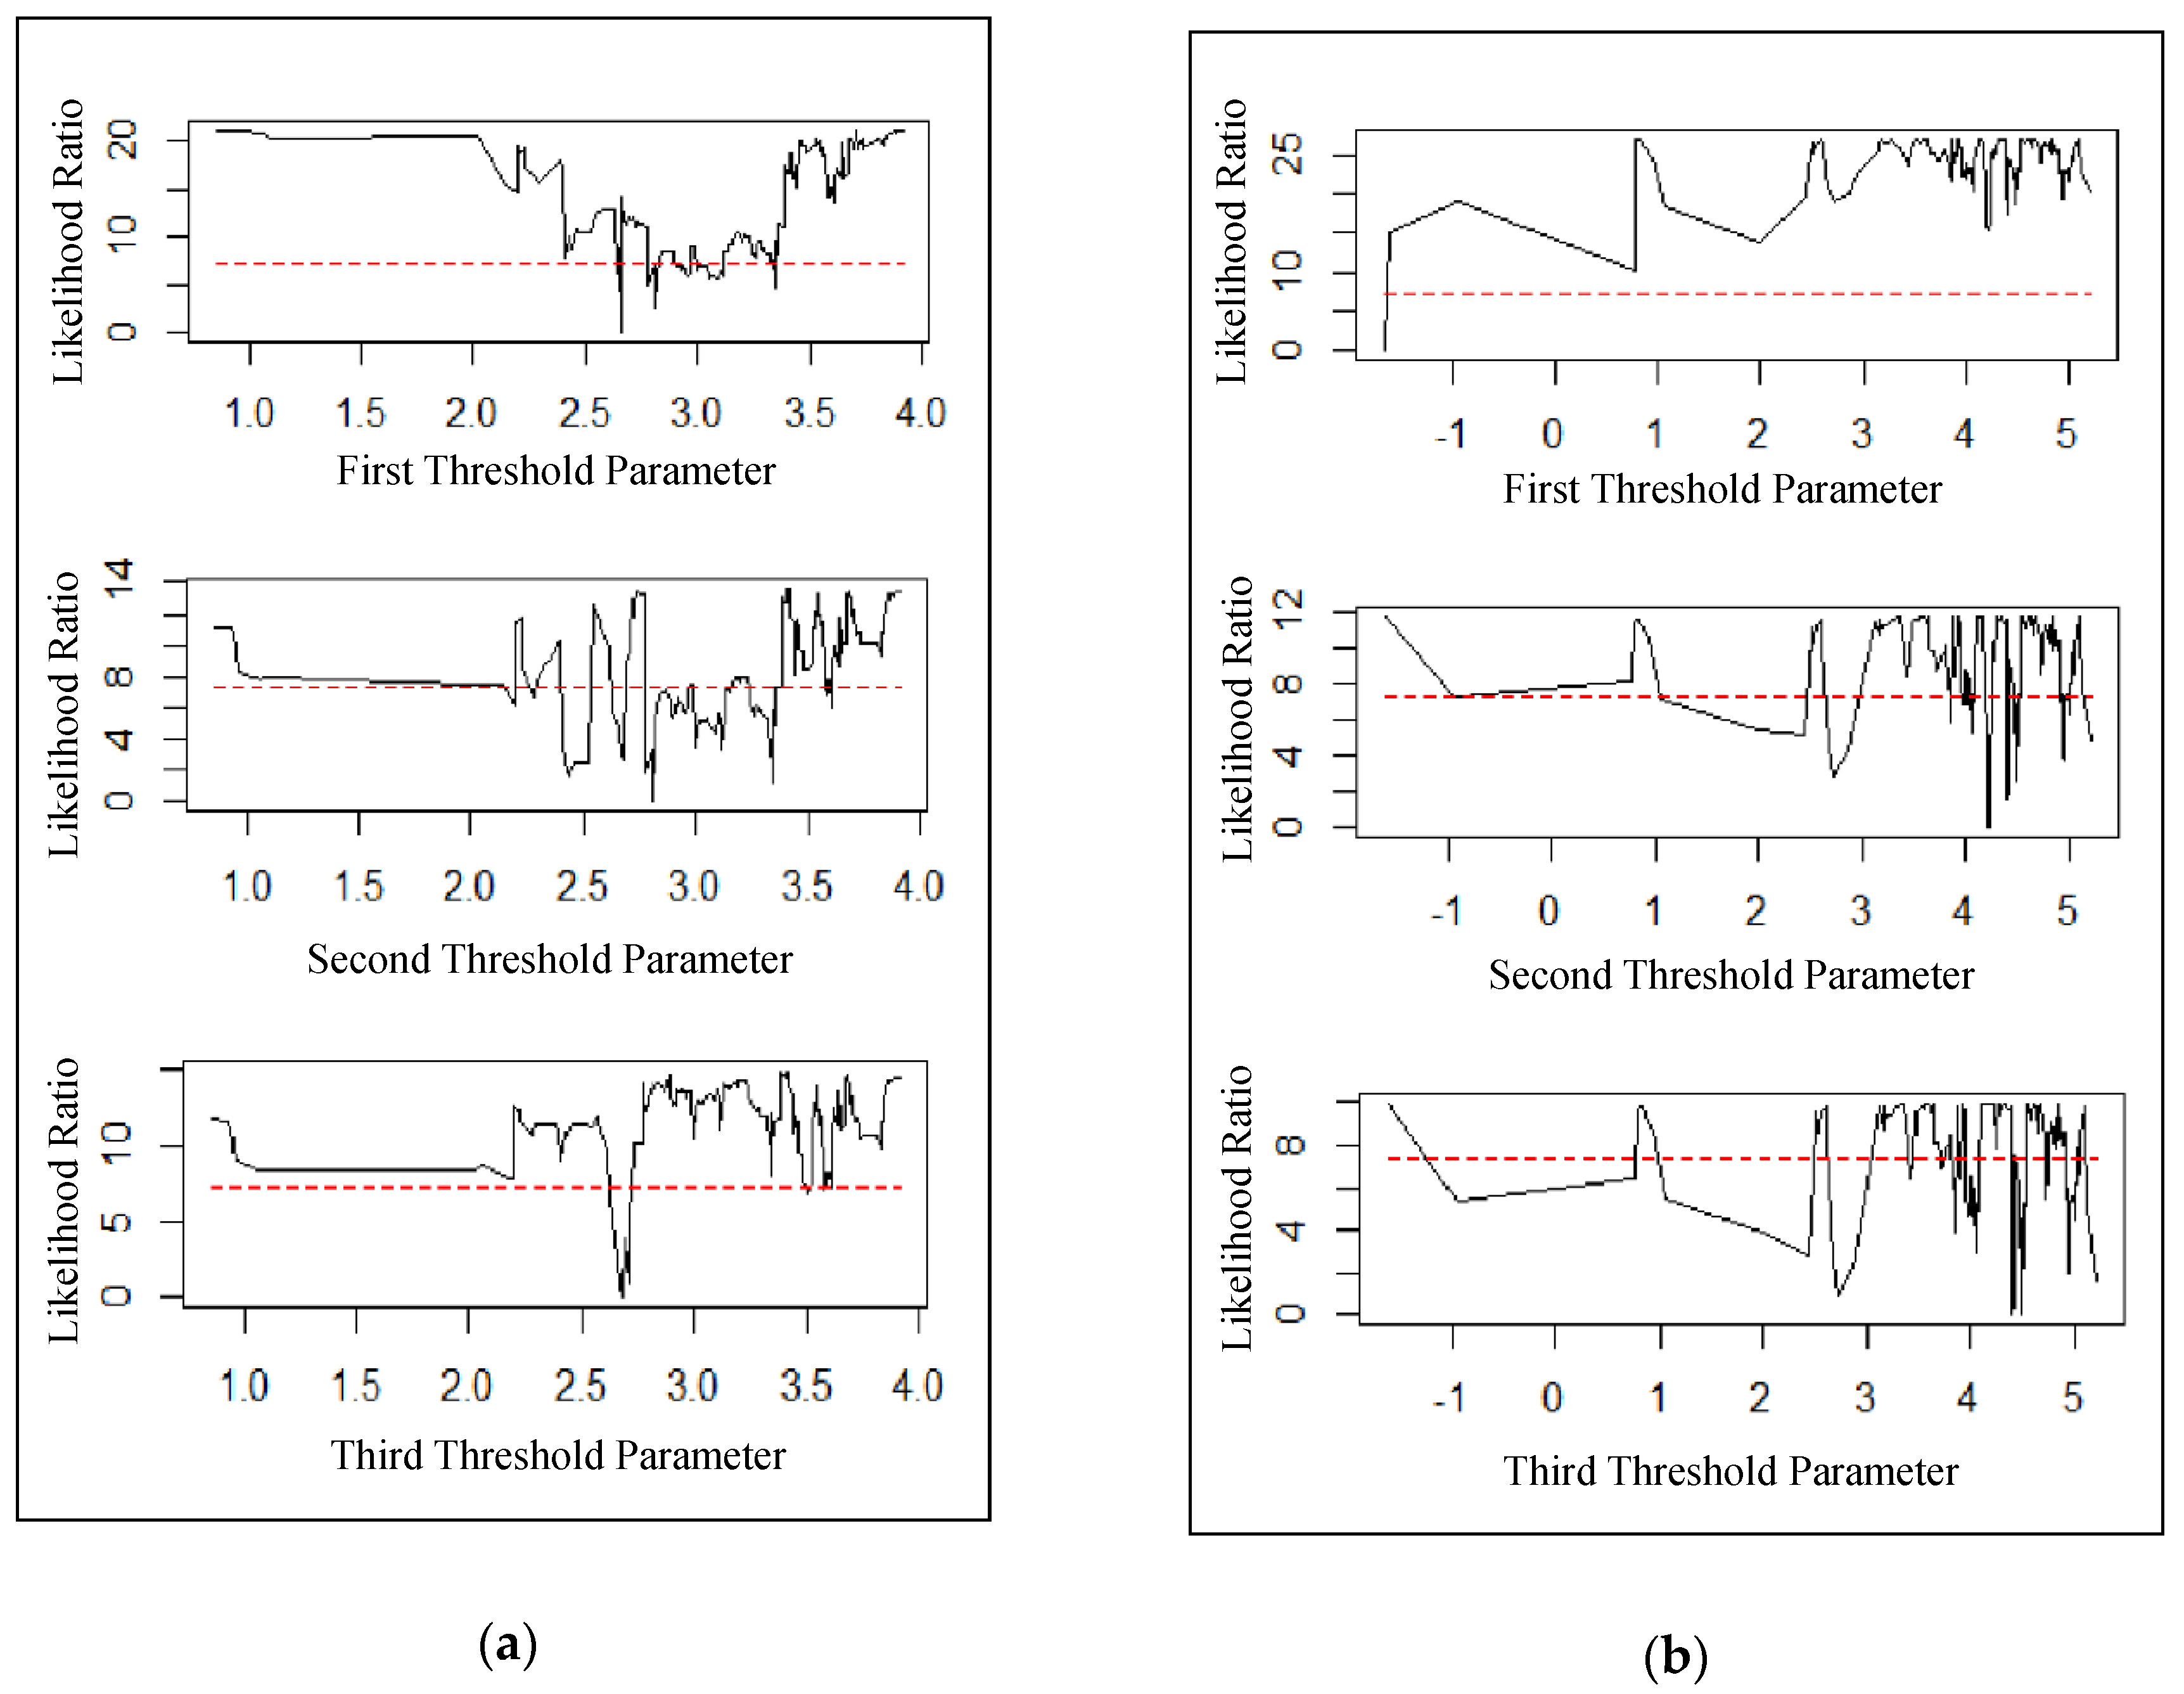
4.2.1. Testing for Multiple Thresholds

A logarithmic version of Hansen’s threshold model is estimated using a panel data approach, as a panel threshold model (PTM). Table 4 shows the results of the threshold effect tests.
For the PM 2.5 –cardiovascular mortality ( MOT 1 ) relationship, the single and triple effects are all significant at a 1% level. We choose the triple threshold effect for further estimation to see the health impacts of PM 2.5 ’s thresholds more thoroughly. These three estimated thresholds (Table 5) are 17.67 μg/ m 3 , 21.62 μg/ m 3 and 34.27 μg/ m 3 with narrow confidence intervals.
In terms of respiratory mortality ( MOT 2 ), SO 2 emission is selected as the threshold variable instead. Table 4 shows that the double effect is not significant, while the test results of the single and triple effects are significant at 1% and 5%, respectively. Hence, we choose a single effect based on the lowest P-value. The estimated threshold of regional SO 2 mission (Table 6) is 80.13 tons/year.
As the best way to form confidence intervals for threshold is to form “no-rejection region” using the likelihood-ratio (LR) statistic for tests on threshold estimates [26], we plot the LR statistic (Figure 2) to display the threshold confidence intervals.
In Figure 2a, the LR statistic of the third threshold mostly exceeds α quantile (7.35), while LR values of the first and the second threshold do not, which means that there exists a triple threshold effect in the relationship between PM 2.5 and cardiovascular mortality rate. Regarding association between SO 2 pollution and respiratory mortality rate, Figure 2b shows that only a single threshold effect is significant.

4.2.2. Estimated Effects of PM 2.5 on Cause-Specific Mortality Rate

As in Table 5, the estimated coefficients of the air pollutants are different compared to each other and to itself under specific threshold levels of the annual population-weighted PM 2.5 exposure. We find that when PM 2.5 is between 17.67 μg/ m 3 and 21.62 μg/ m 3 , a 1% PM 2.5 increase leads to a 0.80% increase in mortality rate of cardiovascular disease. When PM 2.5 is between 21.62 μg/ m 3 and 34.27 μg/ m 3 , a 1% PM 2.5 increase results in a 0.26% increase in the mortality rate.
The regression estimates of NO 2 and SO 2 show that when the annual PM 2.5 exposure is lower than 17.67 μg/ m 3 , a 1% increase in NO 2   concentration leads to a 0.19% increase in cardiovascular mortality rate, while the health impact of SO 2 is not significant. When PM 2.5 is between 21.62 μg/ m 3 and 34.27 μg/ m 3 , a 1% increase in SO 2 emission causes 0.05% cardiovascular mortality rate increase, and when PM 2.5 is higher than 34.27 μg/ m 3 , this impact is increased by 0.17%. However, we get negative signs for the estimated coefficients of SO 2 and NO 2 under the second and the third regimes.
In terms of respiratory mortality rate, Table 6 displays the panel threshold model outcomes, indicating that the impact of PM 2.5 depends on the initial SO 2 emission. When the average regional SO 2 emission is lower than 80.13 tons/year, a 1% increase in PM 2.5 leads to an increment of 0.17% in mortality rate. When SO 2 is higher 80.13 tons/year, a 1% increase in PM 2.5 increases the respiratory mortality rate by 0.25%. The NO 2 emission is also found to be associated with human health where a 1% increase in NO 2 causes respiratory mortality increased by 0.17%.
We find a significant positive impact of the economic developing where a 1% increase in GRP increases the cardiovascular mortality by 0.04%. However, we find a negative relationship between GRP and respiratory mortality rate.

4.2.3. Two-stage Econometric Approach for Health Effects of Coal Consumption

Equation (1) allows us to estimate the change in PM 2.5 given by the change in coal consumption. We then combine this with Equation (3) and Equation (4), which found the threshold effects of   PM 2.5 on cause-specific mortality, to calculate the percentage change in mortality corresponded to a 1% change in coal consumption. We do this by multiplying the estimated coefficient of coal consumption and the values of regression estimates of PM 2.5 together. Table 7 displays the results.
The final outcome of the two-stage approach indicate that cardiovascular mortality rate increases by 0.188% when coal consumption increases by 1% in regions where the population-weighted PM 2.5 exposure is between 17.67 μg/ m 3 and 21.62 μg/ m 3 , and that it increases by 0.06% for a 1% increase in coal consumption when PM 2.5 is between 21.62 μg/ m 3 and 34.27 μg/ m 3 . In terms of respiratory mortality, when the regional SO 2 emission is less than 80.13 tons/year, under the health impacts of PM 2.5 , a 1% coal consumption increase leads to a 0.04% increase in mortality rate. When SO 2 emission is greater than 80.13 tons per year, a 1% increase in coal consumption leads to a 0.058% increase in respiratory mortality due to exposure to PM 2.5 .

5. Discussion

Regarding the trend of the estimated coefficient of PM 2.5 for different thresholds of PM 2.5 , the health effect at the second regime has the highest degree of impact on cardiovascular mortality rate. However, the effect became less serious for the next regime of exposure to PM 2.5 , afterward. This could be explained by human awareness of air pollution leading people to protect themselves from bad air quality. When the level of PM 2.5 is too high, it could be visually identified by the citizens or be notified officially by a red alert with respect to air pollution; thus, people become more aware of the dangerous characteristics of pollution levels and are more active in protecting their own health from the polluted air. Mortality rate per 1% increment of PM 2.5 tended to decrease at higher concentrations in accordance with prior findings from Pope, et al. [54] and Pope III, Burnett, Turner, Cohen, Krewski, Jerrett, Gapstur and Thun [7], which showed the adjusted relative risk of cardiovascular plotted over estimated daily dose of PM 2.5 and found that the exposure-response curve becomes flatter at higher degree of PM 2.5 . According to Chen, et al. [55], it was inferred that possibly susceptible individuals may have died before the PM 2.5   concentration had reached higher levels. Thus, due to the severe health damage at the medium regimes of PM 2.5 threshold, people should pay more attention to these levels because the human body suffers gradually from exposure to air pollutants from low to high concentrations.
SO 2 is formed when fossil fuels containing sulfur, such as coal or crude oil, are burned, and this air pollutant is known to be one of the major causes of respiratory mortality. Since different levels of SO 2 emission lead to difference in PM 2.5 concentrations, the health impacts of PM 2.5 are not below the emission thresholds of sulfur dioxide to the same degree. Particularly, the mortality effect of PM 2.5 becomes more severe at higher levels of SO 2 emission. Compared to findings from previous research, where the acute effect of SO 2 on respiratory disease mortalities was even higher than that from PM 2.5 or NO 2 [48,49], this study contributes to the existing literature as evidence of adverse effects of SO 2 on respiratory mortality, no matter whether it is studied separately or through PM 2.5 .
As mentioned, this study estimates the percentage of change in mortality given a percentage change in PM 2.5 , to appropriately depict the exposure-response relation with multiple threshold effects. However, to better compare our findings to previous studies, we convert the outcomes to comparable values by dividing the estimates in the fourth column of Table 7 by average PM 2.5 , and multiplied by 1000. In this way, converted estimates of health effect showed the percentage change in cause-specific mortality caused by a 10 μg/ m 3 increase in   PM 2.5 . Table 8 presents the results in comparison with previous studies.
As can be seen, the health effects for the ranges in which population-weighted PM 2.5 exposure falls are larger than the short-term effects and smaller than health effects from long-term exposure in China. For instance, for each 10 μg/ m 3 increase in   PM 2.5 , the short-term (daily) exposure caused a 0.41% and 0.95% increase of cardiovascular and respiratory mortality, respectively [19], a 1-year lagged effect of PM 2.5 exposure that was conducted in this study leads to a 9.63–30.18% increment in cardiovascular mortality rate and about 6.45–9.35% in mortality rate for respiratory diseases (Table 8), while the long-term exposure to particulate matter in 10-year follow up studies has reported that it caused an increase of 55% in cardiovascular mortality and 67% in respiratory mortality in Shenyang, China [39,40], or an increase of 31% in ischemic cardiovascular mortality in Canada [24].

6. Conclusions

6.1. Contribution of the Study

The effect of ambient air pollution on human health has been extensively studied over the past five decades. Among the research directions that are motivated, providing convincing evidence of nonlinear exposure-response relationship with specific PM 2.5 thresholds could provide useful information for efforts to protect public health from the impacts of poor air quality. However, the threshold effects of population-weighted PM 2.5 exposure on cause-specific mortality in China have not been estimated. In this study, we investigate this issue.
The empirical results indicate that air pollution will influence mortality of cardiovascular and respiratory diseases through PM 2.5 levels. We find that the effects depend on the ranges in which air pollutant falls, with critical levels at 17.67 μg/ m 3 , 21.62 μg/ m 3 , and 34.27 μg/ m 3 for PM 2.5 concentration, at 80.13 tons/year for SO 2 emission. In particular, between 17.67 μg/ m 3 and 21.62 μg/ m 3 , we find that a 1% increase in PM 2.5 causes a 0.8% increase in cardiovascular mortality rate. When SO 2 is above 80.13 tons/year, a 1% increase in PM 2.5 causes a 0.25% increase in respiratory mortality rate. We also estimate the effect of coal consumption, where a 1% increase in coal consumption causes a 0.23% increase in PM 2.5 concentration.
Our two-stage econometric approach allows us to examine the health effects of coal consumption through multiple threshold effects of   PM 2.5 . The result shows that when exposure to PM 2.5 is between 17.67 μg/ m 3 and 21.62 μg/ m 3 , a 1% increase in coal consumption leads to a 0.188% increase in cardiovascular mortality rate. In terms of mortality, when SO 2 emission is greater than 80.13 tons/year, under the health impacts of PM 2.5 , a 1% increase in coal consumption leads to a 0.06% increase in respiratory mortality rate.
The findings indicate that the consumption of fossil fuel energy is a major cause of particulate air pollution and lead to further adverse cardiovascular and respiratory health impacts.

6.2. Implications of the Study

Compared to the standards of WHO Air Quality Guideline and the National Ambient Air Quality Standard of China (GB 3095–2012), 17.67 μg/ m 3 is close to the lowest annual PM 2.5 level of the China standard (grade I), and the WHO interim target-3 (IT-3) is 15 μg/ m 3 . In addition, the third estimated PM 2.5 threshold (34.27 μg/ m 3 ) seems to be close to the highest standard levels, such as IT-1 of the WHO standard and limit value of grade II in the GB 3095–2012 standard (35 μg/ m 3 ). The findings of threshold effect provide an intuitive metric of PM 2.5 standards to reinforce or improve current air quality standards, especially for countries with high level of air pollutants. The estimates of health effects under the population-weighted   PM 2.5 ’s thresholds could be considered to set more specific emission limits or punishment levels for controlling polluting activities in China and other developing countries. It is also important to impose air quality control strategies that consider population density of area since “population-weighted” exposure to PM 2.5 is found significantly associated with mortality rate.
In addition, owing to the significant association between fossil fuel consumption and mortality rates, it is necessary to reduce our dependence on this polluting energy sources. The improvement achieved in reducing air pollution during and after 2008 is strong evidence that supports for optimistic future of China’s air if the government continues durable clean air plans.

6.3. Limitations of the Study

Despite the large-scale study area and the remarkable contribution to finding out the thresholds of   PM 2.5 , the database approach is a constraint with some limitations. The first limitation concerns the data of regional cause-specific mortality. Due to the lack of available annual regional cause-specific mortality, the annual data of mortality in this study are simulated from the GDB 5-year-interval mortality data. This simulation may cause unusual changes in real mortality rate to be ignored, leading to unconvincing estimation outcomes. The second limitation is rooted in the difference in units of measurement for the air pollutants: population-weighted PM 2.5 exposure (μg/ m 3 ), SO 2 emission (10,000 tons) and NO 2 concentration (μg/ m 3 ). Thus, the health effects of specific air pollutants are not really logical to interpret and draw comparisons between them as well. Additionally, only population-weighted PM 2.5 concentration data without considering human activities with time spent and breathing rates could not be considered as “exposure to PM 2.5 ” to accurately estimate its health impacts. This is the third limitation.

6.4. Recommendations for Further Research

As we need limitations to inspire better thinking, we firstly recommend that further studies use a more appropriate database, such as higher frequency data or data better representing the actual exposure to PM 2.5 , to achieve higher-quality estimation results. Second, health impacts caused by acute PM 2.5 exposure are not reflected by mortality rate alone; estimation of reduction in life expectancy, or increases in morbidity may be preferable. Finally, the non-significance of the PM 2.5 lowest threshold could be considered a safe threshold of PM 2.5 for cardiovascular mortality. Future research is also encouraged in the direction of identifying a safe threshold of exposure to PM 2.5 on cause-specific mortality and morbidity for contributing more evidence supports environmental science even though they may be different from this study.

Author Contributions

Conceptualization, C.-C.C. (Chi-Chung Chen) and B.-L.T.; methodology, C.-S.H., C.-C.C. (Ching-Cheng Chang), W.-C.T. and S.-H.H.; formal analysis, B.-L.T. and C.-S.H.; data curation, B.-L.T.; writing—original draft preparation, B.-L.T.; writing—review and editing, C.-C.C. (Chi-Chung Chen), C.-C.C. (Ching-Cheng Chang), W.-C.T. and C.-S.H.; supervision, C.-C.C. (Chi-Chung Chen).

Funding

This research received no external funding.

Acknowledgments

The authors wish to thank Professor Christopher J L Murray, Institute for Health Metrics and Evaluation, University of Washington, corresponding author of the Global Burden of Disease Study (GBD 2013) for providing us data of mortality estimates for specific causes in China at provincial level to finalize this study. The authors also wish to thank the anonymous reviewers, whose insightful comments and useful suggestions greatly contributed to improving this paper.

Conflicts of Interest

The authors declare no conflict of interest.

References

  1. Nemmar, A.; Hoet, P.M.; Vanquickenborne, B.; Dinsdale, D.; Thomeer, M.; Hoylaerts, M.; Vanbilloen, H.; Mortelmans, L.; Nemery, B. Passage of inhaled particles into the blood circulation in humans. Circulation 2002, 105, 411–414. [Google Scholar] [CrossRef]
  2. Oberdörster, G.; Sharp, Z.; Atudorei, V.; Elder, A.; Gelein, R.; Lunts, A.; Kreyling, W.; Cox, C. Extrapulmonary translocation of ultrafine carbon particles following whole-body inhalation exposure of rats. J. Toxicol. Environ. Health A 2002, 65, 1531–1543. [Google Scholar] [CrossRef]
  3. He, X.; Zhang, H.; Ma, Y.; Bai, W.; Zhang, Z.; Lu, K.; Ding, Y.; Zhao, Y.; Chai, Z. Lung deposition and extrapulmonary translocation of nano-ceria after intratracheal instillation. Nanotechnology 2010, 21, 285103. [Google Scholar] [CrossRef]
  4. Brook, R.D.; Rajagopalan, S.; Pope, C.A.; Brook, J.R.; Bhatnagar, A.; Diez-Roux, A.V.; Holguin, F.; Hong, Y.; Luepker, R.V.; Mittleman, M.A. Particulate matter air pollution and cardiovascular disease: an update to the scientific statement from the American Heart Association. Circulation 2010, 121, 2331–2378. [Google Scholar] [CrossRef]
  5. Chiu, H.-F.; Tsai, S.-S.; Weng, H.-H.; Yang, C.-Y. Short-term effects of fine particulate air pollution on emergency room visits for cardiac arrhythmias: A case-crossover study in Taipei. J. Toxicol. Environ. Health A 2013, 76, 614–623. [Google Scholar] [CrossRef]
  6. Franklin, M.; Zeka, A.; Schwartz, J. Association between PM2.5 and all-cause and specific-cause mortality in 27 US communities. J. Expo. Sci. Environ. Epidemiol. 2007, 17, 279–287. [Google Scholar] [CrossRef]
  7. Pope, C.A., III; Burnett, R.T.; Turner, M.C.; Cohen, A.; Krewski, D.; Jerrett, M.; Gapstur, S.M.; Thun, M.J. Lung cancer and cardiovascular disease mortality associated with ambient air pollution and cigarette smoke: shape of the exposure–response relationships. Environ. Health Perspect. 2011, 119, 1616–1621. [Google Scholar] [CrossRef]
  8. Thurston, G.D.; Burnett, R.T.; Turner, M.C.; Shi, Y.; Krewski, D.; Lall, R.; Ito, K.; Jerrett, M.; Gapstur, S.M.; Diver, W.R. Ischemic heart disease mortality and long-term exposure to source-related components of US fine particle air pollution. Environ. Health Perspect. 2016, 124, 785–794. [Google Scholar] [CrossRef]
  9. Anenberg, S.C.; Horowitz, L.W.; Tong, D.Q.; West, J.J. An estimate of the global burden of anthropogenic ozone and fine particulate matter on premature human mortality using atmospheric modeling. Environ. Health Perspect. 2010, 118, 1189–1195. [Google Scholar] [CrossRef]
  10. Ostro, B.D.; Lipsett, M.J.; Wiener, M.B.; Selner, J.C. Asthmatic responses to airborne acid aerosols. Am. J. Public Health 1991, 81, 694–702. [Google Scholar] [CrossRef]
  11. Shang, Y.; Sun, Z.; Cao, J.; Wang, X.; Zhong, L.; Bi, X.; Li, H.; Liu, W.; Zhu, T.; Huang, W. Systematic review of Chinese studies of short-term exposure to air pollution and daily mortality. Environ. Int. 2013, 54, 100–111. [Google Scholar] [CrossRef]
  12. Slaughter, J.C.; Lumley, T.; Sheppard, L.; Koenig, J.Q.; Shapiro, G.G. Effects of ambient air pollution on symptom severity and medication use in children with asthma. Ann. Allergy Asthma Immunol. 2003, 91, 346–353. [Google Scholar] [CrossRef]
  13. Yu, H.-L.; Chien, L.-C. Short-term population-based non-linear concentration–response associations between fine particulate matter and respiratory diseases in Taipei (Taiwan): A spatiotemporal analysis. J. Expo. Sci. Environ. Epidemiol. 2016, 26, 197–206. [Google Scholar] [CrossRef]
  14. Dan, M.; Zhuang, G.; Li, X.; Tao, H.; Zhuang, Y. The characteristics of carbonaceous species and their sources in PM2.5 in Beijing. Atmos. Environ. 2004, 38, 3443–3452. [Google Scholar] [CrossRef]
  15. Song, Y.; Zhang, Y.; Xie, S.; Zeng, L.; Zheng, M.; Salmon, L.G.; Shao, M.; Slanina, S. Source apportionment of PM2.5 in Beijing by positive matrix factorization. Atmos. Environ. 2006, 40, 1526–1537. [Google Scholar] [CrossRef]
  16. Ma, Q.; Cai, S.; Wang, S.; Zhao, B.; Martin, R.V.; Brauer, M.; Cohen, A.; Jiang, J.; Zhou, W.; Hao, J. Impacts of coal burning on ambient PM 2.5 pollution in China. Atmos. Chem. Phys. 2017, 17, 4477–4491. [Google Scholar] [CrossRef]
  17. Yang, C.; Peng, X.; Huang, W.; Chen, R.; Xu, Z.; Chen, B.; Kan, H. A time-stratified case-crossover study of fine particulate matter air pollution and mortality in Guangzhou, China. Int. Arch. Occup. Environ. Health 2012, 85, 579–585. [Google Scholar] [CrossRef]
  18. Ma, Y.; Chen, R.; Pan, G.; Xu, X.; Song, W.; Chen, B.; Kan, H. Fine particulate air pollution and daily mortality in Shenyang, China. Sci. Total Environ. 2011, 409, 2473–2477. [Google Scholar] [CrossRef]
  19. Kan, H.; London, S.J.; Chen, G.; Zhang, Y.; Song, G.; Zhao, N.; Jiang, L.; Chen, B. Differentiating the effects of fine and coarse particles on daily mortality in Shanghai, China. Environ. Int. 2007, 33, 376–384. [Google Scholar] [CrossRef] [Green Version]
  20. Daniels, M.J.; Dominici, F.; Samet, J.M.; Zeger, S.L. Estimating particulate matter-mortality dose-response curves and threshold levels: An analysis of daily time-series for the 20 largest US cities. Am. J. Epidemiol. 2000, 152, 397–406. [Google Scholar] [CrossRef]
  21. Samoli, E.; Analitis, A.; Touloumi, G.; Schwartz, J.; Anderson, H.R.; Sunyer, J.; Bisanti, L.; Zmirou, D.; Vonk, J.M.; Pekkanen, J. Estimating the exposure–response relationships between particulate matter and mortality within the APHEA multicity project. Environ. Health Perspect. 2005, 113, 88–95. [Google Scholar] [CrossRef]
  22. Schwartz, J.; Laden, F.; Zanobetti, A. The concentration-response relation between PM (2.5) and daily deaths. Environ. Health Perspect. 2002, 110, 1025–1029. [Google Scholar] [CrossRef]
  23. Krewski, D.; Jerrett, M.; Burnett, R.T.; Ma, R.; Hughes, E.; Shi, Y.; Turner, M.C.; Pope, C.A., III; Thurston, G.; Calle, E.E. Extended Follow-up and Spatial Analysis of the American Cancer Society Study Linking Particulate Air Pollution and Mortality; Health Effects Institute: Boston, MA, USA, 2009. [Google Scholar]
  24. Crouse, D.L.; Peters, P.A.; van Donkelaar, A.; Goldberg, M.S.; Villeneuve, P.J.; Brion, O.; Khan, S.; Atari, D.O.; Jerrett, M.; Pope, C.A., III. Risk of nonaccidental and cardiovascular mortality in relation to long-term exposure to low concentrations of fine particulate matter: A Canadian national-level cohort study. Environ. Health Perspect. 2012, 120, 708–714. [Google Scholar] [CrossRef]
  25. Burnett, R.T.; Pope, C.A., III; Ezzati, M.; Olives, C.; Lim, S.S.; Mehta, S.; Shin, H.H.; Singh, G.; Hubbell, B.; Brauer, M. An integrated risk function for estimating the global burden of disease attributable to ambient fine particulate matter exposure. Environ. Health Perspect. 2014, 122, 397–403. [Google Scholar] [CrossRef]
  26. Hansen, B.E. Threshold effects in non-dynamic panels: Estimation, testing, and inference. J. Econom. 1999, 93, 345–368. [Google Scholar] [CrossRef] [Green Version]
  27. Hansen, B.E. Sample splitting and threshold estimation. Econometrica 2000, 68, 575–603. [Google Scholar] [CrossRef]
  28. Cox, L.A.T. Effects of exposure estimation errors on estimated exposure-response relations for PM2.5. Environ. Res. 2018, 164, 636–646. [Google Scholar] [CrossRef]
  29. Dong, L. Capping Coal Consumption and Reduce Carbon Emission in China’s Industrial Sector. Available online: http://www.stanleyfoundation.org/climatechange/Dong-CappingCoalConsumptionReduceCarbonEmissions-China’sIndlSctr.pdf (accessed on 5 September 2018).
  30. GBD MAPS Working Group. Burden of Disease Attributable to Coal-Burning and Other Air Pollution Sources in China. Available online: https://www.healtheffects.org/system/files/GBDMAPS-ReportEnglishFinal1.pdf (accessed on 15 August 2018).
  31. Zhang, Y.-L.; Cao, F. Fine particulate matter (PM 2.5) in China at a city level. Sci. Rep. 2015, 5, 14884. [Google Scholar] [CrossRef]
  32. Westerdahl, D.; Wang, X.; Pan, X.; Zhang, K.M. Characterization of on-road vehicle emission factors and microenvironmental air quality in Beijing, China. Atmos. Environ. 2009, 43, 697–705. [Google Scholar] [CrossRef]
  33. Zheng, M.; Salmon, L.G.; Schauer, J.J.; Zeng, L.; Kiang, C.; Zhang, Y.; Cass, G.R. Seasonal trends in PM2.5 source contributions in Beijing, China. Atmos. Environ. 2005, 39, 3967–3976. [Google Scholar] [CrossRef]
  34. Venkatram, A.; Fitz, D.; Bumiller, K.; Du, S.; Boeck, M.; Ganguly, C. Using a dispersion model to estimate emission rates of particulate matter from paved roads. Atmos. Environ. 1999, 33, 1093–1102. [Google Scholar] [CrossRef]
  35. Kuhns, H.; Gillies, J.; Etyemezian, V.; Nikolich, G.; King, J.; Zhu, D.; Uppapalli, S.; Engelbrecht, J.; Kohl, S. Effect of soil type and momentum on unpaved road particulate matter emissions from wheeled and tracked vehicles. Aerosol Sci. Technol. 2010, 44, 187–196. [Google Scholar] [CrossRef]
  36. Dawson, J.; Adams, P.; Pandis, S. Sensitivity of PM 2.5 to climate in the Eastern US: A modeling case study. Atmos. Chem. Phys. 2007, 7, 4295–4309. [Google Scholar] [CrossRef]
  37. Tai, A.P.; Mickley, L.J.; Jacob, D.J. Correlations between fine particulate matter (PM2.5) and meteorological variables in the United States: Implications for the sensitivity of PM2.5 to climate change. Atmos. Environ. 2010, 44, 3976–3984. [Google Scholar] [CrossRef]
  38. Wang, J.; Ogawa, S. Effects of meteorological conditions on PM2.5 concentrations in Nagasaki, Japan. Int. J. Environ. Res. Public Health 2015, 12, 9089–9101. [Google Scholar] [CrossRef]
  39. Zhang, P.; Dong, G.; Sun, B.; Zhang, L.; Chen, X.; Ma, N.; Yu, F.; Guo, H.; Huang, H.; Lee, Y.L. Long-term exposure to ambient air pollution and mortality due to cardiovascular disease and cerebrovascular disease in Shenyang, China. PLoS ONE 2011, 6, e20827. [Google Scholar] [CrossRef]
  40. Dong, G.-H.; Zhang, P.; Sun, B.; Zhang, L.; Chen, X.; Ma, N.; Yu, F.; Guo, H.; Huang, H.; Lee, Y.L. Long-term exposure to ambient air pollution and respiratory disease mortality in Shenyang, China: A 12-year population-based retrospective cohort study. Respiration 2012, 84, 360–368. [Google Scholar] [CrossRef]
  41. Shima, M.; Adachi, M. Effect of outdoor and indoor nitrogen dioxide on respiratory symptoms in schoolchildren. Int. J. Epidemiol. 2000, 29, 862–870. [Google Scholar] [CrossRef] [Green Version]
  42. Filleul, L.; Rondeau, V.; Vandentorren, S.; Le Moual, N.; Cantagrel, A.; Annesi-Maesano, I.; Charpin, D.; Declercq, C.; Neukirch, F.; Paris, C. Twenty five year mortality and air pollution: Results from the French PAARC survey. Occup. Environ. Med. 2005, 62, 453–460. [Google Scholar] [CrossRef]
  43. Samoli, E.; Aga, E.; Touloumi, G.; Nisiotis, K.; Forsberg, B.; Lefranc, A.; Pekkanen, J.; Wojtyniak, B.; Schindler, C.; Niciu, E. Short-term effects of nitrogen dioxide on mortality: An analysis within the APHEA project. Eur. Respir. J. 2006, 27, 1129–1138. [Google Scholar] [CrossRef]
  44. Guo, Y.; Barnett, A.G.; Zhang, Y.; Tong, S.; Yu, W.; Pan, X. The short-term effect of air pollution on cardiovascular mortality in Tianjin, China: Comparison of time series and case–crossover analyses. Sci. Total Environ. 2010, 409, 300–306. [Google Scholar] [CrossRef]
  45. Kan, H.; London, S.J.; Chen, G.; Zhang, Y.; Song, G.; Zhao, N.; Jiang, L.; Chen, B. Season, sex, age, and education as modifiers of the effects of outdoor air pollution on daily mortality in Shanghai, China: The Public Health and Air Pollution in Asia (PAPA) Study. Environ. Health Perspect. 2008, 116, 1183–1188. [Google Scholar] [CrossRef]
  46. Kan, H.; Wong, C.-M.; Vichit-Vadakan, N.; Qian, Z. Short-term association between sulfur dioxide and daily mortality: The Public Health and Air Pollution in Asia (PAPA) study. Environ. Res. 2010, 110, 258–264. [Google Scholar] [CrossRef] [Green Version]
  47. Apte, J.S.; Marshall, J.D.; Cohen, A.J.; Brauer, M. Addressing global mortality from ambient PM2.5. Environ. Sci. Technol. 2015, 49, 8057–8066. [Google Scholar] [CrossRef]
  48. Ren, M.; Li, N.; Wang, Z.; Liu, Y.; Chen, X.; Chu, Y.; Li, X.; Zhu, Z.; Tian, L.; Xiang, H. The short-term effects of air pollutants on respiratory disease mortality in Wuhan, China: Comparison of time-series and case-crossover analyses. Sci. Rep. 2017, 7, 40482. [Google Scholar] [CrossRef]
  49. Mo, Z.; Fu, Q.; Zhang, L.; Lyu, D.; Mao, G.; Wu, L.; Xu, P.; Wang, Z.; Pan, X.; Chen, Z.; et al. Acute effects of air pollution on respiratory disease mortalities and outpatients in Southeastern China. Sci. Rep. 2018, 8, 3461. [Google Scholar] [CrossRef]
  50. Hsu, A. Seeing China’s Pollution from Space. Available online: https://www.chinadialogue.net/article/show/single/en/4775-Seeing-China-s-pollution-from-space (accessed on 5 January 2018).
  51. Yao, L.; Lu, N. Particulate matter pollution and population exposure assessment over mainland China in 2010 with remote sensing. Int. J. Environ. Res. Public Health 2014, 11, 5241–5250. [Google Scholar] [CrossRef]
  52. National Bureau of Statistics of China. Available online: http://www.stats.gov.cn/english/Statisticaldata/AnnualData/ (accessed on 26 January 2018).
  53. Zhou, M.; Wang, H.; Zhu, J.; Chen, W.; Wang, L.; Liu, S.; Li, Y.; Wang, L.; Liu, Y.; Yin, P. Cause-specific mortality for 240 causes in China during 1990–2013: A systematic subnational analysis for the Global Burden of Disease Study 2013. Lancet 2016, 387, 251–272. [Google Scholar] [CrossRef]
  54. Pope, C.A.; Burnett, R.T.; Krewski, D.; Jerrett, M.; Shi, Y.; Calle, E.E.; Thun, M.J. Cardiovascular mortality and exposure to airborne fine particulate matter and cigarette smoke: Shape of the exposure-response relationship. Circulation 2009, 120, 941–948. [Google Scholar] [CrossRef]
  55. Chen, B.; Kan, H.; Chen, R.; Jiang, S.; Hong, C. Air pollution and health studies in China—Policy implications. J. Air Waste Manag. Assoc. 2011, 61, 1292–1299. [Google Scholar] [CrossRef]
  56. Pope, C.A., III; Burnett, R.T.; Thun, M.J.; Calle, E.E.; Krewski, D.; Ito, K.; Thurston, G.D. Lung cancer, cardiopulmonary mortality, and long-term exposure to fine particulate air pollution. JAMA 2002, 287, 1132–1141. [Google Scholar] [CrossRef]
  57. Beelen, R.; Hoek, G.; van Den Brandt, P.A.; Goldbohm, R.A.; Fischer, P.; Schouten, L.J.; Jerrett, M.; Hughes, E.; Armstrong, B.; Brunekreef, B. Long-term effects of traffic-related air pollution on mortality in a Dutch cohort (NLCS-AIR study). Environ. Health Perspect. 2008, 116, 196–202. [Google Scholar] [CrossRef]
Figure 1. Mapping annual coal consumption and surface distribution of population-weighted exposure to PM 2.5 concentration in China for the years 2005 to 2010.
Ijerph 16 03549 g001
Figure 2. Confidence interval construction in (a) PM 2.5 thresholds and (b)   SO 2 thresholds. Note: The dashed line denotes the critical value (7.35) at the 95% confidence level.
Ijerph 16 03549 g002
Table 1. Descriptive statistics for variables in panel regression model.
VariablesDescriptionMeanMedianMaxMinStd. Dev.
PM 2.5 PM 2.5 concentration ( μ g / m 3 )27.2626.9651.912.1711.71
Coal_conscoal consumption (10,000 tons)10,520.768559.7337,327.89332.237897.92
GasDie_cons gasoline-diesel consumption (10,000 tons)682.03568.772754.6840.74496.26
Paved_Rd per capita area of paved road (sq.m)11.4111.1922.234.043.31
Temp average temperature ( )14.4715.125.44.55.07
Humidrelative humidity (%)64.246683449.41
Precp precipitation (mm)867.63765.62628.274.9503.46
Observations203
Table 2. Descriptive statistics for variables in panel threshold regression model.
VariablesDescriptionMeanMedianMaxMinStd. Dev.
MOT 1 cardiovascular mortality rate (deaths per 100,000 persons)238.84239.02355.85152.9449.04
MOT 2 respiratory mortality rate (deaths per 100,000 persons)114.39104.42226.0555.7343.25
PM 2.5 PM 2.5 concentration ( μ g / m 3 )26.6926.7251.942.1711.92
NO 2 NO 2 concentration ( μ g / m 3 )40.8641.3073.0011.9013.69
SO 2 SO 2 emission ( 10 , 000   tons )76.3063.35200.300.1048.16
GRP gross regional product (100 million yuan)8279.156438.7435,696.71229.047139.56
Observations210
Table 3. Panel regression estimation results of impact of burning coal effects on PM 2.5 .
VariablesPooled OLSFE ModelRE Model
Coefficients
Constant−1.345 (1.228)−1.771 ** (0.829)−1.923 ** (0.755)
LnCoal_cons0.404 *** (0.0544)0.196 *** (0.056)0.233 *** (0.051)
B080.126 * (0.0704)0.142 *** (0.0164)0.145 *** (0.016)
LnGasDie_cons0.0168 (0.069)0.076 ** (0.038)0.0650 * (0.037)
LnPaved_Rd−0.158 (0.106)−0.046 (0.038) −0.056 (0.037)
LnTemp0.689 *** (0.106)0.233 ** (0.110)0.241 ** (0.095)
LnHumid0.244 (0.365)0.604 *** (0.159)0.581 *** (0.149)
LnPrec−0.260 ** (0.101)−0.059 ** (0.027)−0.061 ** (0.027)
Adj R20.4810.9840.376
F test (Pooled vs. Fixed)216.96 ***
LM test (Pooled vs. Random) 540.24 ***
Hausman Test (Random vs. Fixed) 6.04
Note: Standard errors in parentheses. *, ** and ***, respectively, denote significance at the 10%, 5% and 1% levels.
Table 4. Tests for threshold effects.
Threshold PM 2.5     MOT 1   Relationship SO 2     MOT 2   Relationship
Test for single threshold
F 1 210.32951.314
p-value0.0000.010
Critical values (10 % , 5 % , 1 % )29.720, 37.778, 49.98127.013, 36.152, 45.191
Test for double threshold
F 2 24.79917.189
p-value0.0800.250
Critical values (10 % , 5 % , 1 % )23.274, 28.334, 34.17623.340, 28.697, 36.832
Test for triple threshold
F 3 142.32621.743
p-value0.0000.013
Critical values (10 % , 5 % , 1 % )20.952, 27.461, 41.74013.272, 16.893, 22.610
Table 5. Estimation results of PM 2.5 effects on cardiovascular mortality.
Threshold EstimatesThresholdEstimates95% Confidence e ( threshold )
γ 1 2.872[2.717, 2.872]17.67
γ 2 3.073[3.074, 3.074]21.62
γ 3 3.534[2.872, 3.610]34.27
VariableCoefficientRegime-dependent
OLS S.E.White S.E.
PM 2.5 17.67 LnPM 2.5 0.0310.0430.060
LnSO 2 −0.0030.0200.013
LnNO 2 0.196 **0.0730.090
21.62 PM 2.5   > 17.67 LnPM 2.5 0.806 ***0.2450.198
LnSO 2 −0.270 ***0.0780.064
LnNO 2 −0.1590.1420.118
34.27 PM 2.5   > 21.62 LnPM 2.5 0.257 ***0.0590.054
LnSO 2 0.054 *0.0250.028
LnNO 2 −0.162 ***0.0450.042
PM 2.5   > 34.27 LnPM 2.5 −0.0030.0700.062
LnSO 2 0.172 ***0.0280.020
LnNO 2 −0.0340.0430.038
VariableCoefficientRegime-independent
OLS S.E.White S.E.
LnGRP 0.0378 **0.0160.017
Note: White S.E. denotes heteroscedasticity-consistent standard errors. *, ** and ***, respectively, denote significance at the 10%, 5%, and 1% levels using the T-critical value.
Table 6. Estimation results of PM 2.5 effects on respiratory mortality.
Threshold EstimatesThresholdEstimates95% Confidence e ( threshold )
r4.3836[4.3549, 4.3993]80.13
VariableCoefficientRegime-independent
OLS S.E.White S.E.t-statistic
LnPM 2.5 ( SO 2 80.13)0.172 ***0.0280.0434.050
LnPM 2.5   ( SO 2 >   80.13)0.250 ***0.0290.0475.352
Ln SO 2 −0.0320.0190.035−0.904
Ln NO 2 0.176 ***0.0410.0434.052
LnGRP−0.188 ***0.0190.025−7.585
Note: White S.E. denotes heteroscedasticity-consistent standard errors. ** and ***, respectively, denote significance at the 5%, and 1% levels using the T-critical value.
Table 7. Estimation results on the health impacts of coal consumption in air pollution.
Result of Stage 1 (Panel Data Model)Result of Stage 2 (Panel Threshold Model)Result of Two-Stage Approach
Estimate effect of coal consumption on PM 2.5 Estimate effect of PM 2.5 on cause-specific mortalityEstimate health effect of coal consumption
0.233 *** Estimated threshold regimesCoefficientCoefficient
Cardiovascular mortality21.62 PM 2.5   > 17.67   ( μ g / m 3 ) 0.806 ***0.188
34.27 PM 2.5   > 21.62   ( μ g / m 3 ) 0.257 ***0.060
Respiratory mortality SO 2 80.13 (tons)0.172 ***0.040
SO 2 >   80.13 (tons)0.250 ***0.058
Table 8. The percentage change in cause-specific mortality associated with a 10 μ g / m 3 increase in PM 2.5 .
Study ApproachRegions [Author]PollutantMethodology (Time Period)Health OutcomesEstimated Coef.
Short-term StudiesShanghai, China [19] PM 2.5 Time-seriesCardiovascular mortality0.41 [0.00, 0.82]
Respiratory mortality0.95 [0.17, 1.73]
Shenyang, China [18] PM 2.5 Time-stratified case-crossoverCardiovascular mortality0.53 [0.09, 0.97]
Respiratory mortality0.97 [0.01, 1.94]
Quangzhou, China [17] PM 2.5 Time-stratified case-crossoverCardiovascular mortality1.22 [0.63, 1.68]
Respiratory mortality0.97 [0.16, 1.79]
This studyChina PM 2.5 Panel Threshold ModelCardiovascular mortality30.18 (21.62 PM 2.5   > 17.67)
9.63 (34.27 PM 2.5   > 21.62)
Respiratory mortality6.45 ( SO 2 80.13)
9.35 ( SO 2 > 80.13)
Long-term StudiesShenyang, China [39] PM 10 Retrospective cohort study
(1998–2009)
Cardiovascular mortality55 [51, 60]
Shenyang, China [40] PM 10 Retrospective cohort
(1998–2009)
Respiratory mortality67 [60, 74]
US metropolitan areas [56] PM 2.5 Cohort study
(1979–1983)
Cardiopulmonary mortality6 [2, 10]
Netherlands [57] PM 2.5 Cohort study
(1987–1996)
Respiratory mortality7 [−25, 52]
US metropolitan areas [56] PM 2.5 Cohort study
(1979–1983)
Cardiopulmonary mortality6 [2, 10]
Canada [24] PM 2.5 Cohort study
(1991–2001)
Cardiovascular mortality31 [27, 35]
Note: [] refers to 95% confidence interval.

