Article

The Impact of Cold and Heat on Years of Life Lost in a Northwestern Chinese City with Temperate Continental Climate

1
Institute of Occupational Health and Environmental Health, School of Public Health, Lanzhou University, Lanzhou 730000, Gansu, China
2
Lanzhou Municipal Center for Disease Control, Lanzhou 730000, Gansu, China
3
Gansu Provincial Center for Disease Control and Prevention, Lanzhou 730000, Gansu, China
4
Shanghai Key Laboratory of Meteorology and Health, Shanghai Meteorological Service, Shanghai 200030, China
5
Department of Epidemiology, Human Genetics and Environmental Sciences, School of Public Health, The University of Texas Health Science Center at Houston, Houston, TX 77030, USA
6
Southwest Center for Occupational and Environmental Health, School of Public Health, The University of Texas Health Science Center at Houston, Houston, TX 77030, USA
*
Author to whom correspondence should be addressed.
Int. J. Environ. Res. Public Health 2019, 16(19), 3529; https://doi.org/10.3390/ijerph16193529
Submission received: 12 August 2019 / Revised: 6 September 2019 / Accepted: 13 September 2019 / Published: 20 September 2019
(This article belongs to the Section Climate Change)

Abstract

:
Cold spells and heat waves in a changing climate are well known as great public-health concerns due to their adverse effects on human health. However, very few studies have quantified health impacts of heat and cold in the region of Northwestern China. The purpose of the present study was to evaluate the effects of cold and heat on years of life lost (YLL) in Lanzhou, a city with temperate continental climate. We compiled a daily dataset including deaths, weather variables, and air pollutants in Lanzhou, China, from 2014–2017. We used a distributed lag non-linear model to estimate single-day and cumulative effects of heat and cold on daily YLL. Results indicated that both cold and heat were associated with increased YLL for registered residents in Lanzhou. Estimated heat effects appeared immediately in the first two days, while estimated cold effects lasted over a longer period (up to 30 days). Cold significantly increased the YLL of all residents except for males and those with respiratory diseases (≥65 years). Our results showed that both heat and cold had more pronounced effects on cardiovascular diseases compared to respiratory diseases. Males might be more vulnerable to heat, while females might suffer more YLL from cold. The effects of cold or heat on the elderly might appear earlier and last longer than those for other age groups.

1. Introduction

A changing climate leads to higher occurrences of extreme weather, including cold spells and heat waves, which are well known as great public-health concerns due to their adverse effects on health [1,2,3,4]. Many studies have examined the associations between temperature and cause-specific mortality. A study including data from 384 locations indicated that most of the temperature-related mortality burden was attributable to cold [5], which was consistent with findings from a national study in China [6]. Similar studies have extensively described the relationship between mortality and temperature as a U, V, or J shape. Mortality risk and burden are higher in specific subgroups, such as children and the elderly [6,7,8]. In addition, susceptibility to cold and heat can be influenced by many factors, such as age, gender, education, or economic level [9,10,11,12,13].
Most of the previous studies on the effects of weather variables focused on the number of daily deaths in the subtropical regions with warmer climates, but neglected the age and its composition ratio, which could be solved by properly applying years of life lost (YLL) [14,15,16]. Huang et al. first reported that both heat and cold increased daily YLL in Brisbane, Australia [16], which is a subtropical city with overall mean maximum and minimum temperatures of 26.3 °C and 14.7 °C, respectively [17]. Similarly, Yang et al. dealt with data from Guangzhou City, China, with mean maximum and minimum temperatures of 34.2 °C and 6.3 °C during 2003–2007 [18]. In the Hubei study, the temperature from 1st to 99th temperature percentiles ranged from −0.5–32.4 °C [12], similar to that of Ningbo, China [19]. Li et al. analyzed the association between temperature and YLL in Tianjin, a city that, despite being in northern China, had a temperate, semi-humid monsoon climate with 25th temperature percentile of 7.5 °C and 75th of 28.4 °C during 2006–2011 [9], much warmer than Lanzhou’s climate.
The territory of Lanzhou is complex and diverse, with an altitude of >1500 m and typical temperate continental climate. Lanzhou is cold in winter (average monthly low temperatures ranged from −6.6 °C to −1.6 °C during 2004–2017) but not too hot in summer (average monthly high temperatures ranged from 22.8–26.0 °C during 2004–2017; Table S1). Until now, no study has explored the YLL-temperature relationship in Northwestern China. The present study is the first to evaluate the effects of cold and heat on YLL using data in this region, adding to our knowledge from temperate continental climate regions.

2. Methods

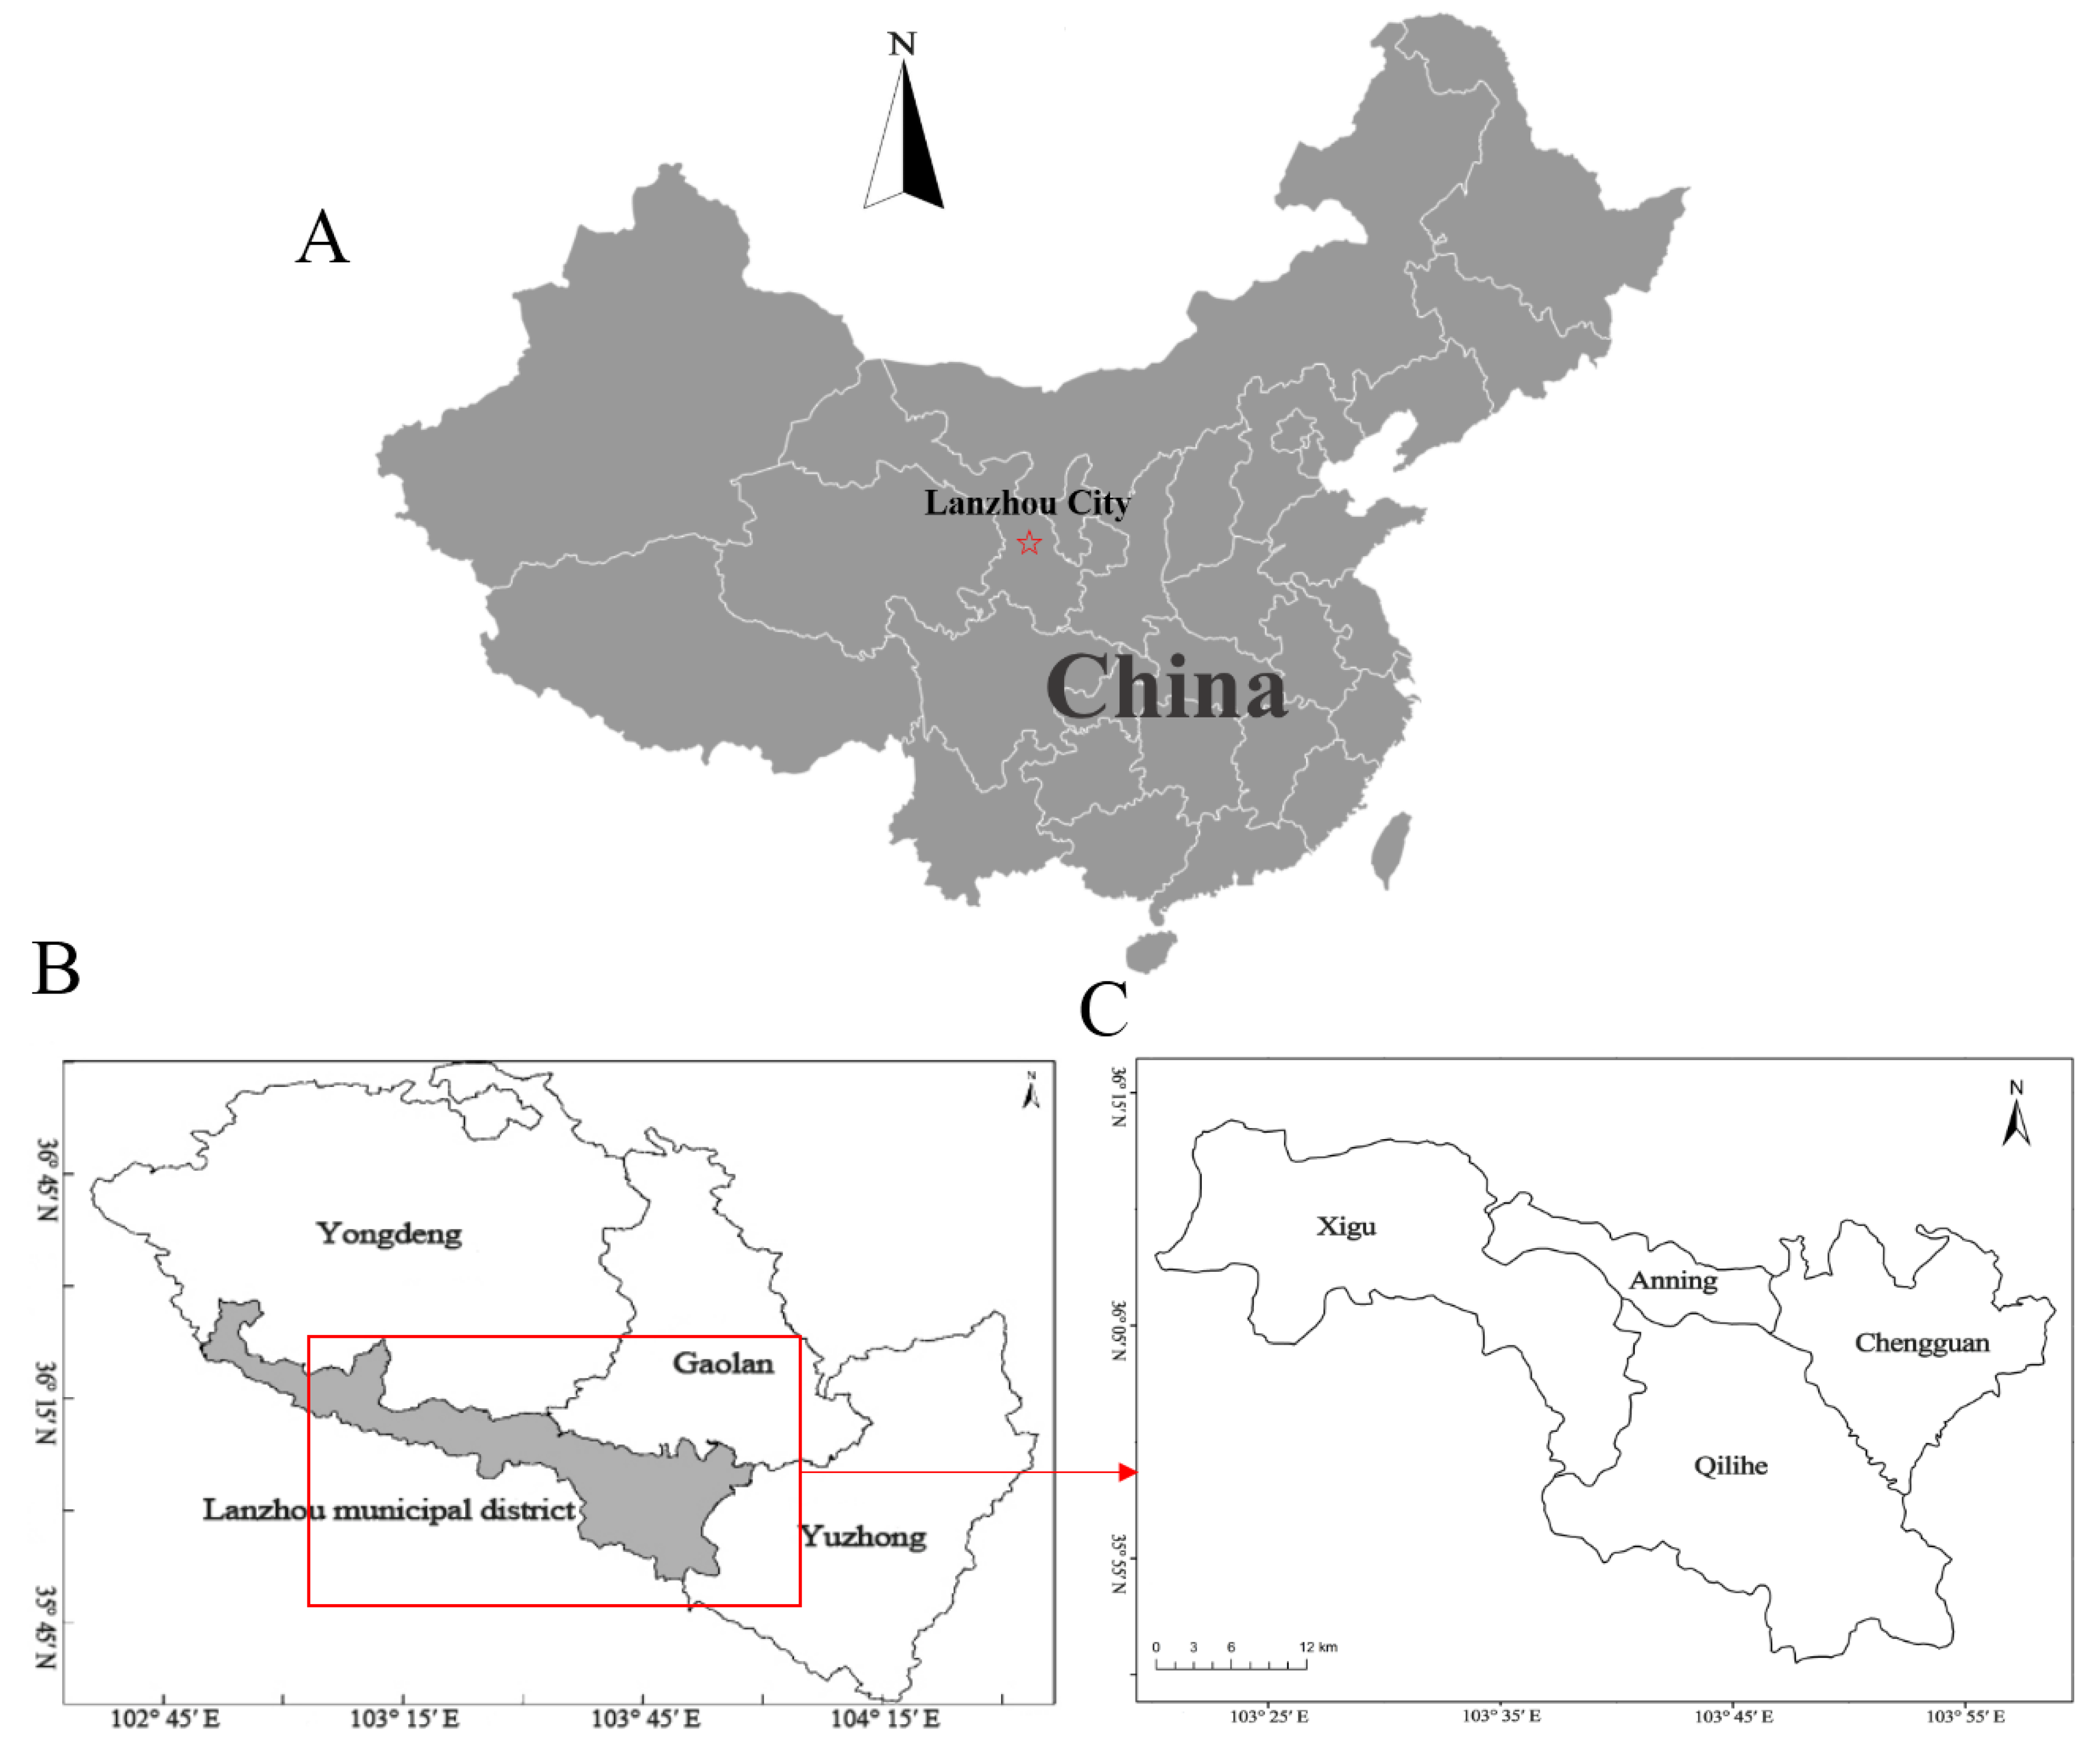
2.1. Data Collection

Lanzhou, located at latitude 36°03′ N, 103°40′ E, is composed of five districts and three counties. It is an important industrial base and transportation hub of northwestern China, with a population of about 4 million. Lanzhou has a temperate continental climate, with an average annual temperature of 10.3 °C and an average total annual rainfall of 327 mm [20].

2.1.1. Death Data and YLL Calculation

We obtained daily death data covering four central urban districts of Lanzhou City (Chengguan, Qilihe, Xigu, and Anning) during the period 1 January 2014 to 31 December 2017 from the Lanzhou municipal center for disease control (Figure 1). All deaths were the registered residents of Lanzhou City. The study was conducted in accordance with the declaration of Helsinki, and the protocol was approved by the ethics committee of Lanzhou University (Project identification code: IRB190210-1). Causes of death were classified into three subgroups according to the 10th Revision of the international classification of diseases (ICD-10), which were all non-accidental causes (ICD-10: A00-R99), cardiovascular (CV) diseases (ICD-10: I00-I99), and respiratory diseases (ICD10: J00-J99).
We obtained Chinese national life tables from the world health organization (WHO) for the years 2014–2016 [21]. YLL was calculated for each death by matching age and gender to the Chinese national life tables. We used life expectancy data from 2016 to calculate YLL for 2017, as data were unavailable for the latter year until now. Finally, we calculated daily YLL by summing YLL for all deaths on each day and stratifying them by gender, age, and specific cause of death. The calculation of YLL was done with the following formula:
YLLt = ∑ (deathsg, t at agei) × (expected remaining life years at agei and yearz)
where t is the day number in the study period (t = 1, 2, 3…, 1, 461); g is the gender; i is the death age; z is the year of death.

2.1.2. Meteorological and Air Pollutant Data

The Lanzhou meteorological administration supplied meteorological data covering the four central urban districts, including daily maximum, mean, and minimum temperatures plus relative humidity. We obtained 24-h mean air pollutant data, including particulate matter with size ≤10 μm (PM10), nitrogen dioxide (NO2), carbon monoxide (CO), ozone (O3), and sulfur dioxide (SO2), from four air quality monitoring stations in Lanzhou. Both meteorological and air pollutant data were collected during 2014–2017.

2.2. Statistical Analysis

We performed a descriptive analysis to understand the time series characteristics of daily YLL, air pollutants, and meteorological variables over the study period.
The distributed lag non-linear models (DLNMs) used in our study represent a modeling framework for analyzing non-linear and delayed effects in time series data [22,23]. This framework is implemented in the R package “dlnm”, the functions of which construct a broad range of models within the DLNM family. Our initial analysis showed that daily YLL generally followed a normal distribution; therefore, the family function was Gaussian. Based on previous literature, we constructed our basic model according to this formula:
E(YLLt) = Cross-basis (temperature) + Cross-basis (pollutants) + NS (time, 7 × 4) + NS (humidity, 3) + DOW + Holiday + α,
where t is the day number in the study period (t = 1, 2, 3, …, 1, 461); YLLt is the sum YLL of observed daily death counts on day t; α is the intercept; NS (.) is a natural cubic spline; seven degrees of freedom (dfs) per year for time were used to control the long-term trend, and 3 dfs for relative humidity were used to control for potential confounding effects; DOW and Holiday are day of a week and official holidays in China, respectively.
We defined the cross-basis matrices for temperature and pollutants included in this study. The basis-functions we chose for the space of the factors were a cubic natural spline for the effects of pollutants; regarding the space of lags, we assumed a simple lag 0–1 parameterization. We included cross-basis matrices for all pollutants to one model. We specified a quadratic B spline in the cross-basis function of daily temperature. We placed knots for the spline at equally spaced values across the space of temperature, and the knots for lags at equally spaced values in the log scale of lags [24].
We estimated the single-day lag and cumulative effects of cold and heat and chose 30 days as the maximum lag [25,26].
In order to check the reliability of the above model and its results, we changed lag days for temperature (lag 15–30 days), dfs (6–10 per year) for time, and dfs (3–5) for relative humidity. We also assessed sensitivity to control for air pollutants.
Cold effects in the present study represented changes in YLL caused by the decreased temperature from the 25th to the 1st percentile of the overall temperature, while heat effects represented the changes of YLL caused by the increased temperature from the 75th to the 99th percentile of the overall temperature; this was consistent with other studies [25,27,28]. We performed all analyses with R software version 3.3.2 and used the “dlnm” package to conduct time series regression. Statistical significance was set at p value less than 0.05.

3. Results

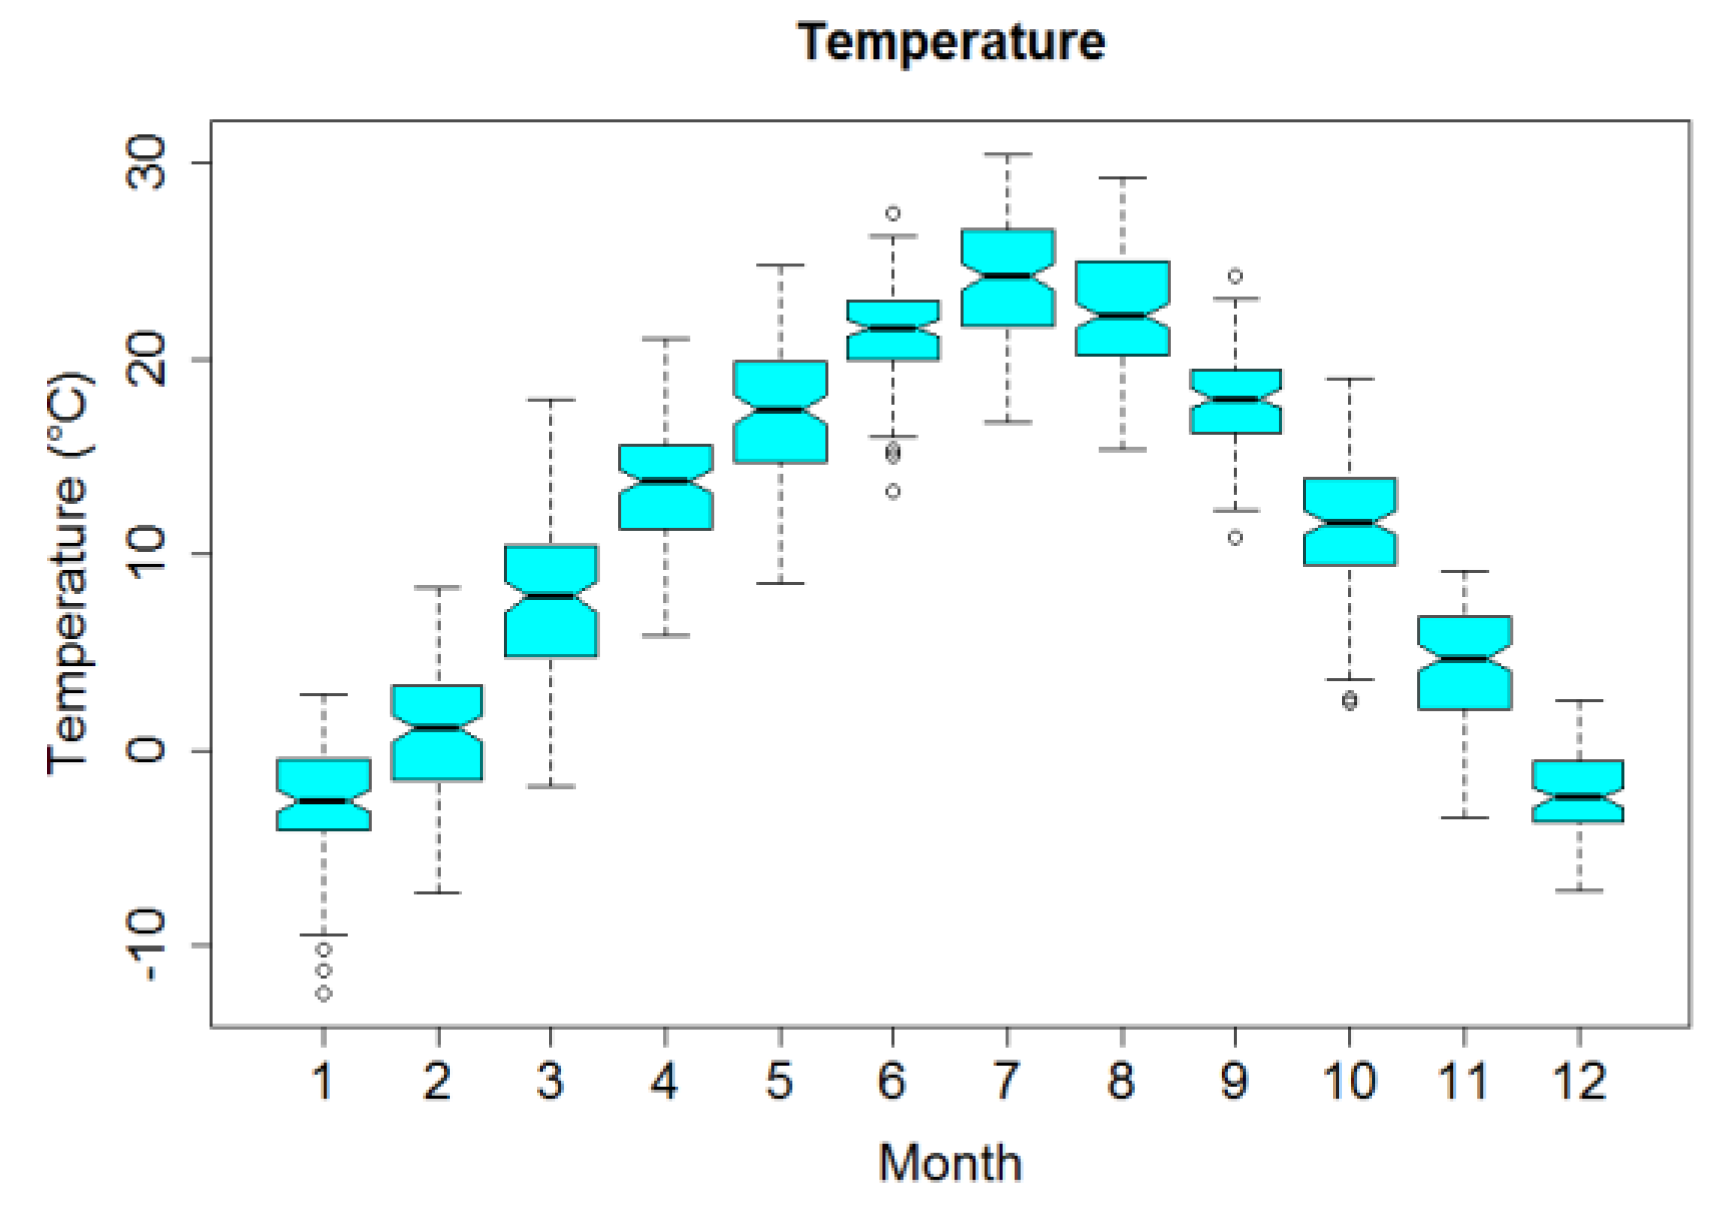
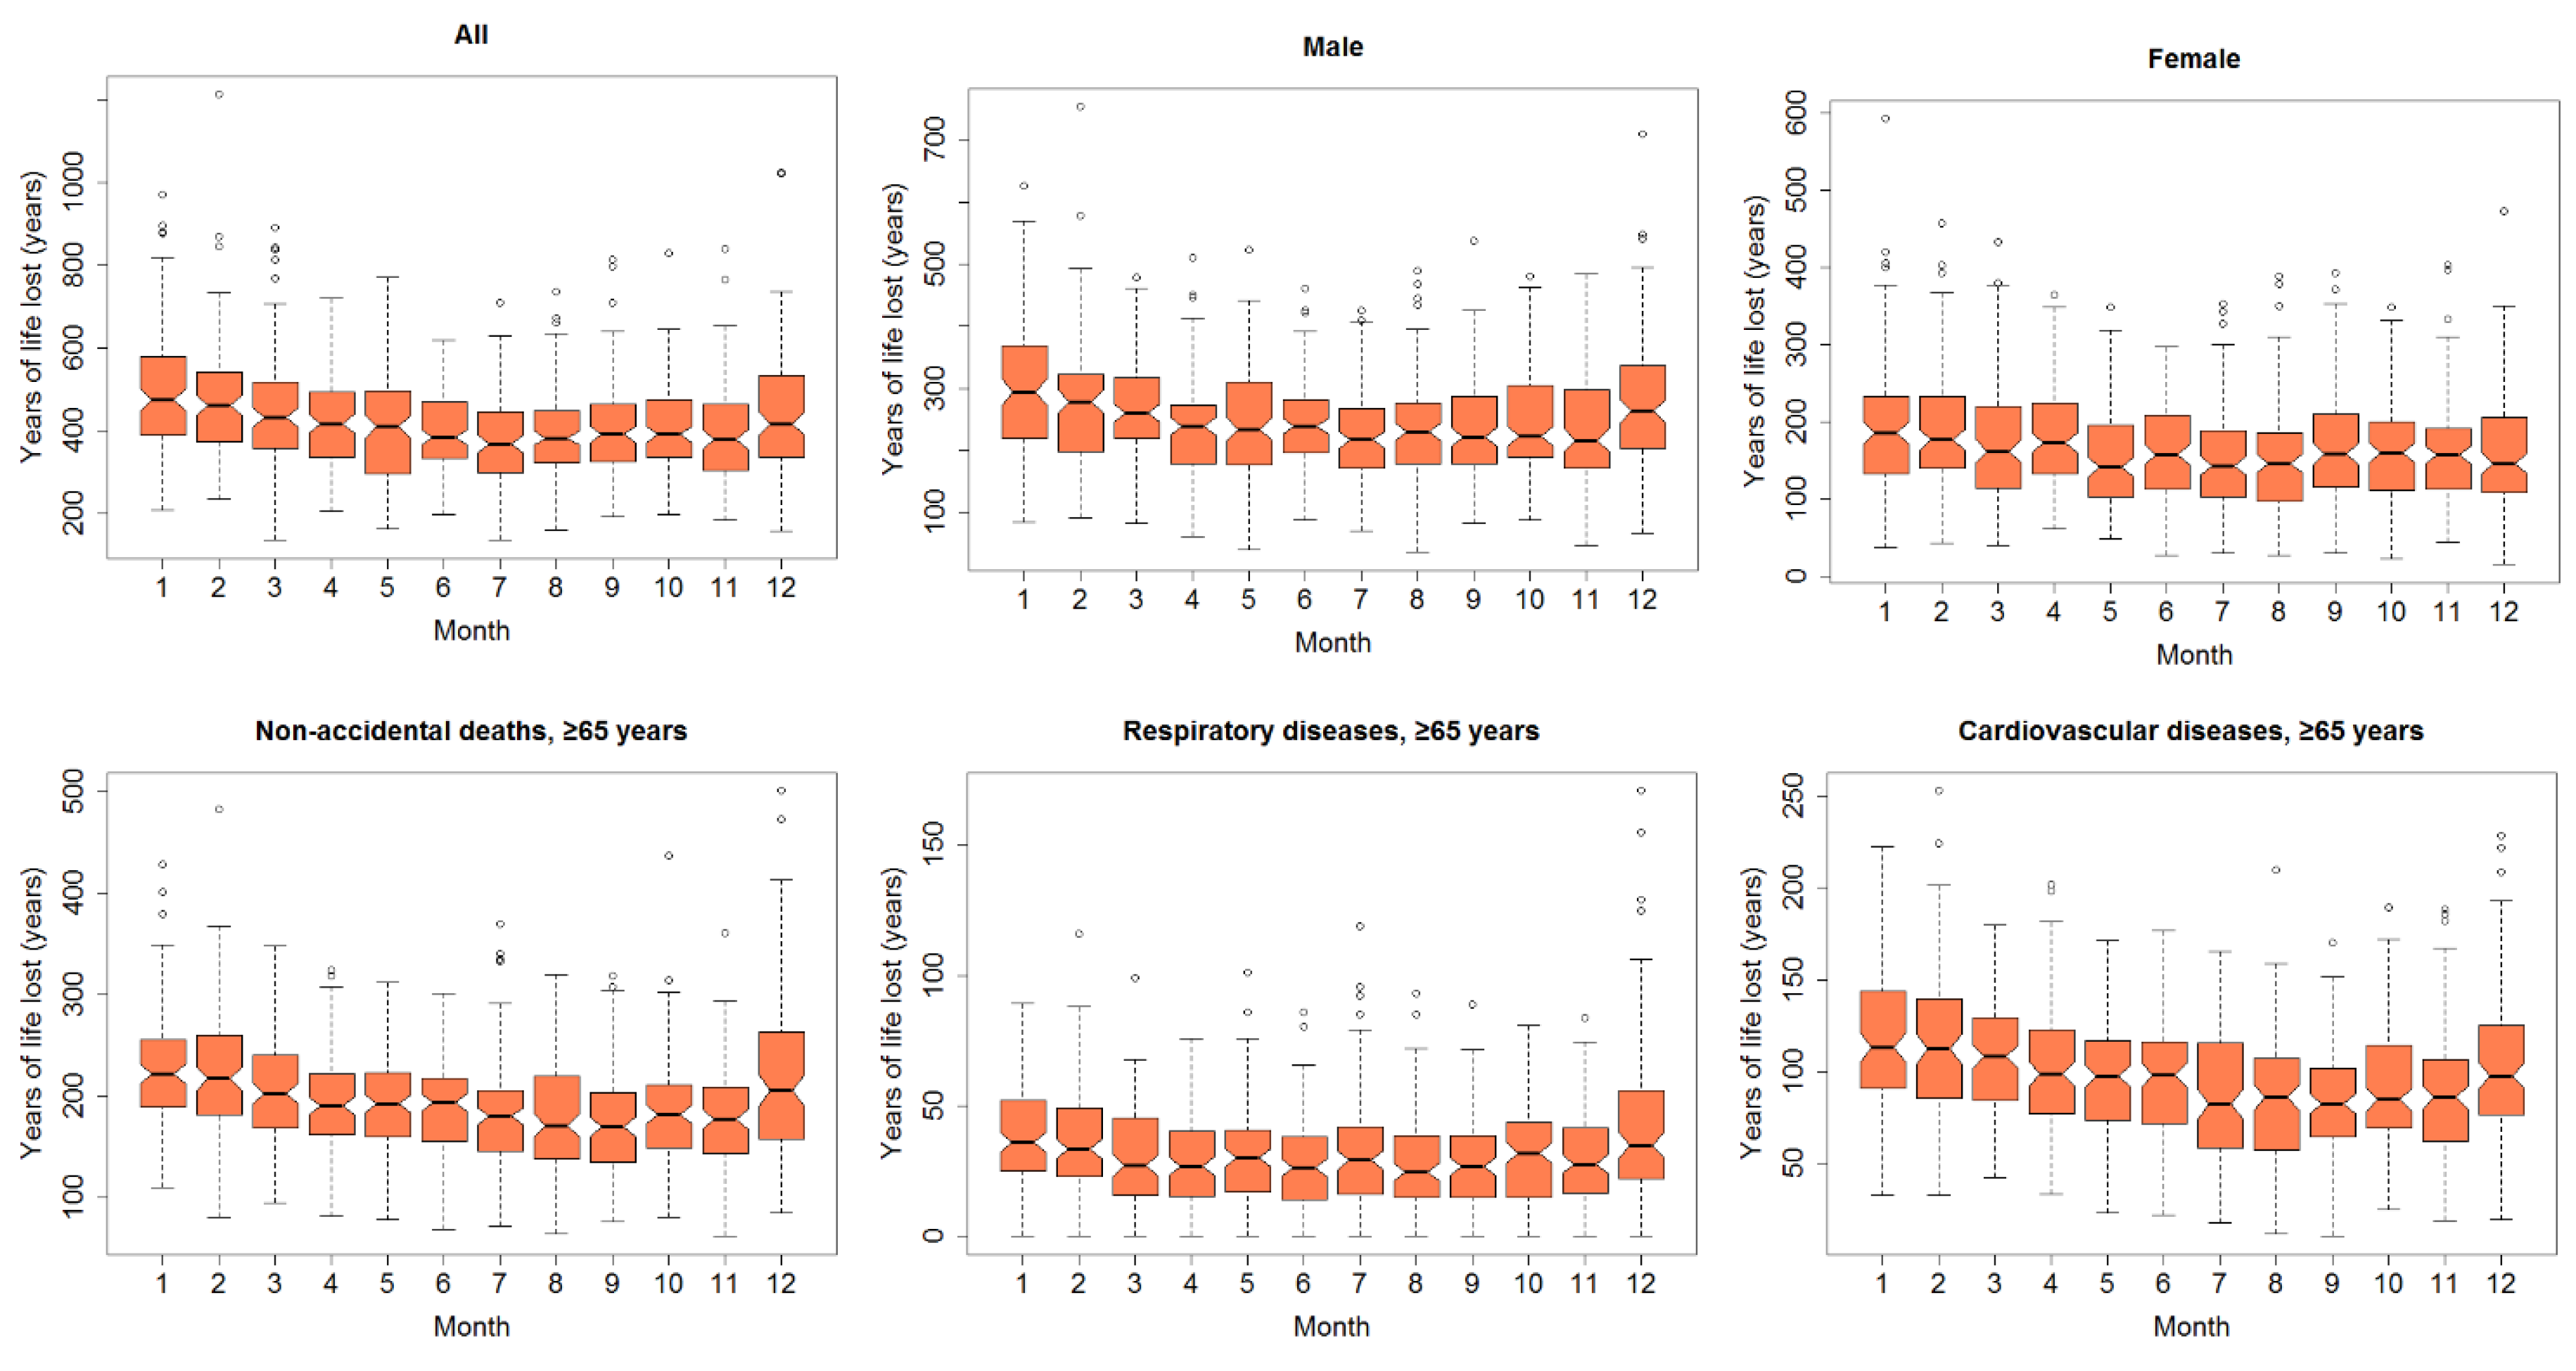
3.1. General Results of Air Pollutants, Weather Variables, and YLL in Lanzhou City

According to the 2018 yearbook for Lanzhou, the average population during 2014–2017 was 3.23 million, and the average ratio (male/female) was 1.02, with the aging of Lanzhou’s residents [29]. Table 1 summarizes the daily statistics for air pollutants, weather variables, and YLL in Lanzhou from 2014–2017. A total of 42,942 deaths (32,032 of people ≥65 years) in Lanzhou were included. The mean daily YLL for the whole population was 420.5 years; males had more YLL than any other group (251.8), followed by people <65 years old who died due to non-accidental causes (224.8).
Figure 2 displays box plots of monthly temperature. Mean temperature over the four years was 11.39 °C, ranging from −12.4 °C to 30.4 °C and showing an obvious seasonal trend.
Monthly YLL of various subgroups is shown in Figure 3 and Figure S1. As expected, YLL for these subgroups had a clear seasonal distribution, which was higher in colder months (December–March) and lower in warmer months (July–September).

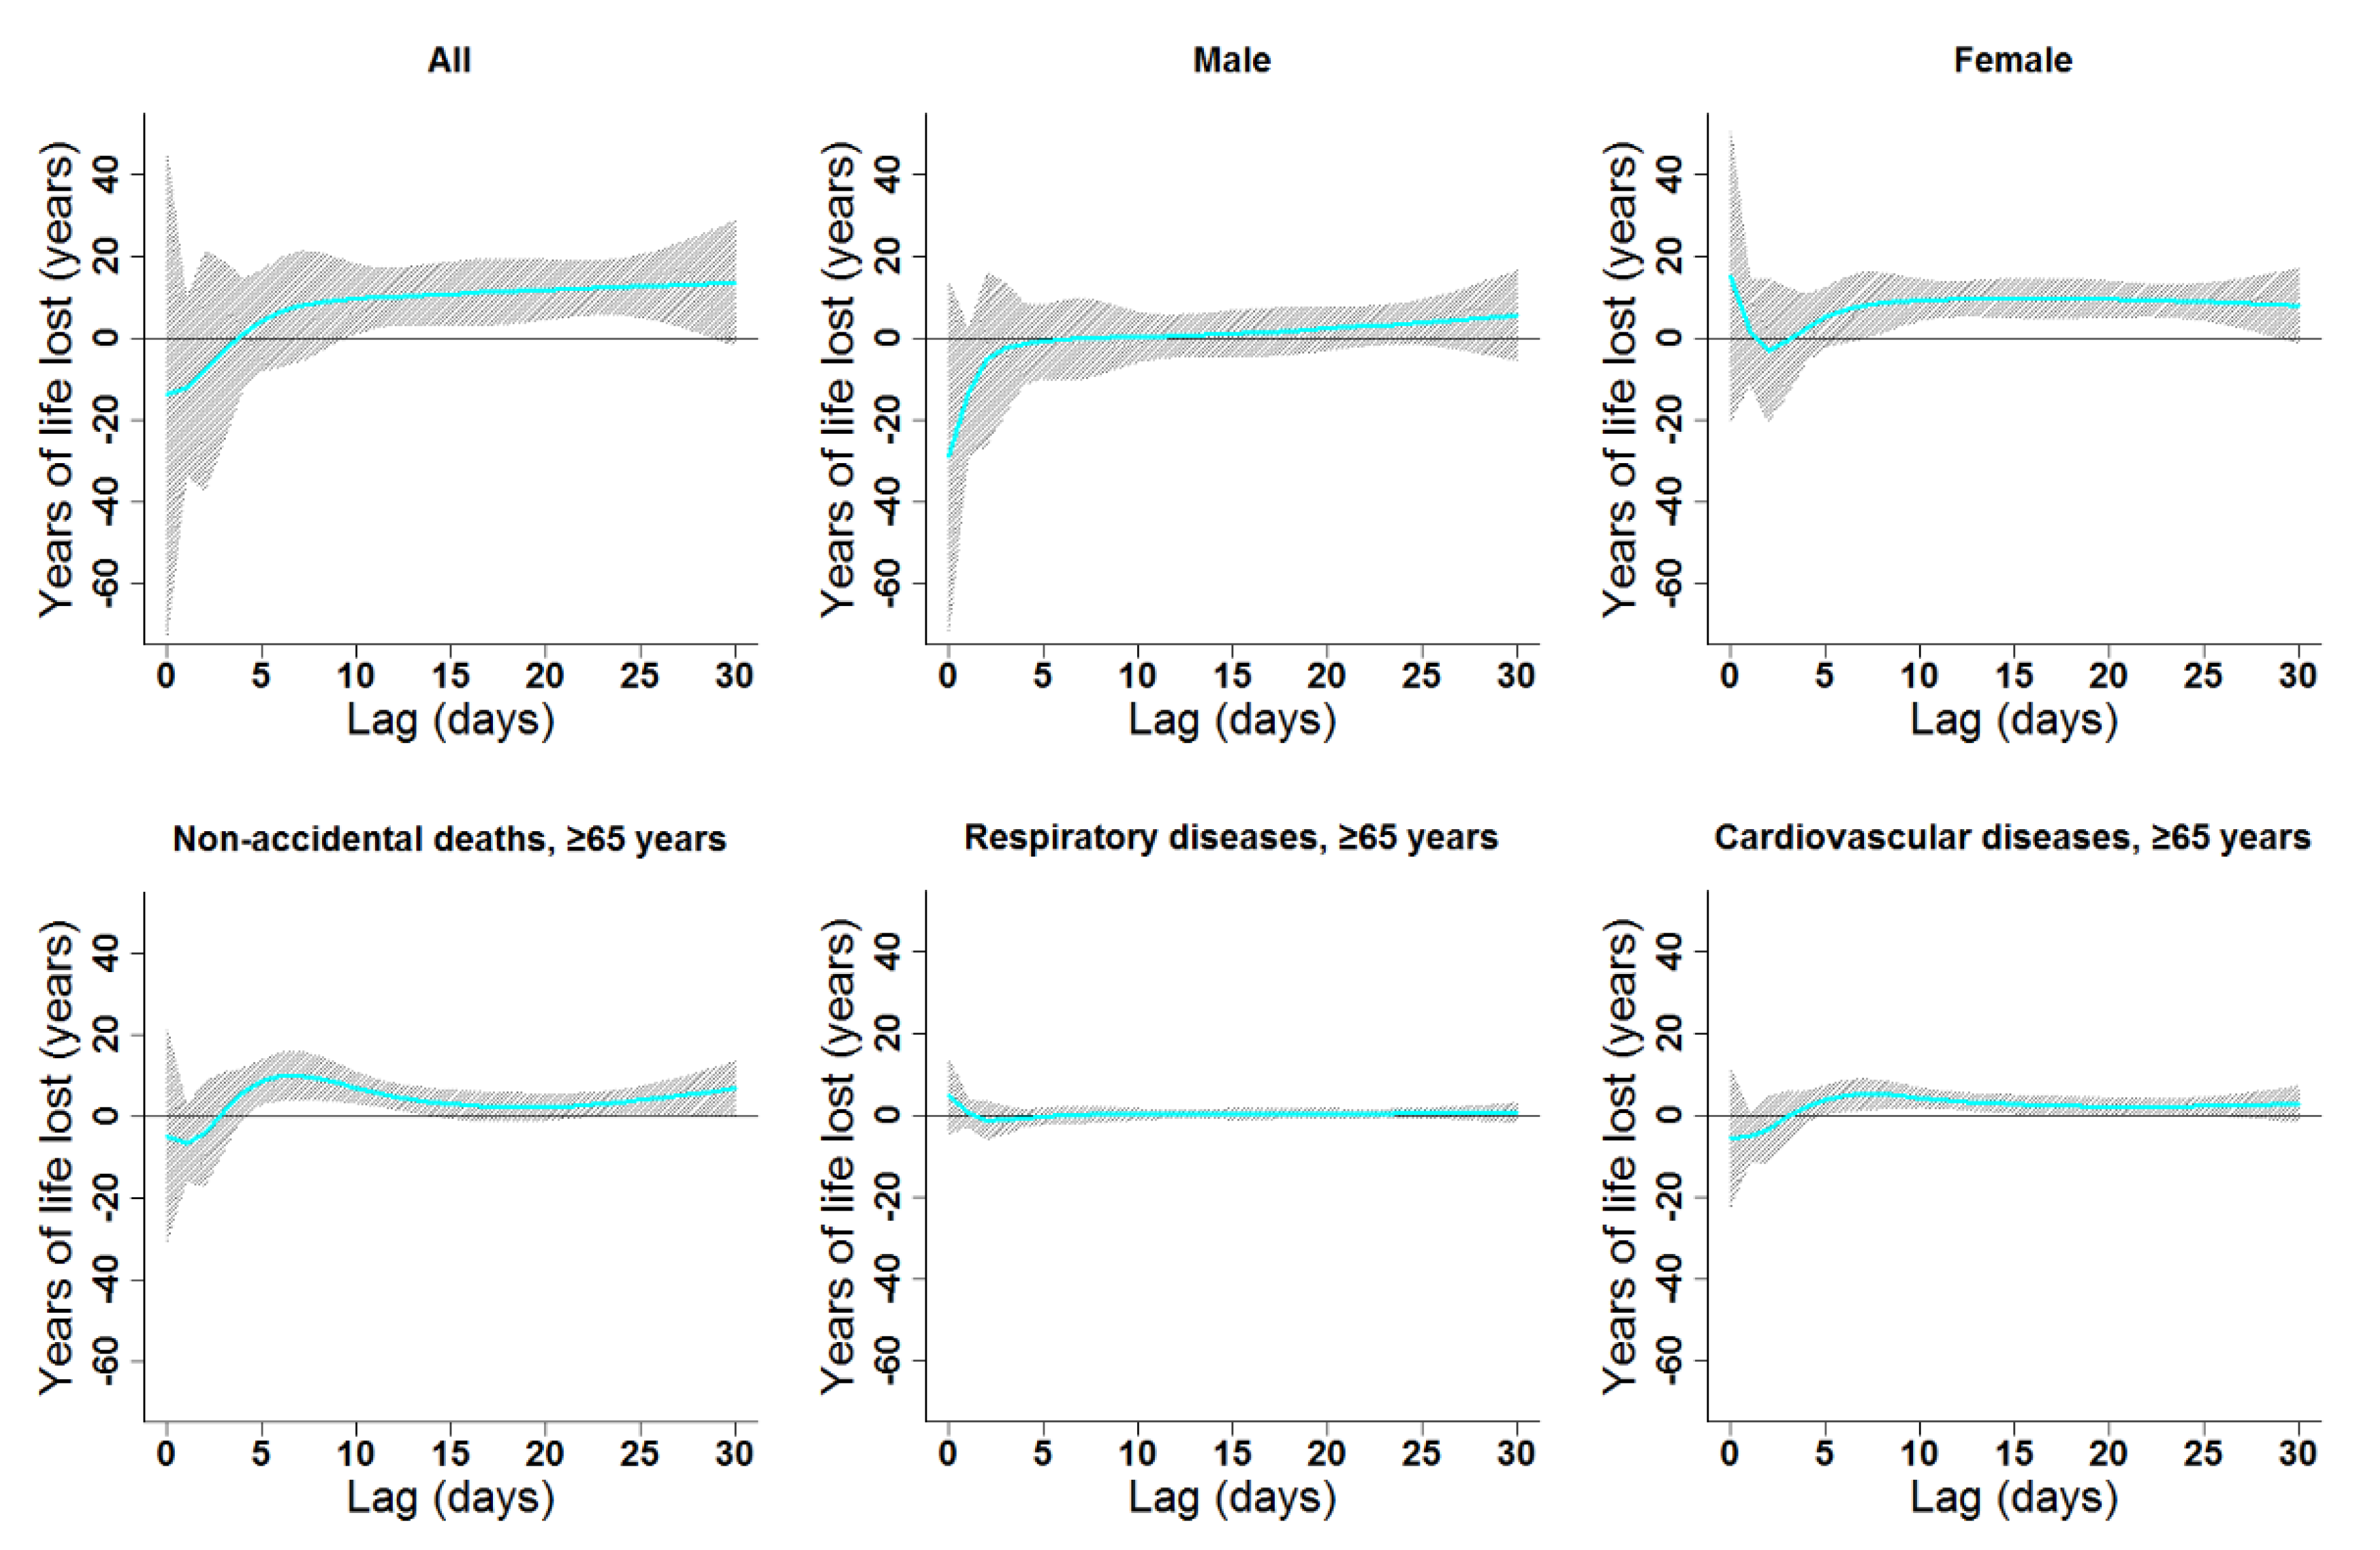
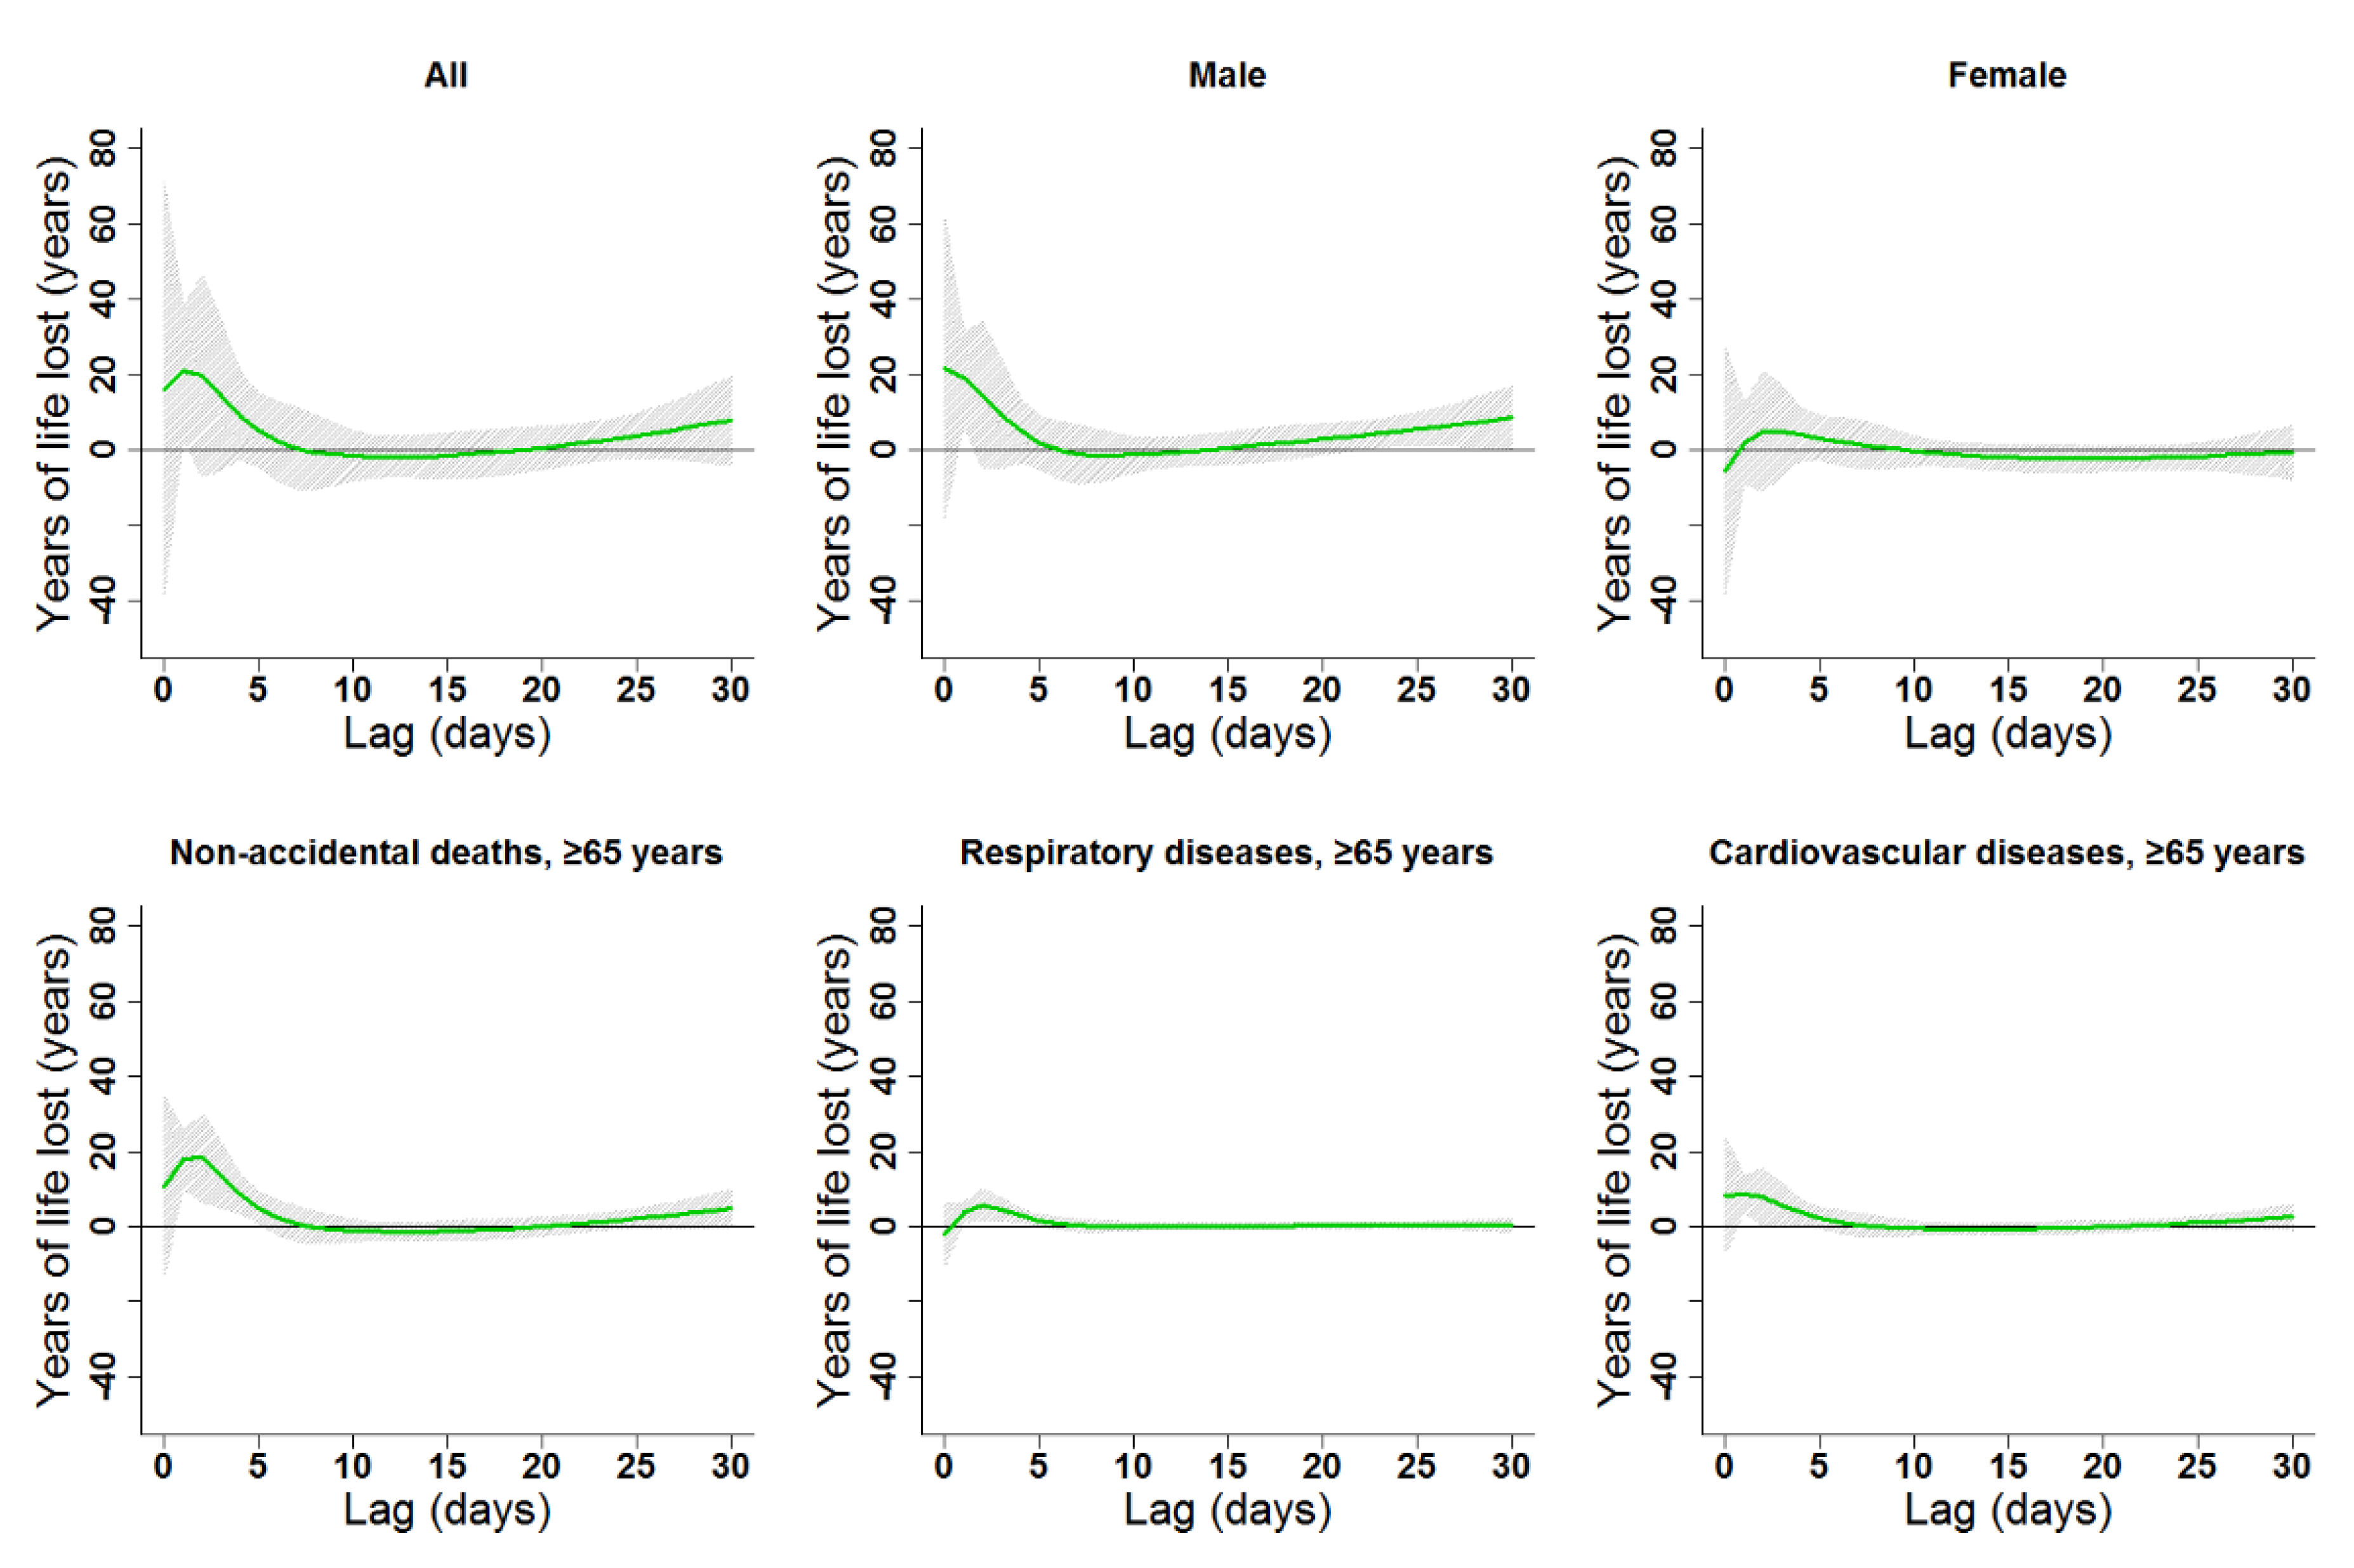
3.2. Single-Day Lag Effects of Cold and Heat

The estimated effects of ambient temperature were non-linear for all subgroups and had various degrees of lag (Figure 4, Figure 5, Figure 6 and Figure 7, Figures S2–S5). In general, heat effects were strong and immediate, while cold effects were more delayed. The significant durations and the strongest single-day lag effects of cold and heat on YLL in the present study are shown in Table 2. Results indicated that males were more vulnerable to heat, while females suffered more from cold. Heat and cold effects lasted longer among people older than 65 years old compared to other age groups. Similar lag patterns were observed for different genders and diseases (Figure 4 and Figure 5, Figures S2 and S3).

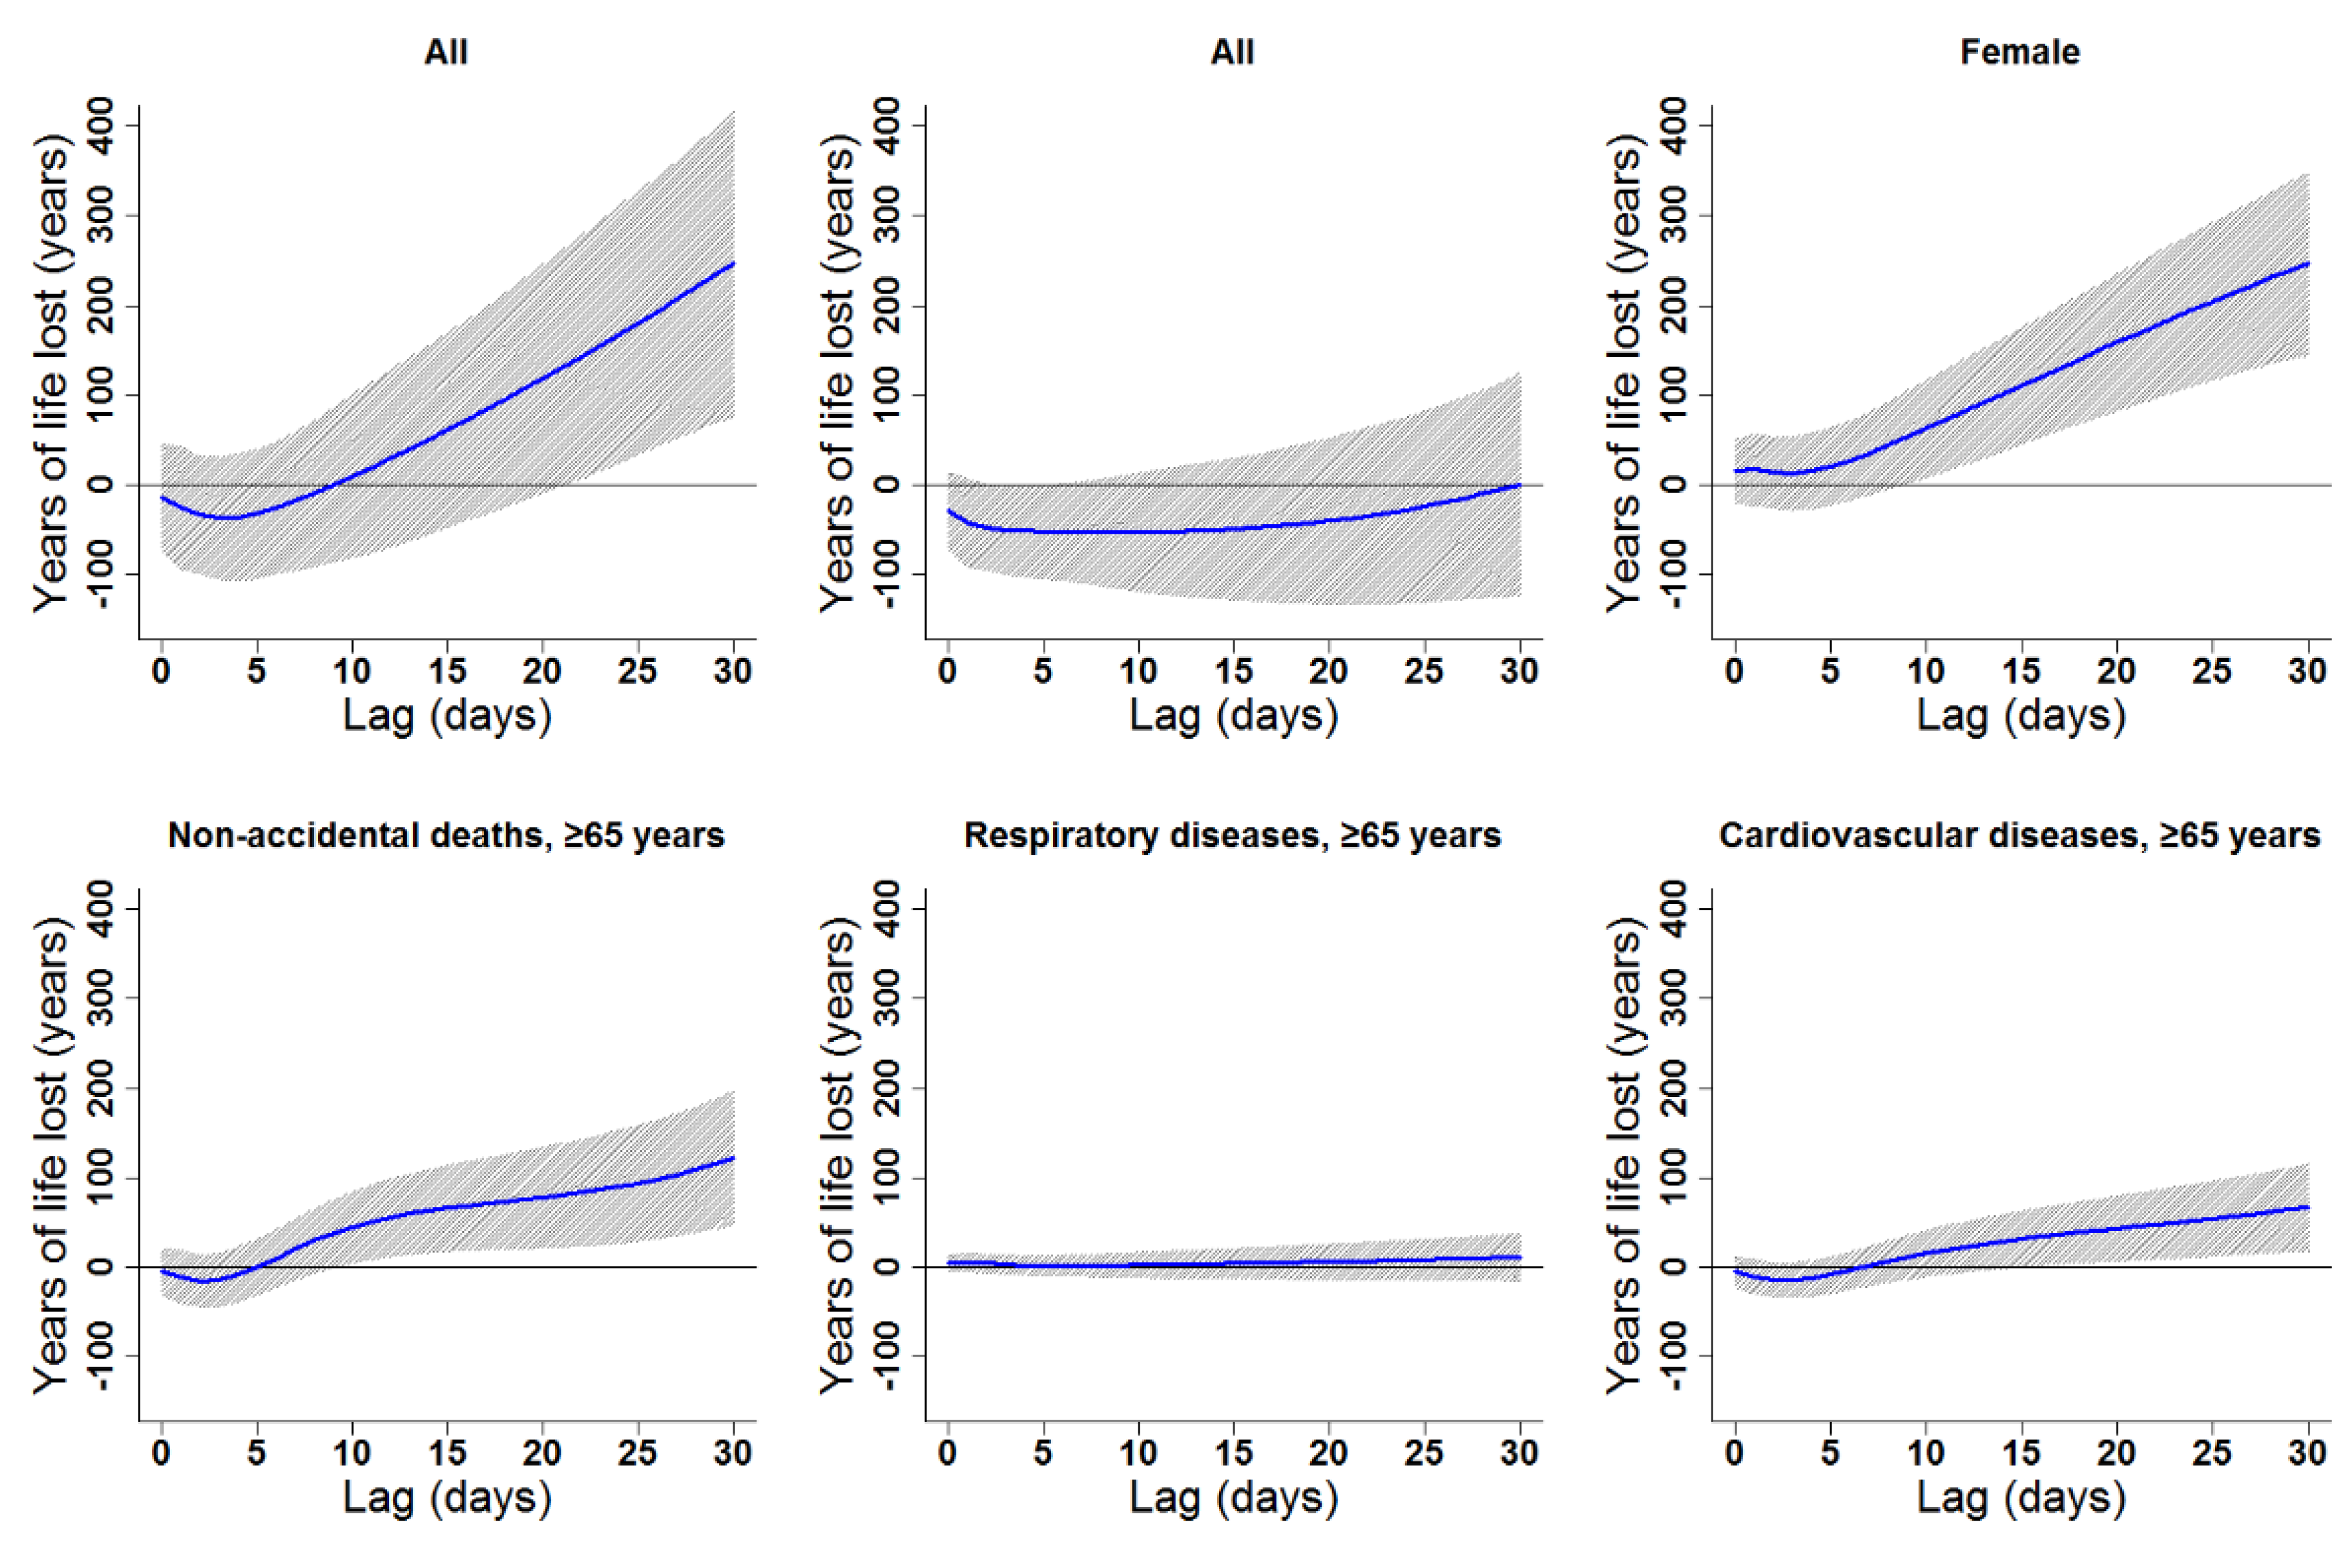
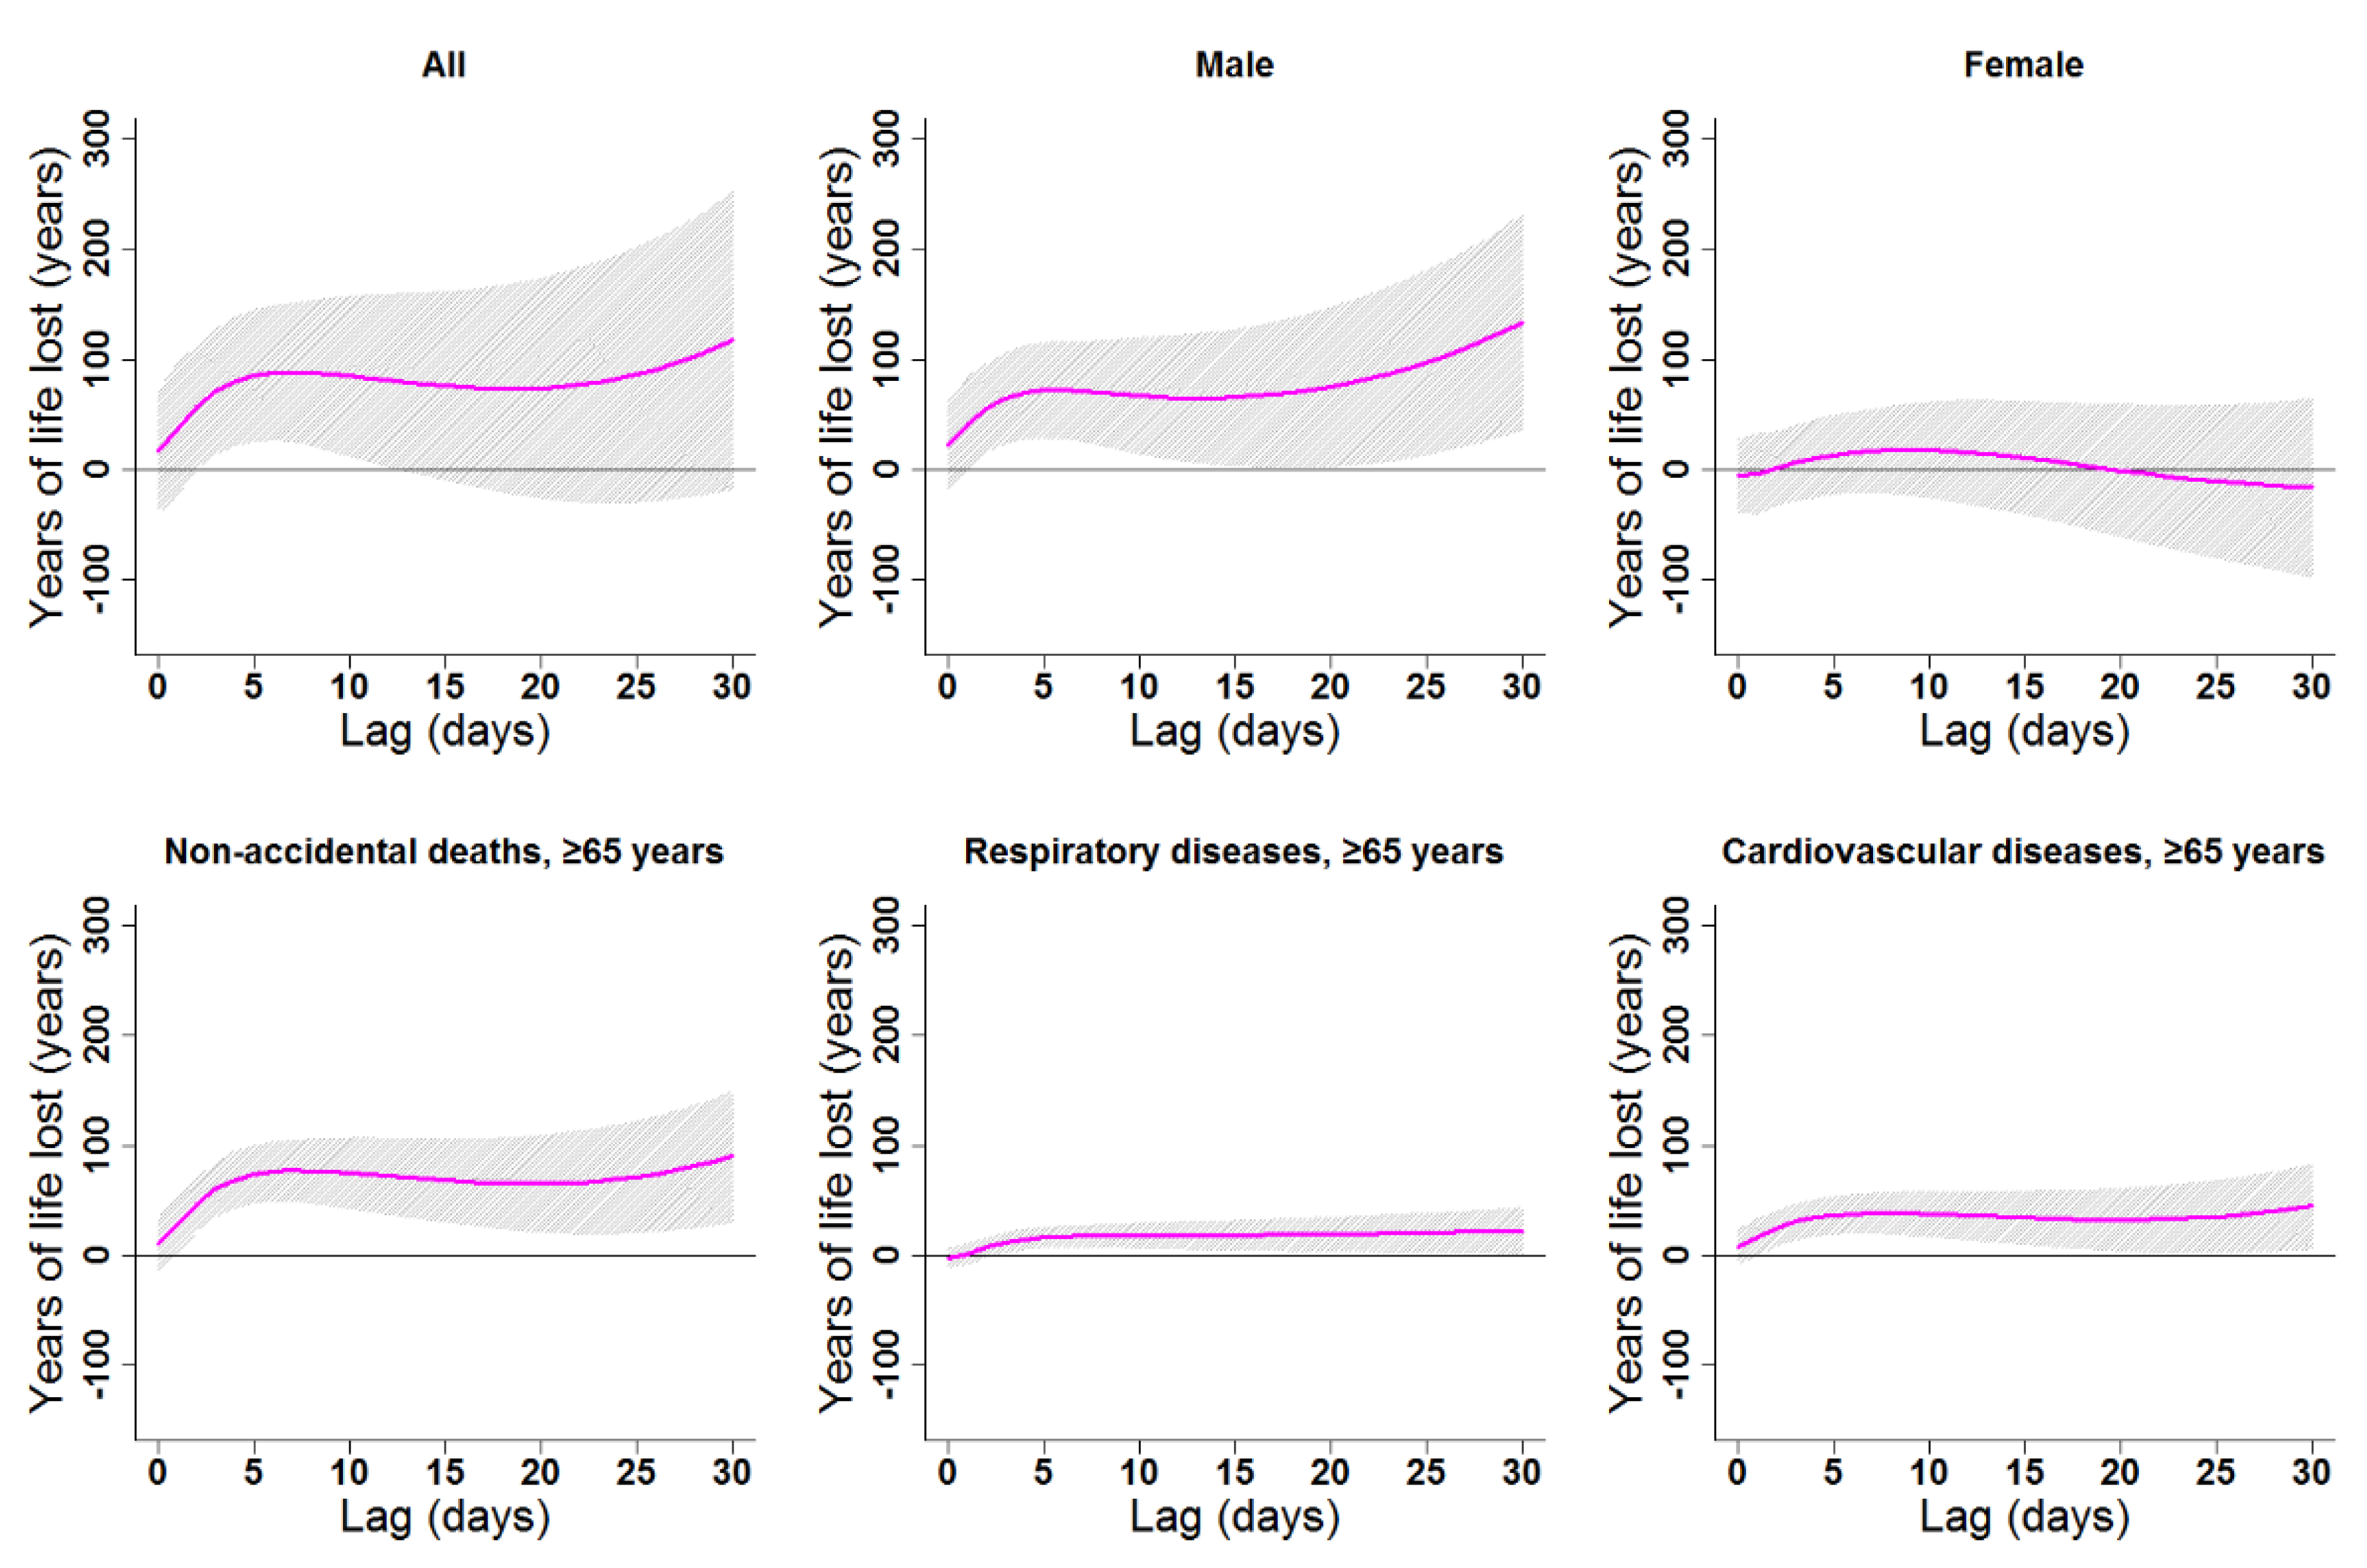
3.3. The Cumulative Effects of Cold and Heat

Cumulative cold effects along lag 0–30 days were associated with increased YLL for all residents (246.87 years), females (246.41 years), the elderly in general (121.85 years), elderly women (76.83 years), and elderly with CV diseases (66.75 years; Table 3). The strongest effects of heat on the elderly (≥65 years) appeared in lags 0–30, 0–30, 0–8, 0–30, and 0–30 for non-accidental deaths, males, females, respiratory diseases, and CV diseases, respectively. YLL due to heat exposure were 89.82, 71.32, 30.11, 22.30, and 44.54 years for the elderly in general, elderly men, elderly women, elderly people with respiratory diseases, and elderly people with CV diseases, respectively (Table 3). Cumulative lag patterns were also slightly different for cold and heat (Figure 6 and Figure 7, Figures S4 and S5).

4. Discussion

Most studies dealing with the associations between YLL and temperature have focused on subtropical regions with warmer climates. It is important to conduct a study in those regions owing a typical temperate continental climate which is cold in winter but not too hot in summer. We applied a time series regression model combined with DLNM that allowed us to explore cumulative effects for a better view of the effects of ambient temperature, especially in relatively underdeveloped areas. Therefore, this study is unique and provides critical information to better understand the association between temperature and YLL in the temperate continental climate zone.
We found that both cold and heat increased YLL, indicating that the effects of both weather phenomena should receive attention even in a city with temperate continental climate. Single-day lag effects of cold on YLL in this study were as long as 5–29 days and the cumulative effect stabilized after some lags. Significant durations in our study seemed to be longer than in other studies conducted in regions such as Hong Kong or Taipei [31,32,33,34]. Lanzhou having colder weather, longer winters, and lower economic levels than other cities might have led to longer effects of cold on YLL in Lanzhou. In addition, we found that cold had stronger effects in the subgroups of females and the elderly, suggesting they had greater susceptibility to cold. Possible reasons might be that the elderly have relatively low immunity and many of them suffer from various underlying health problems, which make them more difficult to maintain homeostasis and adapt to environmental challenges [35]. The vulnerability of females to cold might be caused by differences from males in physiological functions, health status, thermoregulatory and adaptive capacity, and social status [11,12,36]. It might also be due to residual confounding of age, as there are greater numbers of women than of men within elderly age groups. In particular, these elderly women have reached menopause, which led them more likely to be affected by cold stress. A possible reason is decline in ovarian hormone concentrations during the menopausal transition and beyond, and increased risks of CV diseases [37,38].
For heat, the significant single-day lags were 1–5 days among various groups, as described above. The effects of heat seemed to be weaker than those of cold, reflecting Lanzhou’s above-mentioned climatic characteristics. Cumulative heat effects lasted longer for males and the elderly, indicating higher risks for these subgroups; this is in line with a study conducted in Tibet [32]. A possible explanation is that men are more likely to engage in outdoor jobs and activities, which increases their exposure to heat. Meanwhile, duration of heat effects was longer than in similar studies [10,11,28,39]. A previous study found that large communities with high population densities, low income per capita, and lack of nurses had a greater propensity toward increased risk of heat-related mortality displacement [40]. In addition, people in Lanzhou might be more sensitive to heat waves than those living in hotter areas due to their acclimatization to the temperate continental climate with cool summers and cold winters [41]. This indicates that more serious health issues will occur among Lanzhou residents as extreme weather events increase due to a changing climate. Consistent with the previous study [26], we found significant harvesting effects in heat. The harvesting effects might be modified by climates, socioeconomic, quality of medical service, and other factors [12,26]. Lanzhou is often recognized as a summer resort due to its cool weather from June to August with a mean temperature of 22.67 °C, so residents living in this cool climate in Lanzhou may be more vulnerable to short periods of hot days. This may lead to the significant harvesting effect of heat for death in Lanzhou. Our results also indicate the importance of the timely prevention or intervention actions to reduce heat related health effects.
As to YLL for specific diseases, the effects of cold and heat on the CV system are stronger than those on the respiratory system. This might have led to a higher YLL attributable to CV mortality in this study, consistent with other studies [42,43]. Exposure to cold increases numbers of erythrocytes and blood platelets and leads to an increase of blood cholesterol and fibrinogen [44,45], which contributes to CV diseases. Exposure to cold has also been found to increase the contraction of peripheral blood vessels, elevate blood pressure, increase the occurrence of coronary–artery spasm, and promote the occurrence of adverse CV events. Possible mechanisms linking heat with CVD include increased surface blood circulation and sweating, which lead to an increase in a series of physiological burdens [46].
Along with vulnerability in the elderly, higher frequency of cold or hot weather caused by climate change, projected population growth and an aging population is acknowledged to drive the rise in temperature-related deaths among the elderly [2], and these challenges also exist for China [6,47]. It is worth noting that elderly residents (≥65 years) in Lanzhou accounted for almost 10% in recent years, indicating a serious aging problem. Of people who died of non-accidental causes during 2014–2017 in Lanzhou, 74.6% were the elderly (≥65 years). What is worse, Lanzhou does not have a complete elderly-care system because of its poor socioeconomic status. Since the elderly of Lanzhou have already acclimated to its temperate climate, we assume that more and more of them would be affected by heat due to climate change. Therefore, more action should be taken to develop policy recommendations targeted at improving public health and protecting the elderly from changes in ambient temperature [48], particularly in a city like Lanzhou.
Lanzhou initiated a routine death surveillance system in 2011. In recent years, the data have become nearly complete, which allows us to conduct this study. Although many similar studies have been conducted in other regions, ours is the first to explore the relationship between YLL and ambient temperature in northwestern China. However, this study has some limitations to be considered. The data used were from only four central urban districts of Lanzhou, which might not be enough to represent all of northwestern China due to differences in geography. Therefore, studies using more city-level data and longer time periods might yield better estimates of the association between YLL and temperature in northwestern China. Our findings are further limited by a lack of control for other potential confounders, such as socioeconomic factors or lifestyles.

5. Conclusions

In summary, this study uniquely provides critical information to better understand the association between temperature and YLL in the temperate continental climate zone, especially in the Northwestern China. The results indicate that the cumulative effects of cold and heat on YLL are stronger than their single-day lag effects in Lanzhou. Males are more vulnerable to heat, while females suffer more YLL from cold. The effects of cold and heat on the elderly appear in earlier days and last longer than those for other age groups. Heat and cold exert stronger and more prominent effects on the CV system than those on the respiratory system. With an aging population, more attention should be paid to the elderly in Lanzhou, especially those with existing chronic diseases such as CV disease. Our findings suggest that prompt preventive measures or actions could help reduce heat-related health risks, while prolonged measures are needed to address cold-related health risks. Our findings can help improve clinical and public health practices to reduce the impact of possible extreme weather events.

Supplementary Materials

The following are available online at https://www.mdpi.com/1660-4601/16/19/3529/s1, Table S1: Monthly average temperature in Lanzhou City from 2004 to 2017 (°C); Figure S1: Box plots of monthly YLL (Non-accidental deaths (<65 years), Male (≥65 years), Female (≥65 years)) in Lanzhou City, China, during 2014–2017; Figure S2: Lag patterns for single-day cold effects on various subgroups (Non-accidental deaths (<65 years), Male (≥65 years), Female (≥65 years)) in Lanzhou City, China; Figure S3: Lag patterns for single-day heat effects on various subgroups (Non-accidental deaths (<65 years), Male (≥65 years), Female (≥65 years)) in Lanzhou City, China; Figure S4: Lag patterns for cumulative cold effects on various subgroups (Non-accidental deaths (<65 years), Male (≥65 years), Female (≥65 years)) in Lanzhou City, China; Figure S5: Lag patterns for cumulative heat effects on various subgroups (Non-accidental deaths (<65 years), Male (≥65 years), Female (≥65 years)) in Lanzhou City, China.

Author Contributions

Data curation, Y.W., J.N., and B.L.; Methodology, J.L., L.G., J.N., and B.L.; Project administration, J.N. and B.L.; Resources, Y.W., S.L. (Sheng Li), and S.L. (Shuyu Liu); Writing—original draft, J.L.; Writing—review and editing, Y.M., X.H., L.L., L.G., B.L., and K.Z.

Funding

This work was supported by grants from the National Natural Science Foundation of China (4187050043), the foundation of the Ministry of Education Key Laboratory of Cell Activities and Stress Adaptations, Lanzhou University, China (lzujbky-2018-kb05) and Chengguan Science and Technology Planning Project, Lanzhou, China (2017SHFZ0043).

Acknowledgments

We would like to thank Lin Hualiang for his guidance and suggestions on data analysis.

Conflicts of Interest

The authors declare no conflict of interest.

References

  1. Watts, N.; Amann, M.; Arnell, N.; Ayeb-Karlsson, S.; Belesova, K.; Berry, H.; Bouley, T.; Boykoff, M.; Byass, P.; Cai, W.; et al. The 2018 report of the Lancet Countdown on health and climate change: Shaping the health of nations for centuries to come. Lancet 2018, 392, 2479–2514. [Google Scholar] [CrossRef]
  2. Hajat, S.; Vardoulakis, S.; Heaviside, C.; Eggen, B. Climate change effects on human health: Projections of temperature-related mortality for the UK during the 2020s, 2050s and 2080s. J. Epidemiol. Community Health 2014, 68, 641–648. [Google Scholar] [CrossRef] [PubMed]
  3. Adeola, A.M.; Botai, H.; Rautenbach, O.M.; Adisa, K.P.; Ncongwane, C.M.B.; Adebayo-Ojo, T.C. Climatic Variables and Malaria Morbidity in Mutale Local Municipality, South Africa: A 19-Year Data Analysis. Int. J. Environ. Res. Public Health 2017, 14, 1360. [Google Scholar] [CrossRef] [PubMed]
  4. Vicedo-Cabrera, A.M.; Sera, Y.; Guo, Y.; Chung, K.; Arbuthnott, S.; Tong, A.; Tobias, E.; Lavigne, M.d.Z.S.C.; Saldiva, P.H.N.; Goodman, P.G. A multi-country analysis on potential adaptive mechanisms to cold and heat in a changing climate. Environ. Int. 2018, 111, 239–246. [Google Scholar] [CrossRef] [PubMed]
  5. Gasparrini, A.; Guo, Y.; Hashizume, M.; Lavigne, E.; Zanobetti, A.; Schwartz, J.; Tobias, A.; Tong, S.; Rocklöv, J.; Forsberg, B.; et al. Mortality risk attributable to high and low ambient temperature: A multicountry observational study. Lancet 2015, 386, 369–375. [Google Scholar] [CrossRef]
  6. Chen, R.; Yin, P.; Wang, L.; Liu, C.; Niu, Y.; Wang, W.; Jiang, Y.; Liu, Y.; Liu, J.; Qi, J.; et al. Association between ambient temperature and mortality risk and burden: Time series study in 272 main Chinese cities. BMJ 2018, 363, k4306. [Google Scholar] [CrossRef] [PubMed]
  7. Yi, W.; Chan, A.P. Effects of temperature on mortality in Hong Kong: A time series analysis. Int. J. Biometeorol. 2015, 59, 927–936. [Google Scholar] [CrossRef]
  8. Ma, W.; Yang, J.; Tan, W.; Song, B.C. Modifiers of the temperature-mortality association in Shanghai, China. Int. J. Biometeorol. 2012, 56, 205–207. [Google Scholar] [CrossRef]
  9. Li, G.; Li, L.; Tian, Q.G. Future temperature-related years of life lost projections for cardiovascular disease in Tianjin, China. Sci. Total Environ. 2018, 630, 943–950. [Google Scholar] [CrossRef]
  10. Ban, J.; Xu, M.Z.; He, Q.; Sun, C.; Chen, W.; Wang, P.Z. The effect of high temperature on cause-specific mortality: A multi-county analysis in China. Environ. Int. 2017, 106, 19–26. [Google Scholar] [CrossRef] [Green Version]
  11. Han, J.; Liu, J.; Zhang, L.; Zhou, Q.; Fang, J.Z. The impact of temperature extremes on mortality: A time-series study in Jinan, China. BMJ Open 2017, 7, e014741. [Google Scholar] [CrossRef] [PubMed]
  12. Zhang, Y.; Yu, J.B. Impact of temperature on mortality in Hubei, China: A multi-county time series analysis. Sci. Rep. 2017, 7, 45093. [Google Scholar] [CrossRef] [PubMed]
  13. Odhiambo Sewe, M.; Bunker, V.; Ingole, T.; Egondi, D.O.A.; Hondula, J.R. Estimated Effect of Temperature on Years of Life Lost: A Retrospective Time-Series Study of Low-, Middle-, and High-Income Regions. Environ. Health Perspect. 2018, 126, 017004. [Google Scholar] [CrossRef] [PubMed] [Green Version]
  14. Guo, Y.; Li, Z.; Tian, X.; Pan, J.Z. The burden of air pollution on years of life lost in Beijing, China, 2004–2008: Retrospective regression analysis of daily deaths. BMJ 2013, 347, f7139. [Google Scholar] [CrossRef] [PubMed]
  15. Brustugun, O.T.; Moller, B.; Helland, A. Years of life lost as a measure of cancer burden on a national level. Br. J. Cancer 2014, 111, 1014–1020. [Google Scholar] [CrossRef] [PubMed]
  16. Huang, C.; Barnett, A.G.; Wang, X.; Tong, S. The impact of temperature on years of life lost in Brisbane, Australia. Nat. Clim. Chang. 2012, 2, 265. [Google Scholar] [CrossRef]
  17. Wang, X.Y.; Barnett, A.G.; Hu, W.; Tong, S. Temperature variation and emergency hospital admissions for stroke in Brisbane, Australia, 1996–2005. Int. J. Biometeorol. 2009, 53, 535–541. [Google Scholar] [CrossRef] [PubMed]
  18. Yang, J.; Ou, C.Q.; Ding, Y.; Zhou, Y.X.; Chen, P.Y. Daily temperature and mortality: A study of distributed lag non-linear effect and effect modification in Guangzhou. Environ. Health 2012, 11, 63. [Google Scholar] [CrossRef]
  19. Li, G.; Huang, J.; Xu, G.; Pan, X.; Qian, X.; Xu, J.; Zhao, Y.; Zhang, T.; Liu, Q.; Guo, X.; et al. Temporal variation in associations between temperature and years of life lost in a southern China city with typical subtropical climate. Sci. Rep. 2017, 7, 4650. [Google Scholar] [CrossRef] [Green Version]
  20. Lanzhou Municipal Government. Geography & Weather of Lanzhou. Available online: http://www.lanzhou.gov.cn/col/col2/index.html (accessed on 13 June 2019). (In Chinese)
  21. World Health Organization. Life Tables by Country. Available online: http://apps.who.int/gho/data/?theme=main&vid=60340 (accessed on 13 June 2019).
  22. Gasparrini, A. Modeling exposure-lag-response associations with distributed lag non-linear models. Stat. Med. 2014, 33, 881–899. [Google Scholar] [CrossRef]
  23. Gasparrini, A. Distributed Lag Linear and Non-Linear Models in R: The Package dlnm. J. Stat. Softw. 2011, 43, 1–20. [Google Scholar] [CrossRef] [PubMed]
  24. Gasparrini, A. Distributed Lag Linear and Non-Linear Models for Time Series Data. Available online: https://cran.r-project.org/web/packages/dlnm/vignettes/dlnmTS.pdf (accessed on 1 September 2019).
  25. Yang, J.; Ou, C.Q.; Guo, Y.; Li, L.; Guo, C.; Chen, P.Y.; Lin, H.L.; Liu, Q.Y. The burden of ambient temperature on years of life lost in Guangzhou, China. Sci. Rep. 2015, 5, 12250. [Google Scholar] [CrossRef] [PubMed]
  26. Baccini, M.; Kosatsky, T.; Biggeri, A. Impact of summer heat on urban population mortality in Europe during the 1990s: An evaluation of years of life lost adjusted for harvesting. PLoS ONE 2013, 8, e69638. [Google Scholar] [CrossRef] [PubMed]
  27. Alam, N.; Lindeboom, W.; Begum, D.; Streatfield, P.K. The association of weather and mortality in Bangladesh from 1983–2009. Glob. Health Act. 2012, 5, 53–60. [Google Scholar] [CrossRef] [PubMed]
  28. Zhang, Y.; Yu, C.; Peng, M.; Zhang, L. The burden of ambient temperature on years of life lost: A multi-community analysis in Hubei, China. Sci. Total Environ. 2018, 621, 1491–1498. [Google Scholar] [CrossRef]
  29. Lanzhou Municipal Bureau of Statistics. Yearbook of Lanzhou. Available online: http://tjj.lanzhou.gov.cn/index.html (accessed on 1 July 2019).
  30. World Health Organization. Air Zquality Guidelines-Global Update. 2005. Available online: https://www.who.int/airpollution/publications/aqg2005/en/ (accessed on 3 September 2019).
  31. Wang, C.; Chen, R.; Kuang, X.; Duan, X.; Kan, H. Temperature and daily mortality in Suzhou, China: A time series analysis. Sci. Total Environ. 2014, 466, 985–990. [Google Scholar] [CrossRef] [PubMed]
  32. Bai, L.; Woodward, A.; Liu, Q. Temperature and mortality on the roof of the world: A time-series analysis in three Tibetan counties, China. Sci. Total Environ. 2014, 485–486, 41–48. [Google Scholar] [CrossRef]
  33. Li, Z.; Xu, Y.; Lin, G.; Li, D.; Liu, T.; Lin, H.; Xiao, J.; Zeng, W.; Li, X.; Ma, W. Impact of air temperature on years of life lost among residents in Guangzhou and Zhuhai: A time-series study. Zhonghua Liu Xing Bing Xue Za Zhi 2015, 36, 720–724. [Google Scholar]
  34. Goggins, W.B.; Chan, E.Y.; Yang, C.; Chong, M. Associations between mortality and meteorological and pollutant variables during the cool season in two Asian cities with sub-tropical climates: Hong Kong and Taipei. Environ. Health 2013, 12, 59. [Google Scholar] [CrossRef]
  35. Yu, W.; Mengersen, K.; Wang, X.; Ye, X.; Guo, Y.; Pan, X.; Tong, S. Daily average temperature and mortality among the elderly: A meta-analysis and systematic review of epidemiological evidence. Int. J. Biometeorol. 2012, 56, 569–581. [Google Scholar] [CrossRef]
  36. Yang, J.; Yin, P.; Zhou, M.; Ou, C.Q.; Li, M.; Li, J.; Liu, X.; Gao, J.; Liu, Y.; Qin, R.; et al. The burden of stroke mortality attributable to cold and hot ambient temperatures: Epidemiological evidence from China. Environ. Int. 2016, 92, 232–238. [Google Scholar] [CrossRef] [PubMed]
  37. Newson, L. Menopause and cardiovascular disease. Post Reprod. Health 2018, 24, 44–49. [Google Scholar] [CrossRef] [PubMed]
  38. Mendelsohn, M.E.; Karas, R.H. Molecular and cellular basis of cardiovascular gender differences. Science 2005, 308, 1583–1587. [Google Scholar] [CrossRef] [PubMed]
  39. Linares, C.; Martinez-Martin, P.; Rodríguez-Blázquez, C.; Forjaz, M.J.; Carmona, R.; Díaz, J. Effect of heat waves on morbidity and mortality due to Parkinson’s disease in Madrid: A time-series analysis. Environ. Int. 2016, 89, 1–6. [Google Scholar] [CrossRef]
  40. Ng, C.F.S.; Ueda, K.; Takeuchi, A.; Nitta, H.; Konishi, S.; Bagrowicz, R.; Watanabe, C.; Takami, A. Sociogeographic variation in the effects of heat and cold on daily mortality in Japan. J. Epidemiol. 2014, 24, 15–24. [Google Scholar] [CrossRef]
  41. Guo, Y.; Gasparrini, A.; Armstrong, B.G.; Tawatsupa, B.; Tobias, A.; Lavigne, E.; Coelho, M.D.S.Z.S.; Pan, X.; Kim, H.; Hashizume, M.; et al. Heat Wave and Mortality: A Multicountry, Multicommunity Study. Environ. Health Perspect. 2017, 125, 087006. [Google Scholar] [CrossRef] [Green Version]
  42. Mu, Z.; Chen, P.L.; Geng, F.H.; Ren, L.; Gu, W.C.; Ma, J.Y.; Peng, L.; Li, Q.Y. Synergistic effects of temperature and humidity on the symptoms of COPD patients. Int. J. Biometeorol. 2017, 61, 1919–1925. [Google Scholar] [CrossRef]
  43. Seys, S.F.; Daenen, M.; Dilissen, E.; Van Thienen, R.; Bullens, D.M.; Hespel, P.; Dupont, L.J. Effects of high altitude and cold air exposure on airway inflammation in patients with asthma. Thorax 2013, 68, 906–913. [Google Scholar] [CrossRef] [Green Version]
  44. Schneider, A.; Panagiotakos, D.; Picciotto, S.; Katsouyanni, K.; Löwel, H.; Jacquemin, B.; Lanki, T.; Stafoggia, M.; Bellander, T.; Koenig, W.; et al. Air temperature and inflammatory responses in myocardial infarction survivors. Epidemiology 2008, 19, 391–400. [Google Scholar] [CrossRef]
  45. Keatinge, W.R.; Coleshaw, S.R.; Cotter, F.; Mattock, M.; Murphy, M.; Chelliah, R. Increases in platelet and red cell counts, blood viscosity, and arterial pressure during mild surface cooling: Factors in mortality from coronary and cerebral thrombosis in winter. Br. Med. J. (Clin. Res. Ed.) 1984, 289, 1405–1408. [Google Scholar] [CrossRef]
  46. Nayha, S. Environmental temperature and mortality. Int. J. Circumpolar Health 2005, 64, 451–458. [Google Scholar] [CrossRef]
  47. Zhao, Y.Q.; Wang, L.J.; Luo, Y.; Yin, P.; Huang, Z.J.; Liu, T.; Lin, H.L.; Xiao, J.P.; Li, X.; Zeng, W.L.; et al. Lagged effects of diurnal temperature range on mortality in 66 cities in China: A time-series study. Zhonghua Liu Xing Bing Xue Za Zhi 2017, 38, 290–296. [Google Scholar]
  48. Lindeboom, W.; Alam, N.; Begum, D.; Kim Streatfield, P. The association of meteorological factors and mortality in rural Bangladesh, 1983–2009. Glob. Health Act. 2012, 5, 61–73. [Google Scholar] [CrossRef]
Figure 1. Geographical locations of Lanzhou City, China; (A,B) Locations of Lanzhou City, China; (C) The central four districts selected in the present study.
Ijerph 16 03529 g001
Figure 2. Box plots of monthly averages of temperature in Lanzhou, China, during 2014–2017.
Ijerph 16 03529 g002
Figure 3. Box plots of monthly years of life lost (YLL) in Lanzhou, China, during 2014–2017.
Ijerph 16 03529 g003
Figure 4. Lag patterns for single-day cold effects on various subgroups in Lanzhou, China. The bold lines represent the effect estimates, and the grey areas represent 95% confidence intervals. Cold effects in the present study represented changes in YLL caused by lower temperatures from the 25th to the 1st percentile of the overall temperature distribution. The reference temperature was 2.45 °C (25th percentile).
Ijerph 16 03529 g004
Figure 5. Lag patterns for single-day heat effects on various subgroups in Lanzhou, China. The bold lines represent the effect estimates, and the grey areas represent 95% confidence intervals. Heat effects in the present study represented changes in YLL caused by higher temperatures from the 75th to the 99th percentile of the overall temperature distribution. The reference temperature was 19.7 °C (75th percentile).
Ijerph 16 03529 g005
Figure 6. Lag patterns for cumulative cold effects on various subgroups in Lanzhou, China. The bold lines represent the effect estimates, and the grey areas represent 95% confidence intervals. Cold effects in the present study represented changes in YLL caused by lower temperatures from the 25th to the 1st percentile of the overall temperature distribution. The reference temperature was 2.45 °C (25th percentile).
Ijerph 16 03529 g006
Figure 7. Lag patterns for cumulative heat effects on various subgroups in Lanzhou, China. The bold lines represent the effect estimates, and the grey areas represent 95% confidence intervals. Heat effects in the present study represented changes in YLL caused by higher temperatures from the 75th to the 99th percentile of the overall temperature range. The reference temperature was 19.7 °C (75th percentile).
Ijerph 16 03529 g007
Table 1. Summary of statistics for air pollutants, weather variables, and YLL in Lanzhou, 2014–2017.
VariablesDaily Measures
Minimum1st QuartileMedian3rd QuartileMaximumMean ± S.D.
PM10 (μg/m3)19.7281.73107.30145.861451.01124.67 ± 86.07
NO2 (μg/m3)12.2537.7050.3963.74143.1252.97 ± 21.46
SO2 (μg/m3)3.4710.5617.8330.23130.5922.17 ± 15.19
CO (mg/m3)0.340.811.081.614.591.33 ± 0.73
O3 (μg/m3)0.7930.7946.5663.35125.0548.43 ± 22.09
Temperature (°C)−12.402.4512.7019.7030.4011.39 ± 9.4
Relative humidity (%)16.0039.0050.0061.0094.0051.51 ± 15.09
All136.3333.1410.10492.41211.0420.5 ± 128.8
Male35.5188.9242.6303.6753.3251.8 ± 90.7
Female15.5114.8160.2210.1593.0168.8 ± 73.4
Non-accidental deaths (<65)0153.1210.4283.3728.9224.8 ± 104.4
Non-accidental deaths (≥65)61.9154.6191.1230.6500.4195.8 ± 58.6
Male (≥65)6.677.4101.8127.3283.4104.2 ± 38.0
Female (≥65)5.565.588.6112.0284.391.5 ± 36.0
Respiratory diseases (≥65)017.429.243.4170.732.2 ± 20.36
Cardiovascular diseases (≥65)10.071.494.9120.2252.997.1 ± 36.3
Note: YLL: years of life lost; SD: standard deviation; PM10: particulate matter with size <10 μm; NO2: nitrogen dioxide; SO2: sulfur dioxide; CO: carbon monoxide; O3: ozone; 1st quartile: first quartile; 3rd quartile: third quartile; Guideline levels of WHO for each pollutant [30]: PM10 (24 h): 25 µg/m3; NO2 (1 h): 200 μg/m3; SO2 (24 h): 20 μg/m3; O3 (8 h): 100 μg/m3.
Table 2. Significant durations and strongest single-day lag effects of cold and heat for different subgroups in Lanzhou City.
Significant Duration (Days)Strongest EffectsHighest YLL (95% CI)
Cold effects (years)
AllLag 10–28Lag 2813.24 (1.53, 24.96)
Male---
FemaleLag 8–29Lag 169.76 (4.93, 14.59)
Non-accidental deaths (<65)Lag 13–26Lag 219.50 (3.58, 15.42)
Non-accidental deaths (≥65)Lag 5–14, lag 23–29Lag 710.01 (4.08, 15.94)
Male (≥65)Lag 5–12Lag 75.62 (1.59, 9.65)
Female (≥65)Lag 5–14, lag 20–27Lag 74.40 (0.52, 8.27)
Respiratory diseases (≥65)---
Cardiovascular diseases (≥65)Lag 5–25Lag 75.14 (1.30, 8.97)
Heat effects (years)
AllLag 1Lag 120.80 (3.03, 38.58)
MaleLag 1, lag 22–30Lag 119.06 (6.19, 31.94)
Female---
Non-accidental deaths (<65)---
Non-accidental deaths (≥65)Lag 1 to 5Lag 218.29 (6.51, 30.07)
Male (≥65)Lag 1-5, lag 23–28Lag 213.04 (5.03, 21.04)
Female (≥65)Lag 1Lag 16.44 (1.33, 11.55)
Respiratory diseases (≥65)Lag 1–5Lag 25.76 (1.59, 9.94)
Cardiovascular diseases (≥65)Lag 1–4Lag 18.72 (3.66, 13.78)
Note: “-” represents no statistical significance; CI: confidence interval.
Table 3. Significant durations and strongest cumulative lag effects of cold and heat for various subgroups in Lanzhou City.
Significant Duration (Days)Strongest EffectsHighest YLL (95% CI)
Cold effects (years)
AllLag 0–30Lag 0–30246.87 (75.09, 418.64)
Male---
FemaleLag 0–9 to 30Lag 0–30246.41 (143.60, 349.22)
Non-accidental deaths (<65)---
Non-accidental deaths (≥65)Lag 0–10 to 30Lag 0–30121.85 (46.25, 197.44)
Male (≥65)---
Female (≥65)Lag 0–11 to 30Lag 0–3076.83 (27.43, 126.23)
Respiratory diseases (≥65)---
Cardiovascular diseases (≥65)Lag 0–15 to 30Lag 0–3066.75 (17.85, 115.66)
Heat effects (years)
AllLag 0–2 to 12Lag 0–788.19 (25.43, 150.95)
MaleLag 0–2 to 30Lag 0–30133.58 (35.01, 232.15)
Female---
Non-accidental deaths (<65)---
Non-accidental deaths (≥65)Lag 0–1 to 30Lag 0–3089.82 (29.90, 149.74)
Male (≥65)Lag 0–2 to 30Lag 0–3071.32 (30.61, 112.04)
Female (≥65)Lag 0–2 to 14Lag 0–830.11 (11.19, 49.03)
Respiratory diseases (≥65)Lag 0–3 to 30Lag 0–3022.30 (1.09, 43.52)
Cardiovascular diseases (≥65)Lag 0–2 to 30Lag 0–3044.54 (5.78, 82.30)
Note: “-” represents no statistical significance.

