Low Birthweight Is Associated with Higher Risk of High Blood Pressure in Chinese Girls: Results from a National Cross-Sectional Study in China

 , ,
, ,
Abstract
:1. Introduction
2. Materials and Methods
2.1. Study Setting and Participants’ Engagement
2.2. Birthweight Data
2.3. Anthropometric Measurements
2.4. Blood Pressure Measurement
2.5. Measurements Classifications
2.6. Questionnaire Data Collection
2.7. Statistical Analysis
3. Results
4. Discussion
5. Conclusions
Author Contributions
Funding
Acknowledgments
Conflicts of Interest
Abbreviations
| HBP | high blood pressure |
| SBP | systolic blood pressure |
| DBP | diastolic blood pressure |
| BMI | body mass index |
| LBW | low birthweight |
| NBW | normal birthweight |
| NHBPEP | National High Blood Pressure Education Program |
References
- Global Burden of Cardiovascular Diseases C; Roth, G.A.; Johnson, C.O.; Abate, K.H.; Abd-Allah, F.; Ahmed, M.; Alam, K.; Alam, T.; Alvis-Guzman, N.; Ansari, H. The Burden of Cardiovascular Diseases Among US States, 1990–2016. JAMA Cardiol. 2018, 3, 375–389. [Google Scholar] [CrossRef] [PubMed]
- Dong, Y.; Ma, J.; Song, Y.; Ma, Y.; Dong, B.; Zou, Z.; Prochaska, J.J. Secular Trends in Blood Pressure and Overweight and Obesity in Chinese Boys and Girls Aged 7 to 17 Years From 1995 to 2014. Hypertens 2018, 72, 298–305. [Google Scholar] [CrossRef] [PubMed] [Green Version]
- Liu, X.; Li, Y.; Guo, Y.; Li, L.; Yang, K.; Liu, R.; Mao, Z.; Bie, R.; Wang, C. The burden, management rates and influencing factors of high blood pressure in a Chinese rural population: The Rural Diabetes, Obesity and Lifestyle (RuralDiab) study. J. Hum. Hypertens. 2018, 32, 236–246. [Google Scholar] [CrossRef] [PubMed]
- Shankaran, S.; Das, A.; Bauer, C.R.; Bada, H.; Lester, B.; Wright, L.; Higgins, R.; Poole, K. Fetal origin of childhood disease: Intrauterine growth restriction in term infants and risk for hypertension at 6 years of age. Arch. Pediatr. Adolesc. Med. 2006, 160, 977–981. [Google Scholar] [CrossRef] [PubMed]
- Wardlaw, T.; Blanc, A.; Zupan, J.; Ahman, A. Low Birthweight: Country Regional and Global Estimates; UNICEF: New York, NY, USA, 2004. [Google Scholar]
- Barker, D.; Osmond, C.; Winter, P.; Margetts, B.; Simmonds, S. Weight in infancy and death from ischaemic heart disease. Lancet 1989, 334, 577–580. [Google Scholar] [CrossRef]
- Morrison, K.M.; Ramsingh, L.; Gunn, E.; Streiner, D.; Van Lieshout, R.; Boyle, M.; Gerstein, H.; Schmidt, L.; Saigal, S. Cardiometabolic Health in Adults Born Premature With Extremely Low Birthweight. Pediatrics 2016, 138, e20160515. [Google Scholar] [CrossRef] [PubMed]
- Huxley, R.R.; Shiell, A.W.; Law, C.M. The role of size at birth and postnatal catch-up growth in determining systolic blood pressure: A systematic review of the literature. J. Hypertens. 2000, 18, 815–831. [Google Scholar] [CrossRef] [PubMed]
- Seidman, D.S.; Laor, A.; Gale, R.; Stevenson, D.K.; Mashiach, S.; Danon, Y.L. Birth weight, current body weight, and blood pressure in late adolescence. BMJ Clin. Res. 1991, 302, 1235–1237. [Google Scholar] [CrossRef] [PubMed]
- Barker, D.J.; Osmond, C. Low birth weight and hypertension. BMJ 1988, 297, 134–135. [Google Scholar] [CrossRef]
- Orlando, A.; Cazzaniga, E.; Giussani, M.; Palestini, P.; Genovesi, S. Hypertension in Children: Role of Obesity, Simple Carbohydrates, and Uric Acid. Front. Public Health 2018, 6, 129. [Google Scholar] [CrossRef] [Green Version]
- Fujita, Y.; Kouda, K.; Nakamura, H.; Iki, M. Association of Rapid Weight Gain During Early Childhood with Cardiovascular Risk Factors in Japanese Adolescents. J. Epidemiol. 2013, 23, 103–108. [Google Scholar] [CrossRef] [PubMed]
- Van Hulst, A.; Barnett, T.A.; Paradis, G.; Roy-Gagnon, M.; Gomez-Lopez, L.; Henderson, M. Birth Weight, Postnatal Weight Gain, and Childhood Adiposity in Relation to Lipid Profile and Blood Pressure During Early Adolescence. J. Am. Hear. Assoc. 2017, 6, e006302. [Google Scholar] [CrossRef] [PubMed]
- Howe, L.D.; Chaturvedi, N.; Lawlor, D.A.; Ferreira, D.L.; Fraser, A.; Smith, G.D.; Tilling, K.; Hughes, A.D. Rapid increases in infant adiposity and overweight/obesity in childhood are associated with higher central and brachial blood pressure in early adulthood. J. Hypertens. 2014, 32, 1789–1796. [Google Scholar] [CrossRef] [PubMed] [Green Version]
- Franks, P.W.; Hanson, R.L.; Knowler, W.C.; Sievers, M.L.; Bennett, P.H.; Looker, H.C. Childhood Obesity, Other Cardiovascular Risk Factors, and Premature Death. N. Eng. J. Med. 2010, 362, 485. [Google Scholar] [CrossRef] [PubMed]
- Zhou, Y.; Qian, Z.; Vaughn, M.G.; Boutwell, B.B.; Yang, M.; Zeng, X.W.; Liu, R.Q.; Qin, X.D.; Zhu, Y.; Dong, G.H. Epidemiology of elevated blood pressure and associated risk factors in Chinese children: The SNEC study. J. Hum. Hypertens. 2016, 30, 231. [Google Scholar] [CrossRef] [PubMed]
- Bichteler, A.; Gershoff, E.T. Identification of Children’s BMI Trajectories and Prediction from Weight Gain in Infancy. Obes. Silver Spring 2018, 26, 1050–1056. [Google Scholar] [CrossRef] [PubMed]
- Chen, Y.; Ma, L.; Ma, Y.; Wang, H.; Luo, J.; Zhang, X.; Luo, C.; Wang, H.; Zhao, H.; Pan, D.; et al. A national school-based health lifestyles interventions among Chinese children and adolescents against obesity: Rationale, design and methodology of a randomized controlled trial in China. BMC Public Health 2015, 15, 210. [Google Scholar] [CrossRef]
- Falkner, B.; Daniels, S.R. The Fourth Report on the Diagnosis, Evaluation, and Treatment of High Blood Pressure in Children and Adolescents. Pediatrics 2004, 114, 555–576. [Google Scholar] [CrossRef]
- Obesity CSOC. Report on Childhood Obesity in China Body Mass Index Reference for Screening Overweight and Obesity in Chinese School-age Children. Biomed. Environ. Sci. 2005, 18, 390–400. [Google Scholar]
- Xie, Y.J.; Ho, S.C.; Liu, Z.M.; Hui, S.S.C. Birth weight and blood pressure: ‘J’ shape or linear shape? Findings from a cross-sectional study in Hong Kong Chinese women. BMJ Open 2014, 4, e005115. [Google Scholar] [CrossRef]
- Chen, X.; Wang, Y. Tracking of blood pressure from childhood to adulthood: A systematic review and meta-regression analysis. Circulation 2008, 117, 3171–3180. [Google Scholar] [CrossRef] [PubMed]
- Sundström, J.; Neovius, M.; Tynelius, P.; Rasmussen, F. Association of blood pressure in late adolescence with subsequent mortality: Cohort study of Swedish male conscripts. BMJ 2011, 342, d643. [Google Scholar] [CrossRef] [PubMed]
- Gennser, G.; Rymark, P.; Isberg, P. E Low birth weight and risk of high blood pressure in adulthood. BMJ 1988, 296, 1498–1500. [Google Scholar] [CrossRef] [PubMed]
- Curhan, G.C.; Willett, W.C.; Rimm, E.B.; Spiegelman, D.; Ascherio, A.L.; Stampfer, M.J. Birthweight and Adult Hypertension, Diabetes Mellitus, and Obesity in US Men. Circulation 1996, 94, 3246–3250. [Google Scholar] [CrossRef] [PubMed]
- Falkner, B.; Hulman, S.; Kushner, H. Effect of Birth Weight on Blood Pressure and Body Size in Early Adolescence. Hypertension 2004, 43, 203–207. [Google Scholar] [CrossRef] [Green Version]
- Hovi, P.; Vohr, B.; Ment, L.R.; McGarvey, L.; Morrison, K.M.; Evensen, K.A.; van der Pal, S.; Grunau, R.E.; APIC Adults Born Preterm International Collaboration; Brubakk, A.M.; et al. Blood Pressure in Young Adults Born at Very Low Birthweight: Adults Born Preterm International Collaboration. Hypertension 2016, 68, 880–887. [Google Scholar] [CrossRef]
- Myrie, S.B.; McKnight, L.L.; Van Vliet, B.N.; Bertolo, R.F. Low birthweight is associated with reduced nephron number and increased blood pressure in adulthood in a novel spontaneous intrauterine growth-restricted model in Yucatan miniature Swine. Neonatology 2011, 100, 380–386. [Google Scholar] [CrossRef]
- Ojeda, N.B.; Intapad, S.; Alexander, B.T. Sex differences in the developmental programming of. hypertension. Acta Physiol. 2014, 210, 307–316. [Google Scholar] [CrossRef]
- Flynn, J.T.; Falkner, B.E. New Clinical Practice Guideline for the Management of High Blood Pressure in Children and Adolescents. Hypertension 2017, 70, 683–686. [Google Scholar] [CrossRef]
- Lurbe, E.; Cifkova, R.; Cruickshank, J.K.; Dillon, M.J.; Ferreira, I.; Invitti, C.; Kuznetsova, T.; Laurent, S.; Mancia, G.; Morales-Olivas, F.; et al. Management of high blood pressure in children and adolescents: Recommendations of the European Society of Hypertension. J. Hypertens. 2009, 27, 1719–1742. [Google Scholar] [CrossRef]
- Bloetzer, C.; Paccaud, F.; Burnier, M.; Bovet, P.; Chiolero, A. Performance of parental history for the targeted screening of hypertension in children. J. Hypertens. 2015, 33, 1167–1173. [Google Scholar] [CrossRef] [PubMed]
- Flynn, J.T.; Kaelber, D.C.; Baker-Smith, C.M.; Blowey, D.; Carroll, A.E.; Daniels, S.R.; De Ferranti, S.D.; Dionne, J.M.; Falkner, B.; Flinn, S.K.; et al. Clinical Practice Guideline for Screening and Management of High Blood Pressure in Children and Adolescents. Pediatrics 2017, 140, e20171904. [Google Scholar] [CrossRef] [PubMed] [Green Version]
- Sharma, A.K.; Metzger, D.L.; Rodd, C.J. Prevalence and Severity of High Blood Pressure Among Children Based on the 2017 American Academy of Pediatrics Guidelines. JAMA Pediatr. 2018. [Google Scholar] [CrossRef] [PubMed]
- Dong, Y.; Song, Y.; Zou, Z.; Ma, J.; Dong, B.; Prochaska, J.J. Updates to pediatric hypertension guidelines: Influence on classification of high blood pressure in children and adolescents. J. Hypertens. 2019, 37, 297–306. [Google Scholar] [CrossRef] [PubMed]


| Variable | Normal Birthweight | Low Birthweight | p-value |
|---|---|---|---|
| n = 43,220 | n = 2099 | ||
| Male, n (%) | 21,377 (49.46%) | 1014 (48.31%) | |
| Age (year) | 10.6 ± 3.3 | 10.4 ± 3.3 | 0.020 |
| Birthweight (g) | 3263.3 ± 356.4 | 2050.6 ± 333.3 | <0.001 |
| Height (cm) | 144.6 ± 16.8 | 142.2 ± 17.0 | <0.001 |
| Weight (kg) | 40.0 ± 15.3 | 37.6 ± 14.3 | <0.001 |
| Current BMI (kg/m2) | 18.4 ± 3.7 | 17.9 ± 3.5 | <0.001 |
| BMI group, n (%) | |||
| Normal/underweight | 33,212 (76.84%) | 1709 (81.42%) | <0.001 |
| Overweight/obese | 10,008 (23.16%) | 390 (18.58%) | <0.001 |
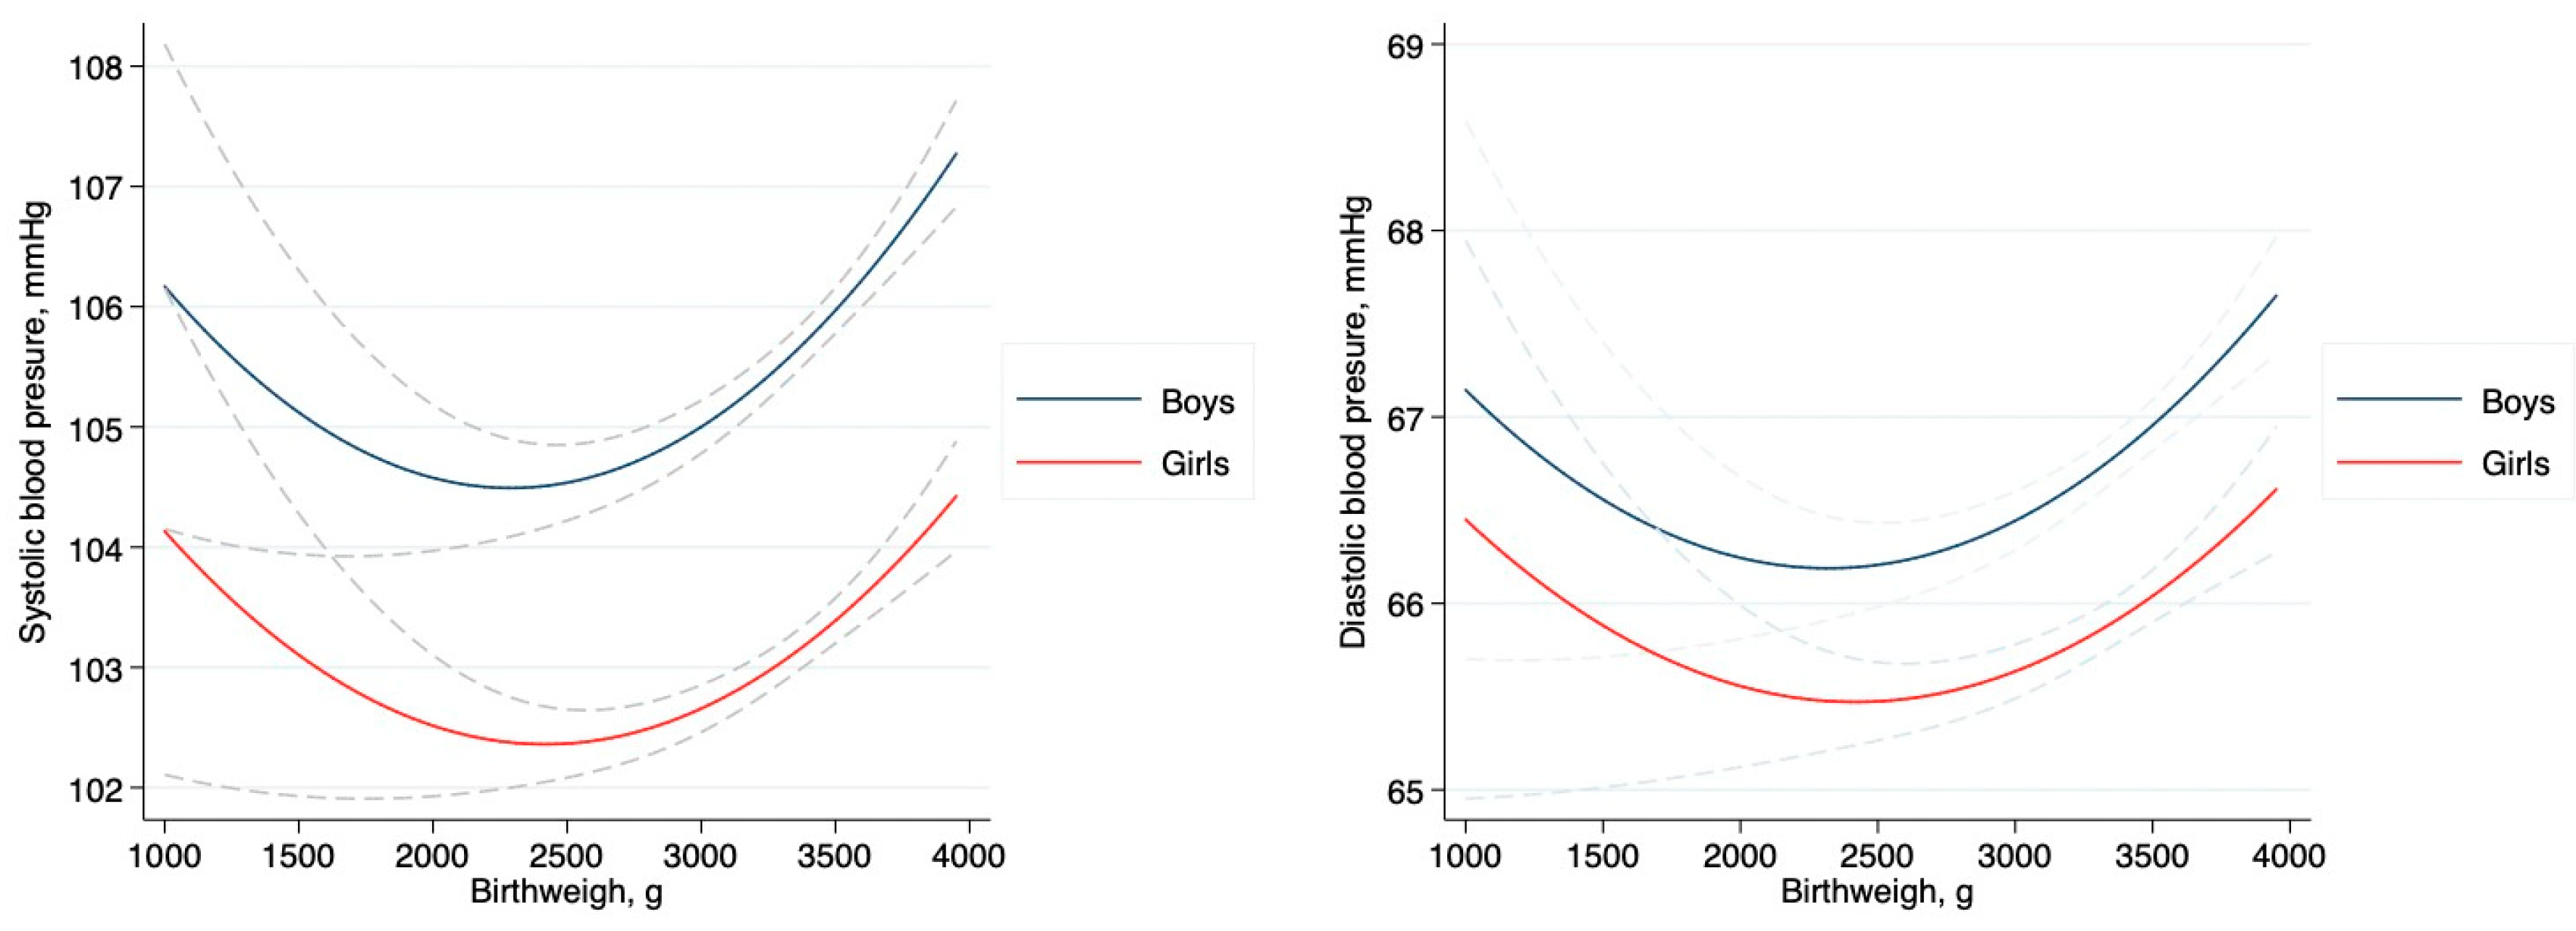
| Systolic blood pressure (mmHg) | 104.3 ± 12.1 | 103.3 ± 12.4 | <0.001 |
| Diastolic blood pressure (mmHg) | 66.3 ± 8.8 | 65.6 ± 9.2 | <0.001 |
| Urban residence, n (%) | 26,793 (61.99%) | 1463 (69.70%) | <0.001 |
| Daily physical activity (hours/day) | 3.2 ± 2.6 | 3.6 ± 2.6 | <0.001 |
| Family history of hypertension, n (%) | 19,202 (52.15%) | 736 (49.20%) | 0.025 |
| The only child of the family, n (%) | 30,791 (71.24%) | 1443 (68.75%) | 0.014 |
| Breastfeeding ≥ 1 month, n (%) | 31,502 (84.61%) | 1159 (76.20%) | <0.001 |
| Gender | Age Group | Normal Birthweight | Low Birthweight | p-value | ||
|---|---|---|---|---|---|---|
| Number of Observations | HBP Prevalence, N (%) | Number of Observations | HBP Prevalence, N (%) | |||
| Boys | 6–8 | 7269 | 626 (8.61) | 412 | 35 (8.50) | 0.934 |
| 9–11 | 5877 | 720 (12.25) | 279 | 28 (10.04) | 0.268 | |
| 12–15 | 4816 | 397 (8.24) | 182 | 21 (11.54) | 0.115 | |
| 16–18 | 3415 | 196 (5.74) | 141 | 10 (7.09) | 0.500 | |
| Total | 21,037 | 1939 (9.07) | 1014 | 94 (9.27) | 0.829 | |
| Girls | 6–8 | 7096 | 645 (9.09) | 331 | 32 (9.67) | 0.721 |
| 9–11 | 5389 | 702 (13.03) | 263 | 37 (14.07) | 0.625 | |
| 12–15 | 5155 | 373 (7.24) | 273 | 27 (9.89) | 0.102 | |
| 16–18 | 4203 | 110 (2.62) | 218 | 7 (3.21) | 0.594 | |
| Total | 21,843 | 1830 (8.38) | 1085 | 103 (9.49) | 0.197 | |
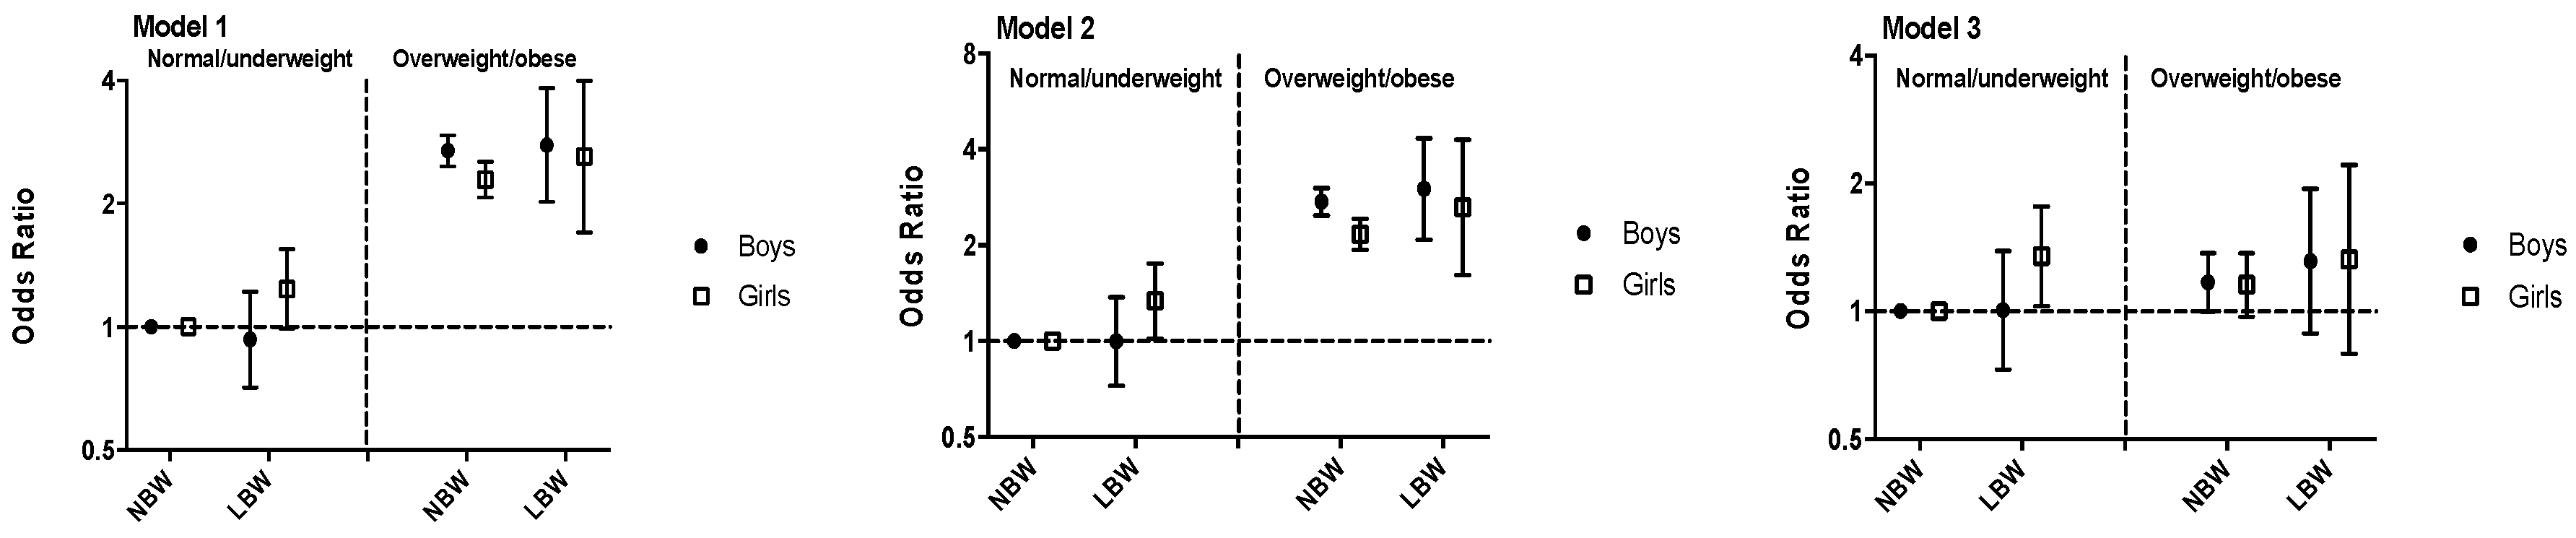
| Sex | Model 1 | Model 2 | Model 3 | |||
|---|---|---|---|---|---|---|
| OR (95% CI) | p-value | OR (95% CI) | p-value | OR (95% CI) | p-value | |
| Total (n = 45,319) | ||||||
| NBW | 1 (Reference) | 1 (Reference) | 1 (Reference) | |||
| LBW | 1.02 (0.89, 1.18) | 0.743 | 1.14 (0.97, 1.35) | 0.119 | 1.16 (0.98, 1.37) | 0.087 |
| Boys (n = 22,391) | ||||||
| NBW | 1 (Reference) | 1 (Reference) | 1 (Reference) | |||
| LBW | 0.93 (0.76, 1.14) | 0.468 | 1.03 (0.81, 1.31) | 0.809 | 1.05 (0.83, 1.34) | 0.672 |
| Girls (n = 22,928) | ||||||
| NBW | 1 (Reference) | 1 (Reference) | 1 (Reference) | |||
| LBW | 1.16 (0.95, 1.41) | 0.151 | 1.27 (1.01, 1.61) | 0.045 | 1.29 (1.02, 1.64) | 0.033 |
© 2019 by the authors. Licensee MDPI, Basel, Switzerland. This article is an open access article distributed under the terms and conditions of the Creative Commons Attribution (CC BY) license (http://creativecommons.org/licenses/by/4.0/).
Share and Cite
Wang, X.; Dong, Y.; Zou, Z.; Ma, J.; Yang, Z.; Gao, D.; Li, Y.; Nguyen, M.T. Low Birthweight Is Associated with Higher Risk of High Blood Pressure in Chinese Girls: Results from a National Cross-Sectional Study in China. Int. J. Environ. Res. Public Health 2019, 16, 2898. https://doi.org/10.3390/ijerph16162898
Wang X, Dong Y, Zou Z, Ma J, Yang Z, Gao D, Li Y, Nguyen MT. Low Birthweight Is Associated with Higher Risk of High Blood Pressure in Chinese Girls: Results from a National Cross-Sectional Study in China. International Journal of Environmental Research and Public Health. 2019; 16(16):2898. https://doi.org/10.3390/ijerph16162898
Chicago/Turabian StyleWang, Xijie, Yanhui Dong, Zhiyong Zou, Jun Ma, Zhaogeng Yang, Di Gao, Yanhui Li, and Minh Thien Nguyen. 2019. "Low Birthweight Is Associated with Higher Risk of High Blood Pressure in Chinese Girls: Results from a National Cross-Sectional Study in China" International Journal of Environmental Research and Public Health 16, no. 16: 2898. https://doi.org/10.3390/ijerph16162898