Article

Quantitative Microbial Risk Assessment for Workers Exposed to Bioaerosol in Wastewater Treatment Plants Aimed at the Choice and Setup of Safety Measures

1
Laboratory of Hygiene and Environmental Virology, Department of Biology, University of Pisa, Via S. Zeno 35/39, 56127 Pisa, Italy
2
Scuola Normale Superiore of Pisa, Piazza dei Cavalieri 7, 56126 Pisa, Italy
3
Department of Technology Innovations, Research, and Certification Sector—INAIL, Research Centre—Via Fontana Candida 1, 00040 Monte Porzio Catone (Rm), Italy
*
Author to whom correspondence should be addressed.
Int. J. Environ. Res. Public Health 2018, 15(7), 1490; https://doi.org/10.3390/ijerph15071490
Submission received: 24 April 2018 / Revised: 21 June 2018 / Accepted: 12 July 2018 / Published: 14 July 2018
(This article belongs to the Section Occupational Safety and Health)

Abstract

:
Biological risk assessment in occupational settings currently is based on either qualitative or semiquantitative analysis. In this study, a quantitative microbial risk assessment (QMRA) has been applied to estimate the human adenovirus (HAdV) health risk due to bioaerosol exposure in a wastewater treatment plant (WWTP). A stochastic QMRA model was developed considering HAdV as the index pathogen, using its concentrations in different areas and published dose–response relationship for inhalation. A sensitivity analysis was employed to examine the impact of input parameters on health risk. The QMRA estimated a higher average risk in sewage influent and biological oxidation tanks (15.64% and 12.73% for an exposure of 3 min). Sensitivity analysis indicated HAdV concentration as a predominant factor in the estimated risk. QMRA results were used to calculate the exposure limits considering four different risk levels (one illness case per 100, 1.000, 10.000, and 100.000 workers): for 3 min exposures, we obtained 565, 170, 54, and 6 GC/m3 of HAdV. We also calculated the maximum time of exposure for each level for different areas. Our findings can be useful to better define the effectiveness of control measures, which would thus reduce the virus concentration or the exposure time.

1. Introduction

Occupational exposure to bioaerosols in workplaces can produce a wide range of health effects, such as infectious diseases, acute toxic effects, inflammatory, and allergic diseases, chronic obstructive pulmonary diseases (COPD), fetal harm, and cancer [1,2]. Bioaerosols are biological particulates suspended in air that contain a large amount of fungi and bacteria as intact microbes or fragments such as endotoxins [3,4] as well as viruses [5]. Studies have revealed the association between exposure to bioaerosols and the onset of respiratory health outcomes during waste management activities [6].
The European Union (EU) Directive 2000/54/EC [7] on the protection of workers establishes that, in the case of any activity likely to involve an exposure to biological agents, the risk must be assessed and the measures to control it must be defined. Then, every person, even if only potentially exposed to pathogens, must be protected using the best practices based on the most up-to-date scientific knowledge and on the current level of technological development.
The EU Directive 2000/54/EC does not define the type of approach that has to be used. Presently, risk assessment is normally carried out by establishing the risk levels based on the probability and magnitude of the consequences deriving from exposure and designing a risk matrix where such levels are represented [8] in order to choose and prioritize preventive actions. However, biological risk management is hampered by the lack of efficient quantitative methods for an accurate assessment of the risk factors [9]. Moreover, infection risk levels are commonly estimated by the measurement of bacterial indicators, not pathogens directly linked to illnesses. Quantitative microbial risk assessment (QMRA) is used to evaluate microbiological hazards based on the measure of index pathogens in environmental matrices and their dose–response relationships. This is a well-established decision support tool in the fields of water supply, water reuse, and water recreational [10] and food safety [11,12], but it could also be applied to risk analysis in workplaces, in particular, for exposure to bioaerosols, although at present, it is not currently used. A tentative approach of this application was recently developed regarding exposure to the human adenovirus (HAdV) through bioaerosol in different settings [13]. In that case, the model used point estimate values of HAdV concentrations to assess the risk without taking into account uncertainty and variability. We choose HAdV as the reference pathogen because it is extremely widespread in wastewaters, it is known to be very resistant to water treatment, and it is likely to remain infectious in the environment for a long time. Moreover, it can cause both respiratory and gastrointestinal infections and it can be transmitted through ingestion as well as inhalation, followed or not by the swallowing of mucous [14].
In the present work, in order to perform a reliable occupational biological risk assessment, we developed a probabilistic QMRA model for the exposure of workers to bioaerosols containing HAdV using a dose–response model recently developed to describe the distributions of infectivity and pathogenicity in various challenge studies incorporating differences in inoculation routes [15,16].
The considered work settings were wastewater treatment plants (WWTP) that produce highly contaminated aerosol as demonstrated by numerous studies [17,18,19]. Specifically, the final aim was to obtain useful information for setting up practical risk management interventions and strategies: to compare the risk of infection and illness in different areas of the plant and for different exposure times; to provide evidence of the most important variables influencing the risk; and to try to establish critical values for different risk management options.

2. Materials and Methods

QMRA was conducted following a static approach [20], assessing health risk at the individual level. Thus, secondary transmission of infection/disease and immunity to infection from microbial agents were not taken into account. The QMRA framework includes four steps [20], which are briefly described below.

2.1. Hazard Identification and Exposure Assessment

The objective of the exposure assessment model was to estimate the dose of HAdV to which workers are exposed while performing their working activities. The data on HAdV genomic copy concentrations were obtained from a study [13] that measured bioaerosol contamination in different areas of WWTPs. Briefly, air samples (up to 3000 L) were collected with an impactor sampler loaded with Rodac plates containing tryptone soy agar that were subsequently eluted in 3% beef extract. The eluate was centrifugated and the supernatant was decontaminated. Finally, the viral DNA was extracted and HAdV was detected with quantitative PCR [13].
The Easy-Fit statistical package (MathWave Technologies, version 5.6) was used to obtain the probability distributions of the concentration data.
The HAdV dose that each worker is exposed to by inhalation during a definite exposure time was estimated from Equation (1) using input parameters, each with its own probability distribution, drawn from the literature—except the exposure time, which was the independent variable in the simulations:
d o s e = C H A d V / r e f f × t e x p × f c o n v × r i n × c f
In Relation (1): dose is the amount of HAdV inhaled (infectious viral particles/person/single exposition); CHAdV is the concentration of the genome copies (GC) of HAdV detected in air samples (GC/m3); reff (recovery efficiency) is the recoverable amount of HAdV acutally present in the sample, characterized by a triangular distribution with parameters 0.19, 0.403, 0.68 [21]; texp (exposure time) is the amount of time that the worker is exposed to bioaerosol (minutes), characterized by a uniform distribution on the range interval (from 0 to 100); fconv (conversion factor) is the ratio between tissue culture infective dose (TCID50) and GCs measured in TCID50/GC, with 1 TCID50 = 700 GC [22]; rin (inhalation rate) is the volume of air inhaled per unit of time (m3/hour), characterized by a log-normal distribution with a mean value of 1.40 and a standard deviation of 0.51 [23]; and c f is a constant conversion factor equal to hour/60 min.

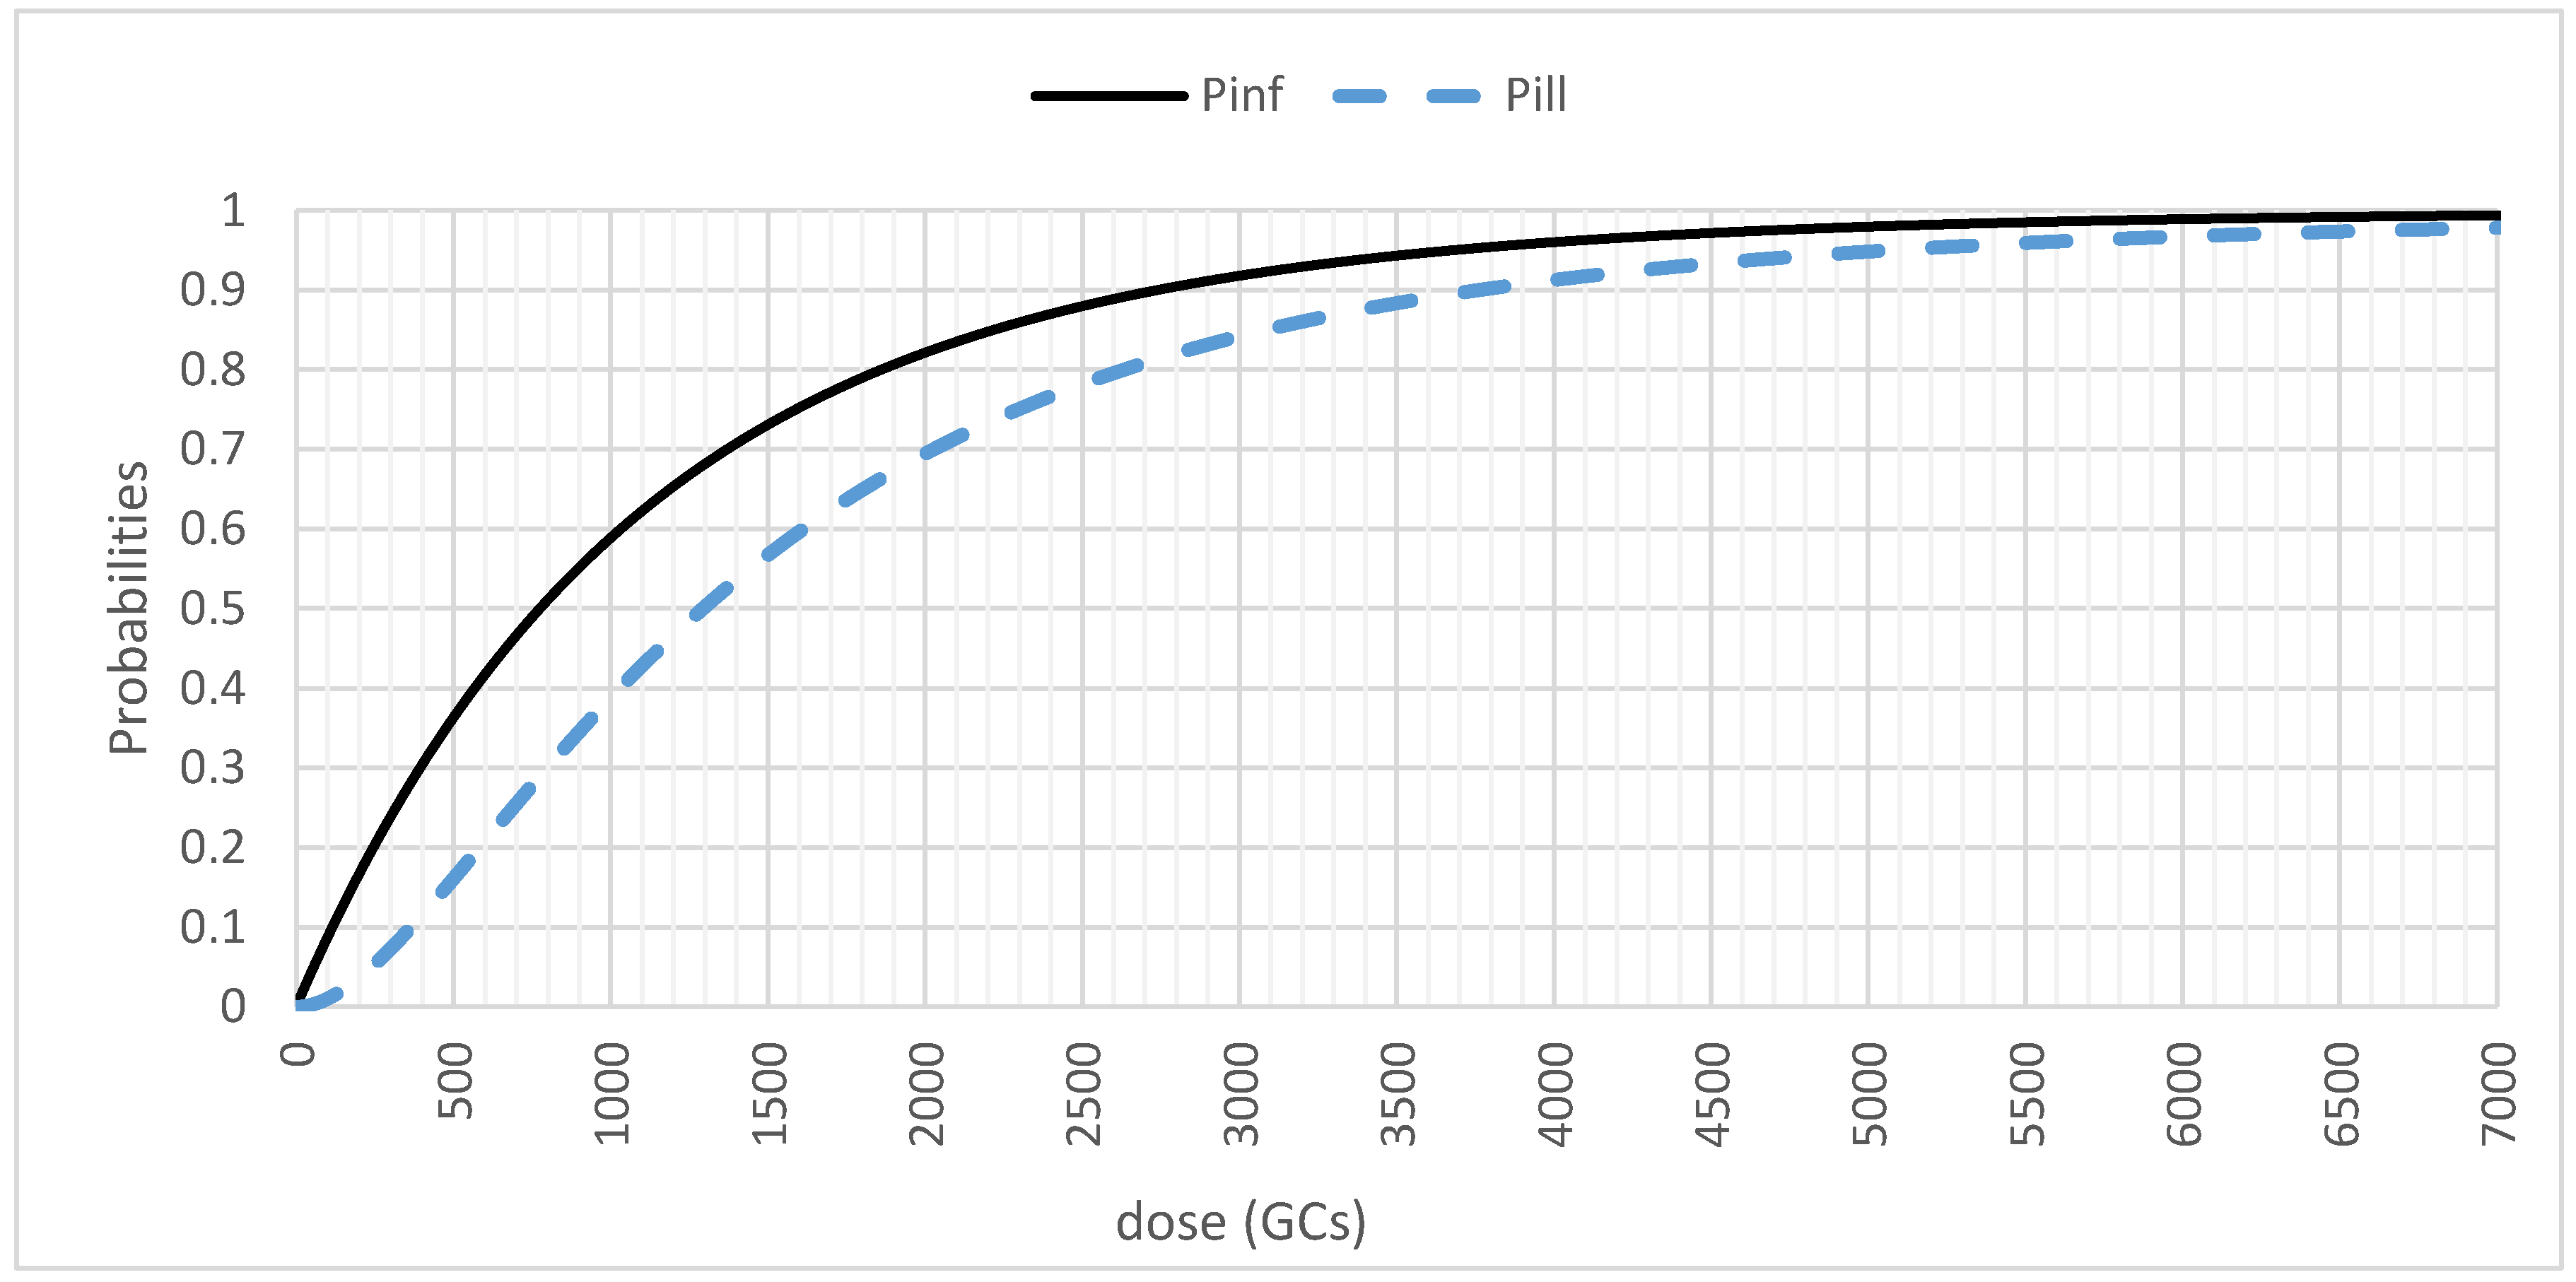
2.2. Dose–Response Assessment and Risk Characterization

We adopted the dose–response model recently developed by Teunis et al. [15] that combines dose–response data from human volunteer studies concerning three adenovirus types (AdV4, AdV7, AdV16) inoculated by four different pathways (oral ingestion, inhalation, intranasal, and intraocular droplet inoculation). In our work, we used dose–response parameters (α, β, η, r) that refer to the inhalation route. This is a QMRA approach that is not based on the direct measurement of illness cases (as for epidemiological studies) but on the measurement of pathogen dose with health effects that are inferred using known mathematical dose–response relationships.
Probability of infection (Pinf) is represented by Equation (2) where 1F1 denotes a confluent hypergeometric function of the first kind and where the heterogeneity in the host–pathogen interaction is considered. Equation (3) defines the dose–response relationship for the probability of acute symptoms in infected individuals or the conditional probability of illness, given infection (Pill/inf), that is, pathogenicity. Then, the unconditional probability of illness as a function of dose (Pill) is given [15]:
P i l l = P i n f × P i l l | i n f .
where, for the probability of infection, we have the following relation:
P i n f = 1 1   F 1   ( α ,   α + β ; d o s e )
In such a relation, we have the infectivity parameters for the adenovirus dose–response α = 5.24 and β = 2.95 measured in TCID50. On the other hand, for the conditional probability of illness, given infection, we have the following relation:
P i l l | i n f = 1 ( 1 + d o s e η ) r
In Relation (3), we have the pathogenicity parameters for the adenovirus dose–response η = 3.36 measured in TCID50 and r = 3.04 dimensionless.

2.3. Model Implementation

We implemented the models with the Vensim® simulation software [24]. In the models, we set up Relations (1), (2), and (3) together with all the other relevant mathematical relations, for instance, those for the simulation of the concentrations of HAdV in the various areas and the implementation of the hypergeometric functions. On the various models, we performed a simulation for each distribution and for its average value for 6000 iterations. We selected such a value since we assumed it was high enough to allow the appreciation of the trends of the various probability functions (2) and (3). Afterward, a simple univariate sensitivity analysis [25] was performed on three inputs parameters—inhalation rate, recovery efficiency, and concentration of HAdV—in order to understand the importance of each of them on the model output (Pill). The value of each parameter was varied, one at a time, along with the uncertainty range of that parameter in order to determine the effect on the final risk estimate. Moreover, the QMRA model was used in order to estimate, for each exposure scenario, the thresholds exposure times for each area to reach four different levels of probability of illness Pill = 10−5, 10−4, 10−3, 10−2. The exposure scenarios were different areas of the WWTP, characterized by different probability distributions of the concentration of HAdV or its average value, that were used in the dose calculation (see Relation (1)). Finally, the values of the concentrations needed to attain the same levels of probability of illness after 3 min of exposure were estimated. These results can be useful to select the best prevention measures for workers: reduction of exposure time, reduction of environmental contamination, or use of respiratory protective equipment (RPE).
All figures were generated with Excel for Windows (Microsoft Office Excel 2016, Redmond, Washington, DC, USA).

3. Results

In the considered WWTP, we found four areas, each one characterized by a different contamination level [17]. For each area, we obtained the following best-fitting distribution type of the concentration of HAdV (measured in GC/m3 and with μ denoting the average value and σ the standard deviation):
  • For the sewage influent, a lognormal distribution with µ = 7.7968 and σ = 1.5946;
  • For the biological oxidation tank, a lognormal distribution with µ = 7.4005 and σ = 1.7299;
  • For the sludge treatment, a uniform distribution in the range [306.67, 1664.9];
  • For the side-entrance manhole, a uniform distribution in the range [306.67, 1664.9]. With the side-entrance manhole, we refer to the area of access to the manholes for inspection operations.
We used these distributions as well as their average values in the models for the calculation of the dose (see Relation (1)).
In Figure 1, we present the relationships between the dose (in GCs) and the probabilities of infection (Pinf) and illness (Pill). We made the dose vary linearly from a minimum to a maximum value, calculated from previous simulations with real parameters. All of the other parameters were kept to their average values.
If we consider an exposure time of 100 min, in the four areas different doses were reached:
  • 60.45 TCID50 or 42,315 GC at the biological oxidation tank;
  • 72 TCID50 or 50,400 GC at the sewage entrance;
  • 8.15 TCID50 or 5705 GC at the sludge treatment;
  • 5.8 TCID50 or 4060 GC at the side entrance manhole.
Figure 2 shows the relationships between the probability of illness (Pill) and the exposure time (texp) for the four different areas of the WWTP. In environments with higher values of the concentration (i.e., sewage influent and biological oxidation tank), the probability of illness follows a six-grade polynomial trend line with a very good reliability (R2 = 0.92). Otherwise, with lower values of the concentration, the probability of illness follows an almost linear trend line (with R2 = 0.74 for sludge treatment and R2 = 0.70 for side entrance manhole).
In Figure 3, the probability of illness Pill is represented according to different values of the parameter texp in the four WWTP areas. For an interval of time from 0 to 3 min, the average risk values were equal to 14.64%, 12.73%, 1.13%, and 0.7%, respectively, for sewage influent, biological oxidation tank, sludge treatment, and side entrance manhole areas. For the next time intervals (from 3 to 5, from 5 to 10, and from 10 to 15 min), the average risk values increase, as well as their variability in terms of interquartile range, much more for the most contaminated areas.

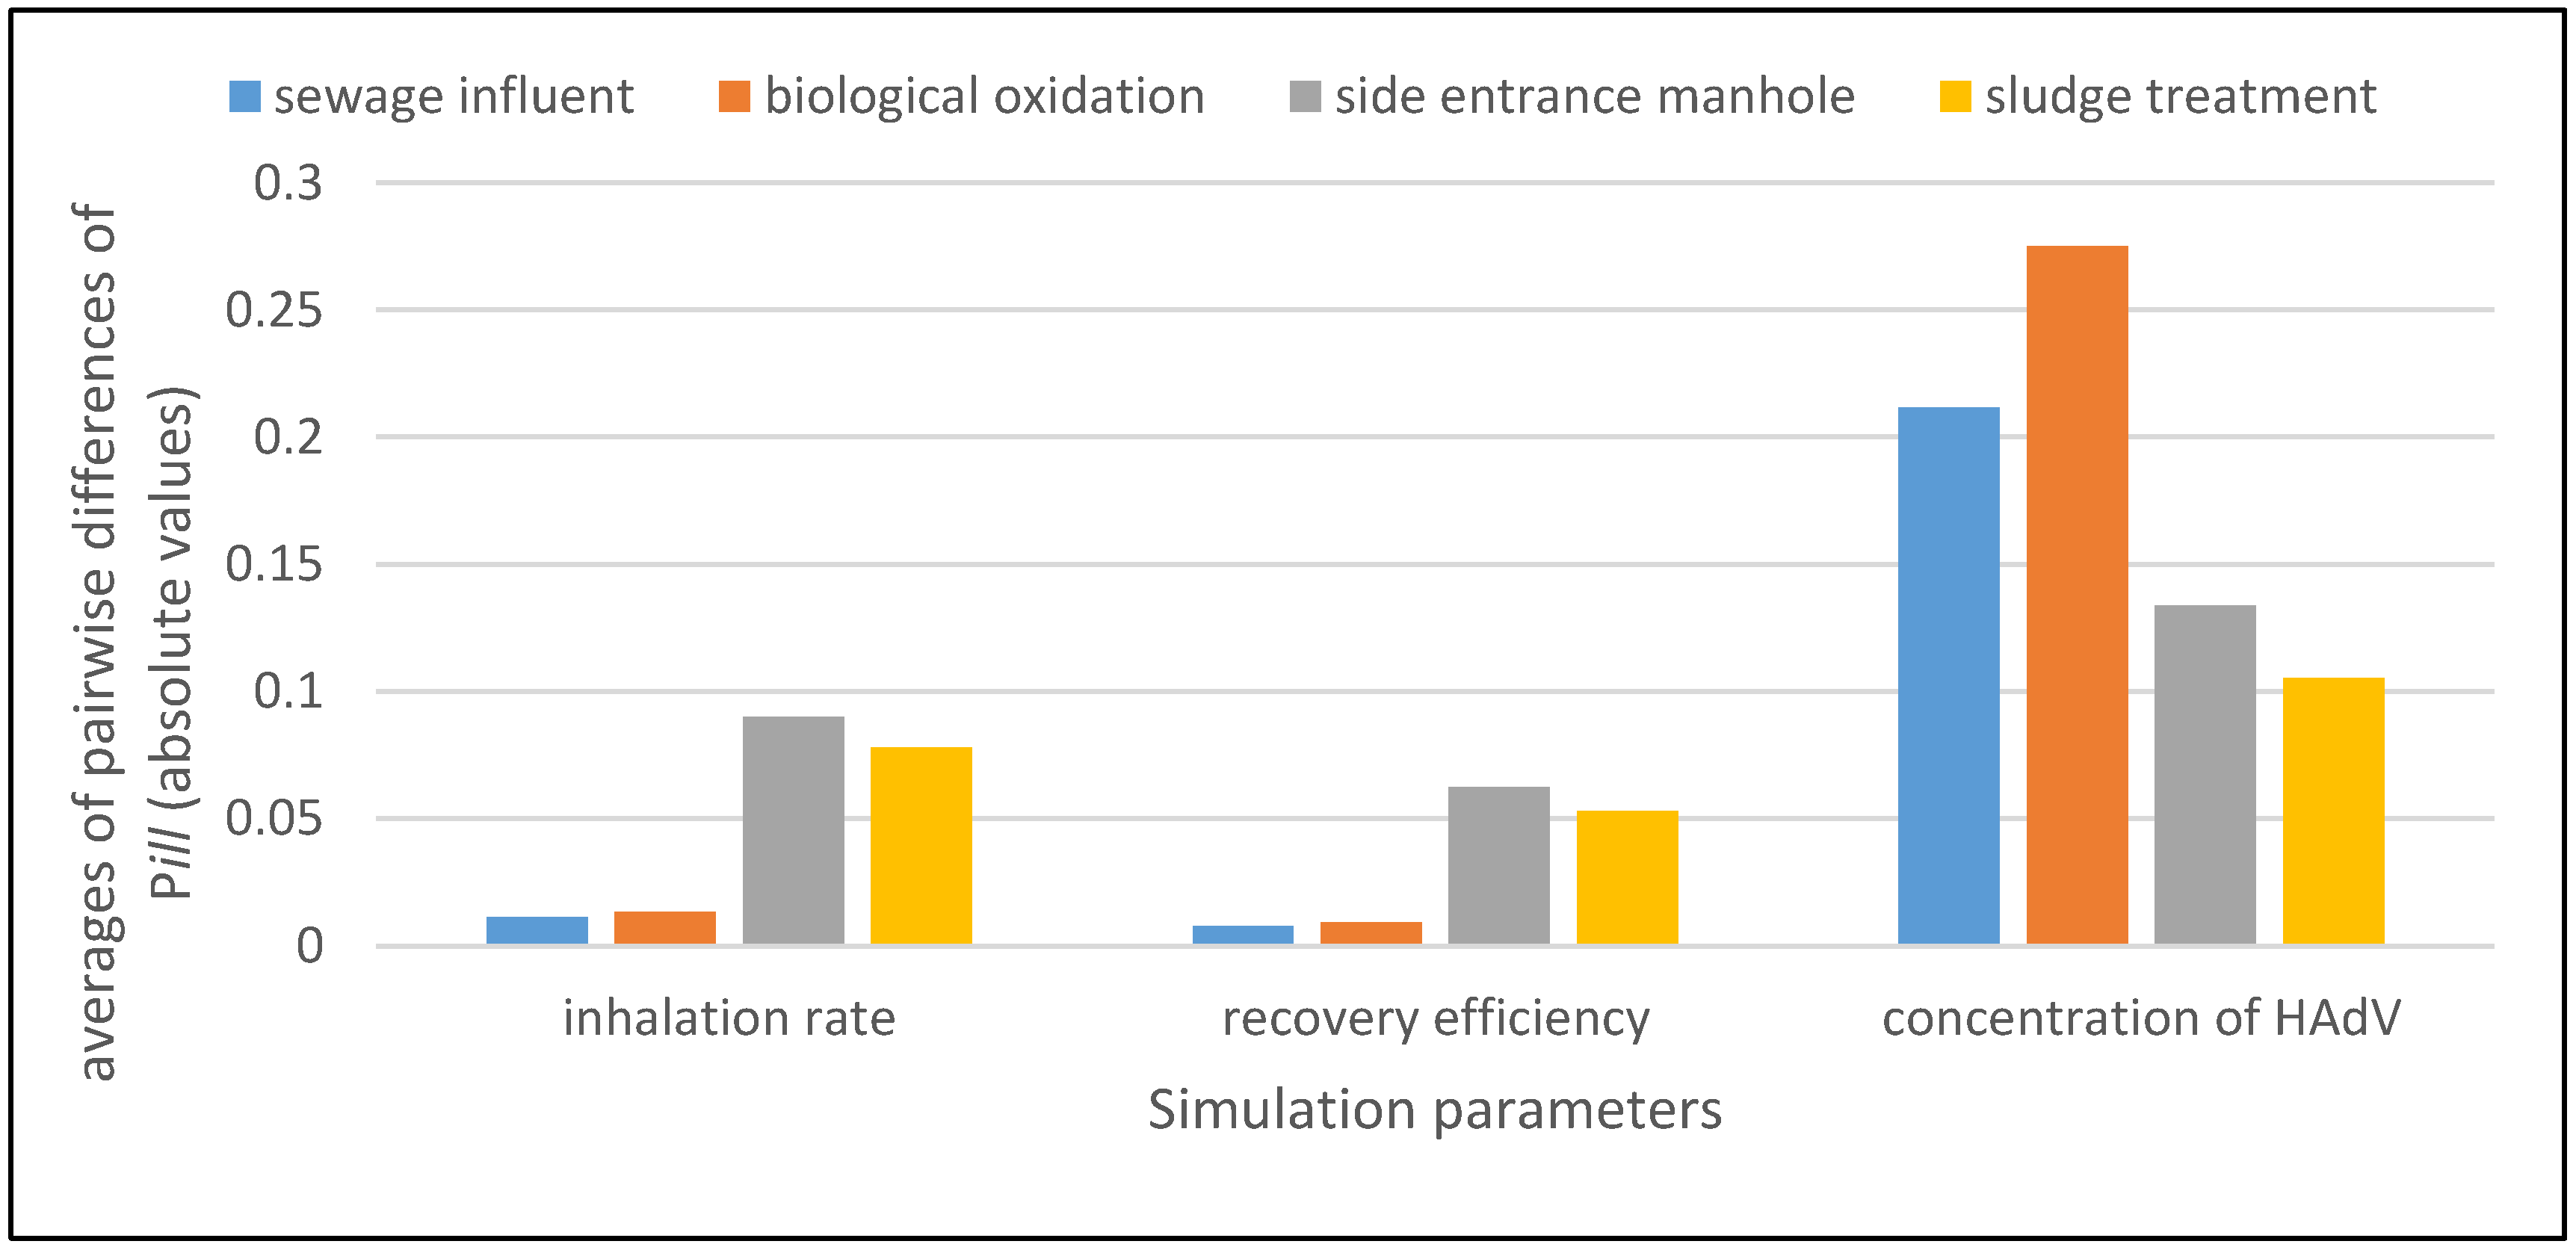
3.1. Sensitivity Analysis

Figure 4 shows, for each parameter (on the x axis) in each occupational environment (in the legend above the histogram), the averages (on the y axis) of the absolute values of the pairwise differences of the values of the model output Pill between the case where all the parameters (i.e., inhalation rate, recovery efficiency, and concentration of HAdV) are held at a constant value, and the case where only one of them is varied at a time according to its assumed probability distribution (through which we model either an uncertainty or a variability). The used probability distributions are as follows: log-normal distribution for inhalation rate, triangular distribution for recovery efficiency (see after Relation (1)), and HAdV distribution proper for each working setting.
It is evident how the parameter Pill is most sensitive to variations of the parameter CHAdV.

3.2. Application of Quantitative Microbial Risk Assessment to Support Risk Management

QMRA models were used to try to estimate the exposure thresholds, that are the upper limits of CHAdV for the areas of WWTPs, corresponding to four probabilities of illness (Pill = 10−2, 10−3, 10−4 and 10−5). The same risk levels, represented in Figure 5 by four iso-probability curves, can be obtained from a different combination of exposure time (texp) and CHAdV according to the following relation:
texp × CHAdV = k(Pill)
where k(Pill) is a constant that takes higher values the higher the value is of Pill.
We defined a dose value for each Pill threshold (10−2, 10−3, 10−4, 10−5), based on a simulation for sewage influent, chosen as an example. Then, k(Pill) was rewritten as relation (1) as follows:
k(Pill) = dose × reff/(fconv × rin × cf).
Finally, CHAdV was calculated from Equation (4) using k(Pill) from Equation (5) and varying texp from 1 to 31 min.
It is clear that in every iso-probability curve, for a fixed value of the Pill, the CHAdV decreased gradually with the increase of the exposure time texp and vice versa.
Figure 5 represents the exposure curve for a general scenario. In Figure 5, we show also two examples of threshold values (threshold1 = 100 GC/m3 and threshold2 = 500 GC/m3) that can be used in order to identify a critical value of the exposure time for each defined level of risk as a predefined value of Pill. For threshold1, we have about 2 min for a level of risk of 10−4, about 5 min for a level of risk of 10−3, and about 17 min for a level of risk of 10−2. For threshold2, we have about 1 min and 4 min, respectively, for the levels of risk of 10−3 and 10−2.
Through the use of QMRA models, it has been possible to determine the maximum values of the exposure time texp during which the workers can stay in an area with a CHAdV of 100 GC/m3 without using RPE to maintain the risk below the different threshold values of Pill (10−2, 10−3, 10−4, and 10−5). For the sewage influent, the theoretical exposure times would be equal to 12 s, 4 s, 1.5 s, and 0 s, respectively. For the biological oxidation tank, the exposure times would be equal to 14 s, 4 s, 1.4 s, and 0 s, respectively. Then, in these first areas, the workers should always wear an RPE. For the sludge treatment, the exposure times would be 1.72 min, 31 s, 10 s, and 3 s, respectively, and for the side-entrance manhole, the exposure times would be 2.25 min, 44 s, 14 s, and 4 s. Again, also in these areas, the workers should always wear an RPE.
Analogously, for a fixed exposure time, it is possible to estimate from Figure 5 the upper limits for the parameter CHAdV: For example, for 3 min of exposure in any working area, the thresholds in CHAdV could be estimated at 6, 54, 170, and 565 GC/m3, respectively, for Pill = 10−5, 10−4, 10−3, and 10−2.

4. Discussion

In the present study, QMRA analyses showed a high-risk of illness for wastewater workers posed by exposure to bioaerosol, confirming the findings of the existing epidemiological studies about the association between employment in sewage treatment plants and work-related adverse health effects [26,27]. As expected, the risk was higher for the most contaminated areas and increased with the exposure time, but the advantage of using the model was the possibility of calculating more precisely the risk values corresponding to different combinations of contamination and times and comparing them with definite risk levels. Therefore, the application of QMRA provides a quantitative basis for the decision-making process in occupational risk management. Concretely, the variables that can be controlled from a risk management perspective are the exposure time and the concentration of biologic agents in the different areas of the WWTPs. QMRA models could be used to determine the times of exposure corresponding to various levels of risk and then to identify when the use of specific RPE becomes necessary. In addition, the identification of high-risk areas for workers could be useful to establish when to reduce bioaerosol emissions and dispersion, with interventions such as ventilation [28], disinfection treatments, or the coverage or change of the aeration systems used in the biological treatment. The models could also be used to select the most suitable RPE considering its efficiency of protection [29].
At present, QMRA is rarely applied to occupational airborne exposure and mainly limited to farmers involved in land application of biosolids or manures [30,31,32]. In the present work, QMRA is included in occupational risk management in order to prioritize and define the control measures needed to reduce the risks below established limits. To the best of our knowledge, this approach has never been applied before to workplaces, but it could be very useful for occupational hygiene, where biological risk assessment is usually carried out in a qualitative or semiquantitative way [33].
Another aim of this study was the formulation and the setting of a general model for risk characterization that could be implemented in different working settings. This approach could represent an innovation in the context of occupational risk management for biological hazards because precise risk assessment allows for the design and prioritization of interventions and control measures. In this way, it would be possible to define accurately the biologic risk factors in order to perform the proper evaluation and the subsequent management of risk through the tuning of both individual and collective safety measures (through an accurate choice and use, for instance, of individual protection devices for a given type of risk). Therefore, QMRA provides a risk analyst with quantitative information to better manage worker safety in various occupational settings as a complement to the existing guidance and laws, taking into account technological innovations and the current scientific knowledge.
At present, there are no occupational exposure limits (OELs) for biological agents [34], which impedes decision making for the implementation of strategies for biological risk management in workplaces. The use of QMRA models could be extremely useful to aid the determination of the OELs based on an acceptable level of risk. Nevertheless, the current EU directive [7] does not consider this possibility because an acceptable level of risk is not defined and the risk assessment is based only on the “potential” exposure and on the adopted preventive measures.
Although the QMRA approach would be extremely promising in work settings, it is affected by some limitations and requires further study. Firstly, the identification of the index pathogen to be used remains a crucial point. In fact, bioaerosol contains a high number of different microorganisms [35] and it is not feasible to apply QMRA models to each of them. In our study, we used HAdV, but the same methodology could be applied to other microorganisms, depending on their epidemiological importance and provided that dose–response curves are known. Moreover, a multipathogen risk assessment could be performed, as is already done in other settings (i.e., recreational waters [36,37,38]).
Secondly, the values of pathogen concentrations are difficult to obtain in routine monitoring, in which, generally, total bacterial count (TBC) or fecal indicator bacterial (FIB) are measured. Then, it would be very practical to use these parameters in order to estimate the pathogen concentrations, but this would imply the knowledge of relations between them, which is obtainable only with specific monitoring studies. The adoption of a pathogen:indicator ratio introduces a further element of uncertainty in the QMRA model inputs, but it has been reported in the current WHO guidelines for QMRA [39] and has been employed by many authors for the estimation of health risks from exposure to recreational waters [40,41] or wastewater reuse [42,43].
Even if pathogens are directly detected, the most used analytical methods to this aim are the biomolecular ones that generally do not allow for the estimation of infectivity. Then, the relations between genomic copies and infective particles should be determined with specific studies.
Moreover, occupational exposure via inhalation to airborne microorganisms is responsible for both respiratory and enteric symptoms, owing to swallowing of mucous. To take into account gastrointestinal outcomes, the QMRA model should differentiate the HAdV dose through different exposure routes [44], using specific model parameters for ingestion and inhalation. These additional enteric illness cases should be considered in future research developments.
Finally, other features should be considered for more precise risk assessment, such as the differences among workers based on gender, age, health condition, and immunity.
Moreover, in our model, deposition efficiency of aerosols in the respiratory tract was not included in the calculation of pathogen dose, assuming that all airborne viruses in aerosol droplets are small enough to be deposited on the bronchial and alveolar region. This aspect should be considered, as reported by Lim et al. [45], in a QMRA study on harvested urban stormwaters for domestic applications.
In fact, our results showed an important level of risk for illness compared to epidemiological studies because our QMRA model explored the health risk of sewage workers at the individual level without considering immunity, which could be responsible for variability in health outcomes.
Furthermore, epidemiological studies on sewage workers exposed to bioaerosols are few and contradictory regarding the association between cases of illness and occupational exposure [46,47] because pathogens in sewage are widespread, especially in the case of adenovirus. However, serological studies in WWTPs have demonstrated that workers became rapidly immune to most of the pathogens after the first several months of employment, thus explaining the decrease in symptoms in the experienced workers [47]. Nevertheless, surveys performed in the past few years did not confirm occupational risk among sewage workers [48] because of the routine adoption of preventive measures which lower the real risk due to the reduction of the inhaled dose, thus determining the absence of significant differences in seropositivity toward pathogens among workers and general population. However, the presence of adenovirus in sewage pollution is widely documented, both in wastewaters and aerosol generated during sewage treatment [49,50,51,52]. In our work, adenovirus was chosen as the index pathogen owing to its abundance in sewage, persistence in the environment, and potential infectivity, which allowed us to make a conservative estimation of other pathogens levels in the environment.

5. Conclusions

The further design and proper application of QMRA models to bioaerosol exposure for occupational prevention will require a wide range of studies on methods, epidemiology, and monitoring to overcome limitations and to allow for more precise assessment. Future development of the QMRA model for occupational purposes should consider the difference in dose–response relationships based on gender or immunological status and also the deposition efficiency of aerosols in the respiratory tract in consideration of the inhalation route.

Author Contributions

A.C. conceived and supervised the theoretical basis of the study. G.D. mainly performed the study. L.C. designed the models with Vensim® PLE Plus and performed the simulations obtaining the data for the following statistical analysis. I.F. conducted statistical analysis, acquired the data of the concentrations, and defined the parameters for the statistical distributions. R.L. and M.V. reviewed and revised the manuscript. All authors made critical revisions to the manuscript.

Conflicts of Interest

The authors declare no conflict of interest.

References

  1. Douwes, J.; Thorne, P.; Pearce, N.; Heederik, D. Bioaerosol health effects and exposure assessment: Progress and prospects. Ann. Occup. Hyg. 2003, 47, 187–200. [Google Scholar] [PubMed]
  2. Corrao, C.; Mazzotta, A.; La Torre, G.; De Giusti, M. Biological risk and occupational health. Ind. Health 2012, 50, 326–337. [Google Scholar] [CrossRef] [PubMed]
  3. Sykes, P.; Morris, R.H.; Allen, J.A.; Wilsmith, J.D.; Jones, K.P. Workers’ exposure to dust, endotoxin and beta-(1-3) glucan at four large scale composting facilities. Waste Manag. 2011, 31, 423–430. [Google Scholar] [CrossRef] [PubMed]
  4. Neumann, H.D.; Balfanz, J.; Becker, G.; Lohmeyer, M.; Mathys, W.; Raulf-Heimsoth, M. Bioaerosol exposure during refuse collection: Results of field studies in the real-life situation. Sci. Total Environ. 2002, 293, 219–231. [Google Scholar] [CrossRef]
  5. Carducci, A.; Federigi, I.; Verani, M. Virus occupational exposure in solid waste processing facilities. Ann. Occup. Hyg. 2013, 57, 1115–1127. [Google Scholar] [PubMed]
  6. Vimercati, L.; Baldassarre, A.; Gatti, M.F.; De Maria, L.; Caputi, A.; Dirodi, A.A.; Cuccaro, F.; Bellino, R.M. Respiratory health in waste collection and disposal workers. Int. J. Environ. Res. Public Health 2016, 13, 631. [Google Scholar] [CrossRef] [PubMed]
  7. European Commission. Directive 2000/54/EC of the European Parliament and of the Council of 18 September 2000 on the Protection of Workers from Risks Related to Exposure to Biological Agents at Work (Seventh Individual Directive within the Meaning of Article 16(1) of Directive. Available online: http://eur-lex.europa.eu/legal-content/EN/TXT/PDF/?uri=CELEX:32000L0054&from=EN (accessed on 4 January 2018).
  8. European Agency for Safety and Health at Work. E-fact 53: Risk Assessment for Biological Agents. Available online: https://osha.europa.eu/en/tools-and-publications/publications/e-facts/efact53/view (accessed on 4 January 2018).
  9. European Agency for Safety and Health at Work. Report—Expert Forecast on Emerging Biological Risks Related to Occupational Safety and Health. Available online: https://osha.europa.eu/it/tools-and-publications/publications/reports/7606488 (accessed on 4 January 2018).
  10. World Health Organization. Quantitative Microbial Risk Assessment: Application for Water Safety Management. Available online: http://www.who.int/water_sanitation_health/publications/qmra/en/ (accessed on 4 January 2018).
  11. Pang, H.; Lambertini, E.; Buchanan, R.; Schaffner, D. Quantitative microbial risk assessment for Escherichia coli O157:H7 in fresh-cut lettuce. J. Food Prot. 2017, 80, 302–311. [Google Scholar] [CrossRef] [PubMed]
  12. Dong, Q.; Barker, G.; Gorris, L.; Tian, M.; Song, X.; Malakar, P. Status and future of quantitative microbiological risk assessment in China. Trends Food Sci. Technol. 2015, 42, 70–80. [Google Scholar] [CrossRef] [PubMed]
  13. Carducci, A.; Donzelli, G.; Cioni, L.; Verani, M. Quantitative microbial risk assessment in occupational settings applied to the airborne human adenovirus infection. Int. J. Environ. Res. Public Health 2016, 13, 733. [Google Scholar] [CrossRef] [PubMed]
  14. World Health Organization (WHO). Chapter 6—Viruses. In Water Recreation and Disease. Plausibility of Associated Infections: Acute Effects, Sequelae and Mortality; Pond, K., Ed.; IWA Publishing: London, UK, 2005; pp. 191–219. ISBN 9241563052. [Google Scholar]
  15. Teunis, P.; Schijven, J.; Rutjes, S. A generalized dose-response relationship for adenovirus infection and illness by exposure pathway. Epidemiol. Infect. 2016, 144, 3461–3473. [Google Scholar] [CrossRef] [PubMed]
  16. Allard, A.; Vantarakis, A. Adenoviruses. In Global Water Pathogens Project; Rose, J.B., Jiménez-Cisneros, B., Eds.; Michigan State University: East Lansing, MI, USA, 2017; pp. 3–30. [Google Scholar]
  17. Carducci, A.; Morici, P.; Pizzi, F.; Battistini, R.; Rovini, E.; Verani, M. Study of the viral removal efficiency in an urban wastewater treatment plant. Water Sci. Technol. 2008, 58, 893–897. [Google Scholar] [CrossRef] [PubMed]
  18. Masclaux, F.; Hotz, P.; Gashi, D.; Savova-Bianchi, D.; Oppliger, A. Assessment of airborne virus contamination in wastewater treatment plants. Environ. Res. 2014, 133, 260–265. [Google Scholar] [CrossRef] [PubMed]
  19. Pascual, L.; Pérez-Luz, S.; Yàñez, M.; Santamarìa, A.; Gibert, K.; Salgot, M.; Apraiz, D.; Catalàn, V. Bioaerosol emission from wastewater treatment plant. Aerobiologia 2003, 19, 261–270. [Google Scholar] [CrossRef]
  20. Haas, C.; Rose, J.; Gerba, C. Risk assessment paradigms. In Quantitative Microbial Risk Assessment, 2nd ed.; John Wiley & Sons, Inc.: Hoboken, NJ, USA, 2014; pp. 63–89. ISBN 9781118145296. [Google Scholar]
  21. Carducci, A.; Arrighi, S.; Ruschi, A. Detection of coliphages and enteroviruses in sewage and aerosol from an activated sludge wastewater treatment plant. Lett. Appl. Microbiol. 1995, 21, 207–209. [Google Scholar] [CrossRef] [PubMed]
  22. McBride, G.; Stott, R.; Miller, W.; Bambic, D.; Wuertz, S. Discharge-based QMRA for estimation of public health risks from exposure to stormwater-borne pathogens in recreational waters in the United States. Water Res. 2013, 47, 5282–5297. [Google Scholar] [CrossRef] [PubMed]
  23. U.S. Environmental Protection Agency. Exposure Factors Handbook: Chapter 6—Inhalation Rates. 2011. Available online: https://cfpub.epa.gov/ncea/risk/recordisplay.cfm?deid=236252 (accessed on 4 January 2018).
  24. Ventana Systems, Inc. User Guide—Vensim Introduction & Tutorials. Available online: https://www.vensim.com/documentation/index.html?users_guide.htm (accessed on 4 January 2018).
  25. Gan, Y.; Duan, Q.; Gong, W.; Tong, C.; Sun, Y.; Chu, W.; Ye, A.; Miao, C.; Di, Z. A comprehensive evaluation of various sensitivity analysis methods: A case study with a hydrological model. Environ. Model. Softw. 2014, 51, 269–285. [Google Scholar] [CrossRef]
  26. Thorn, J.; Kerekes, E. Health effects among employees in sewage treatment plants: A literature survey. Am. J. Ind. Med. 2001, 40, 170–179. [Google Scholar] [CrossRef] [PubMed]
  27. Douwes, J.; Mannetje, A.; Heederik, D. Work-related symptoms in sewage treatment workers. Ann. Agric. Environ. Med. 2001, 8, 39–45. [Google Scholar] [PubMed]
  28. Guo, X.; Wu, P.; Ding, W.; Zhang, W.; Li, L. Reduction and characterization of bioaerosols in a wastewater treatment station via ventilation. J. Environ. Sci. 2014, 26, 1575–1583. [Google Scholar] [CrossRef] [PubMed] [Green Version]
  29. Lavoie, J.; Cloutier, Y.; Lara, J.; Marchand, G. Guide on Respiratory Protection Against Bioaerosols—Recommendations on Its Selection and Use; Technical Guide RG-501.IRSST—Chemical Substances and Biological Agents, Studies and Research Project; IRSST Communications Division: Montréal, QC, USA, 2007; Available online: http://www.irsst.qc.ca/media/documents/PubIRSST/RG-501.pdf (accessed on 10 January 2018).
  30. Tanner, B.D.; Brooks, J.P.; Gerba, C.P.; Haas, C.N.; Josephson, K.L.; Pepper, I.L. Estimated occupational risk from bioaerosols generated during land application of Class B biosolids. J. Environ. Qual. 2008, 37, 2311–2321. [Google Scholar] [CrossRef] [PubMed]
  31. Brooks, J.P.; McLaughlin, M.R.; Gerba, C.P.; Pepper, I.L. Land application of manure and Class B biosolids: An occupational and public quantitative microbial risk assessment. J. Environ. Qual. 2012, 41, 2009–2023. [Google Scholar] [CrossRef] [PubMed]
  32. Jahne, M.A.; Rogers, S.A.; Holsen, T.M.; Grimberg, S.J. Quantitative microbial risk assessment of bioaerosols from a manure application site. Aerobiologia 2015, 31, 73–87. [Google Scholar] [CrossRef]
  33. Carducci, A.; Tozzi, E.; Rubulotta, E.; Casini, B.; Cantiani, L.; Muscillo, M. Assessing airborne biological hazard from urban wastewater treatment. Water Res. 2000, 34, 1173–1178. [Google Scholar] [CrossRef]
  34. Vieira, C.; Baptista, J. Bioaerosol in hospital environment: A short review. In Occupational Safety and Hygiene II; Arezes, P., Baptista, J.S., Barroso, M.P., Carneiro, P., Cordeiro, P., Costa, N., Melo, R.B., Miguel, S.A., Perestrelo, G., Eds.; CRC Press: London, UK, 2014; Chapter 22; ISBN 9781138001442. [Google Scholar]
  35. Karra, S.; Katsivela, E. Microorganisms in bioaerosol emissions from wastewater treatment plants during summer at a Mediterranean site. Water Res. 2007, 41, 1355–1365. [Google Scholar] [CrossRef] [PubMed]
  36. Chigor, V.; Sibanda, T.; Okoh, A. Assessment of the risks for human health of adenoviruses, hepatitis A virus, rotaviruses and enteroviruses in the Buffalo River and three source water dams in the Eastern Cape. Food Environ. Virol. 2014, 6, 87–98. [Google Scholar] [CrossRef] [PubMed]
  37. Corsi, S.; Borchardt, M.; Carvin, R.; Burch, T.; Spencer, S.; Lutz, M.; McDermott, C.; Busse, K.; Kleinheinz, G.; Feng, X.; et al. Human and bovine viruses and bacteria at three great lakes beaches: Environmental variable associations and health risk. Environ. Sci. Technol. 2016, 50, 987–995. [Google Scholar] [CrossRef] [PubMed]
  38. Cui, Q.; Fang, T.; Huang, Y.; Dong, P.; Wang, W. Evaluation of bacterial pathogen diversity, abundance and health risks in urban recreational water by amplicon next-generation sequencing and quantitative PCR. J. Environ. Sci. 2017, 57, 137–149. [Google Scholar] [CrossRef] [PubMed]
  39. WHO. Quantitative Microbial Risk Assessment: Application for Water Safety Management; World Health Organization: Geneva, Switzerland, 2016. [Google Scholar]
  40. Eregno, F.E.; Tryland, I.; Tjomsland, T.; Myrmel, M.; Robertson, L.; Heistad, A. Quantitative microbial risk assessment combined with hydrodynamic modelling to estimate the public health risk associated with bathing after rainfall events. Sci. Total Environ. 2016, 548–549, 270–279. [Google Scholar] [CrossRef] [PubMed]
  41. Fuhrimann, S.; Winkler, M.; Stalder, M.; Niwagaba, C.; Babu, M.; Kabatereine, N.; Halage, A.; Utzinger, J.; Cissé, G.; Nauta, M. Disease burden due to gastrointestinal pathogens in a wastewater system in Kampala, Uganda. Microb. Risk Anal. 2016, 4, 16–28. [Google Scholar] [CrossRef] [Green Version]
  42. Seidu, R.; Heistad, A.; Amoah, P.; Drechsel, P.; Jenssen, P.D.; Stenström, T.A. Quantification of the health risk associated with wastewater reuse in Accra, Ghana: A contribution toward local guidelines. J. Water Health 2008, 6, 461–471. [Google Scholar] [CrossRef] [PubMed]
  43. Mara, D.; Sleigh, A. Estimation of norovirus infection risks to consumers of wastewater-irrigated food crops eaten raw. J. Water Health 2008, 8, 39–43. [Google Scholar] [CrossRef] [PubMed]
  44. Stellacci, P.; Liberti, L.; Notarnicola, M.; Haas, C.N. Hygienic sustainability of site location of wastewater treatment plants. A case study. II. Estimating airborne biological hazard. Desalination 2010, 253, 106–111. [Google Scholar] [CrossRef]
  45. Lim, K.Y.; Hamilton, A.J.; Jiang, S.C. Assessment of public health risk associated with viral contamination in harvested urban stormwater for domestic applications. Sci. Total Environ. 2015, 523, 95–108. [Google Scholar] [CrossRef] [PubMed]
  46. Clark, C.; Linnemann, C.; Gartside, P.; Phair, J.; Blacklow, N.; Zeiss, C. Serologic survey of rotavirus, norwalk agent and prototheca wickerhamii in wastewater workers. Am. J. Public Health 1985, 75, 83–85. [Google Scholar] [CrossRef] [PubMed]
  47. Cadilhac, P.; Roudot-Thoraval, F. Seroprevalence of hepatitis A virus infection among sewage workers. Eur. J. Epidemiol. 1996, 12, 237–240. [Google Scholar] [CrossRef] [PubMed]
  48. Montuori, P.; Negrone, M.; Cacace, G.; Triassi, M. Wastewater workers and hepatitis A virus infection. Occup. Med. 2009, 59, 506–508. [Google Scholar] [CrossRef] [PubMed] [Green Version]
  49. La Rosa, G.; Pourshaban, M.; Iaconelli, M.; Muscillo, M. Quantitative real-time PCR of enteric viruses in influent and effluent samples from wastewater treatment plants in Italy. Annali dell’Istituto Superiore di Sanita 2010, 46, 266–273. [Google Scholar] [PubMed]
  50. Carducci, A.; Verani, M. Effects of bacterial, chemical, physical and meteorological variables on virus removal by a wastewater treatment plant. Food Environ. Virol. 2013, 5, 69–76. [Google Scholar] [CrossRef] [PubMed]
  51. Masclaux, F.G.; Hotz, P.; Friedli, D.; Savova-Bianchi, D.; Oppliger, A. High occurrence of hepatitis E virus in samples from wastewater treatment plants in Switzerland and comparison with other enteric viruses. Water Res. 2013, 47, 5101–5109. [Google Scholar] [CrossRef] [PubMed] [Green Version]
  52. Myrmel, M.; Lange, H.; Rimstad, E. A 1-year quantitative survey of noro-, adeno-, human boca-, and hepatitis E viruses in raw and secondarily treated sewage from two plants in Norway. Food Environ. Virol. 2015, 7, 213–223. [Google Scholar] [CrossRef] [PubMed]
Figure 1. Infection (Pinf) and illness (Pill) probabilities (on a linear scale) as a function of the dose in genomic copies (GCs).
Ijerph 15 01490 g001
Figure 2. The probability of illness Pill as a function of the exposure time (texp) for each exposure event in the different areas over an interval of time long enough (50 min) in order to appreciate the trend lines. In the equations, y corresponds to the probability of illness and x to texp.
Ijerph 15 01490 g002
Figure 3. Probability of illness Pill (5th, 25th, 50th, 75th and 95th) in the considered work settings and for different exposure times: 0–3 min (a); 3–5 min (b); 5–10 min (c); 10–15 min (d).
Ijerph 15 01490 g003
Figure 4. Sensitivity analysis determines how a change in each input parameter (inhalation rate rin, recovery efficiency reff, and concentration of HAdV CHAdV) affects the change of the probability of illness.
Ijerph 15 01490 g004
Figure 5. Iso-probability illness curves obtained for different combinations of exposure time and concentration of HAdV (threshold1 and threshold2 are examples of HAdV concentrations).
Ijerph 15 01490 g005

