Performance of Osteoporosis Self-Assessment Tool (OST) in Predicting Osteoporosis—A Review


Abstract
1. Introduction
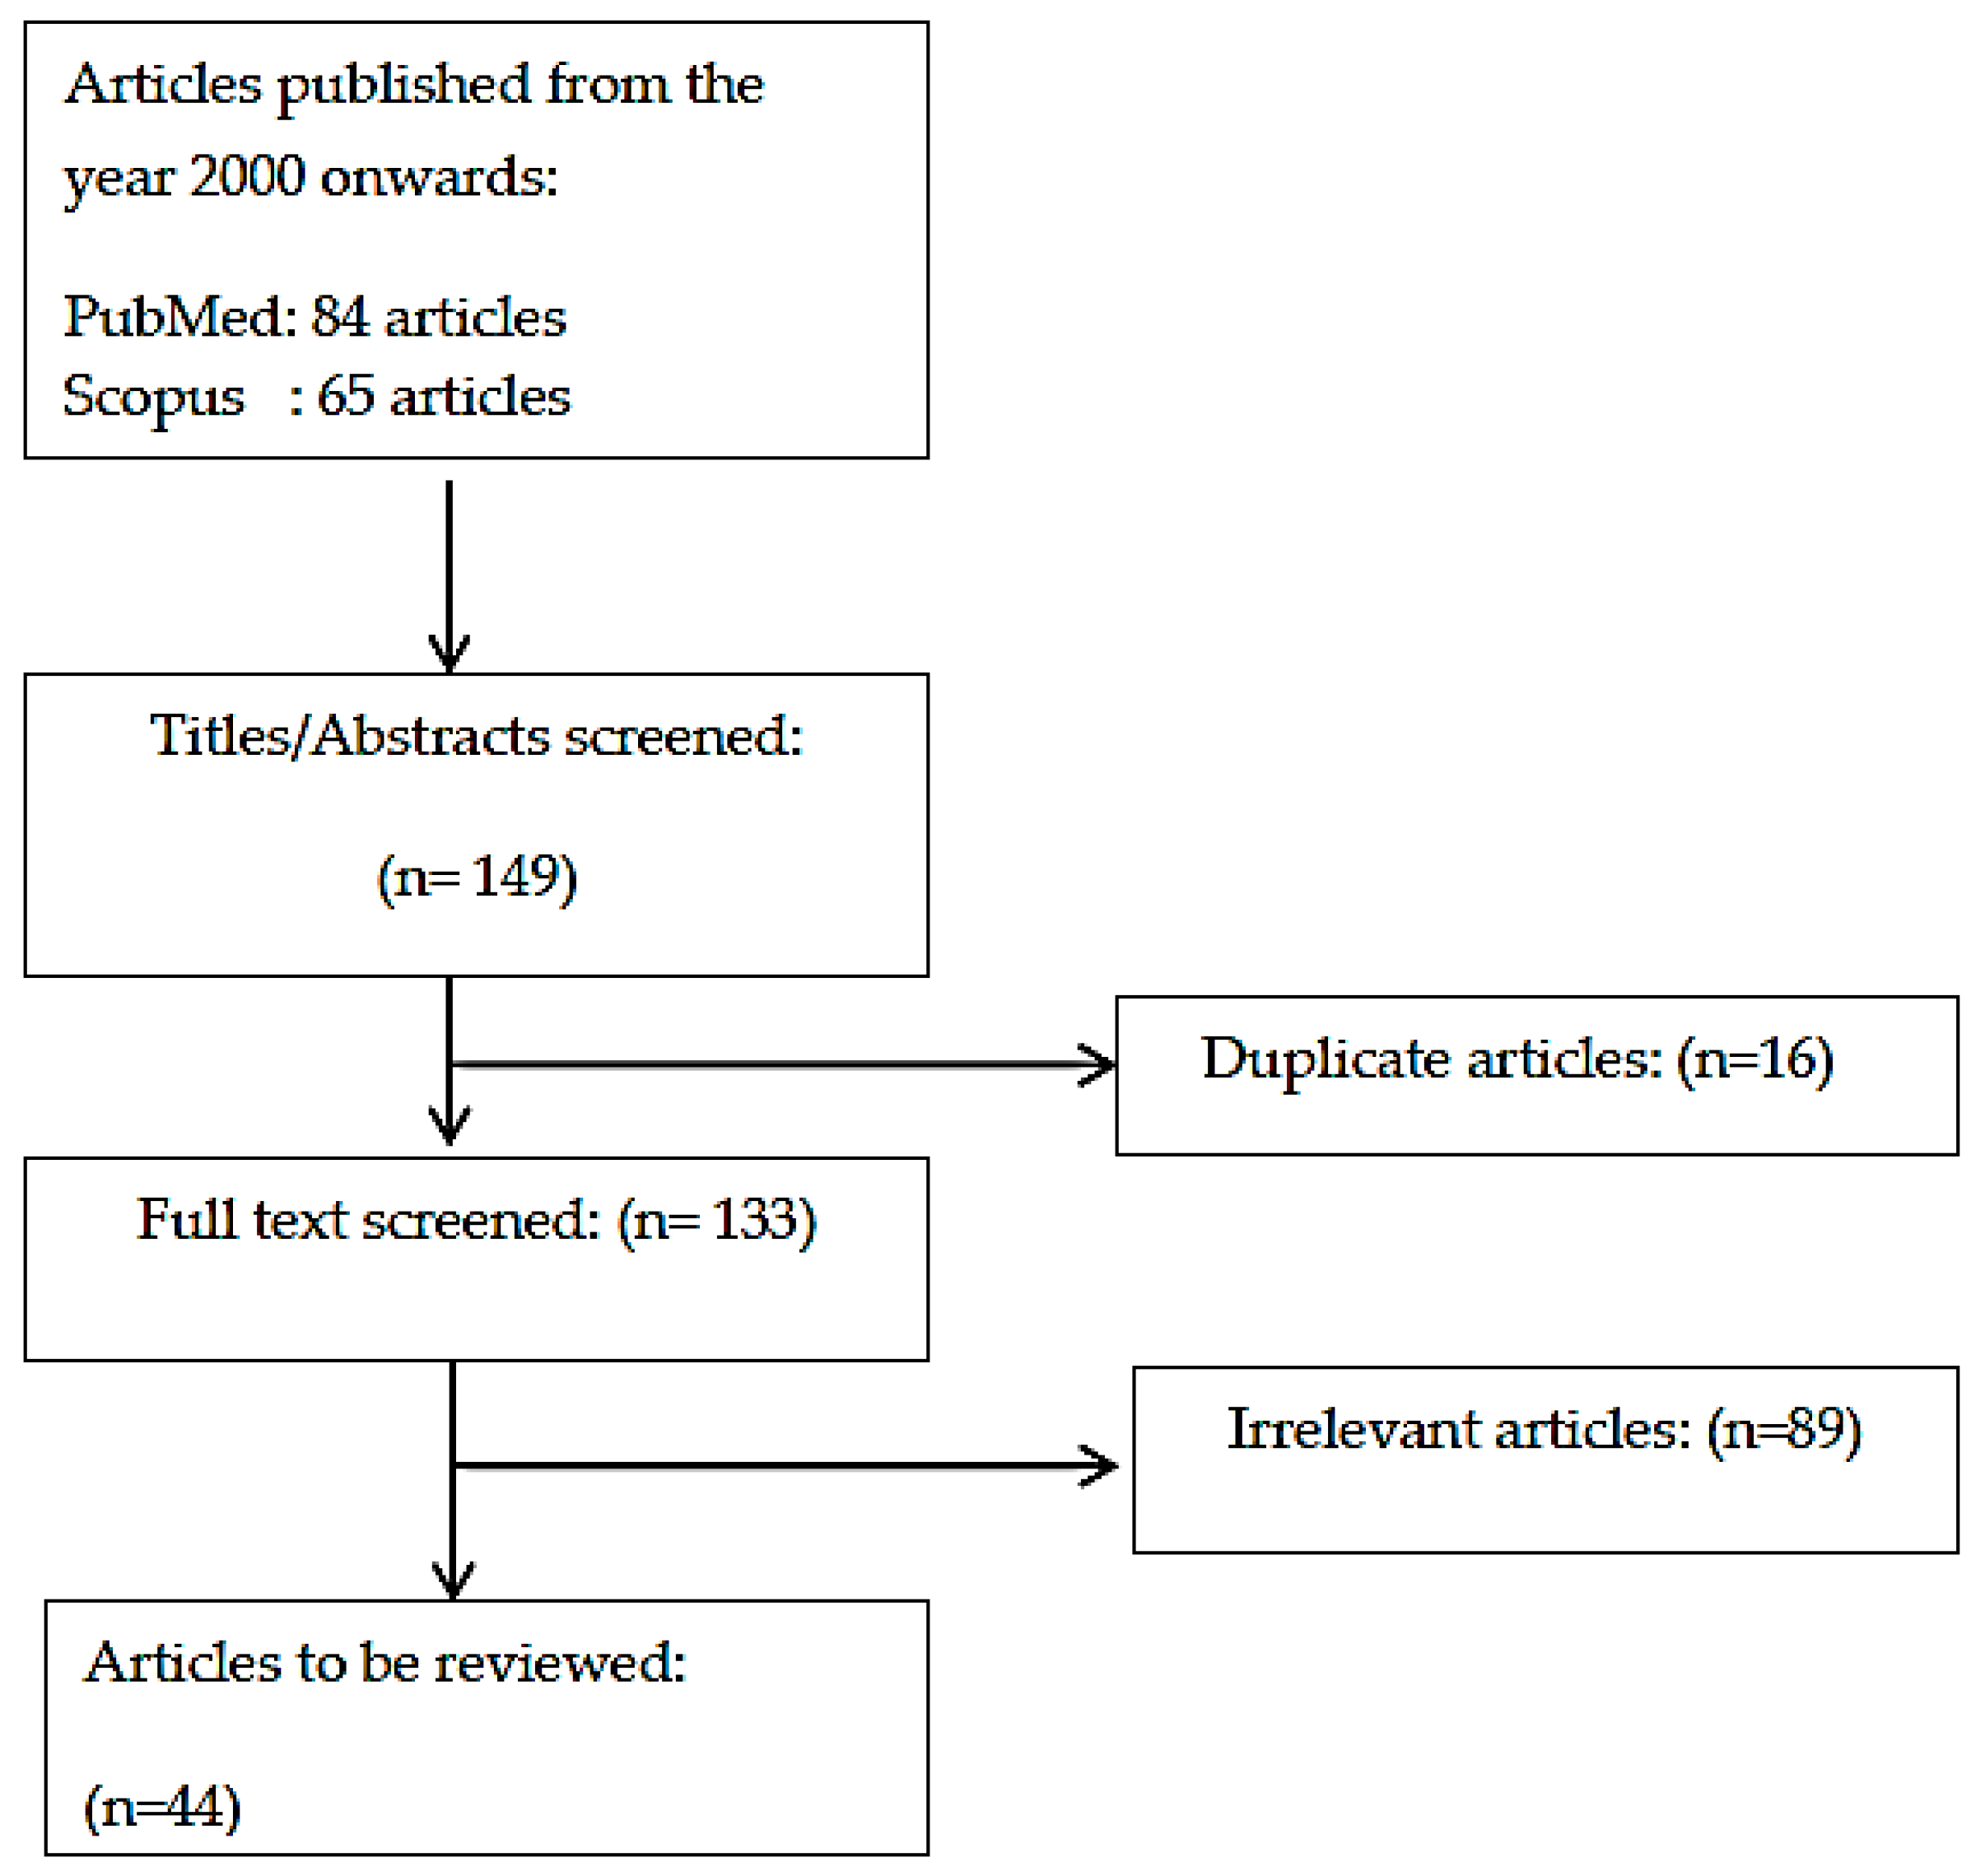
2. Literature Search
3. Performance of OST among Asians
3.1. Performance of OST among Asian Women
3.2. Performance of OST among Asian Men
3.3. Performance of OST with Modified Cutoff Values
3.4. Performance of OST in Comparison with Other Screening Tools
4. Performance of OST among Non-Asians
4.1. Performance of OST among Non-Asian Women
4.2. Performance of OST among Non-Asian Men
4.3. Performance of OST with Modified Cutoff Values
4.4. Performance of OST in Comparison with Other Screening Tools
5. OST for Fracture Prediction
6. Conclusions
Author Contributions
Funding
Conflicts of Interest
References
- Tao, B.; Liu, J.M.; Li, X.Y.; Wang, J.G.; Wang, W.Q.; Ning, G. An assessment of the use of quantitative ultrasound and the osteoporosis self-assessment tool for asians in determining the risk of nonvertebral fracture in postmenopausal chinese women. J. Bone Miner. Metab. 2008, 26, 60–65. [Google Scholar] [CrossRef] [PubMed]
- Cheung, C.-L.; Ang, S.B.; Chadha, M.; Chow, E.S.-L.; Chung, Y.-S.; Hew, F.L.; Jaisamrarn, U.; Ng, H.; Takeuchi, Y.; Wu, C.-H. An updated hip fracture projection in asia: The asian federation of osteoporosis societies study. Osteoporos. Sarcopenia 2018, 4, 16–21. [Google Scholar] [CrossRef]
- Oden, A.; McCloskey, E.V.; Kanis, J.A.; Harvey, N.C.; Johansson, H. Burden of high fracture probability worldwide: Secular increases 2010–2040. Osteoporos. Int. 2015, 26, 2243–2248. [Google Scholar] [CrossRef] [PubMed]
- Zha, X.Y.; Hu, Y.; Pang, X.N.; Chang, G.L.; Li, L. Diagnostic value of osteoporosis self-assessment tool for asians (osta) and quantitative bone ultrasound (qus) in detecting high-risk populations for osteoporosis among elderly chinese men. J. Bone Miner. Metab. 2015, 33, 230–238. [Google Scholar] [CrossRef] [PubMed]
- Mohd-Tahir, N.A.; Li, S.C. Economic burden of osteoporosis-related hip fracture in Asia: A systematic review. Osteoporos. Int. 2017, 28, 2035–2044. [Google Scholar] [CrossRef] [PubMed]
- World Health Organization. Assessment of Fracture Risk and Its Application to Screening for Postmenopausal Osteoporosis: Report of a Who Study Group [Meeting Held in Rome from 22 to 25 June 1992]; World Health Organization: Geneva, Switzerland, 1994. [Google Scholar]
- Chin, K.Y.; Ima-Nirwana, S. Calcaneal quantitative ultrasound as a determinant of bone health status: What properties of bone does it reflect? Int. J. Med. Sci. 2013, 10, 1778–1783. [Google Scholar] [CrossRef] [PubMed]
- Cherian, K.E.; Kapoor, N.; Shetty, S.; Naik, D.; Thomas, N.; Paul, T.V. Evaluation of different screening tools for predicting femoral neck osteoporosis in rural south indian postmenopausal women. J. Clin. Densitom. 2018, 21, 119–124. [Google Scholar] [CrossRef] [PubMed]
- Rubin, K.H.; Friis-Holmberg, T.; Hermann, A.P.; Abrahamsen, B.; Brixen, K. Risk assessment tools to identify women with increased risk of osteoporotic fracture: Complexity or simplicity? A systematic review. J. Bone Miner. Res. 2013, 28, 1701–1717. [Google Scholar] [CrossRef] [PubMed]
- Richy, F.; Gourlay, M.; Ross, P.; Sen, S.; Radican, L.; De Ceulaer, F.; Ben Sedrine, W.; Ethgen, O.; Bruyère, O.; Reginster, J.-Y. Validation and comparative evaluation of the osteoporosis self-assessment tool (ost) in a caucasian population from belgium. QJM 2004, 97, 39–46. [Google Scholar] [CrossRef] [PubMed]
- Koh, L.K.; Sedrine, W.B.; Torralba, T.P.; Kung, A.; Fujiwara, S.; Chan, S.P.; Huang, Q.R.; Rajatanavin, R.; Tsai, K.S.; Park, H.M.; et al. A simple tool to identify asian women at increased risk of osteoporosis. Osteoporos. Int. 2001, 12, 699–705. [Google Scholar] [CrossRef] [PubMed]
- Kung, A.W.; Ho, A.Y.; Ross, P.D.; Reginster, J.Y. Development of a clinical assessment tool in identifying asian men with low bone mineral density and comparison of its usefulness to quantitative bone ultrasound. Osteoporos. Int. 2005, 16, 849–855. [Google Scholar] [CrossRef] [PubMed]
- Chin, K.Y. A review on the performance of osteoporosis self-assessment tool for asians in determining osteoporosis and fracture risk. Postgrad. Med. 2017, 129, 734–746. [Google Scholar] [CrossRef] [PubMed]
- Black, D. Sofsurf: A simple, useful risk factor system can identify the large majority of women with osteoporosis. Bone 1998, 23, S605. [Google Scholar]
- Lydick, E.; Turpin, J.; Cook, K.; Stine, R.; Melton, M.; Byrnes, C. Development and validation of a simple questionnaire to facilitate identification of women with low bone density. J. Bone Miner. Res. 1996, 11, S368. [Google Scholar]
- Huang, J.Y.; Song, W.Z.; Zeng, H.R.; Huang, M.; Wen, Q.F. Performance of the osteoporosis self-assessment tool for asians (osta) in screening osteoporosis among middle-aged and old women in the chengdu region of china. J. Clin. Densitom. 2015, 18, 539–545. [Google Scholar] [CrossRef] [PubMed]
- Park, H.M.; Sedrine, W.B.; Reginster, J.Y.; Ross, P.D. Korean experience with the osta risk index for osteoporosis: A validation study. J. Clin. Densitom. 2003, 6, 247–250. [Google Scholar] [CrossRef]
- Geater, S.; Leelawattana, R.; Geater, A. Validation of the osta index for discriminating between high and low probability of femoral neck and lumbar spine osteoporosis among thai postmenopausal women. J. Med. Assoc. Thai. 2004, 87, 1286–1292. [Google Scholar] [PubMed]
- Chaovisitsaree, S.; Namwongprom, S.N.; Morakote, N.; Suntornlimsiri, N.; Piyamongkol, W. Comparison of osteoporosis self assessment tool for asian (osta) and standard assessment in menopause clinic, chiang mai. J. Med. Assoc. Thai. 2007, 90, 420–425. [Google Scholar] [PubMed]
- Harvey, N.; Dennison, E.; Cooper, C. Osteoporosis: Impact on health and economics. Nat. Rev. Rheumatol. 2010, 6, 99–105. [Google Scholar] [CrossRef] [PubMed]
- Yang, Y.; Li, D.; Fei, Q.; Wang, B.Q.; Tang, H.; Li, J.J.; Meng, Q.; Zhao, F. Self-assessment tool to identify primary osteoporosis in chinese elderly males. Int. J. Gerontol. 2015, 9, 71–76. [Google Scholar] [CrossRef]
- Oh, S.M.; Song, B.M.; Nam, B.-H.; Rhee, Y.; Moon, S.-H.; Kim, D.Y.; Kang, D.R.; Kim, H.C. Development and validation of osteoporosis risk-assessment model for korean men. Yonsei Med. J. 2016, 57, 187–196. [Google Scholar] [CrossRef] [PubMed]
- Huang, J.-Y.; Song, W.-Z.; Huang, M. Effectiveness of osteoporosis self-assessment tool for asians in screening for osteoporosis in healthy males over 40 years old in china. J. Clin. Densitom. 2017, 20, 153–159. [Google Scholar] [CrossRef] [PubMed]
- Bhat, K.A.; Kakaji, M.; Awasthi, A.; Kumar, K.; Mishra, K.; Shukla, M.; Gupta, S.K. Utility of osteoporosis self-assessment tool as a screening tool for predicting osteoporosis in indian men. J. Clin. Densitom. 2017, 20, 160–163. [Google Scholar] [CrossRef] [PubMed]
- Chang, S.F.; Yang, R.S. Optimal analysis to discriminate males’ osteoporosis with simple physiological indicators: A cutoff point study. Am. J. Mens Health 2016, 10, 487–494. [Google Scholar] [CrossRef] [PubMed]
- Trimpou, P.; Bosaeus, I.; Bengtsson, B.-Å.; Landin-Wilhelmsen, K. High correlation between quantitative ultrasound and dxa during 7 years of follow-up. Eur. J. Radiol. 2010, 73, 360–364. [Google Scholar] [CrossRef] [PubMed]
- Chen, S.J.; Chen, Y.J.; Cheng, C.H.; Hwang, H.F.; Chen, C.Y.; Lin, M.R. Comparisons of different screening tools for identifying fracture/osteoporosis risk among community-dwelling older people. Medicine (Baltimore) 2016, 95, e3415. [Google Scholar] [CrossRef] [PubMed]
- Kung, A.W.; Ho, A.Y.; Sedrine, W.B.; Reginster, J.Y.; Ross, P.D. Comparison of a simple clinical risk index and quantitative bone ultrasound for identifying women at increased risk of osteoporosis. Osteoporos. Int. 2003, 14, 716–721. [Google Scholar] [CrossRef] [PubMed]
- Chin, K.Y.; Low, N.Y.; Kamaruddin, A.A.A.; Dewiputri, W.I.; Soelaiman, I.N. Agreement between calcaneal quantitative ultrasound and osteoporosis self-assessment tool for asians in identifying individuals at risk of osteoporosis. Ther. Clin. Risk Manag. 2017, 13, 1333–1341. [Google Scholar] [CrossRef] [PubMed]
- Chan, S.P.; Teo, C.C.; Ng, S.A.; Goh, N.; Tan, C.; Deurenberg-Yap, M. Validation of various osteoporosis risk indices in elderly chinese females in singapore. Osteoporos. Int. 2006, 17, 1182–1188. [Google Scholar] [CrossRef] [PubMed]
- Panichyawat, N.; Tanmahasamut, P. Comparison of osta index and kkos scoring system for prediction of osteoporosis in postmenopausal women who attended siriraj menopause clinic. J. Med. Assoc. Thail. 2012, 95, 1365–1371. [Google Scholar]
- Lin, J.; Yang, Y.; Zhang, X.; Ma, Z.; Wu, H.; Li, Y.; Yang, X.; Fei, Q.; Guo, A. Bfh-ostm, a new predictive screening tool for identifying osteoporosis in elderly han chinese males. Clin. Interv. Aging 2017, 12, 1167–1174. [Google Scholar] [CrossRef] [PubMed]
- Ma, Z.; Yang, Y.; Lin, J.; Zhang, X.; Meng, Q.; Wang, B.; Fei, Q. Bfh-ost, a new predictive screening tool for identifying osteoporosis in postmenopausal han chinese women. Clin. Interv. Aging 2016, 11, 1051–1059. [Google Scholar] [PubMed]
- Satyaraddi, A.; Shetty, S.; Kapoor, N.; Cherian, K.E.; Naik, D.; Thomas, N.; Paul, T.V. Performance of risk assessment tools for predicting osteoporosis in south indian rural elderly men. Arch. Osteoporos. 2017, 12, 35. [Google Scholar] [CrossRef] [PubMed]
- Chen, J.-H.; Chen, Y.-C.; Tsai, M.-K.; Chiou, J.-M.; Lee, W.-C.; Tsao, C.-K.; Tsai, K.-S.; Chie, W.-C. Predicting the risk of osteopenia for women aged 40–55 years. J. Formos. Med. Assoc. 2017, 116, 888–896. [Google Scholar] [CrossRef] [PubMed]
- Oh, S.M.; Nam, B.H.; Rhee, Y.; Moon, S.H.; Kim, D.Y.; Kang, D.R.; Kim, H.C. Development and validation of osteoporosis risk-assessment model for korean postmenopausal women. J. Bone Miner. Metab. 2013, 31, 423–432. [Google Scholar] [CrossRef] [PubMed]
- Pei Shan, L.; Fee Bee, O.; Seri Suniza, S.; Adeeb, N. Developing a malaysian osteoporosis screening tool (most) for early osteoporosis detection in malaysian women. Sex. Reprod. Healthc. 2011, 2, 77–82. [Google Scholar] [CrossRef] [PubMed]
- Cadarette, S.M.; McIsaac, W.J.; Hawker, G.A.; Jaakkimainen, L.; Culbert, A.; Zarifa, G.; Ola, E.; Jaglal, S.B. The validity of decision rules for selecting women with primary osteoporosis for bone mineral density testing. Osteoporos. In.t 2004, 15, 361–366. [Google Scholar]
- Gourlay, M.L.; Miller, W.C.; Richy, F.; Garrett, J.M.; Hanson, L.C.; Reginster, J.Y. Performance of osteoporosis risk assessment tools in postmenopausal women aged 45-64 years. Osteoporos. Int. 2005, 16, 921–927. [Google Scholar] [CrossRef] [PubMed]
- Adler, R.A.; Tran, M.T.; Petkov, V.I. Performance of the osteoporosis self-assessment screening tool for osteoporosis in american men. Mayo. Clin. Proc. 2003, 78, 723–727. [Google Scholar] [CrossRef] [PubMed]
- Ghazi, M.; Mounach, A.; Nouijai, A.; Ghozlani, I.; Bennani, L.; Achemlal, L.; Bezza, A.; El Maghraoui, A. Performance of the osteoporosis risk assessment tool in moroccan men. Clin. Rheumatol. 2007, 26, 2037–2041. [Google Scholar] [CrossRef] [PubMed]
- Sinnott, B.; Kukreja, S.; Barengolts, E. Utility of screening tools for the prediction of low bone mass in african american men. Osteoporos. Int. 2006, 17, 684–692. [Google Scholar] [CrossRef] [PubMed]
- Lynn, H.S.; Woo, J.; Leung, P.C.; Barrett-Connor, E.L.; Nevitt, M.C.; Cauley, J.A.; Adler, R.A.; Orwoll, E.S. An evaluation of osteoporosis screening tools for the osteoporotic fractures in men (mros) study. Osteoporos. Int. 2008, 19, 1087–1092. [Google Scholar] [CrossRef] [PubMed]
- Machado, P.; Coutinho, M.; Da Silva, J. Selecting men for bone densitometry: Performance of osteoporosis risk assessment tools in portuguese men. Osteoporos Int 2010, 21, 977–983. [Google Scholar] [CrossRef] [PubMed]
- Steuart Richards, J.; Lazzari, A.A.; Teves Qualler, D.A.; Desale, S.; Howard, R.; Kerr, G.S. Validation of the osteoporosis self-assessment tool in us male veterans. J. Clin. Densitom. 2014, 17, 32–37. [Google Scholar] [CrossRef] [PubMed]
- Pérez-Castrillón, J.L.; Sagredo, M.G.; Conde, R.; del Pino-Montes, J.; de Luis, D. Ost risk index and calcaneus bone densitometry in osteoporosis diagnosis. J. Clin Densitom 2007, 10, 404–407. [Google Scholar] [CrossRef] [PubMed]
- Richards, J.S.; Peng, J.; Amdur, R.L.; Mikuls, T.R.; Hooker, R.S.; Michaud, K.; Reimold, A.M.; Cannon, G.W.; Caplan, L.; Johnson, D.; et al. Dual-energy x-ray absorptiometry and evaluation of the osteoporosis self-assessment tool in men with rheumatoid arthritis. J. Clin. Densitom. 2009, 12, 434–440. [Google Scholar] [CrossRef] [PubMed]
- Wallace, L.S.; Ballard, J.E.; Holiday, D.; Turner, L.W.; Keenum, A.J.; Pearman, C.M. Evaluation of decision rules for identifying low bone density in postmenopausal african-american women. J. Natl. Med. Assoc. 2004, 96, 290–296. [Google Scholar] [PubMed]
- Cook, R.B.; Collins, D.; Tucker, J.; Zioupos, P. Comparison of questionnaire and quantitative ultrasound techniques as screening tools for dxa. Osteoporos. Int. 2005, 16, 1565–1575. [Google Scholar] [CrossRef] [PubMed]
- Crandall, C.J.; Larson, J.; Gourlay, M.L.; Donaldson, M.G.; LaCroix, A.; Cauley, J.A.; Wactawski-Wende, J.; Gass, M.L.; Robbins, J.A.; Watts, N.B.; et al. Osteoporosis screening in postmenopausal women 50 to 64 years old: Comparison of us preventive services task force strategy and two traditional strategies in the women's health initiative. J. Bone Miner. Res. 2014, 29, 1661–1666. [Google Scholar] [CrossRef] [PubMed]
- Geusens, P.; Hochberg, M.C.; van der Voort, D.J.M.; Pols, H.; van der Klift, M.; Siris, E.; Melton, M.E.; Turpin, J.; Byrnes, C.; Ross, P.D. Performance of risk indices for identifying low bone density in postmenopausal women. Mayo. Clin. Proc. 2002, 77, 629–637. [Google Scholar] [CrossRef] [PubMed]
- Jiang, X.; Good, L.E.; Spinka, R.; Schnatz, P.F. Osteoporosis screening in postmenopausal women aged 50–64 years: Bmi alone compared with current screening tools. Maturitas 2016, 83, 59–64. [Google Scholar] [CrossRef] [PubMed]
- Pecina, J.L.; Romanovsky, L.; Merry, S.P.; Kennel, K.A.; Thacher, T.D. Comparison of clinical risk tools for predicting osteoporosis in women ages 50–64. J. Am. Board Fam. Med. 2016, 29, 233–239. [Google Scholar] [CrossRef] [PubMed]
- Crandall, C.J.; Larson, J.C.; Watts, N.B.; Gourlay, M.L.; Donaldson, M.G.; LaCroix, A.; Cauley, J.A.; Wactawski-Wende, J.; Gass, M.L.; Robbins, J.A.; et al. Comparison of fracture risk prediction by the us preventive services task force strategy and two alternative strategies in women 50-64 years old in the women's health initiative. J. Clin. Endocrino.l Metab. 2014, 99, 4514–4522. [Google Scholar] [CrossRef] [PubMed]
- Zimering, M.B.; Shin, J.J.; Shah, J.; Wininger, E.; Engelhart, C. Validation of a novel risk estimation tool for predicting low bone density in caucasian and african american men veterans. J. Clin. Densitom. 2007, 10, 289–297. [Google Scholar] [CrossRef] [PubMed]
- Hawker, G.; Mendel, A.; Lam, M.A.; Akhavan, P.S.; Cancino-Romero, J.; Waugh, E.; Jamal, S.; Mian, S.; Jaglal, S. A clinical decision rule to enhance targeted bone mineral density testing in healthy mid-life women. Osteoporos. Int. 2012, 23, 1931–1938. [Google Scholar] [CrossRef] [PubMed]
- Richards, J.S.; Lazzari, A.A.; Qualler, D.A.T.; Desale, S.; Howard, R.; Kerr, G.S. Validation of the osteoporosis self-assessment tool in us male veterans. J. Clin. Densitom. 2014, 17, 32–37. [Google Scholar] [CrossRef] [PubMed]
- Lin, J.; Yang, Y.; Fei, Q.; Zhang, X.; Ma, Z.; Wang, Q.; Li, J.; Li, D.; Meng, Q.; Wang, B. Validation of three tools for identifying painful new osteoporotic vertebral fractures in older chinese men: Bone mineral density, osteoporosis self-assessment tool for asians, and fracture risk assessment tool. Clin. Interv. Aging 2016, 11, 461–469. [Google Scholar] [PubMed]
- Yang, Y.; Wang, B.; Fei, Q.; Meng, Q.; Li, D.; Tang, H.; Li, J.; Su, N. Validation of an osteoporosis self-assessment tool to identify primary osteoporosis and new osteoporotic vertebral fractures in postmenopausal chinese women in beijing. BMC Musculoskelet. Disord. 2013, 14, 271. [Google Scholar] [CrossRef] [PubMed]
- Liu, Z.; Gao, H.; Bai, X.; Zhao, L.; Li, Y.; Wang, B. Evaluation of singh index and osteoporosis self-assessment tool for asians as risk assessment tools of hip fracture in patients with type 2 diabetes mellitus. J. Orthop. Surg. Res. 2017, 12, 37. [Google Scholar] [CrossRef] [PubMed]


| Study | Objective | Subject Description | Number of Subjects Recruited | Methods | Cutoff | Sensitivity (%) | Specificity (%) | AUC | Remarks |
|---|---|---|---|---|---|---|---|---|---|
| Koh et al. (2001) [11] | To develop Osteoporosis Screening Tool for Asians (OSTA) | Postmenopausal women (mean age 62 years) recruited from 21 clinics in eight Asia countries. | 860 | DXA: 8 Hologic machines (3 Model 4500, 5 Model 2000), 4 Norland (2 XR-36, 1 S-26, 1 XR-26), 12 Lunar (3 DPX-IQ. 6 DPX-L, 3 Expert) machines | OSTA < −1 T-score< −2.5 | 91 | 45 | 0.79 | |
| SOFSURF < 1.4 T-score < −2.5 | 90 | 46 | 0.77 | ||||||
| ORAI < 15 T-score < −2.5 | 84 | 52 | 0.76 | ||||||
| SCORE < 10 T-score < −2.5 | 90 | 33 | 0.77 | ||||||
| Park et al. (2003) [17] | To validate the effectiveness of OSTA in identifying osteoporosis among Korean women | Postmenopausal women from a clinic in Korea and who were not on hormone replacement therapy (mean age: 59.1 ± 7.7 years) | 1101 | DXA GE Lunar model DPQ-IQ BMD at FN | OSTA < −1 T-score ≤ −2.0 | 80 | 72 | 0.85 | Single-centered |
| OSTA < −1 T-score ≤ −2.5 | 87 | 67 | 0.873 | ||||||
| Geater et al. (2004) [18] | To validate the performance of OSTA in predicting osteoporosis among Korean women | Thai post-menopausal women (mean age: 60.5 ± 9.7 years) without risk of osteoporosis | 388 | DXA Lunar, Madison BMD at FN and LS | OSTA < −1 FN T-score < −2.5 | 93.5 | 60.8 | Value not mentioned | |
| OSTA < −1 LS T-score < −2.5 | 79.5 | 69.5 | Value not mentioned | ||||||
| OSTA < 0 FN T-score < −2.5 | 93.5 | 29.8 | Value not mentioned | ||||||
| OSTA < 0 LS T-score < −2.5 | 92.4 | 35.7 | Value not mentioned | ||||||
| Huang et al. (2015) [16] | To determine the performance of OSTA among middle-aged and old women | Healthy women (age range: 40–96 years) from a hospital in Chengdu region, China | 15,752 | DXA (Lunar Prodigy- GE Healthcare, Madison, WI, USA) BMD at LS, FN, and TH | OSTA < −1 LS T-score < −1 | 56.9 | 87.7 | 0.812 | |
| OSTA < −1 LS T-score < −2.5 | 77.3 | 73.5 | 0.812 | ||||||
| OSTA < −1 FN T-score < −1 | 56.2 | 89.8 | 0.822 | ||||||
| OSTA < −1 FN T-score < −2.5 | 88.1 | 69.3 | 0.822 | ||||||
| Yang et al. (2015) [21] | To validate OSTA among elderly males to determine the risk of primary osteoporosis | Healthy males (mean age: 65.17± 9.29 years) | 245 | DXA (Hologic, Inc., Bedford, MA, USA) BMD at LS and LF | OSTA < 1 FN T-score < −2.5 | 84 | 49 | 0.712 | |
| OSTA < 1 TH T-score < −2.5 | Value not stated | Value not stated | 0.658 | ||||||
| OSTA < 1 LS T-score < −2.5 | Value not stated | Value not stated | 0.535 | ||||||
| Oh et al. (2016) [22] | To compare the effectiveness of Korean Osteoporosis Risk-Assessment Model for Men (KORAM-M) and OSTA | Men aged 50 and above from 2009 and 2010 Korean National Health and Nutrition Examination Survey | Development phase: 1340 Validation phase: 1110 | DXA Hologic Discovery BMD at FN or LS | Development: OSTA < −1 | 90.8 | 36.9 | 0.639 | |
| KORAM-M < −9 | 90.8 | 42.4 | 0.666 | ||||||
| Validation: OSTA < −1 | 92.3 | 33.2 | 0.627 | ||||||
| KORAM-M < −9 | 87.9 | 39.7 | 0.638 | ||||||
| Huang et al. (2017) [23] | To assess the effectiveness of OSTA using various cutoffs | Healthy men aged 40–96 years recruited from a hospital in Chengdu region, China | 11,039 | DXA (GE Lunar, Madison, WI, USA) BMD at LS and FN | OSTA < −1 LS T-score < −1 | 27.6 | 89.2 | value not stated | |
| OSTA < −1 LS T-score ≤ −2.5 | 57.3 | 86.7 | |||||||
| OSTA < −1 FN T-score < −1 | 28.5 | 92.7 | |||||||
| OSTA < −1 FN T-score ≤ −2.5 | 65.9 | 87.0 | |||||||
| Bhat et al. (2017) [24] | To evaluate the performance of OSTA in predicting OP among Indian men | Indian men above 50 years and without apparent risk of OP | 257 | DXA (QDR 4500 A, Hologic Inc., Bedford, MA, USA) BMD at LS, TH and FN | OSTA ≤ 2 T-score at any sites ≤ −2.5 | 95.7 | 33.6 | 0.702 | |
| Zha et al. (2014) [4] | To validate OSTA and QUS and their combination in predicting OP among the high-risk population | Chinese men (mean age: 78.0 years) | 472 | DXA (Discovery A, Hologic, USA) QUS (Sahara clinical bone sonometer- Hologic) BMD at LS and LH | OSTA < −3.5 FN T-score < −2.5 | 65.5 | 74.8 | 0.724 | Small sample size Sample recruited from a single centre |
| OSTA < −3.5 TH T-score < −2.5 | 81.8 | 72.7 | 0.787 | ||||||
| OSTA < −3.5 LS T-score < −2.5 | 45.4 | 74.7 | 0.652 | ||||||
| OSTA < −3.5 T-score at any site < −2.5 | 47.3 | 76.8 | 0.676 | ||||||
| QUS < −1.15 FN T-score < −2.5 | 88.9 | 47.4 | 0.762 | ||||||
| QUS < −2.15 TH T-score < −2.5 | 82.4 | 86.6 | 0.883 | ||||||
| QUS < −1.25 LS T-score < −2.5 | 82.7 | 57.9 | 0.750 | ||||||
| QUS < −1.25 T-score at any site < −2.5 | 80.4 | 59.7 | 0.762 | ||||||
| Chang & Yang (2016) [25] | To conduct a cutoff study among males by using OST, BMI, age and body weight | Retrospective data of Northern Taiwan males with mean age of 71.9 ± 13.3 years | 834 | DXA BMD at FN | OST < −1.86 T-score ≤ −2.5 | 69.2 | 63 | 0.70 | Subjects were patients referred to BMD test by orthopaedic surgeons |
| BMI < 23 kg/m2 T-score ≤ −2.5 | 60.4 | 61.6 | 0.63 | ||||||
| Weight < 58.8 kg T-score ≤ −2.5 | 43.9 | 78.2 | 0.66 | ||||||
| Kung et al. (2003) [28] | To develop OSTA for Asian men | Community-dwelling Chinese men (age: 50–93 years) | 420 | Development followed by validation in 356 men DXA: QDR 2000 Plus Hologic, Waltham, MA, USA BMD at LS and LF QUS: Sahara Hologic, Waltham, MA, USA | Development: OSTA < −1 T-score ≤ −2.5 | 73 | 68 | 0.790 | Subjects were not selected randomly |
| Validation: OSTA < −1 T-score ≤ −2.5 | 71 | 68 | 0.780 | ||||||
| Validation: QUI < −1.2 T-score ≤ −2.5 | 76 | 72 | 0.80 | ||||||
| Either OSTA <−1 or QUI < −2.5 T-score ≤ −2.5 | 88 | 64 | 0.82 | ||||||
| Chan et al. (2006) [30] | To compare the validity of various OP risk indices in elderly Chinese females | Community-dwelling postmenopausal women (age ≥55) | 135 | DXA (Hologic QDR 4500 W) BMD at FN and LS | OSTA (cutoff ≤ −2 FN T-score ≤ −2.5 LS T-score ≤ −2.5 | 90.9 | 58.8 | 0.82 | Small sample size |
| 91.9 | 42.9 | 0.73 | |||||||
| SCORE (cutoff ≥ 8) FN T-score ≤ −2.5 LS T-score ≤ −2.5 | 93.9 | 60.8 | 0.80 | ||||||
| 86.5 | 60.2 | 0.72 | |||||||
| ORAI (cutoff ≥ 20) FN T-score ≤ −2.5 LS T-score ≤ −2.5 | 75.8 | 66.7 | 0.76 | ||||||
| 62 | 62 | 0.68 | |||||||
| ABONE (cutoff = 3) FN T-score ≤ −2.5 LS T-score ≤ −2.5 | 81.8 | 55.9 | 0.70 | ||||||
| 73 | 54.1 | 0.66 | |||||||
| SCORE (cutoff ≥ 8) FN T-score ≤ | 67.9 | 77.5 | 0.78 | ||||||
| 62.2 | 76.5 | 0.73 | |||||||
| Chaovisitsaree et al. (2007) [19] | To compare OSTA with DXA in determining osteopenia and osteoporosis menopausal women | Thai menopausal women (age range: 45–87 years) from Menopause Clinic in Chiang Mai University | 315 | DXA BMD at FN, LS and radius | OSTA < −1 LS T-score ≤−1 FN T-score ≤−1 Radius T-score ≤−1 | 36.2 | 71.4 | Value not mentioned | |
| 40.6 | 72.0 | ||||||||
| 48.3 | 75.1 | ||||||||
| OSTA < −1 LS T-score ≤−2.5 FN T-score ≤−2.5 Radius T-score ≤−2.5 | 45.8 | 68.9 | |||||||
| 75.0 | 67.8 | ||||||||
| 60 | 68.5 | ||||||||
| Chen et al. (2016) [27] | To compare the performance of different screening tools to predict fracture or OP risk among older people | Community-dwelling older people aged 60 and above (mean age: 67.4 ± 6,4 years) recruited from Tanzi District, Taiwan | 553 | DXA Hologic Discovery Wi Bone Densitometer BMD at FN QUS GE Lunar, Madison, WI | QUS FN T-score ≤ −2.5 | 20 (M) 59 (F) | 86 (M) 75 (F) | 0.72(M) 0.77(F) | |
| ABONE ≥ 2 | 100 (M) 100 (F) | 28 (M) 10 (F) | 0.78(M) 0.70(F) | ||||||
| BWC < 70 kg | 100 (M) 100 (F) | 36 (M) 7 (F) | 0.92(M) 0.80(F) | ||||||
| FRAX Hip fracture (>3%) | 80 (M) 83 (F) | 71 (M) 54 (F) | 0.86(M) 0.75(F) | ||||||
| MOF (>20%) | 0 (M) 17 (F) | 99 (M) 96 (F) | 0.77(M) 0.71(F) | ||||||
| GARVAN Hip fracture (>3%) | 60 (M) 28 (F) | 79 (M) 95 (F) | 0.72(M) 0.80(F) | ||||||
| Any osteoporotic fracture (>20%) | 20 (M) 55 (F) | 96 (M) 73 (F) | 0.72(M) 0.75(F) | ||||||
| ORAI ≥ 9 | 100 (M) 100 (F) | 19 (M) 5 (F) | 0.87(M) 0.77(F) | ||||||
| OSIRIS ≤ 1 | 100 (M) 100 (F) | 29 (M) 6 (F) | 0.94(M) 0.83(F) | ||||||
| OSTA ≤ −1 | 100 (M) 100 (F) | 58 (M) 27 (F) | 0.94(M) 0.83(F) | ||||||
| SCORE ≥ 6 | 100 (M) 100 (F) | 45 (M) 15 (F) | 0.91(M) 0.80(F) | ||||||
| Chen et al. (2017) [35] | To establish a prediction model to identify osteopenia risk in women aged 40–55 years | Taiwanese women recruited from a health checkup centre | 1350 | DXA (DPX-L; GE Lunar Health Care, Madison, WI, USA) BMD at LS | OSTA ≤ 1 | 78 | 47 | 0.69 | Novel algorithm to predict osteopenia |
| OPAT ≥ 1 −1 ≥ T-score > −2.5 at LS | 87 | 42 | 0.77 | ||||||
| Panichyawat & Tanmahasamut (2012) [31] | To compare the performance of OSTA and Khon Kaen Osteoporosis Study (KKOS) scoring system to predict OP among postmenopausal women in Thailand | Postmenopausal women (mean age: 55.8 ± 5.9 years) from menopause clinic | 441 | DXA BMD at FN and TH | OSTA = −1 T-score at any site ≤ −2.5 | 51.7 | 77.4 | 0.65 | Subjects from a single centre |
| OSTA = 0 T-score at any site ≤ −2.5 | 66.7 | 57.1 | 0.62 | ||||||
| KKOS = −1 T-score at any site ≤ −2.5 | 56.3 | 71.8 | 0.64 | ||||||
| KKOS = 0 T-score at any site ≤ −2.5 | 57.5 | 67.2 | 0.62 | ||||||
| Oh et al. (2013) [36] | To develop Korean Osteoporosis Risk-Assessment Model (KORAM) and compare its performance with OSTA | Postmenopausal women who participated in the 2009 and 2010 Korean National Health and Nutrition Examination Survey | Development: 1209 Validation: 1046 | DXA QDR Discovery, Hologic BMD at TF, FN and LS | Development: OSTA < 0 FN or LS T-score < −2.5 | 96.8 | 28.3 | 0.626 | |
| OSTA < 0 FN or LS T-score < −2.0 | 93.7 | 34.6 | 0.641 | ||||||
| KORAM < −9 FN or LS T-score < −2.5 | 91.2 | 50.6 | 0.709 | ||||||
| KORAM < −9 FN or LS T-score < −2.0 | 85.2 | 60.1 | 0.726 | ||||||
| Validation: OSTA <0 FN or LS T-score < −2.5 | 94.2 | 29.2 | 0.617 | ||||||
| OSTA < 0 FN or LS T-score < −2.0 | 90.9 | 35.0 | 0.629 | ||||||
| KORAM < −9 FN or LS T-score < −2.5 | 84.8 | 51.6 | 0.682 | ||||||
| KORAM < −9 FN or LS T-score < −2.0 | 79.2 | 60.2 | 0.697 | ||||||
| Lim et al. (2011) [37] | To develop and validate Malaysian Osteoporosis Screening Tool (MOST) to detect low BMD in Malaysia | Healthy women (mean age: 51.3 ± 5.4 years) from a residential area | Development: 514 Validation: 72 | DXA Norland XR-36 BMD at FN and LS | OST < 2 FN T-score ≤−2.5 | 88 | 52 | Value not mentioned | |
| ORAI > 8 FN T-score ≤−2.5 | 90 | 52 | |||||||
| SCORE > 7 FN T-score ≤−2.5 | 89 | 58 | |||||||
| SOFSURF > −1 FN T-score ≤−2.5 | 92 | 37 | |||||||
| MOST ≥ 4 FN/LS T-score ≤−2.5 | Development: 80.2 Validation: 100 | Development: 55.5 Validation: 67.6 | |||||||
| Ma et al. (2016) [33] | To compare the performance of OSTA and BFH in determining osteoporosis among postmenopausal Han Chinese women | Community-dwelling Han Chinese postmenopausal women with age range of 40–89 years (mean age: 60.71 ± 8.47 years) | 1721 | DXA Hologic Discovery QDR Wi BMD at LS, FN and TH | OSTA < −1 T-score at any sites <−2.5 | 65.28 | 77.15 | 0.782 | Subjects from a single centre |
| BFH-OST < −9.1 T-score at any sites <−2.5 | 73.58 | 72.66 | 0.797 | ||||||
| Lin et al. (2017) [32] | To assess the performance new screening tool to determine osteoporosis | Development phase: Community-dwelling Han Chinese males aged 50 and above (mean age: 65.42 ± 8.8) Validation phase: Hospital-dwelling Han Chinese men | Development: 1870 Validation: 574 | DXA Discovery Wi, QDR series, Hologic, Waltham, MA, USA BMD at hip and LS | Development: BFH-OSTM ≤ 70 T-score < −2.5 | 84.96 | 53.49 | 0.763 | |
| Validation: OSTA ≤ −1 T-score < −2.5 | 50.42 | 82.20 | 0.732 | ||||||
| BFH-OSTM ≤ 70 T-score < −2.5 | 89.92 | 48.57 | 0.795 | ||||||
| Satyaraddi et al. (2017) [34] | To evaluate the performance of OSTA and Male Osteoporosis Risk Estimation Score (MORES) in predicting OP among South Indian rural elderly men | Indian men aged 65 and above (mean age: 71.9 ± 5.2 years) recruited by cluster random sampling | 512 | DXA Hologic QDR4500 Discovery A BMD at LS and FN | OSTA ≤ 2 LS T-score ≤ −2.5 | 94 | 17 | 0.716 | Further validation study is needed for a larger cohort of subjects |
| FN T-score ≤ −2.5 | 99 | 18 | 0.778 | ||||||
| MORES ≥ 6 LS T-score ≤ −2.5 | 98 | 15 | 0.855 | ||||||
| FN T-score ≤ −2.5 | 98 | 13 | 0.760 |
| Study | Objective | Subject Description | Number of Subjects Recruited | Methods | Cutoff | Sensitivity (%) | Specificity (%) | AUC | Remarks |
|---|---|---|---|---|---|---|---|---|---|
| Richy et al. 2004 [10] | To validate and compare the performance of OST with other osteoporosis risk indices | Postmenopausal White women (mean age: 61.5 ± 8.8 years) without Paget’s disease or advanced osteoarthritis | 4035 | DXA: Hologic QDR 2000 BMD at any site | OST < 2 T-score ≤ −2.5 T-score ≤ −2 | 86 82 | 40 44 | 0.726 0.713 | Subjects were either referred or came spontaneously for osteoporosis evaluation and may differ in some ways from the general population |
| SCORE > 7 T-score ≤ −2.5 T-score ≤ −2 | 86 78 | 40 46 | 0.708 0.700 | ||||||
| ORAI > 8 T-score ≤ −2.5 T-score ≤ −2 | 76 73 | 48 51 | 0.670 0.668 | ||||||
| OSIRIS < 1 T-score ≤ −2.5 T-score ≤ −2 | 64 58 | 69 73 | 0.730 0.717 | ||||||
| Cadarette et al. 2004 [38] | To validate the performance of osteoporosis risk indices to determine women at high risk of osteoporosis | Women (mean age: 62.4 years) with age range of 45–90 years | 644 | DXA BMD at FN and LS | ORAI > 8 T-score < −2.5 | 92.5 | 38.7 | 0.80 | The study included data from women who have been selected for BMD testing |
| OST chart <2 T-score < −2.5 | 91.5 | 45.7 | 0.82 | ||||||
| OST equation < 2 T-score < −2.5 | 95.3 | 39.6 | 0.82 | ||||||
| Body weight criterion < 70 kg | 93.4 | 34.6 | 0.73 | ||||||
| Adler et al. 2003 [40] | To assess the performance of OST in men | American men (mean age: 64.3 ± 12.3 years) recruited from pulmonary and rheumatology clinic | 181 | Hologic QDR 4500 (Hologic, Inc., Bedford, MA, USA) BMD at LS, FN and TH | OST = 3 T-score ≤ −2.5 | 93 | 66 | 0.836 | The study was not designed specifically to validate OST Small sample size |
| OST= 3 T-score ≤ −2.0 | 74 | 72 | 0.815 | ||||||
| Ghazi et al. (2007) [41] | To evaluate the performance of OST in predicting men with low BMD | White men (age range: 50–85 years) from a hospital in Morocco | 229 | DXA Lunar Prodigy Vision machine (GE) BMD at TH and LS | OST = 2 TH T-score ≤ −2.5 | 87.5 | 58.2 | 0.787 | |
| OST = 2 LS T-score ≤ −2.5 | 63.6 | 59.5 | 0.660 | ||||||
| OST = 2 T-score ≤ −2.5 at any site | 64 | 60.3 | 0.667 | ||||||
| Lynn et al. (2008) [43] | To evaluate the use of OST, Male Osteoporosis Screening Tool (MOST) and Quantitative Ultrasound Index (QUI) and body weight as osteoporosis screening tools | Caucasian and Hong Kong Chinese men, aged ≥ 65 years and community-dwelling from Osteoporotic Fractures in Men (MrOS) Study | 4658 Caucasian men 1914 Hong Kong Chinese men | DXA Hologic QDR 4500 W (Hologic Inc.) BMD at LS and PF | Caucasian: | ||||
| OST ≤1 T-score at any site ≤ −2.5 | 79.3 | 48.5 | 0.714 | ||||||
| OST ≤2 T-score at any site ≤ −2.5 | 87.6 | 36.1 | |||||||
| MOST ≤26 T-score at any site ≤ −2.5 | 88.5 | 50 | 0.799 | ||||||
| MOST ≤27 T-score at any site ≤ −2.5 | 94.7 | 37.8 | |||||||
| Chinese: | |||||||||
| OST ≤−2 T-score at any site ≤ −2.5 | 81.8 | 56.2 | 0.759 | ||||||
| OST ≤−1 T-score at any site ≤ −2.5 | 91.9 | 36.4 | |||||||
| MOST ≤21 T-score at any site ≤ −2.5 | 86.8 | 59.3 | 0.831 | ||||||
| MOST ≤22 T-score at any site ≤ −2.5 | 94.2 | 42.3 | |||||||
| Gourlay et al. (2005) [39] | To compare the performance of three osteoporosis risk indices in two different age groups. | Postmenopausal women aged 45–96 years | 4035 | DXA: Hologic QDR 1000, 2000 and 4500 (Hologic Inc., Waltham, MA, USA) BMD at FN | OST ≤ 1 Ages 45−64 years | 89.2 | 45 | 0.768 | Subjects from a single centre |
| OST ≤ −1 Ages ≥ 65 years | 84.6 | 47.5 | 0.762 | ||||||
| ORAI ≥ 8 Ages 45−64 years | 88.5 | 46.2 | 0.750 | ||||||
| ORAI ≥ 13 Ages ≥ 65 years | 89.2 | 44.7 | 0.747 | ||||||
| SCORE ≥ 7 Ages 45−64 years | 88.5 | 39.8 | 0.757 | ||||||
| SCORE ≥ 11 Ages ≥ 65 years | 88.8 | 42.3 | 0.745 | ||||||
| Sinnott et al. (2006) [42] | To assess the performance of QUS, OST, WBC and BMI to predict low BMD in African American | African American men (age: 35 and above) recruited from clinics | 128 | DXA: GE Lunar (General Electric, Madison, WI, USA) BMD at LS and non-dominant hip QUS Achilles Plus System (Lunar, Madison, WI, USA) | QUS ≤ −1 T-score ≤ −2.0 | 83 | 71 | 0.80 | Small sample size |
| OST < 4 T-score ≤ −2.0 | 83 | 57 | 0.83 | ||||||
| WBC < 85 kg | 74 | 50 | 0.70 | ||||||
| BMI ≥ 30 | 83 | 43 | 0.70 | ||||||
| Machado et al. (2009) [44] | To compare three different OP risk indices at different cutoffs in determining individuals who are at risk of OP | Portuguese men age 50 and above (mean age: 63.77 ± 8.22 years) | 202 | DXA: Hologic QDR4500/c BMD at LS and PF | OST < 1 OST < 2 OST < 3 OST < 4 | 47.1 61.8 75.5 85.3 | 72.6 63.7 50.0 32.7 | 0.598 0.627 0.632 0.590 | |
| OSTA < 1 OSTA < 2 OSTA < 3 OSTA < 4 | 38.2 55.9 73.5 76.5 | 82.1 67.9 58.3 42.9 | 0.602 0.619 0.659 0.597 | ||||||
| BWC < 65 kg BWC < 70 kg BWC < 75 kg BWC < 80 kg | 26.5 47.1 73.5 82.4 | 89.3 77.4 61.3 35.7 | 0.579 0.622 0.674 0.590 | ||||||
| Richards et al. (2014) [57] | To determine the performance of OST in predicting osteoporosis in males. | Male US veterans above 50 years recruited from VA Medical Centers | 518 | DXA: Hologic (Bedford, MA, USA) BMD at TH, LS or DF | OST ≤ 6 T-score ≤ −2.5 | 82.6 | 33.6 | 0.67 | DXA machines from differed manufacturers were used and the results were not standardized. |
| Crandall et al. [54] [47] | To compare the performance of USPSTF (FRAX) with OST and SCORE to predict osteoporosis | Women aged 50–64 years who participated Women’s Health Initiative Observational Study and Clinical Trials at three of the 40 clinical centres | 5165 | DXA Hologic QDR2000 or QDR4500 (Bedford, MA, USA) BMD at hip or LS | USPSTF (FRAX ≥ 9.3%) FN T-score ≤ −2.5 | 34.1 | 85.8 | 0.60 | |
| OST <2 FN T-score ≤ −2.5 | 79.8 | 66.3 | 0.73 | ||||||
| SCORE >7 FN T-score ≤ −2.5 | 74 | 70.8 | 0.72 | ||||||
| Geusens et al (2002) [51] | To compare the performance of 4 osteoporosis risk indices in determining postmenopausal women with low BMD | Women (45 years and above) from US clinic, Rotterdam Study (55 years and above), women screened for a clinical trial (55 to 81 years old) and women from the general clinic (50 to 80 years) | 1102 women from US clinic 3374 women from Rotterdam Study 23,833 women screened for a clinical trial 4204 women from the general clinic | DXA Hologic (Waltham, MA, USA); Norland (Fort Atkinson, WI, USA); and Lunar (Madison, WI, USA) BMD at FN or LS | OST <2 T-score ≤−2.5 | 88 | 52 | Value not mentioned | Large sample size Selection bias may occur |
| ORAI >8 T-score ≤−2.5 | 90 | 52 | |||||||
| SCORE >7 T-score ≤−2.5 | 89 | 58 | |||||||
| SOFSURF >−1 T-score ≤−2.5 | 92 | 37 | |||||||
| Wallace et al. (2004) [48] | To compare the performance of five osteoporosis risk indices in determining postmenopausal African-American women with low BMD | Women (mean age: 59.4 ± 12.5 years) from an osteoporosis study | 174 | DXA Hologic QDR 2000 BMD at FN | ABONE ≥ 2 T-score ≤ −2.5 | 73.0 | 59.6 | Value not mentioned | Small sample size |
| ORAI ≥ 9 T-score ≤ −2.5 | 65.6 | 78.9 | |||||||
| OST < 2 T-score ≤ −2.5 | 75.4 | 75.0 | |||||||
| SCORE ≥ 6 T-score ≤ −2.5 | 83.6 | 53.9 | |||||||
| Weight Criterion < 70 kg T-score ≤ −2.5 | 68.9 | 69.2 | |||||||
| Zimering et al. (2007) [55] | To compare a novel osteoporosis screening tool with OST in predicting low BMD | Development phase: Caucasian men (mean age: 68.4 ± 10.2 years) Validation phase: Caucasian men (mean age: 68.4 ± 10.2 years) African American men (mean age: 60.9 ± 13 years) | Development: 639 Caucasian men Validation: 197 Caucasian men 134 African American | DXA Hologic QDR 4500 SL machine (Waltham, MA, USA) BMD at FN, TH and LS | Caucasian Mscore (cutoff = 9) FN T-score ≤ −2.5 | 88 | 57 | 0.84 | Mscore is the first validated risk assessment tool developed in men |
| OST (cutoff= 4) FN T-score ≤ −2.5 | 85 | 51 | 0.81 | ||||||
| M score age-weight (cutoff = 9) FN T-score ≤ −2.5 | 85 | 58 | 0.81 | ||||||
| African American Mscore = 9 FN T-score ≤ −2.5 | NT | NT | NT | ||||||
| OST (cutoff = 4) FN T-score ≤ −2.5 | 100 | 72 | 0.99 | ||||||
| Mscore age-weight (cutoff = 9) FN T-score ≤ −2.5 | 100 | 73 | 0.99 | ||||||
| Jiang et al. (2016) [52] | To compare the performance of screening tools with BMI alone in identifying early postmenopausal women with OP | Postmenopausal women (mean age: 57 ± 4.2 years) | 445 | DXA | BMI < 28 | 95 | 38 | 0.73 | Small sample size Low statistical power of detecting the difference in AUCs |
| OST < 2 T-score ≤ −2.5 | 79 | 56 | 0.73 | ||||||
| ORAI ≥ 9 T-score ≤ −2.5 | 74 | 60 | 0.69 | ||||||
| SCORE ≥ 6 T-score ≤ −2.5 | 92 | 34 | 0.75 | ||||||
| USPSTF ≥ 9.3% | 24 | 83 | 0.62 | ||||||
| RF ≥ 1 risk factors | 66 | 62 | 0.64 | ||||||
| Pecina et al. (2016) [53] | To compare the effectiveness of risk tools to predict OP in women aged 50–64 | Retrospective data of women (mean age: 56.6 ± 3.4) who underwent DXA scan in a clinic | 290 | DXA BMD at hip/LS | USPSTF FRAX ≥ 9.3% | 36 | 73 | 0.55 | |
| SCORE ≥ 6 | 74 | 42 | 0.58 | ||||||
| OST < 2 | 56 | 69 | 0.63 | ||||||
| ORAI ≥ 9 | 52 | 67 | 0.60 | ||||||
| Hawker et al. (2012) [56] | To develop a screening tool to guide bone density testing in healthy mid-life women | Healthy women (age range 40–60) receiving their first BMD in an urban teaching hospital | 944 | DXA Lunar Prodigy (GE Healthcare, Madison WI, USA) BMD at FN, TH and LS | New tool T-score ≤ −2.0 | 93 | 36 | 0.75 | Only Caucasian population is involved |
| OST ≤1 T-score ≤ −2.0 | 47 | Value not mentioned | 0.69 | ||||||
| Cook et al. (2005) [49] | To assess the performance of various osteoporosis screening tools and quantitative ultrasound in relation to DXA scan | Postmenopausal women (age range: 29–87 years) recruited from DXA scanning clinics | 208 | DXA Hologic QDR 4500 C (Hologic Inc., Bedford, MA, USA) BMD at LS and PF | OST < −1 T-score ≤ −2.5 | 0.52 | 0.82 | 0.716 | |
| SCORE T-score ≤ −2.5 | 0.5 | 0.83 | 0.720 | ||||||
| ORAI T-score ≤ −2.5 | 0.43 | 0.86 | 0.664 | ||||||
| QUS BUA calcaneus T-score ≤ −2.5 | 0.56 | 0.92 | 0.766 | ||||||
| VOS calcaneus T-score ≤ −2.5 | 0.61 | 0.72 | 0.723 | ||||||
| Perez-Castrillon et al. (2007) [46] | To identify if the combination of OST and calcaneal DXA improves the diagnosis of OP | Males with a mean age of 47 ± 13 years and females with mean age of 66 ± 8 years recruited from two university hospitals | 67 males 94 females | DXA: Pixi-Lunar, DPXL Lunar (Madison, WI, USA) and Hologic QDR-4500; Hologic Inc. (Bedford, MD, USA) BMD at right calcaneal and hip | Men OST≤3 T-score < −2.5 | 39 | 86 | 0.623 | Small sample size |
| Women OST ≤ 2 T-score < −2.5 | 94 | 59 | 0.762 | ||||||
| Richards et al. (2009) [47] | To evaluate the performance of OST in predicting low BMD in male patients with rheumatoid arthritis | Males (mean age: 65.4 ± 10.5 years) recruited from a multicenter registry of rheumatoid arthritis | 795 | DXA Hologic Inc. (Bedford, MA, USA) BMD at Femur and LS | OST ≤ 4 | 64 | 54 | Not mentioned | Low lean body mass in RA could limit the utility of the OST in this population |
| Study | Objective | Subject Description | Number of Subjects Recruited | Methods | Cutoff | Sensitivity (%) | Specificity (%) | AUC | Remarks |
|---|---|---|---|---|---|---|---|---|---|
| Yang et al. (2013) [53] | To validate the performance of OSTA in determining vertebral fracture among postmenopausal women in China | Postmenopausal women (average age: 62 years) recruited from OP clinic in Beijing, China | 1201 | DXA Hologic, Inc. (Bedford, MA, USA) BMD at LS, FN and TH | OSTA < −1 and fracture | 81.7 | 66 | 0.812 | All subjects are recruited from one single OP centre |
| Crandall et al. (2014) [54] | To compare the performance of USPSTFS, OST and SCORE in predicting fracture risk among postmenopausal women | Postmenopausal women aged 50–64 years who participated in Women’s Health Initiative Observational Study and Clinical Trials | 62,492 | DXA Hologic QDR2000 or QDR4500 (Bedford, MA, USA) BMD at hip or LS | USPSTF(FRAX) ≥9.3% | 25.8 | 83.3 | 0.56 | |
| SCORE > 7 | 38.6 | 65.8 | 0.53 | ||||||
| OST < 2 | 39.8 | 60.7 | 0.52 | ||||||
| Lin et al. (2016) [55] | To validate the use of three tools in predicting new osteoporotic fractures in older Chinese men | Han Chinese men aged 50 and above | 496 | DXA Discovery Wi, QDR, Hologic (Waltham, MA, USA) BMD at FN, LS and TH | TH T-score < −1.4 | 67.57 | 65.45 | 0.711 | Subjects from a single centre Two different groups of population were involved OSTA less effective in predicting risk |
| FN T-score < −2.5 | 42.34 | 89.87 | 0.706 | ||||||
| LS T-score < −1.6 | 52.25 | 77.14 | 0.706 | ||||||
| FRAX > 2.9 | 81.98 | 62.08 | 0.738 | ||||||
| OSTA < −1.2 | 53.15 | 76.88 | 0.661 | ||||||
| Liu et al. (2017) [56] | To evaluate the performance of Singh score and OSTA in predicting hip fracture in patients with type 2 diabetes mellitus | Postmenopausal women with 87 of them (age range: 56–86 years) had a hip fracture | 261 | DXA Discovery W, Hologic, Inc. (Bedford, MA, USA) BMD at hip and LS Retrospective Singh score: Standard digital anteroposterior radiographs | LS T-score < −1.85 | 60.9 | 77 | 0.747 | Small sample size |
| TH T-score < −2.45 | 52.9 | 71.8 | 0.699 | ||||||
| FN T-score <−2.05 | 74.7 | 47.1 | 0.659 | ||||||
| Femoral trochanter T-score <−2.25 | 50.6 | 69.5 | 0.631 | ||||||
| OSTA < −2.5 | 44.8 | 73.8 | 0.534 | ||||||
| Singh index < 2.5 OSTA and Singh | 42.5 Value not mentioned | 88.2 Value not mentioned | 0.636 0.795 |
© 2018 by the authors. Licensee MDPI, Basel, Switzerland. This article is an open access article distributed under the terms and conditions of the Creative Commons Attribution (CC BY) license (http://creativecommons.org/licenses/by/4.0/).
Share and Cite
Subramaniam, S.; Ima-Nirwana, S.; Chin, K.-Y. Performance of Osteoporosis Self-Assessment Tool (OST) in Predicting Osteoporosis—A Review. Int. J. Environ. Res. Public Health 2018, 15, 1445. https://doi.org/10.3390/ijerph15071445
Subramaniam S, Ima-Nirwana S, Chin K-Y. Performance of Osteoporosis Self-Assessment Tool (OST) in Predicting Osteoporosis—A Review. International Journal of Environmental Research and Public Health. 2018; 15(7):1445. https://doi.org/10.3390/ijerph15071445
Chicago/Turabian StyleSubramaniam, Shaanthana, Soelaiman Ima-Nirwana, and Kok-Yong Chin. 2018. "Performance of Osteoporosis Self-Assessment Tool (OST) in Predicting Osteoporosis—A Review" International Journal of Environmental Research and Public Health 15, no. 7: 1445. https://doi.org/10.3390/ijerph15071445
APA StyleSubramaniam, S., Ima-Nirwana, S., & Chin, K.-Y. (2018). Performance of Osteoporosis Self-Assessment Tool (OST) in Predicting Osteoporosis—A Review. International Journal of Environmental Research and Public Health, 15(7), 1445. https://doi.org/10.3390/ijerph15071445