A Computational Fluid Dynamic (CFD) Simulation of PM10 Dispersion Caused by Rail Transit Construction Activity: A Real Urban Street Canyon Model


Abstract
:1. Introduction
2. Literature Review
2.1. Method of Analysis
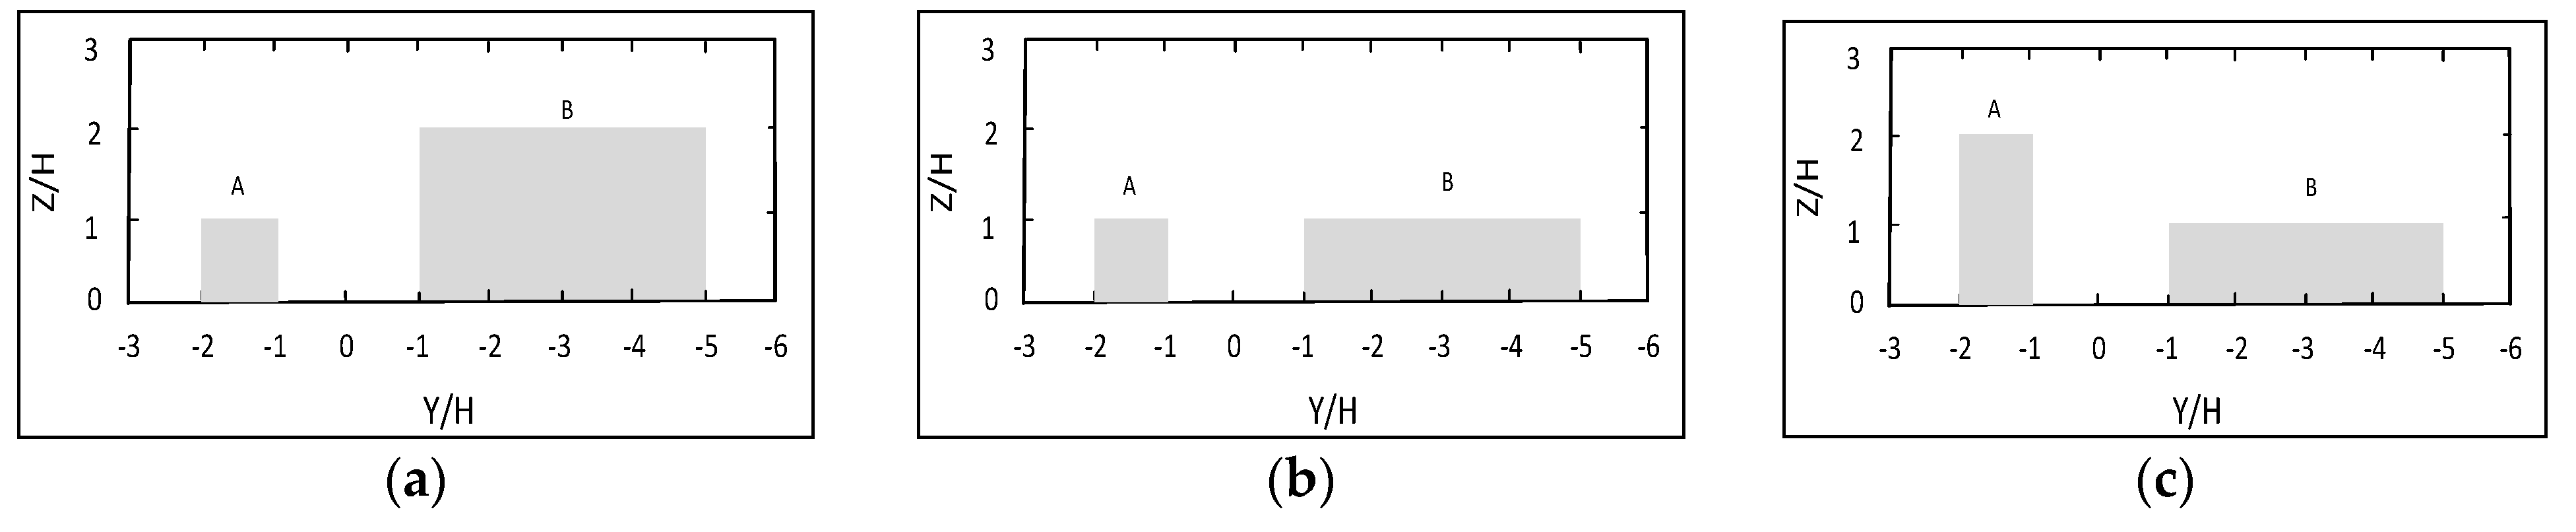
2.2. Canyon Configurations
3. Methodology
4. Case Study
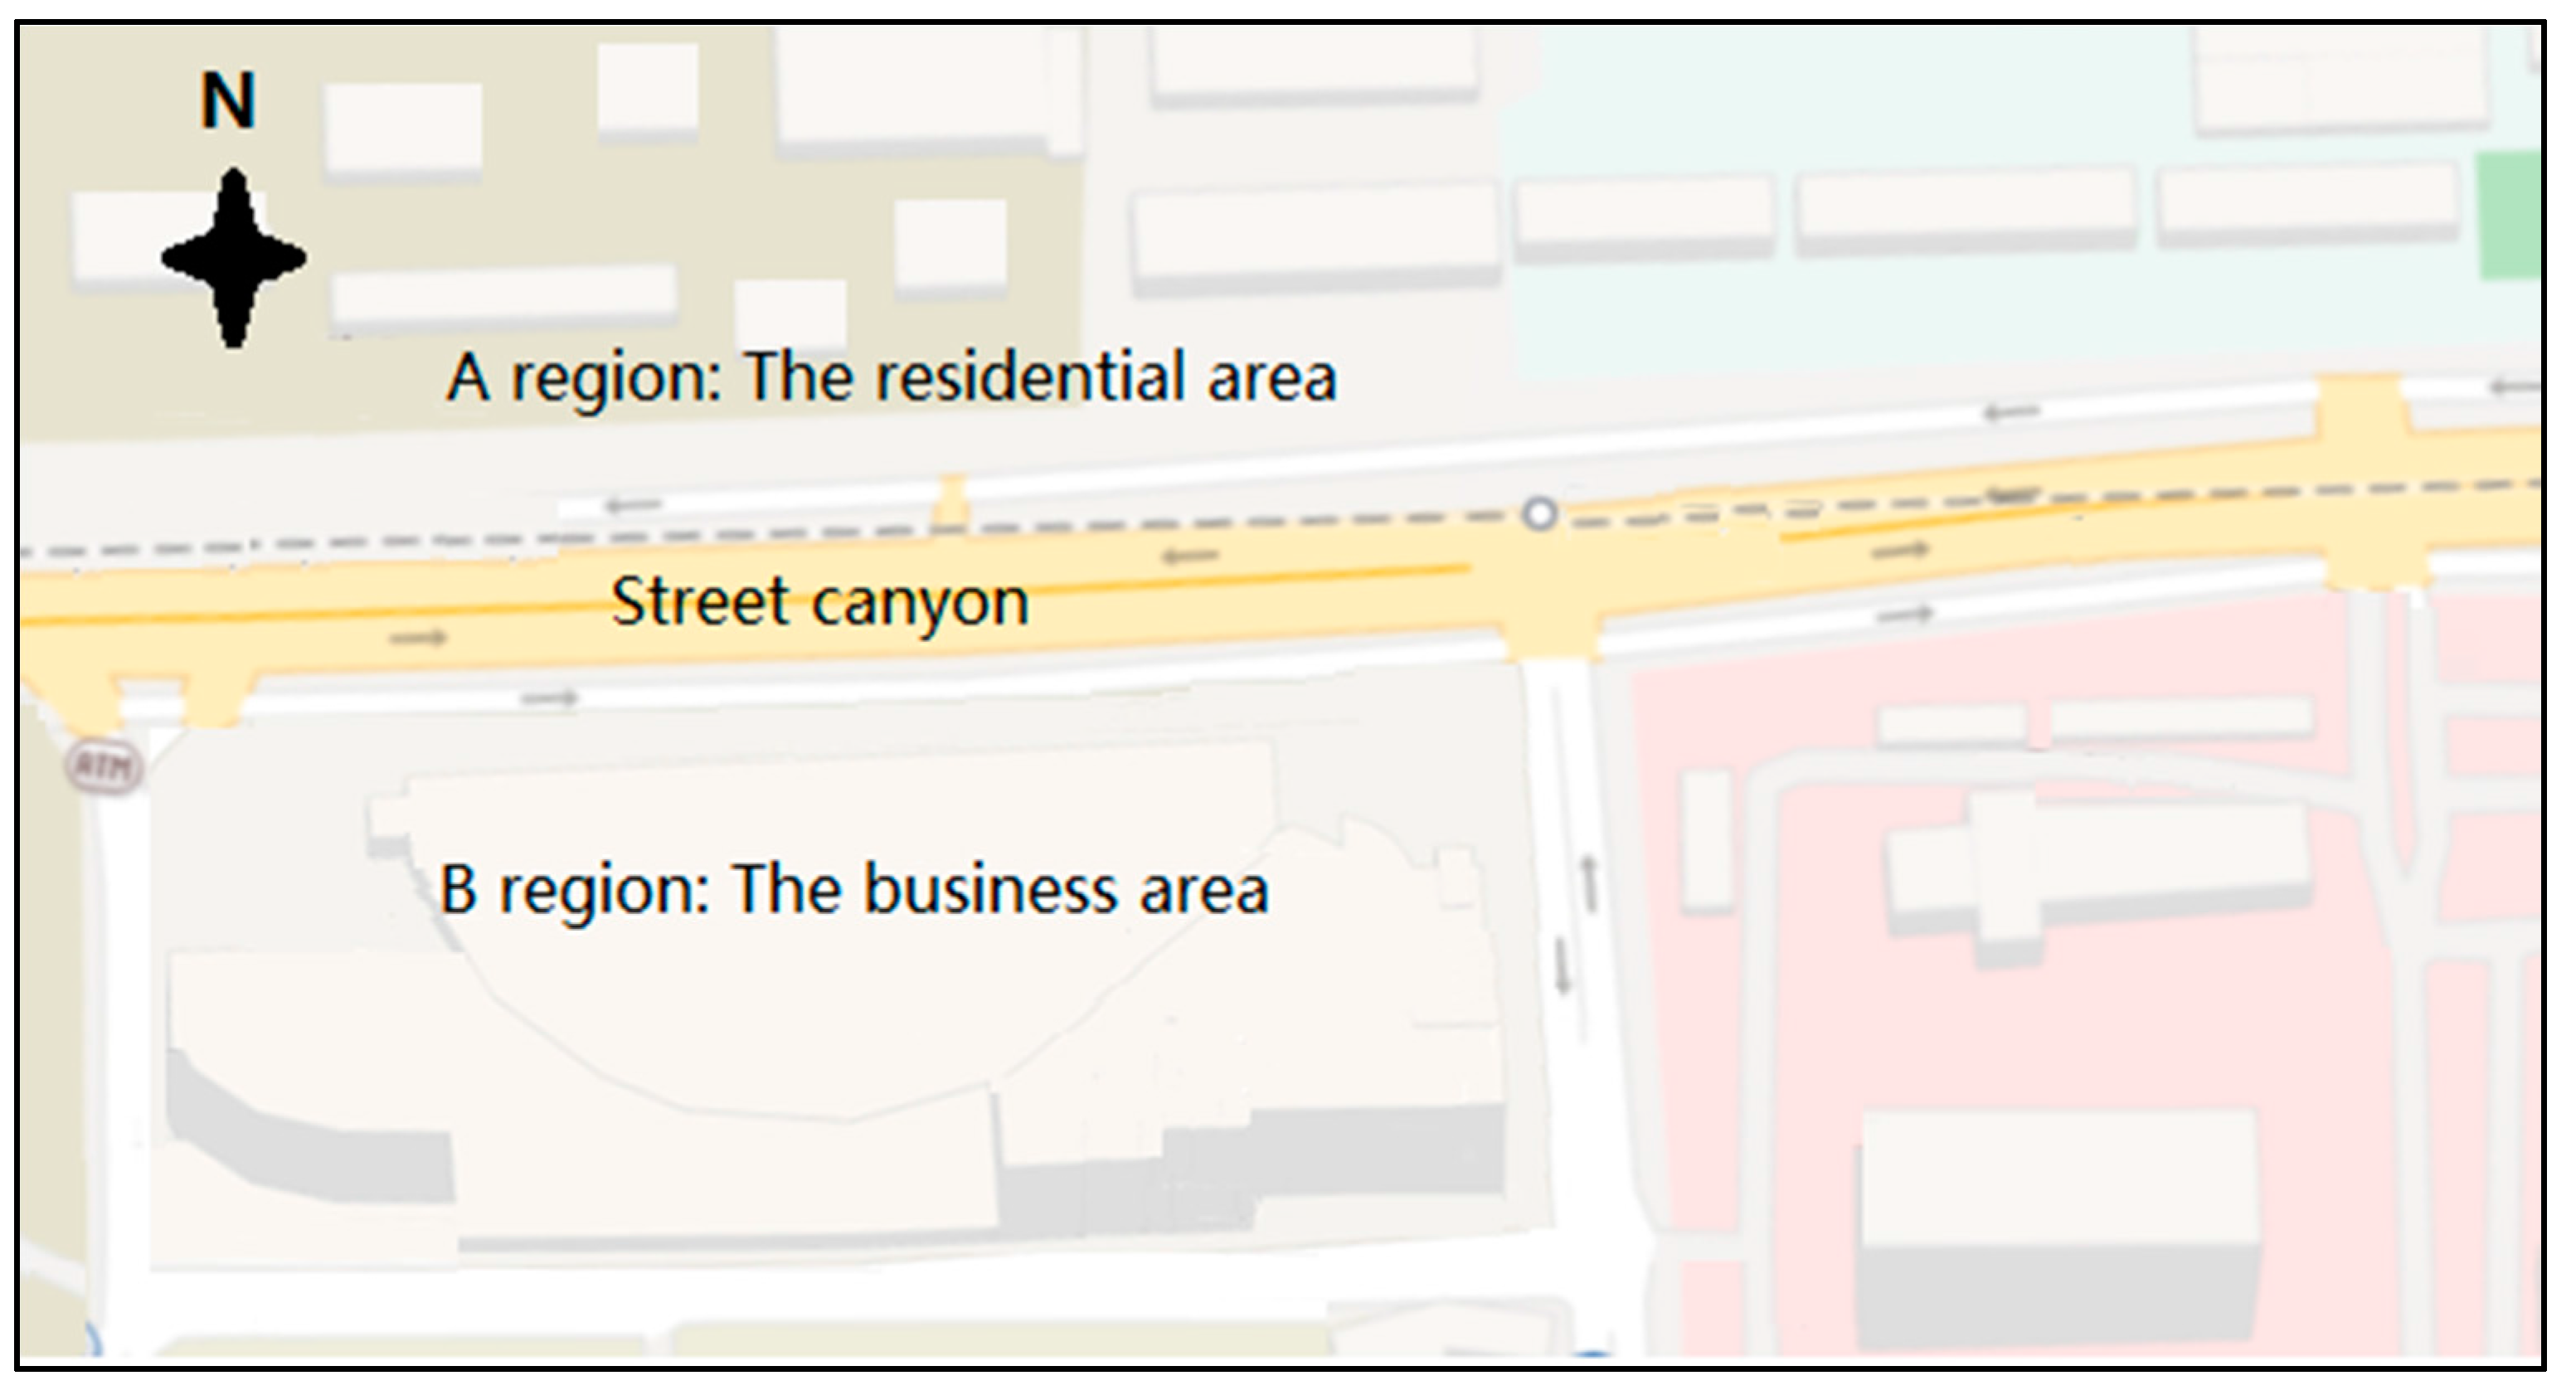
4.1. Case Selection
4.2. Geometric Model
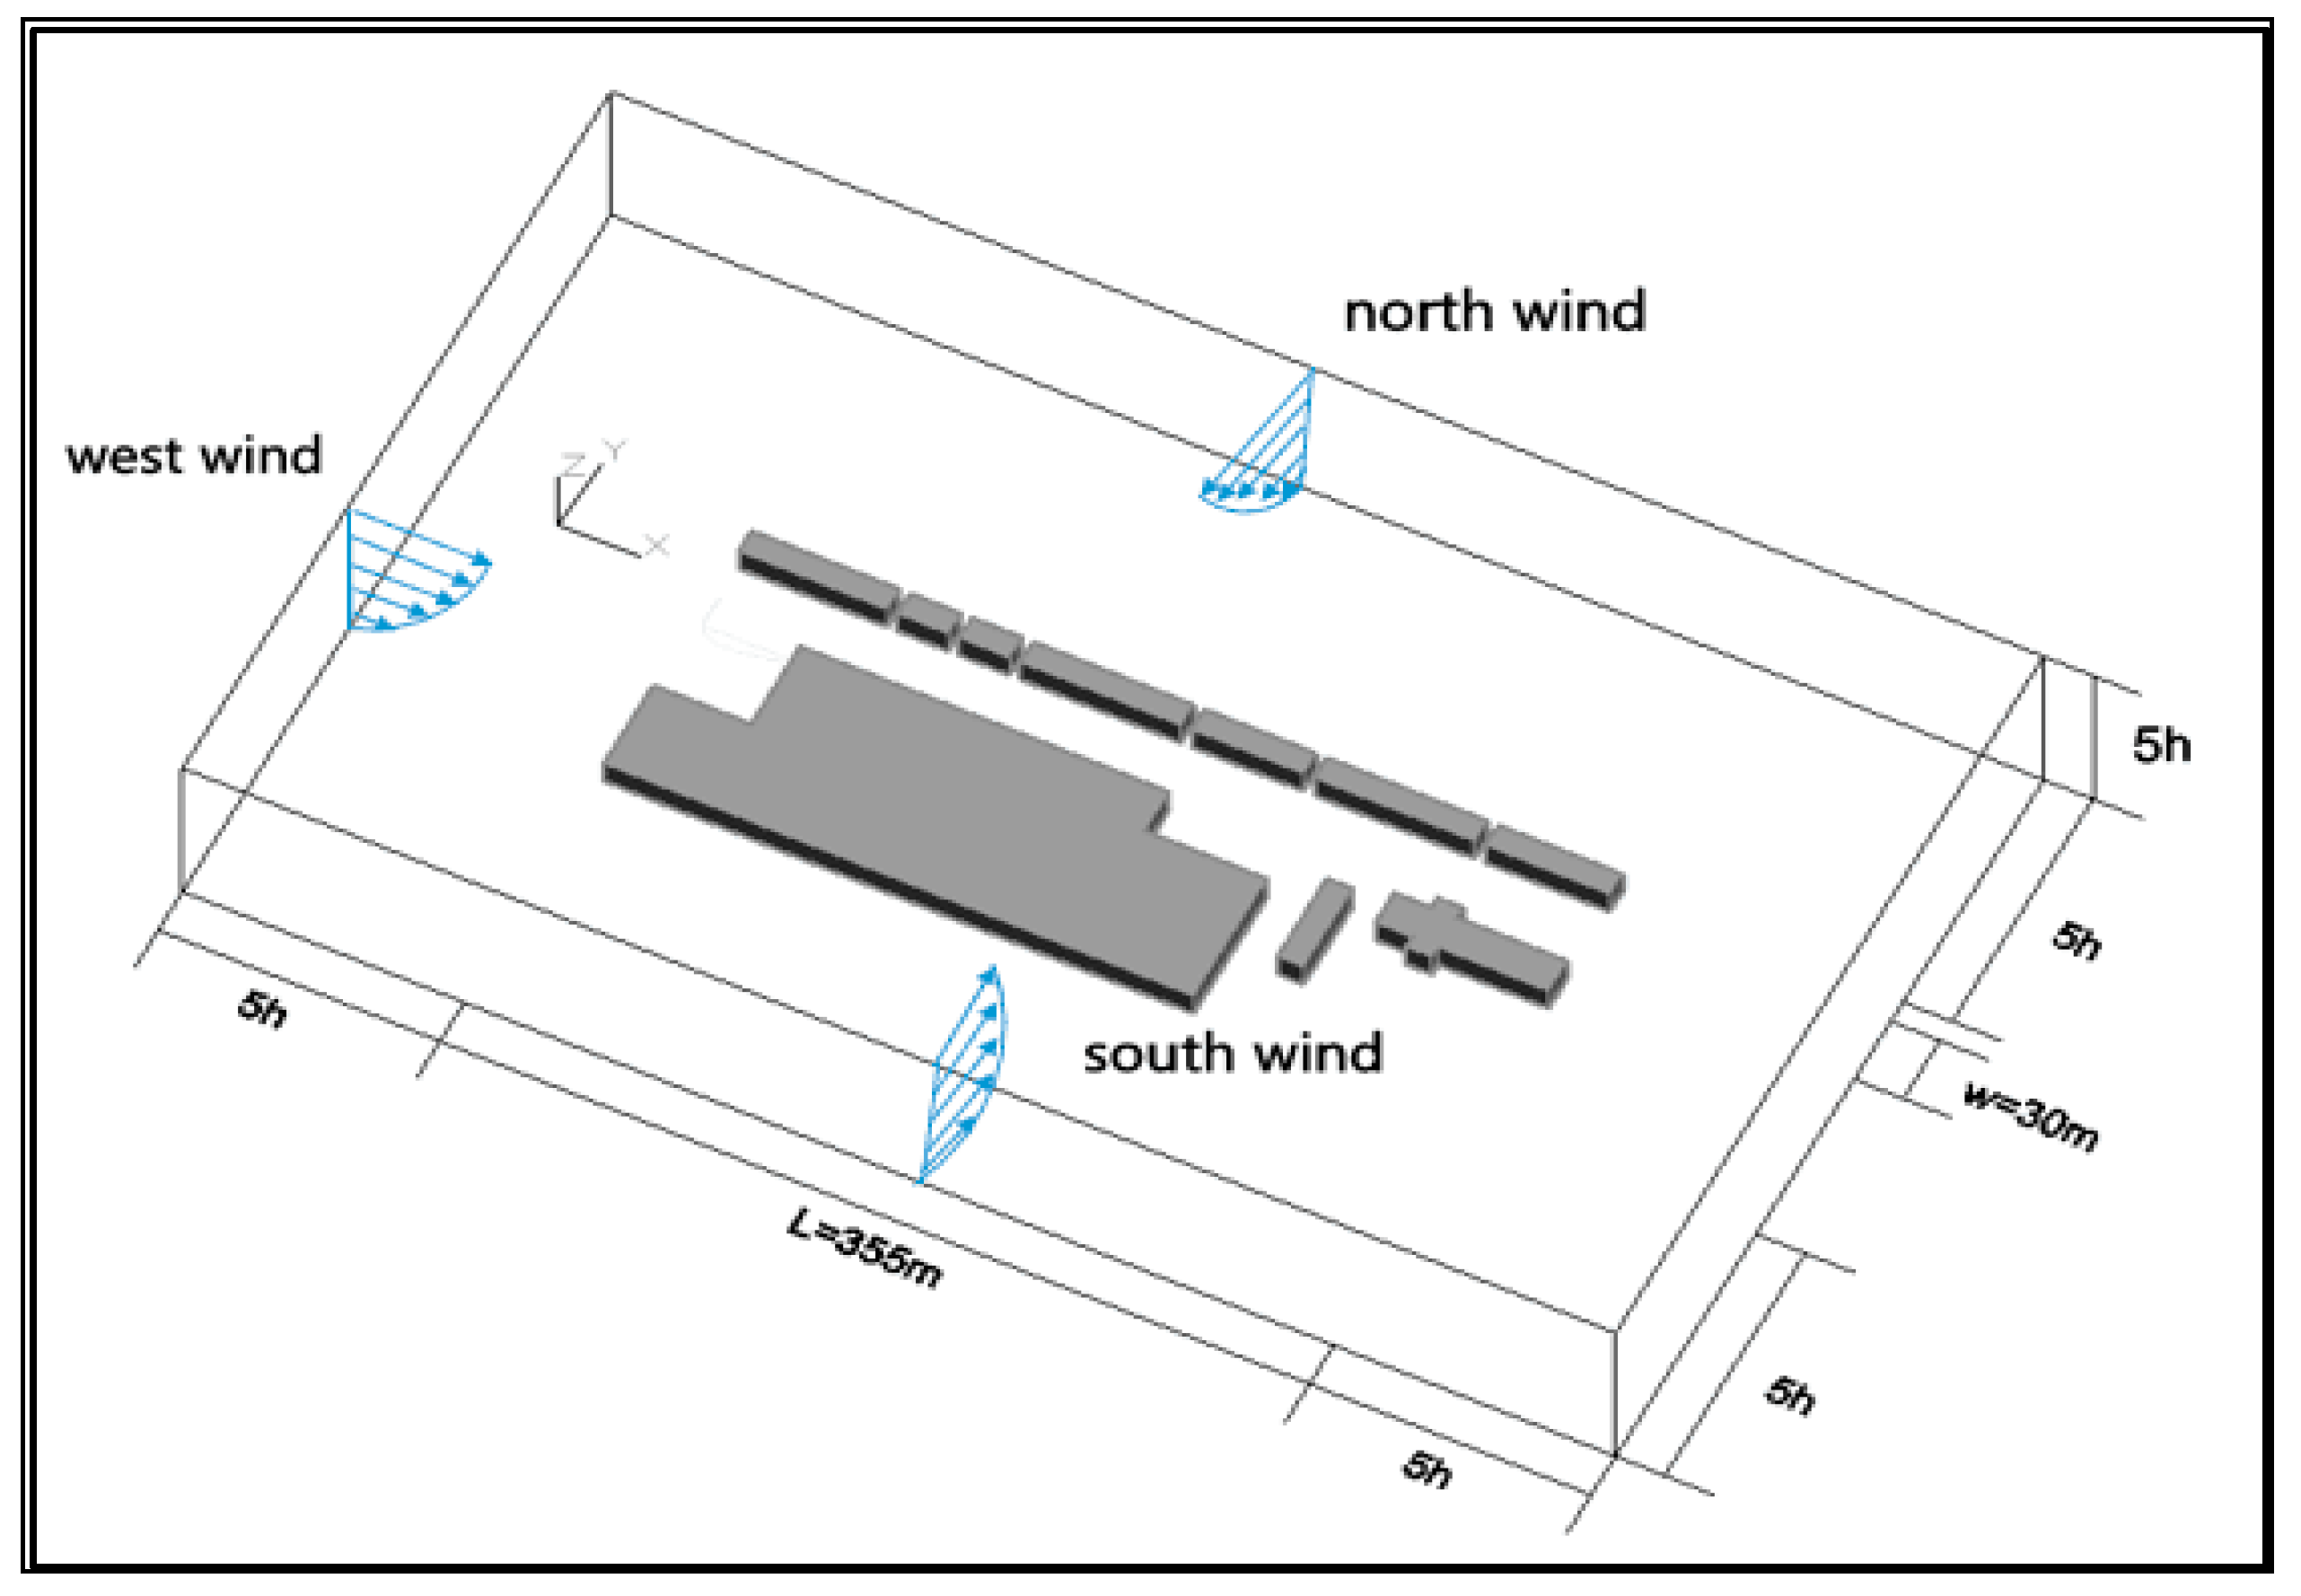
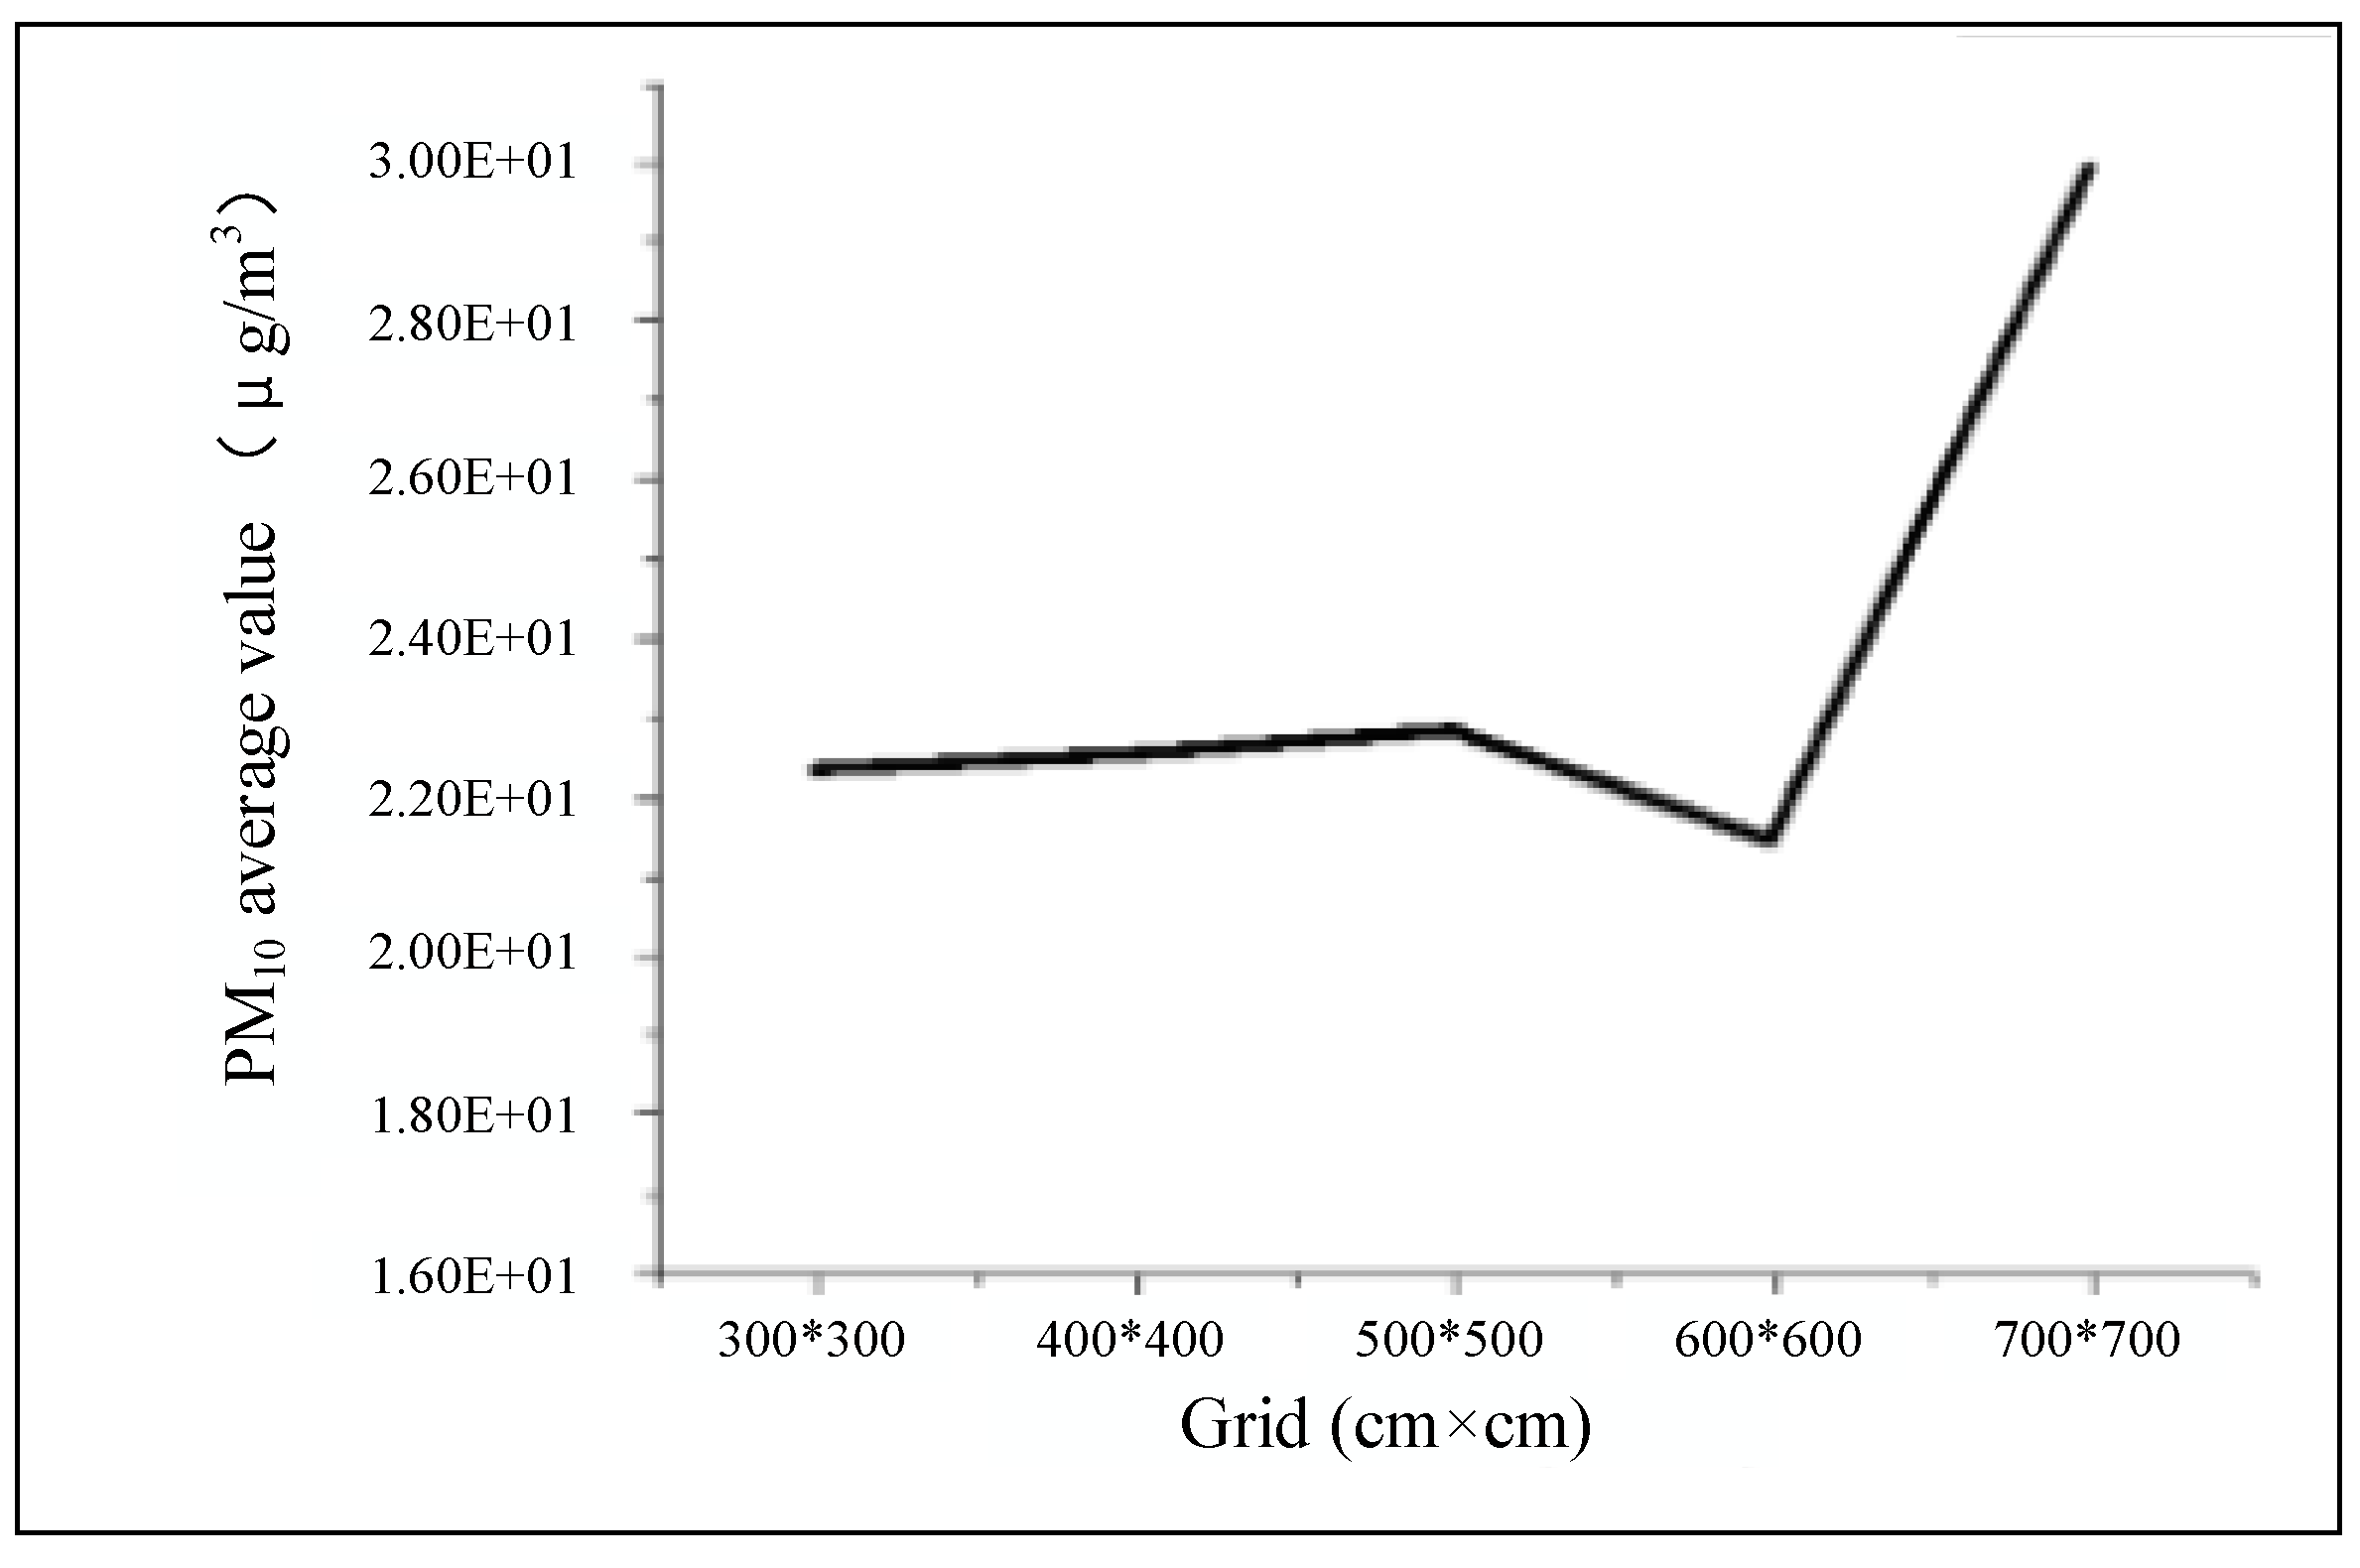
4.2.1. The Computational Domain
4.2.2. The Base and Virtual Model
4.3. Parameter Definitions
4.3.1. Wind Speed
4.3.2. Emission-Source Rate
5. Validation of Numerical Simulation Results
6. Results
6.1. Influence of Height Ratio
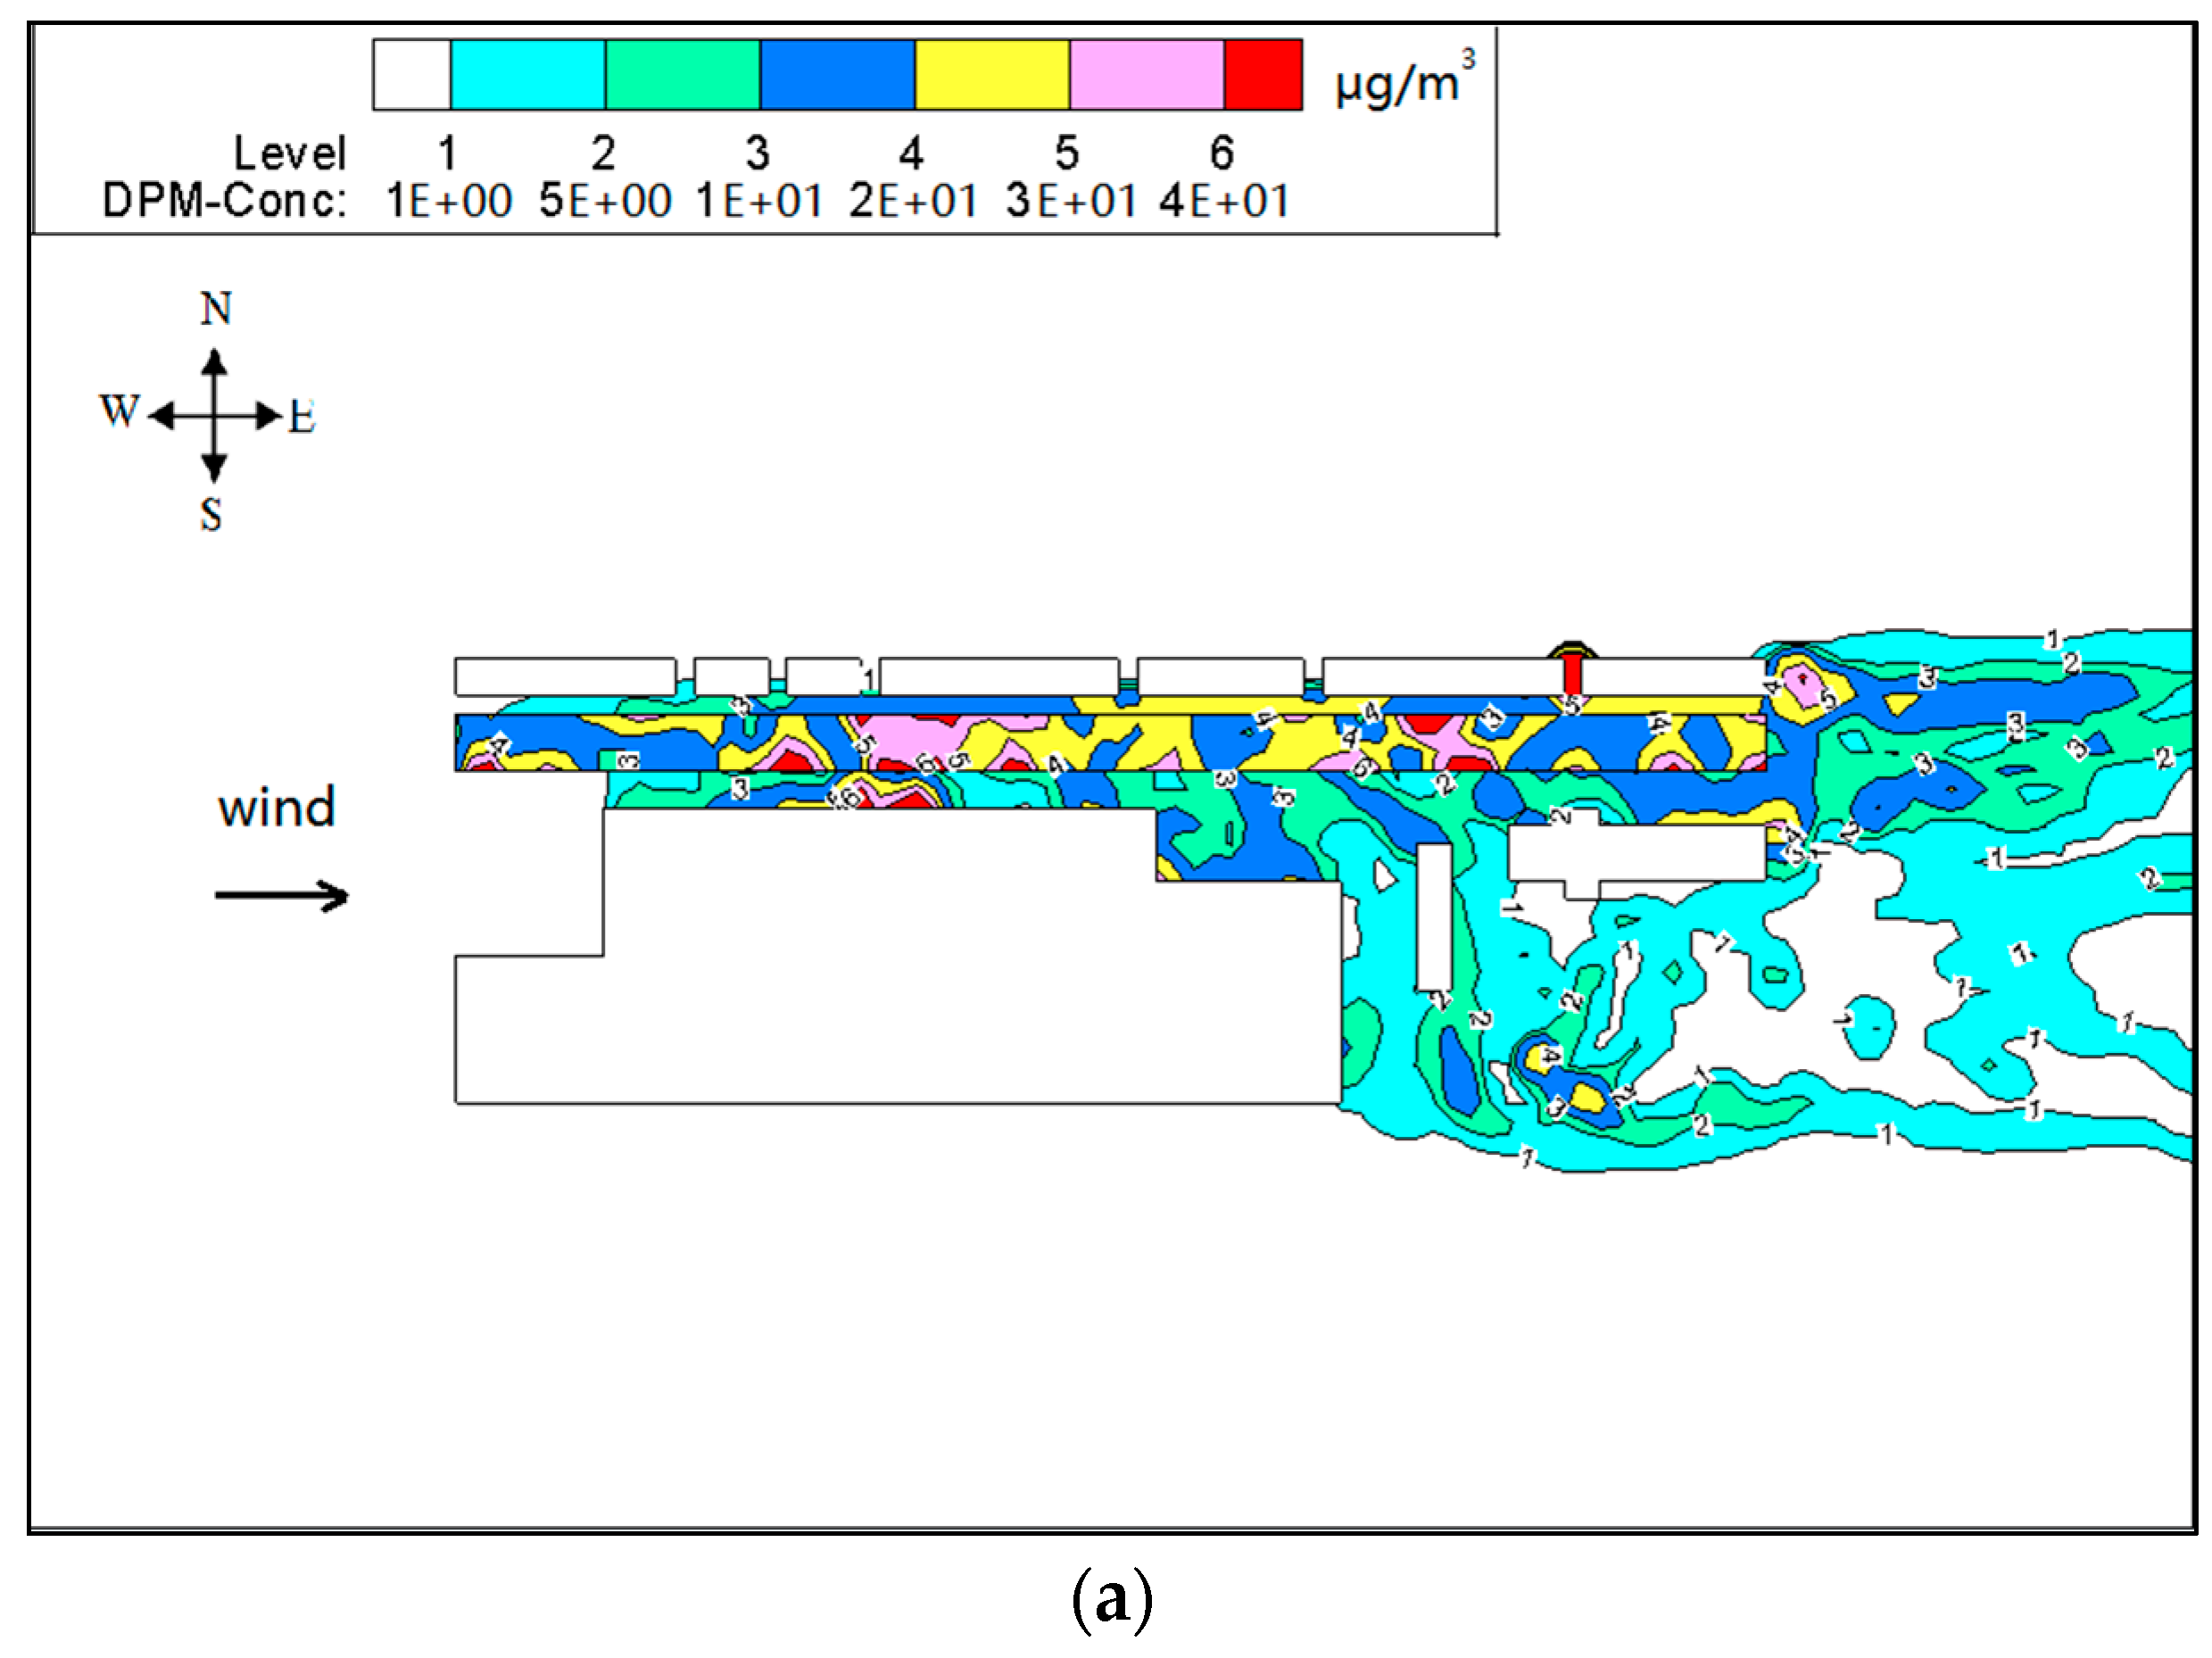
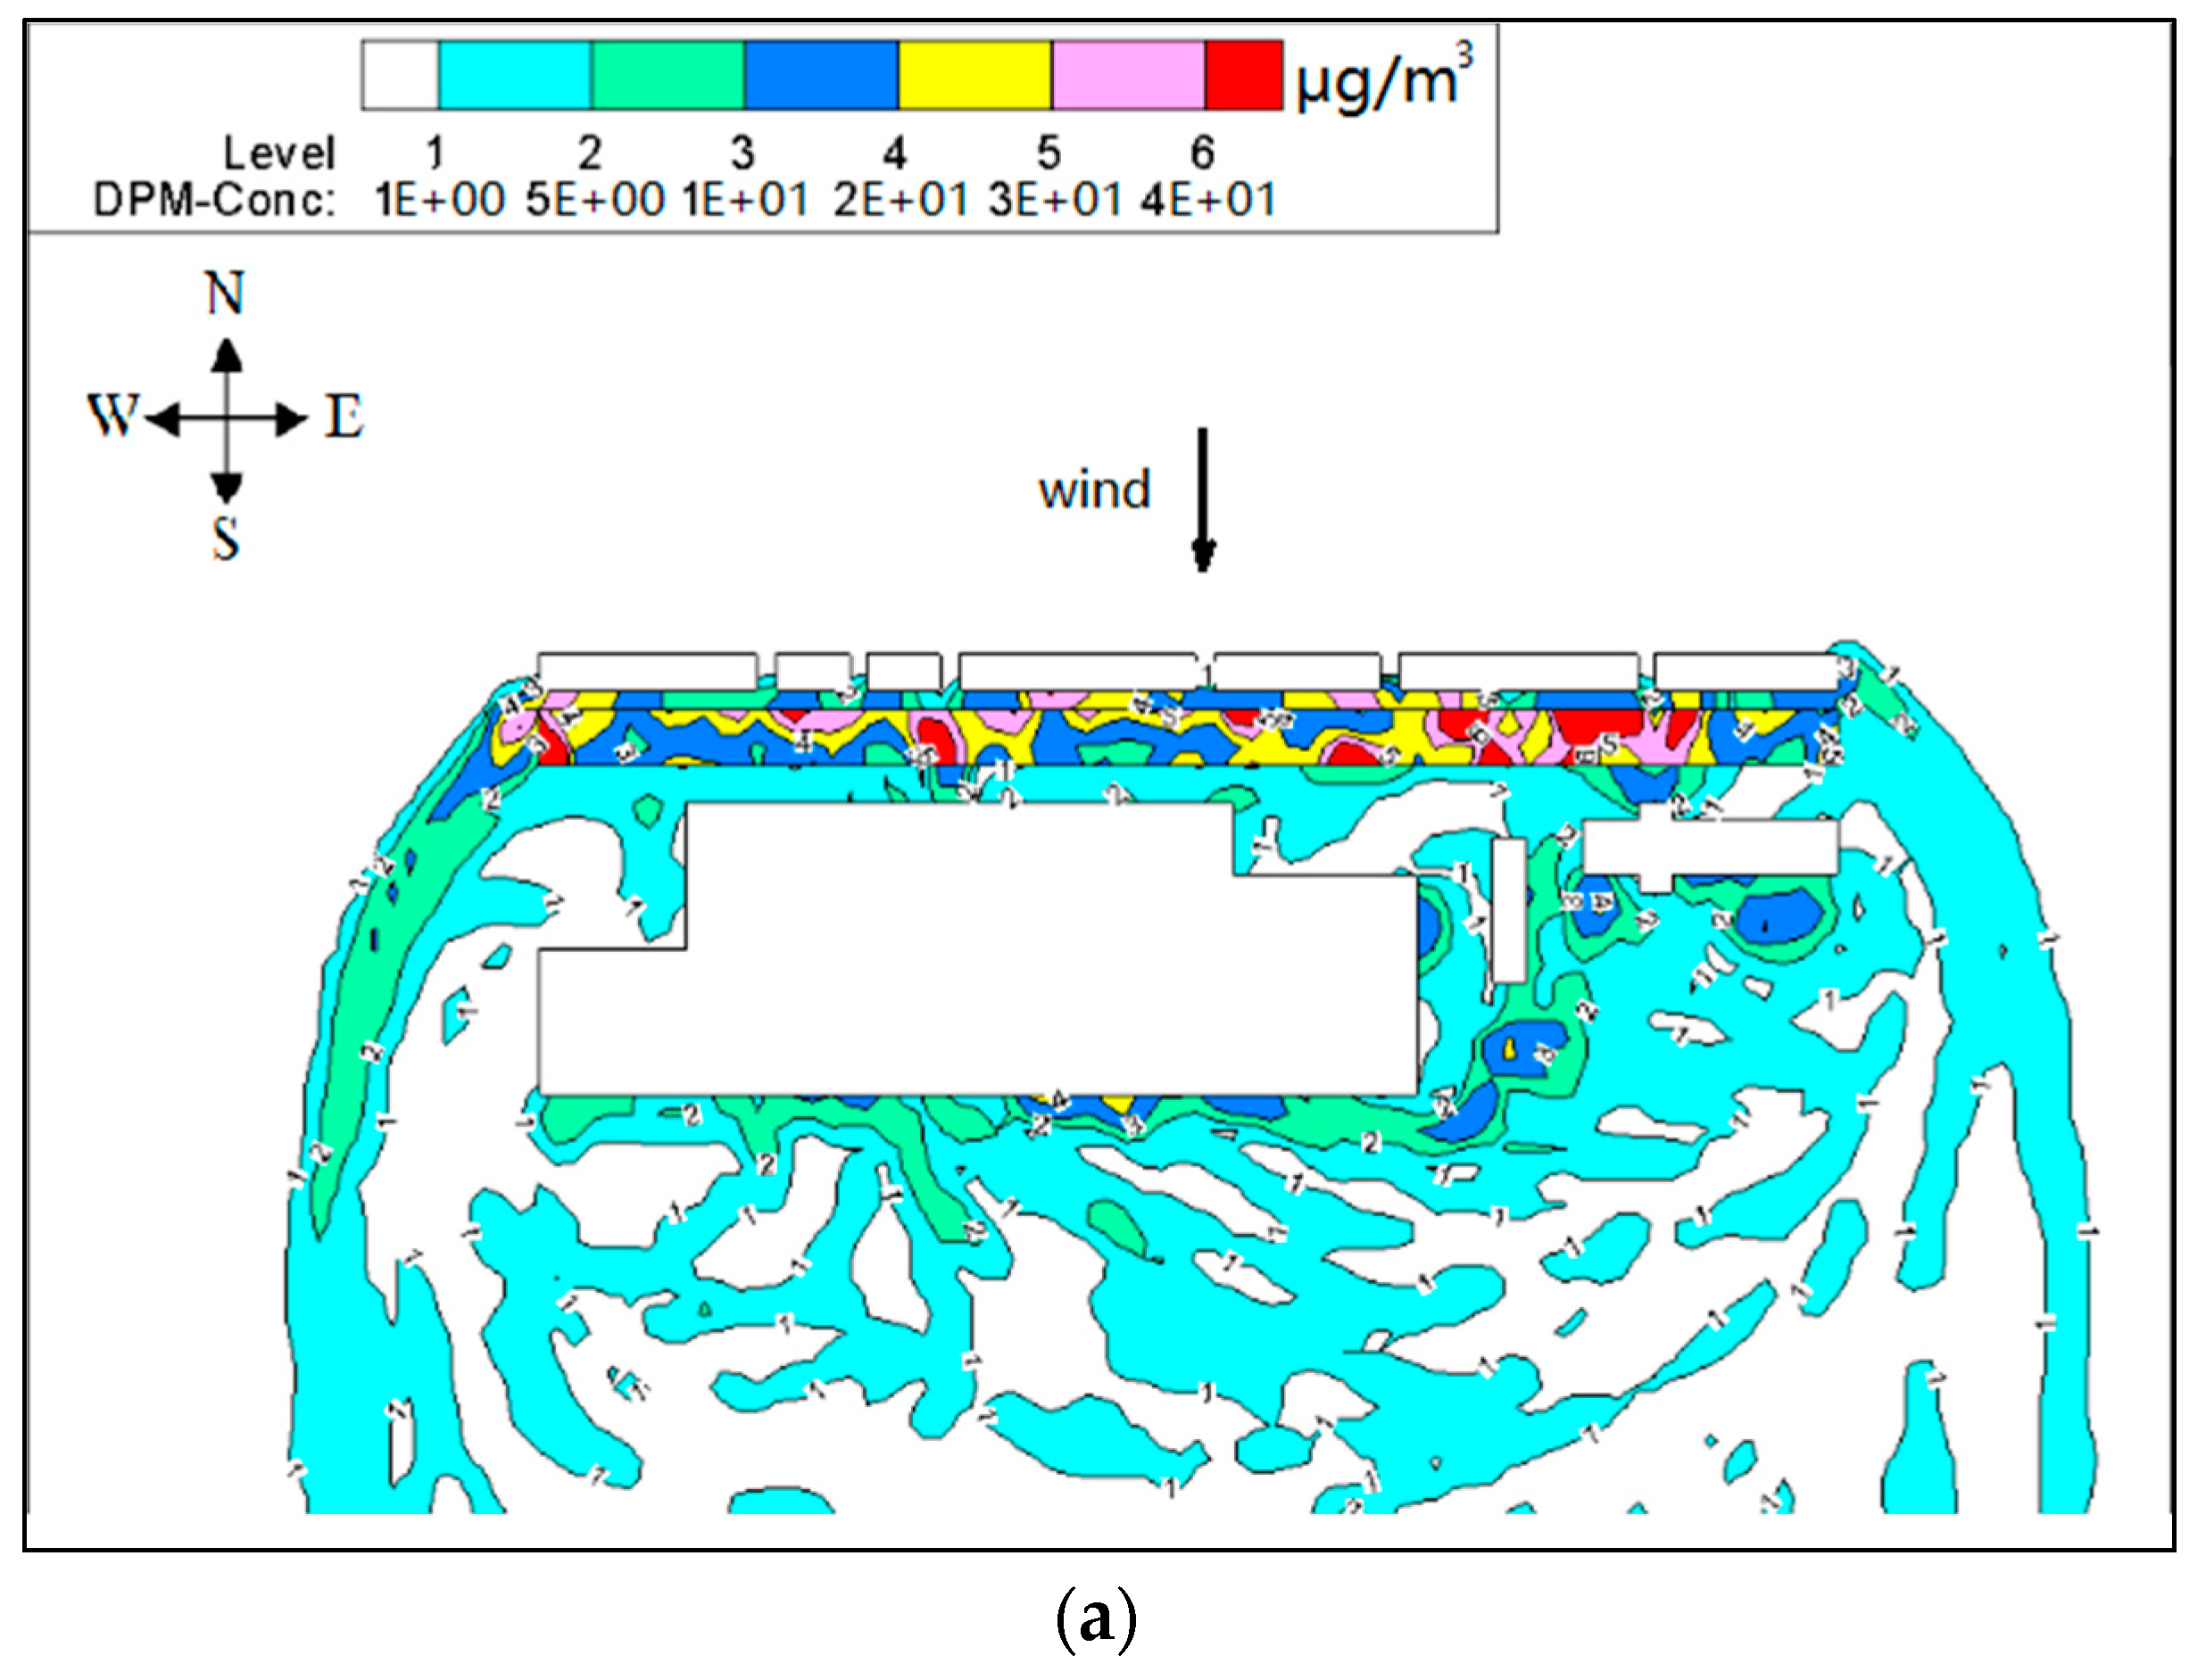
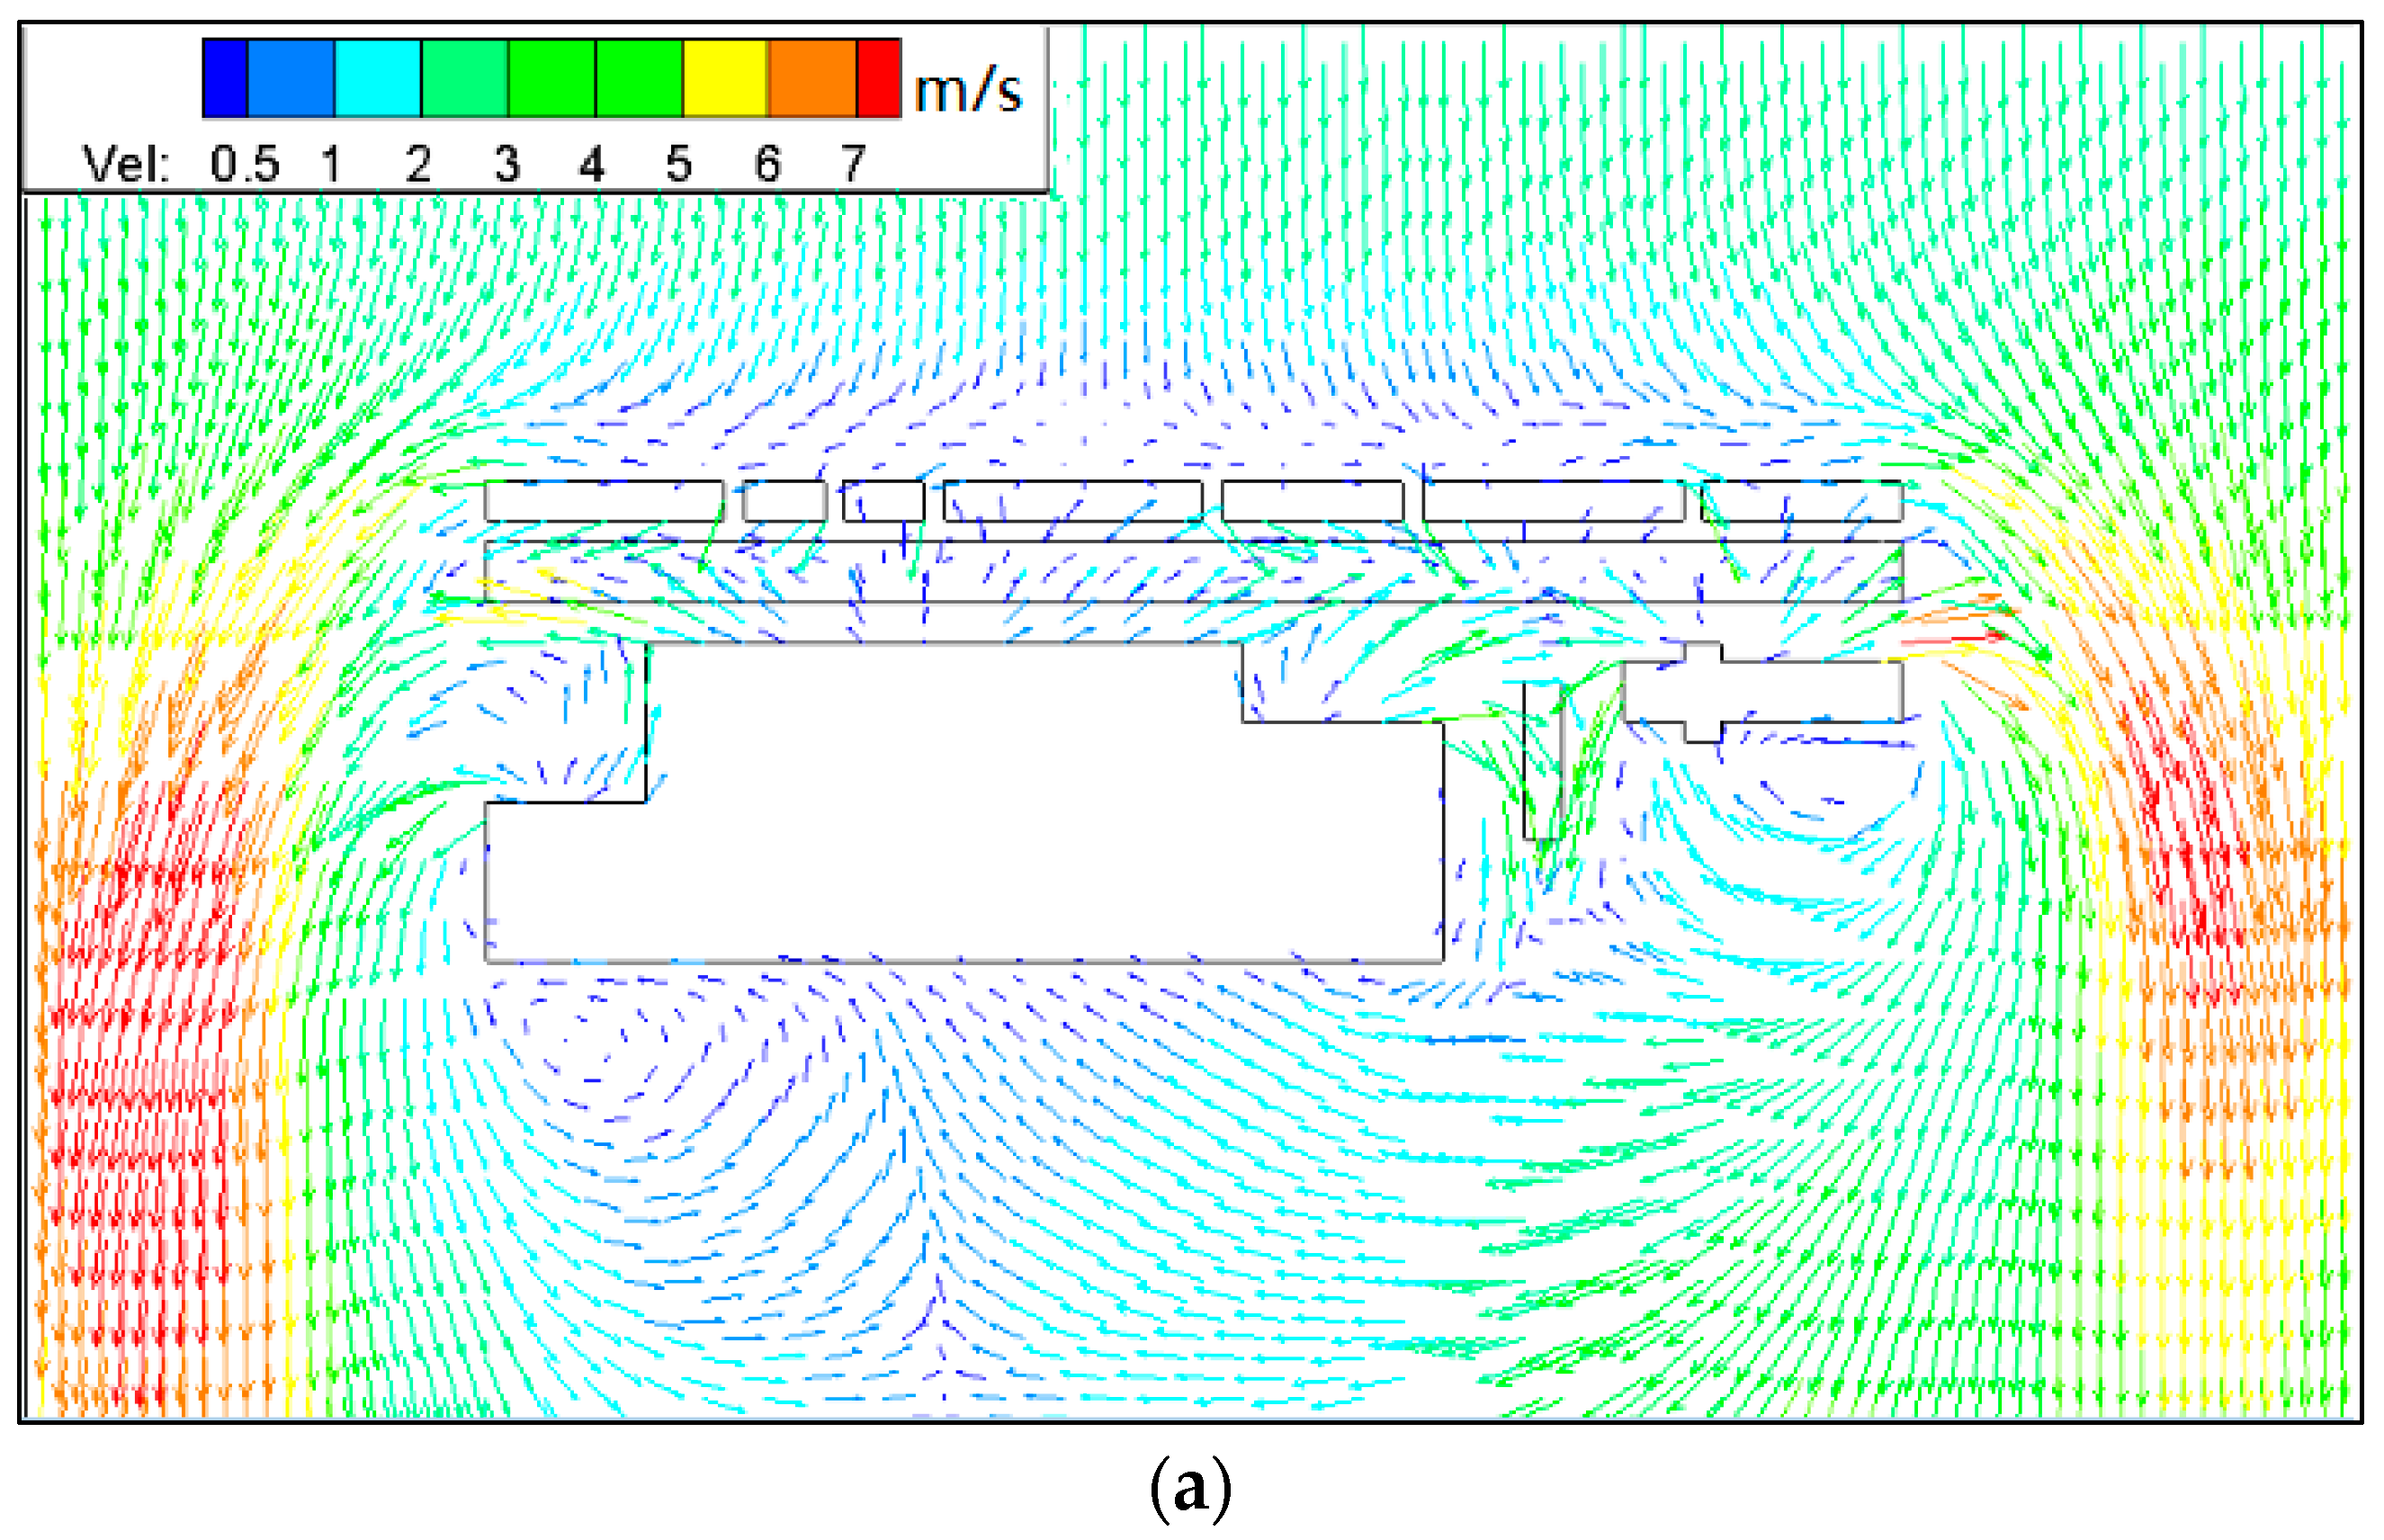
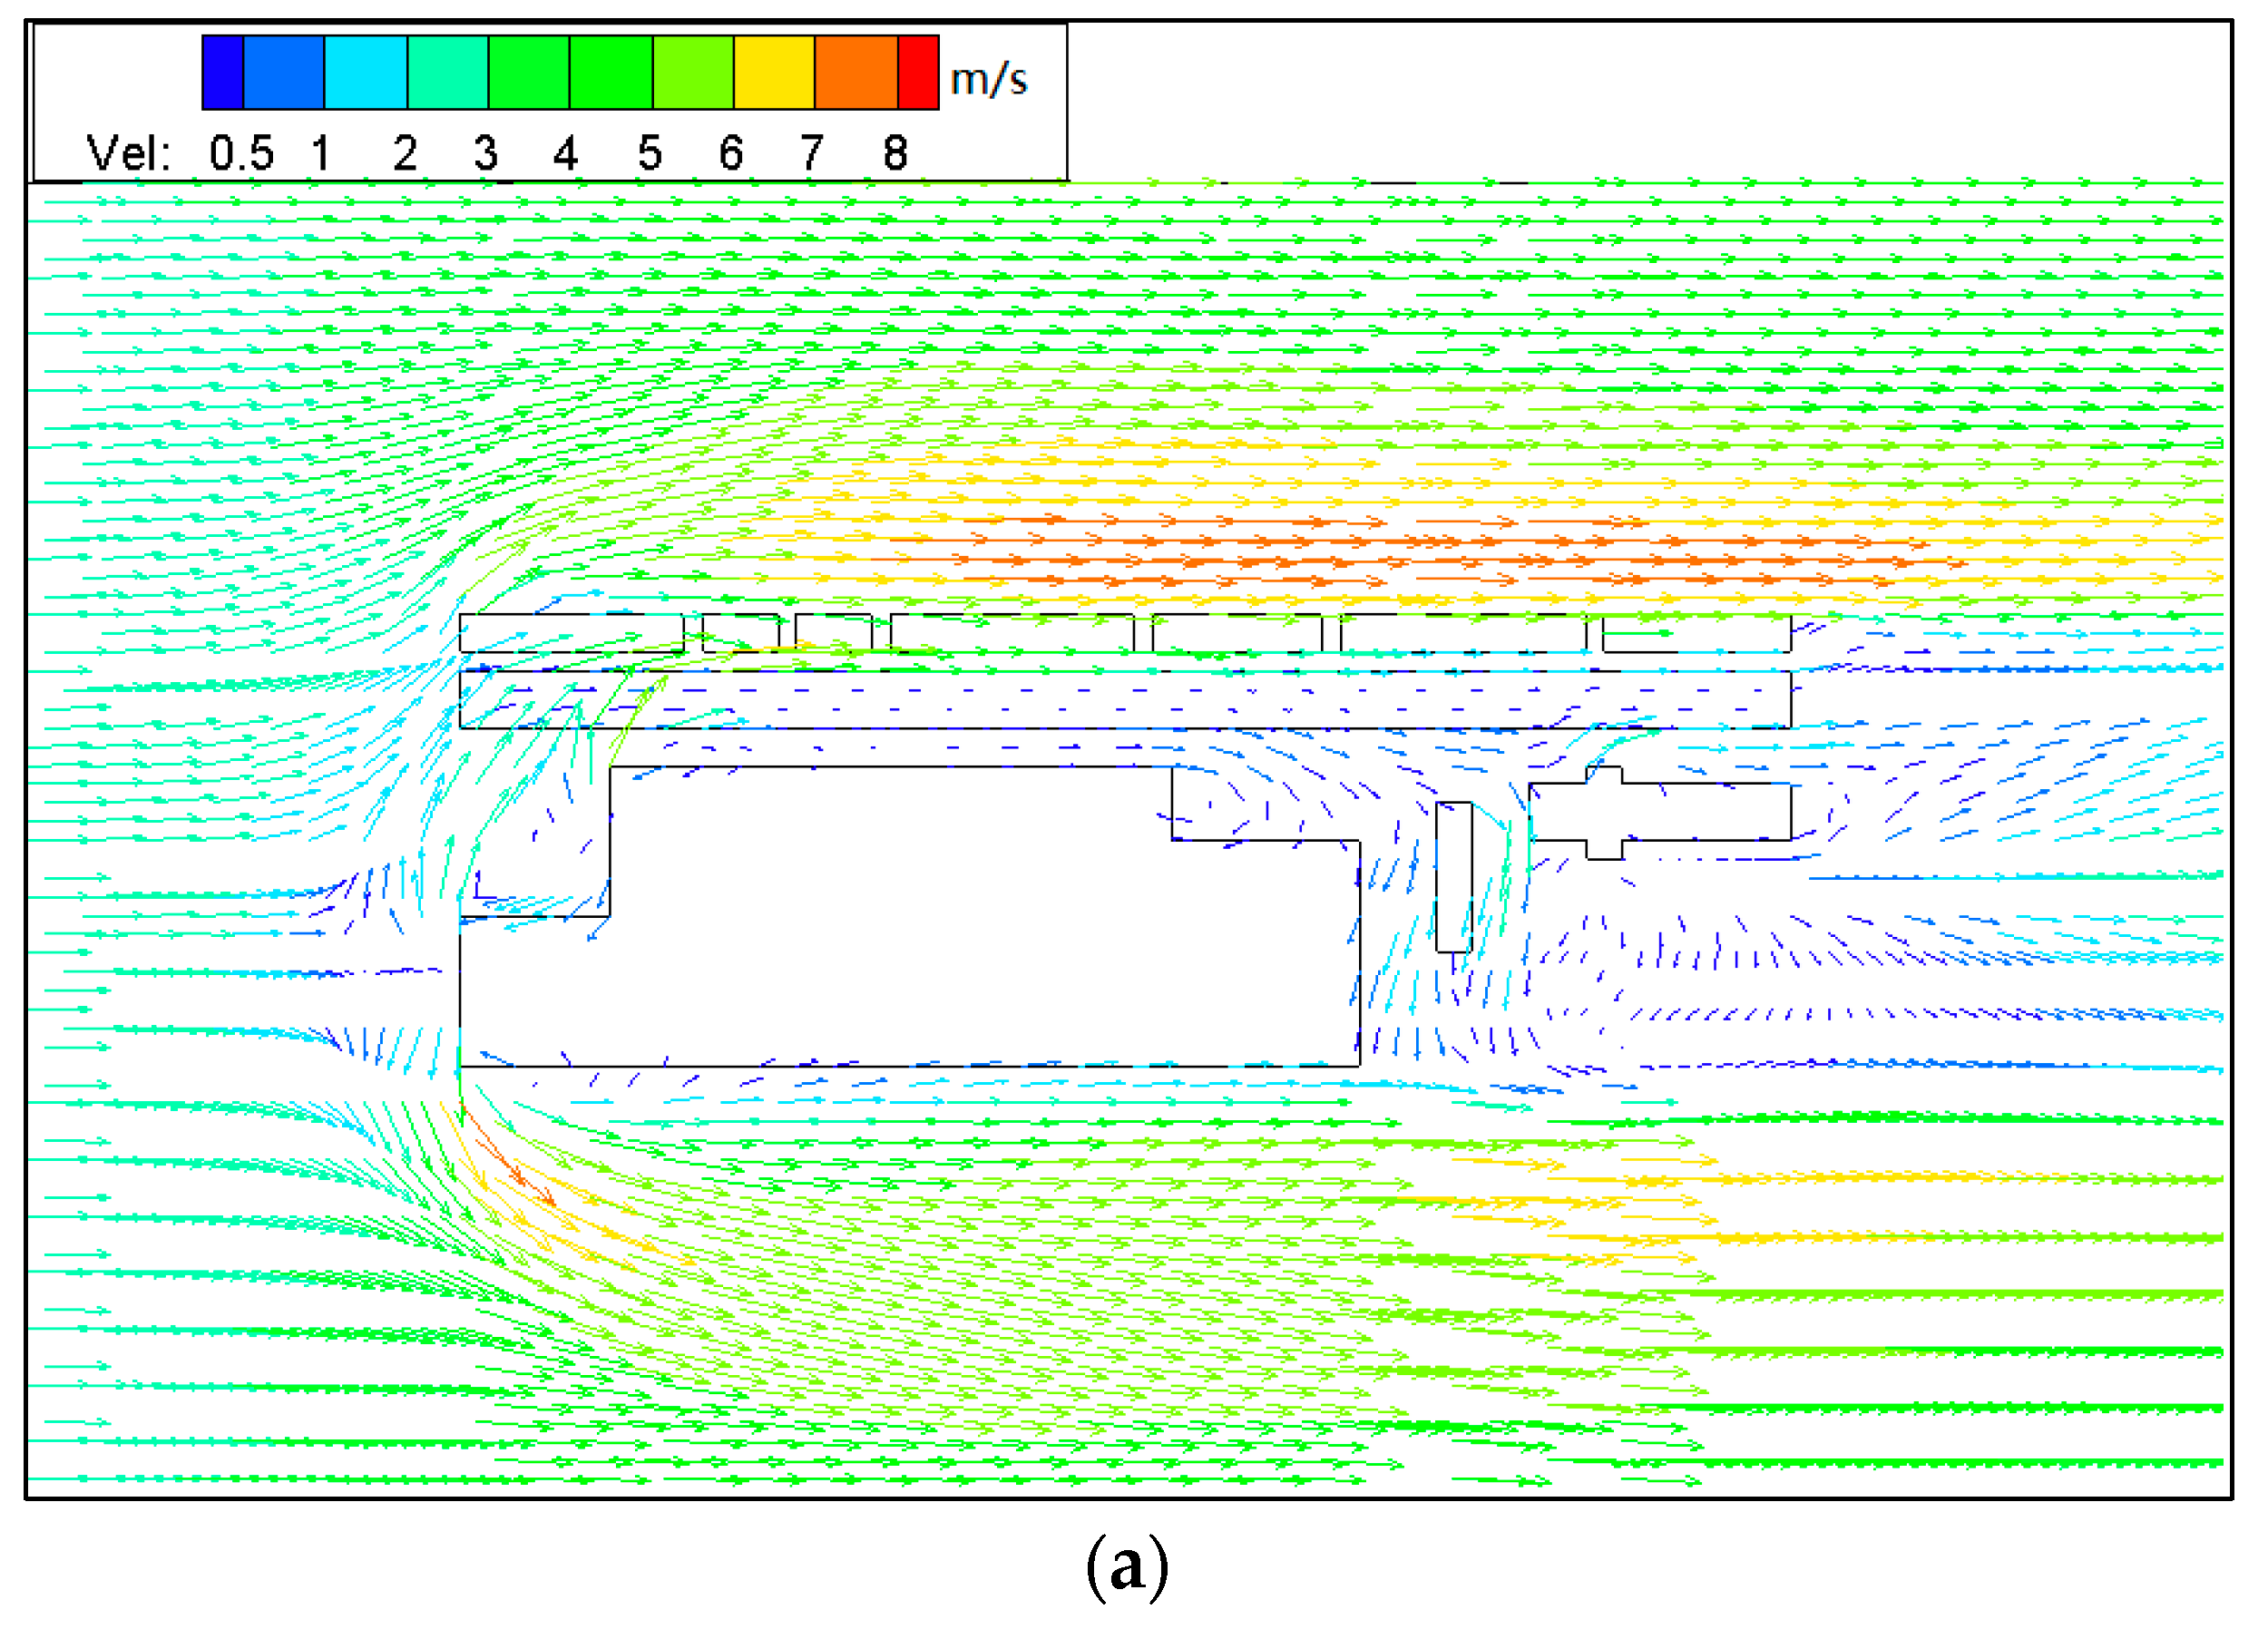
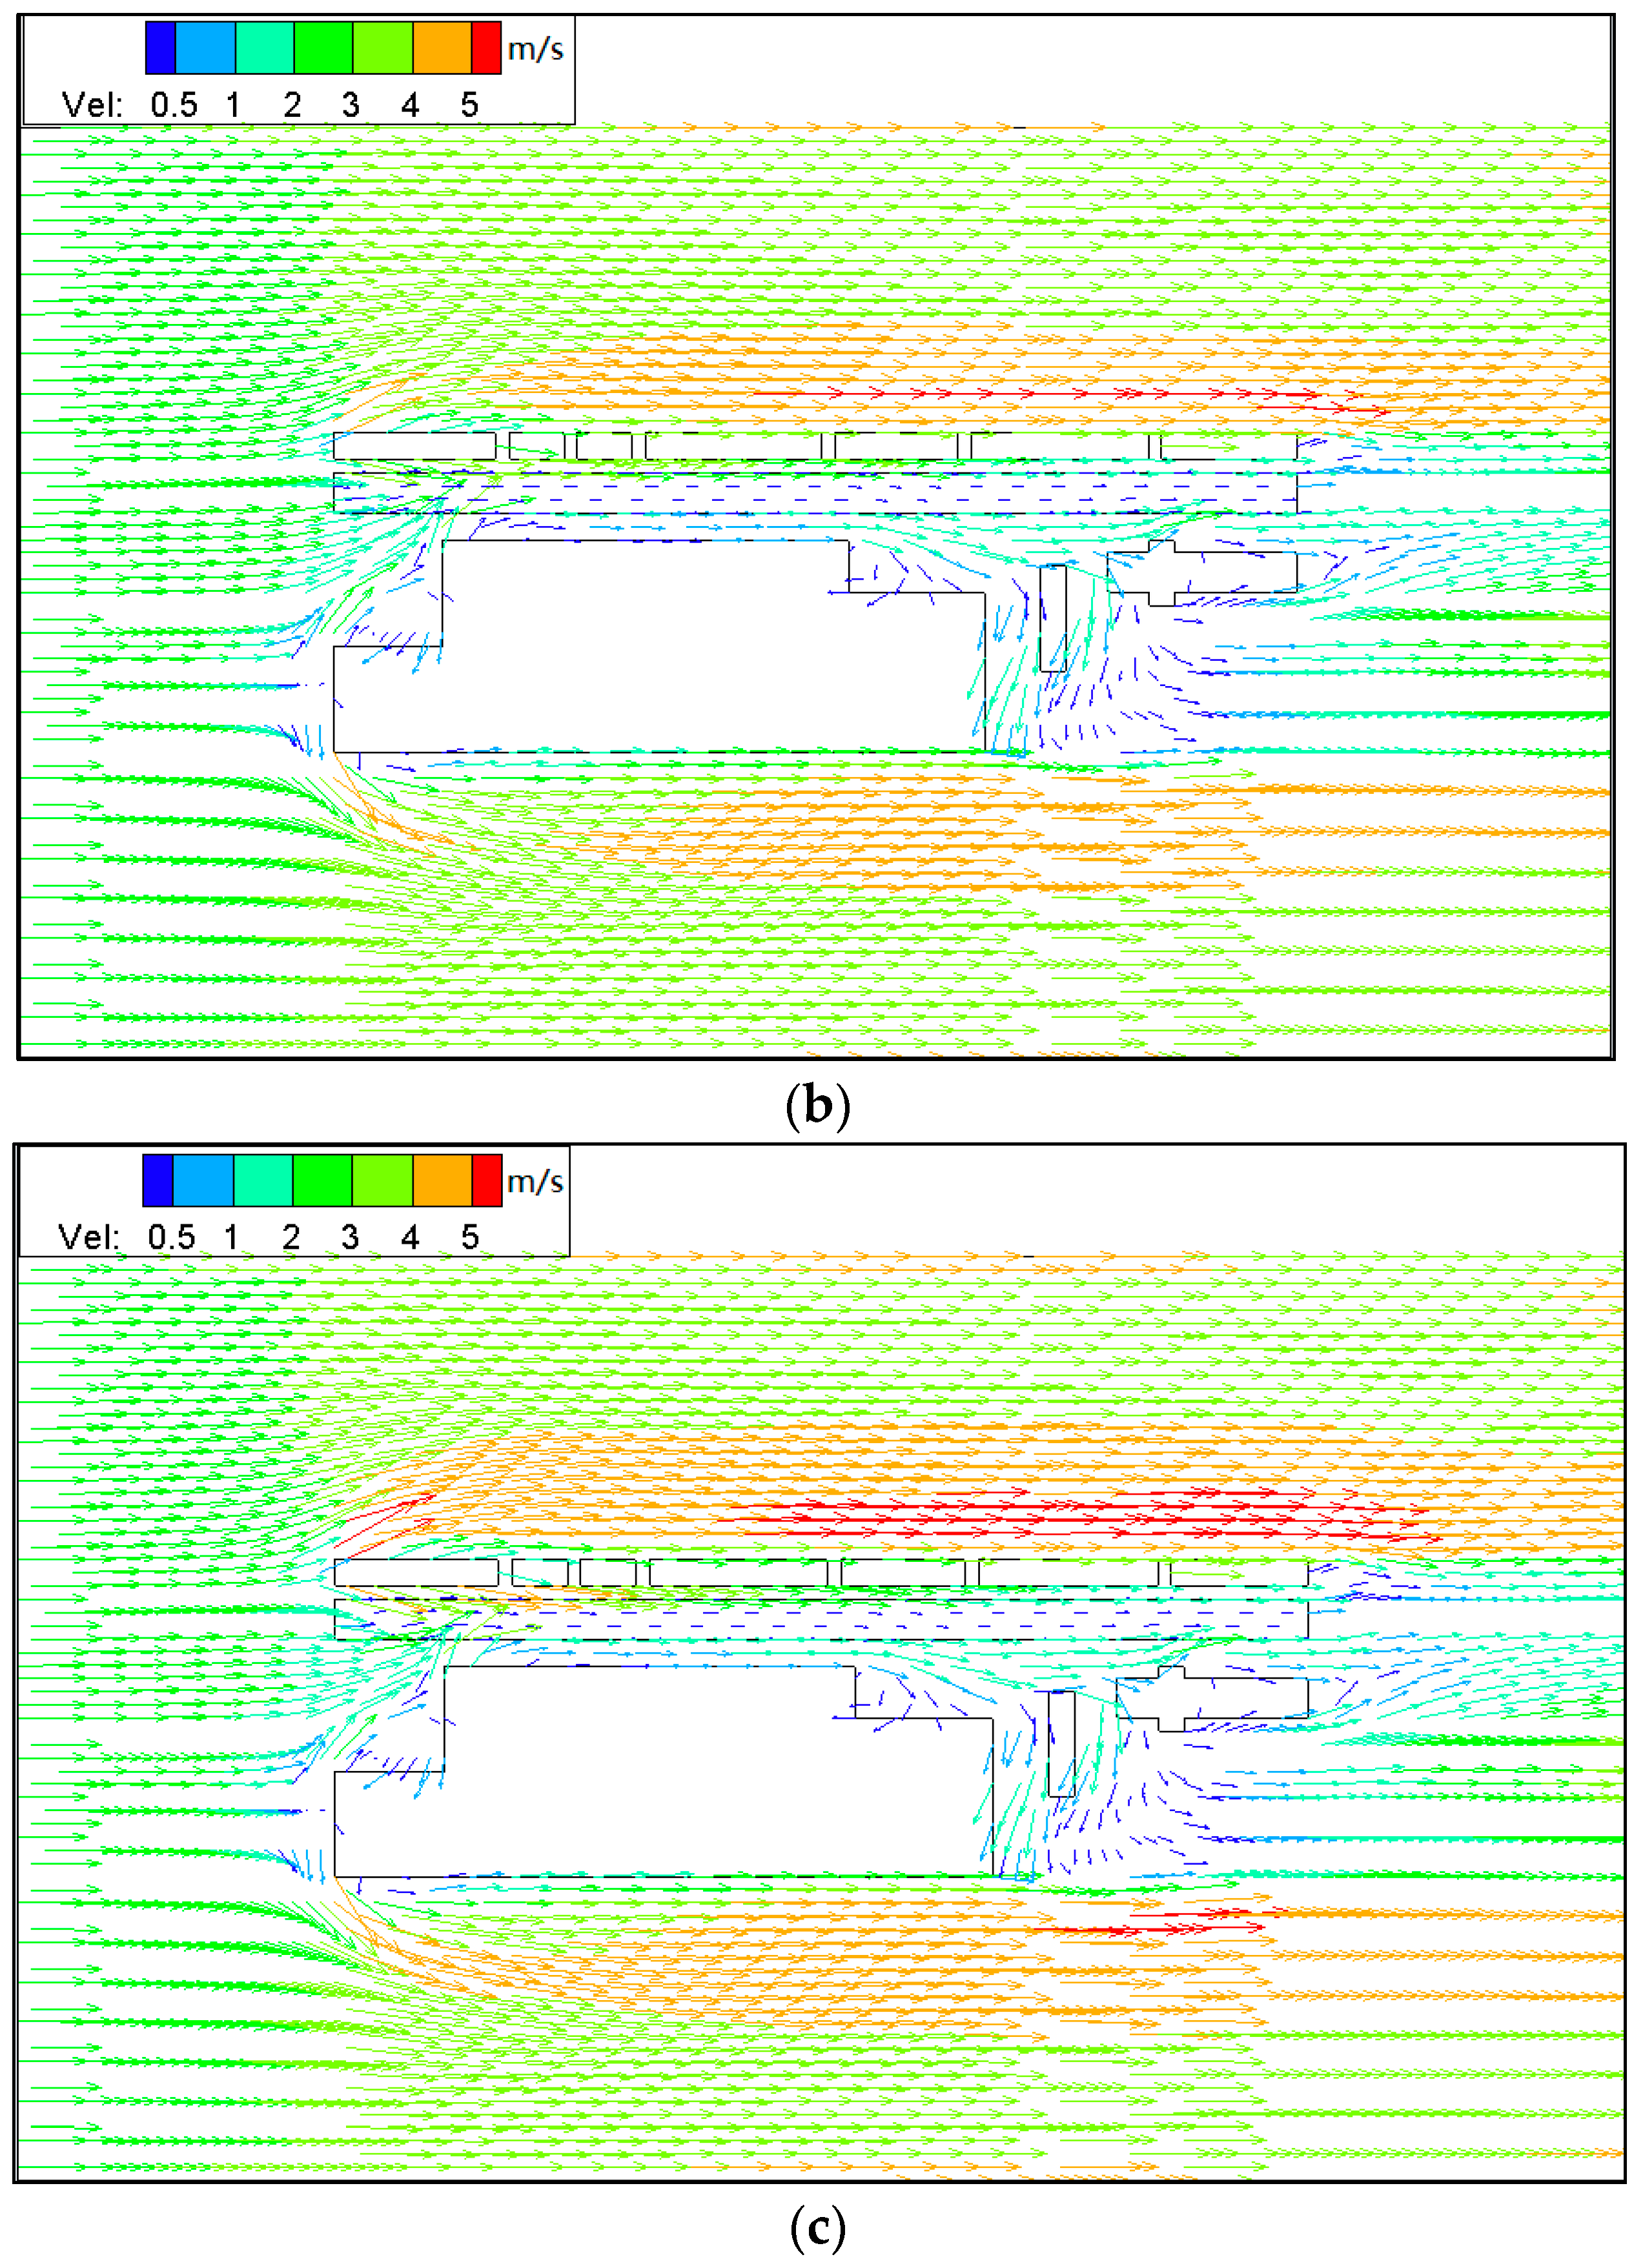
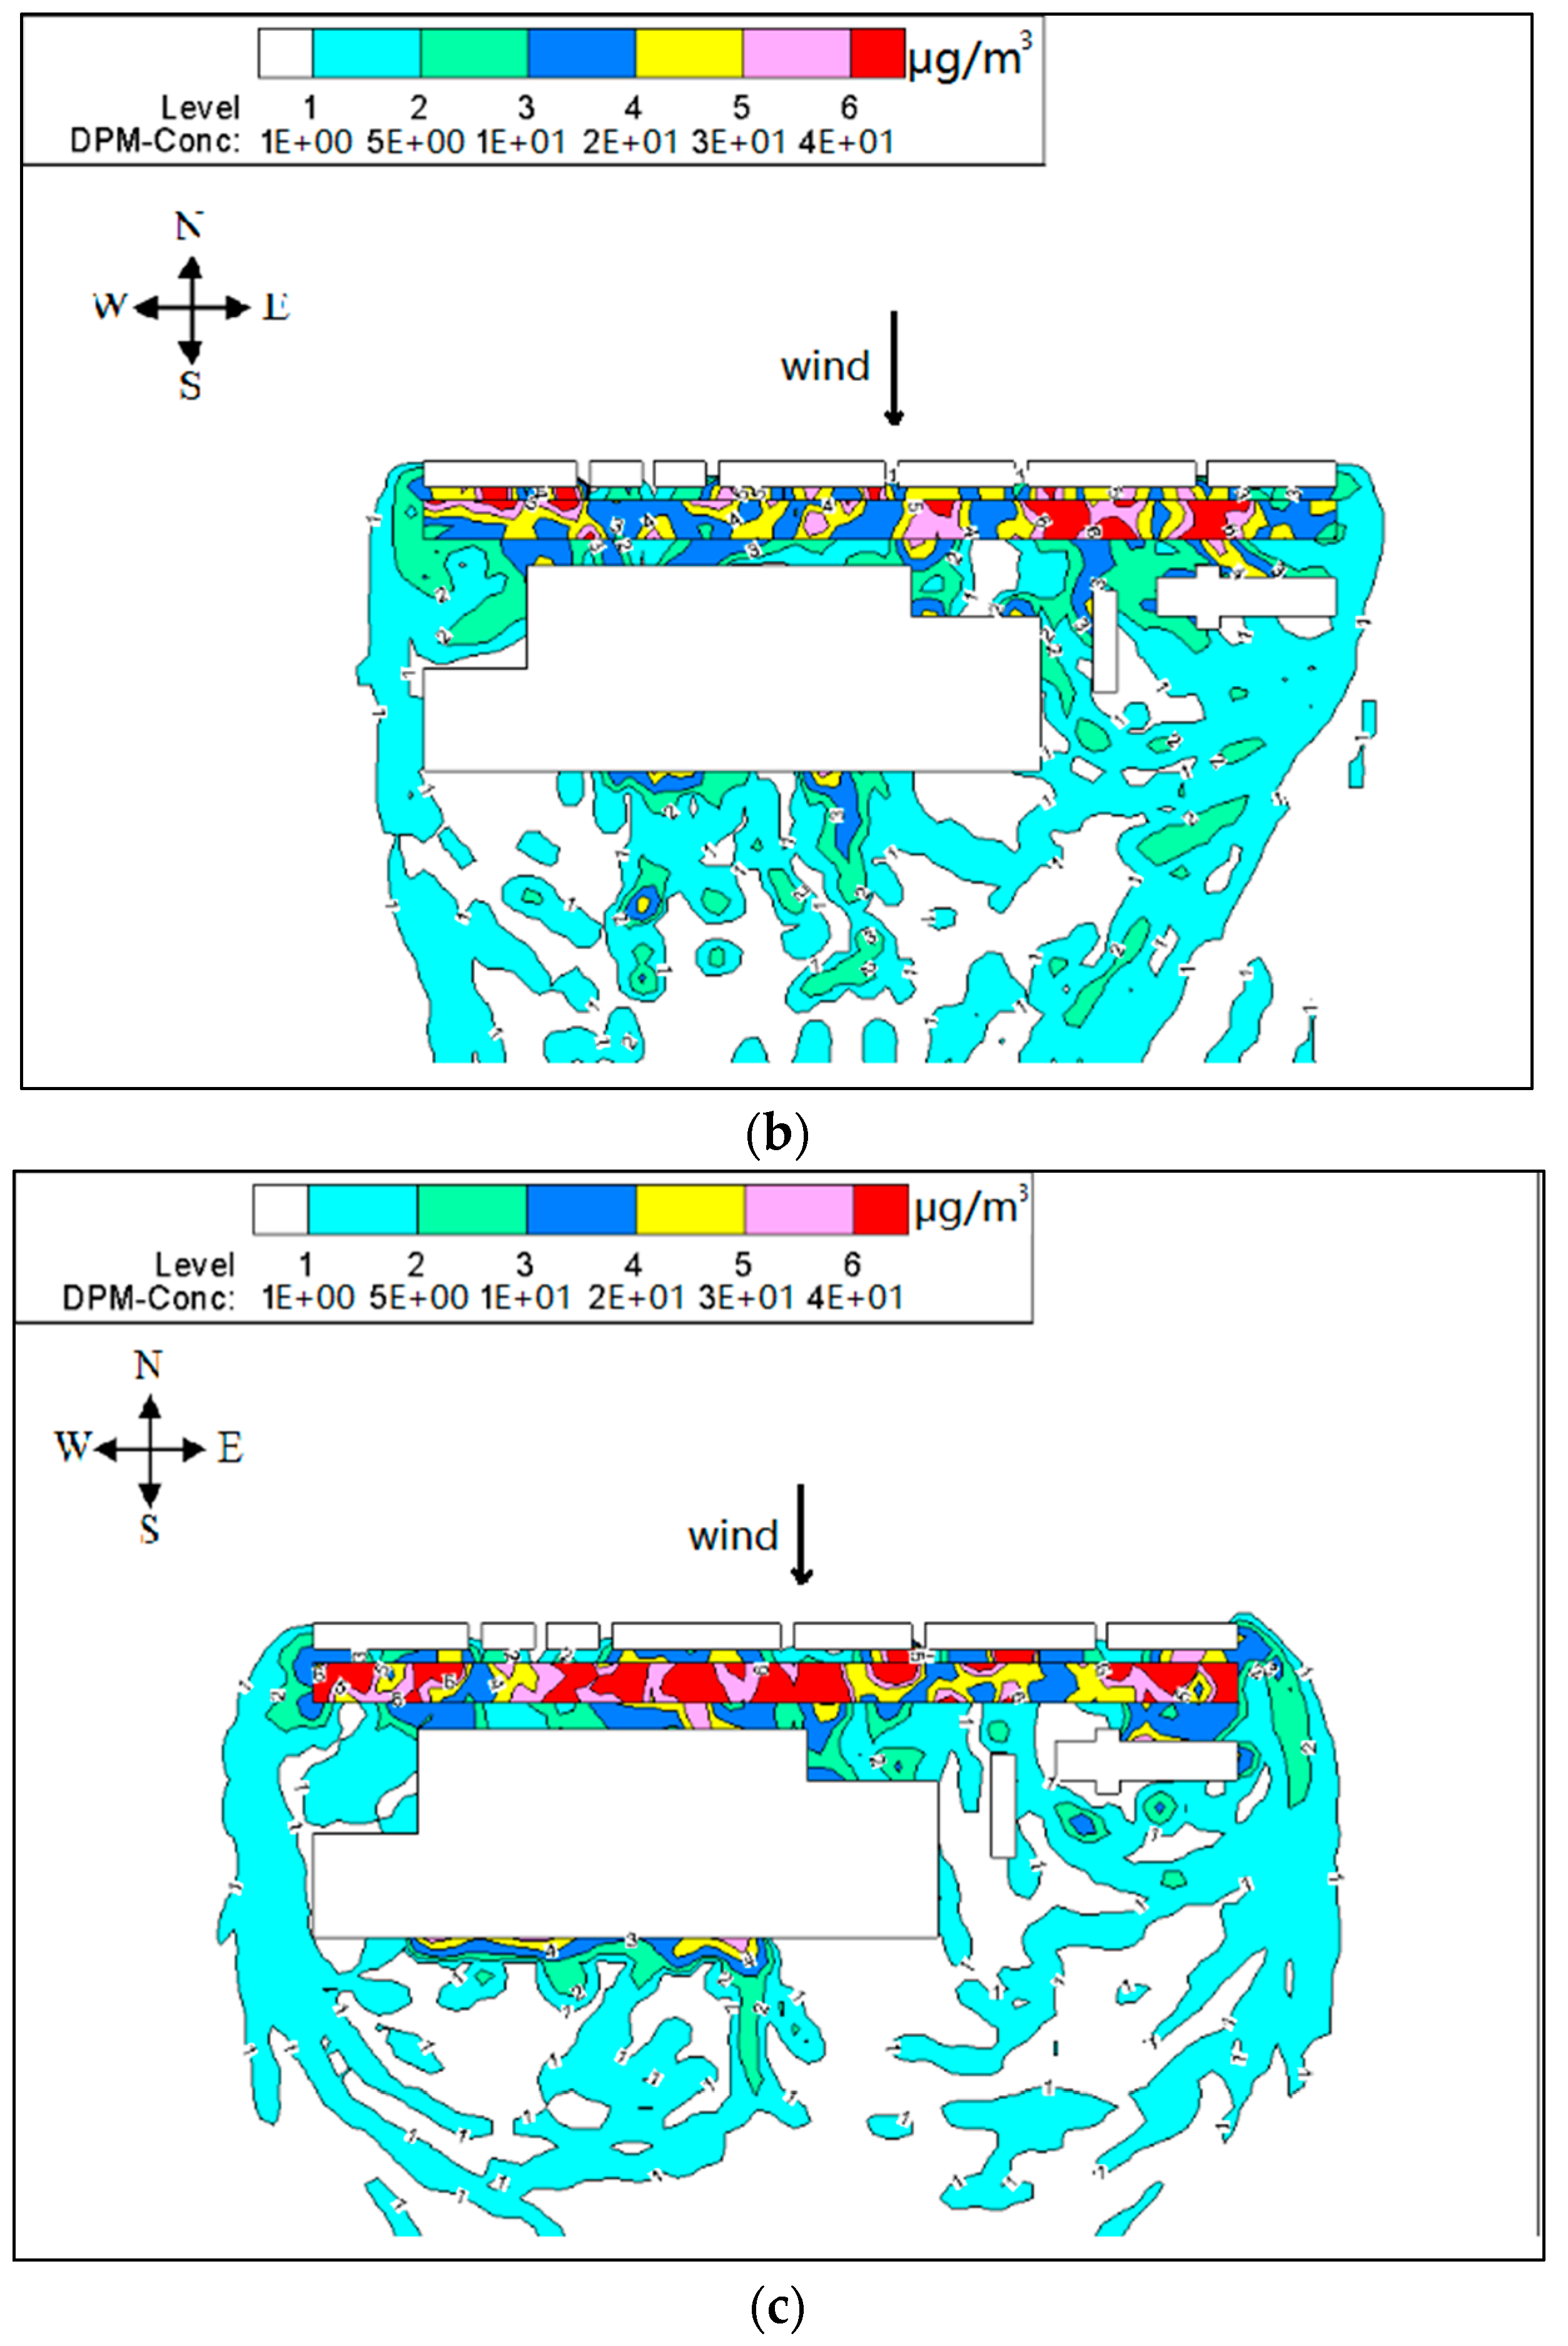
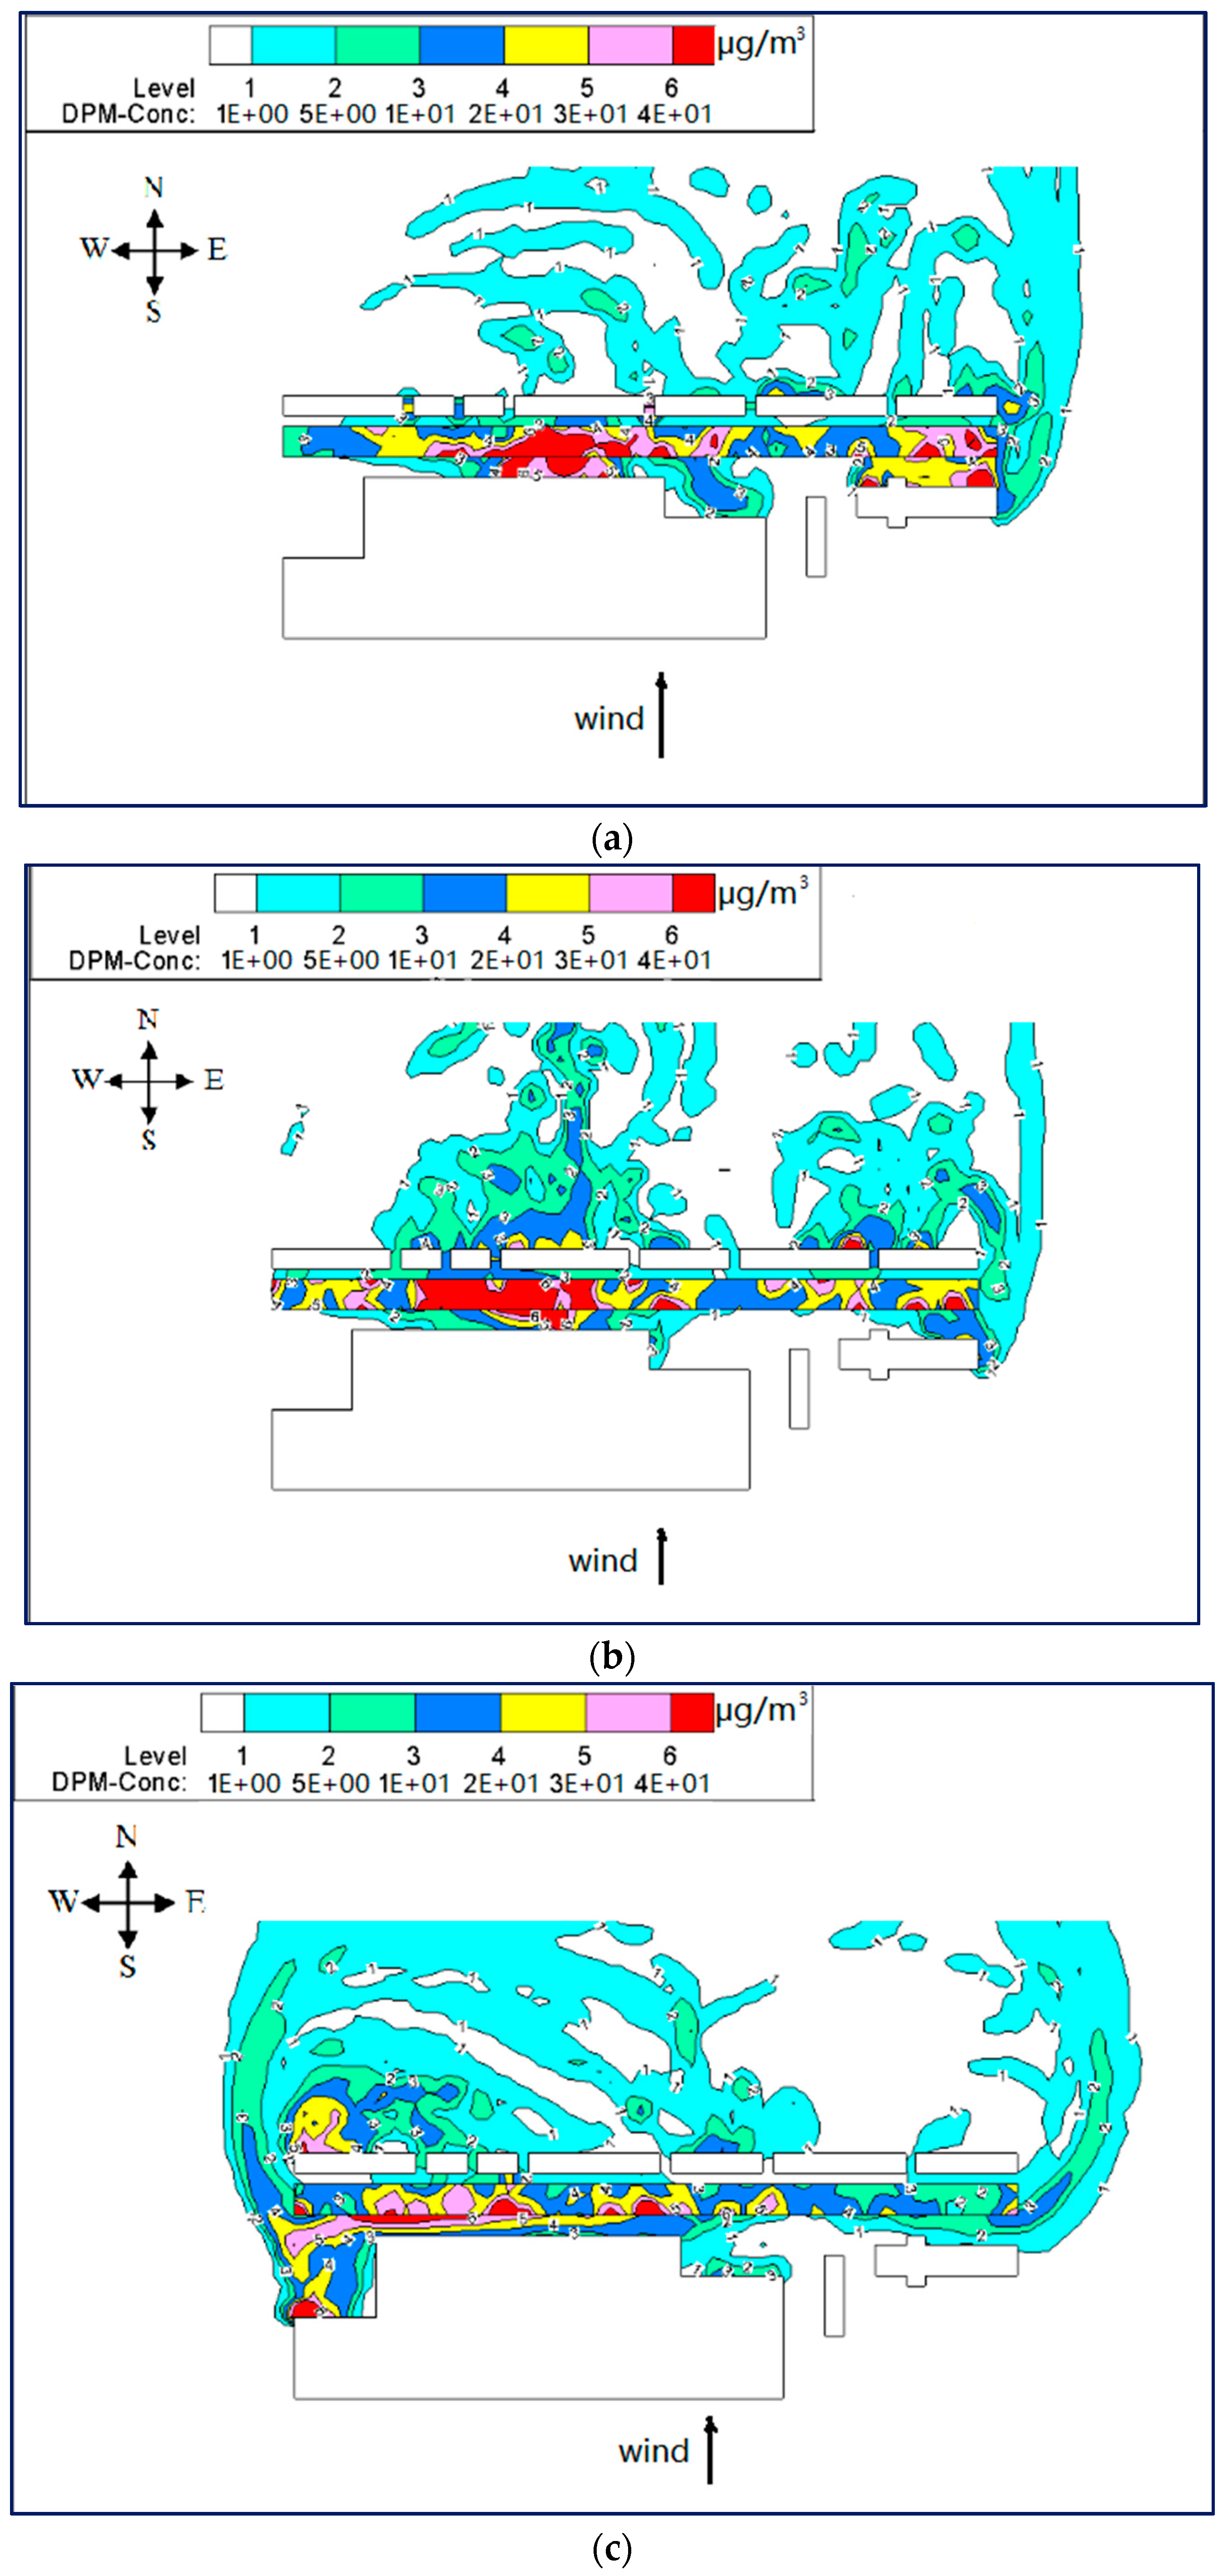
6.1.1. Horizontal Plane for Wind from West
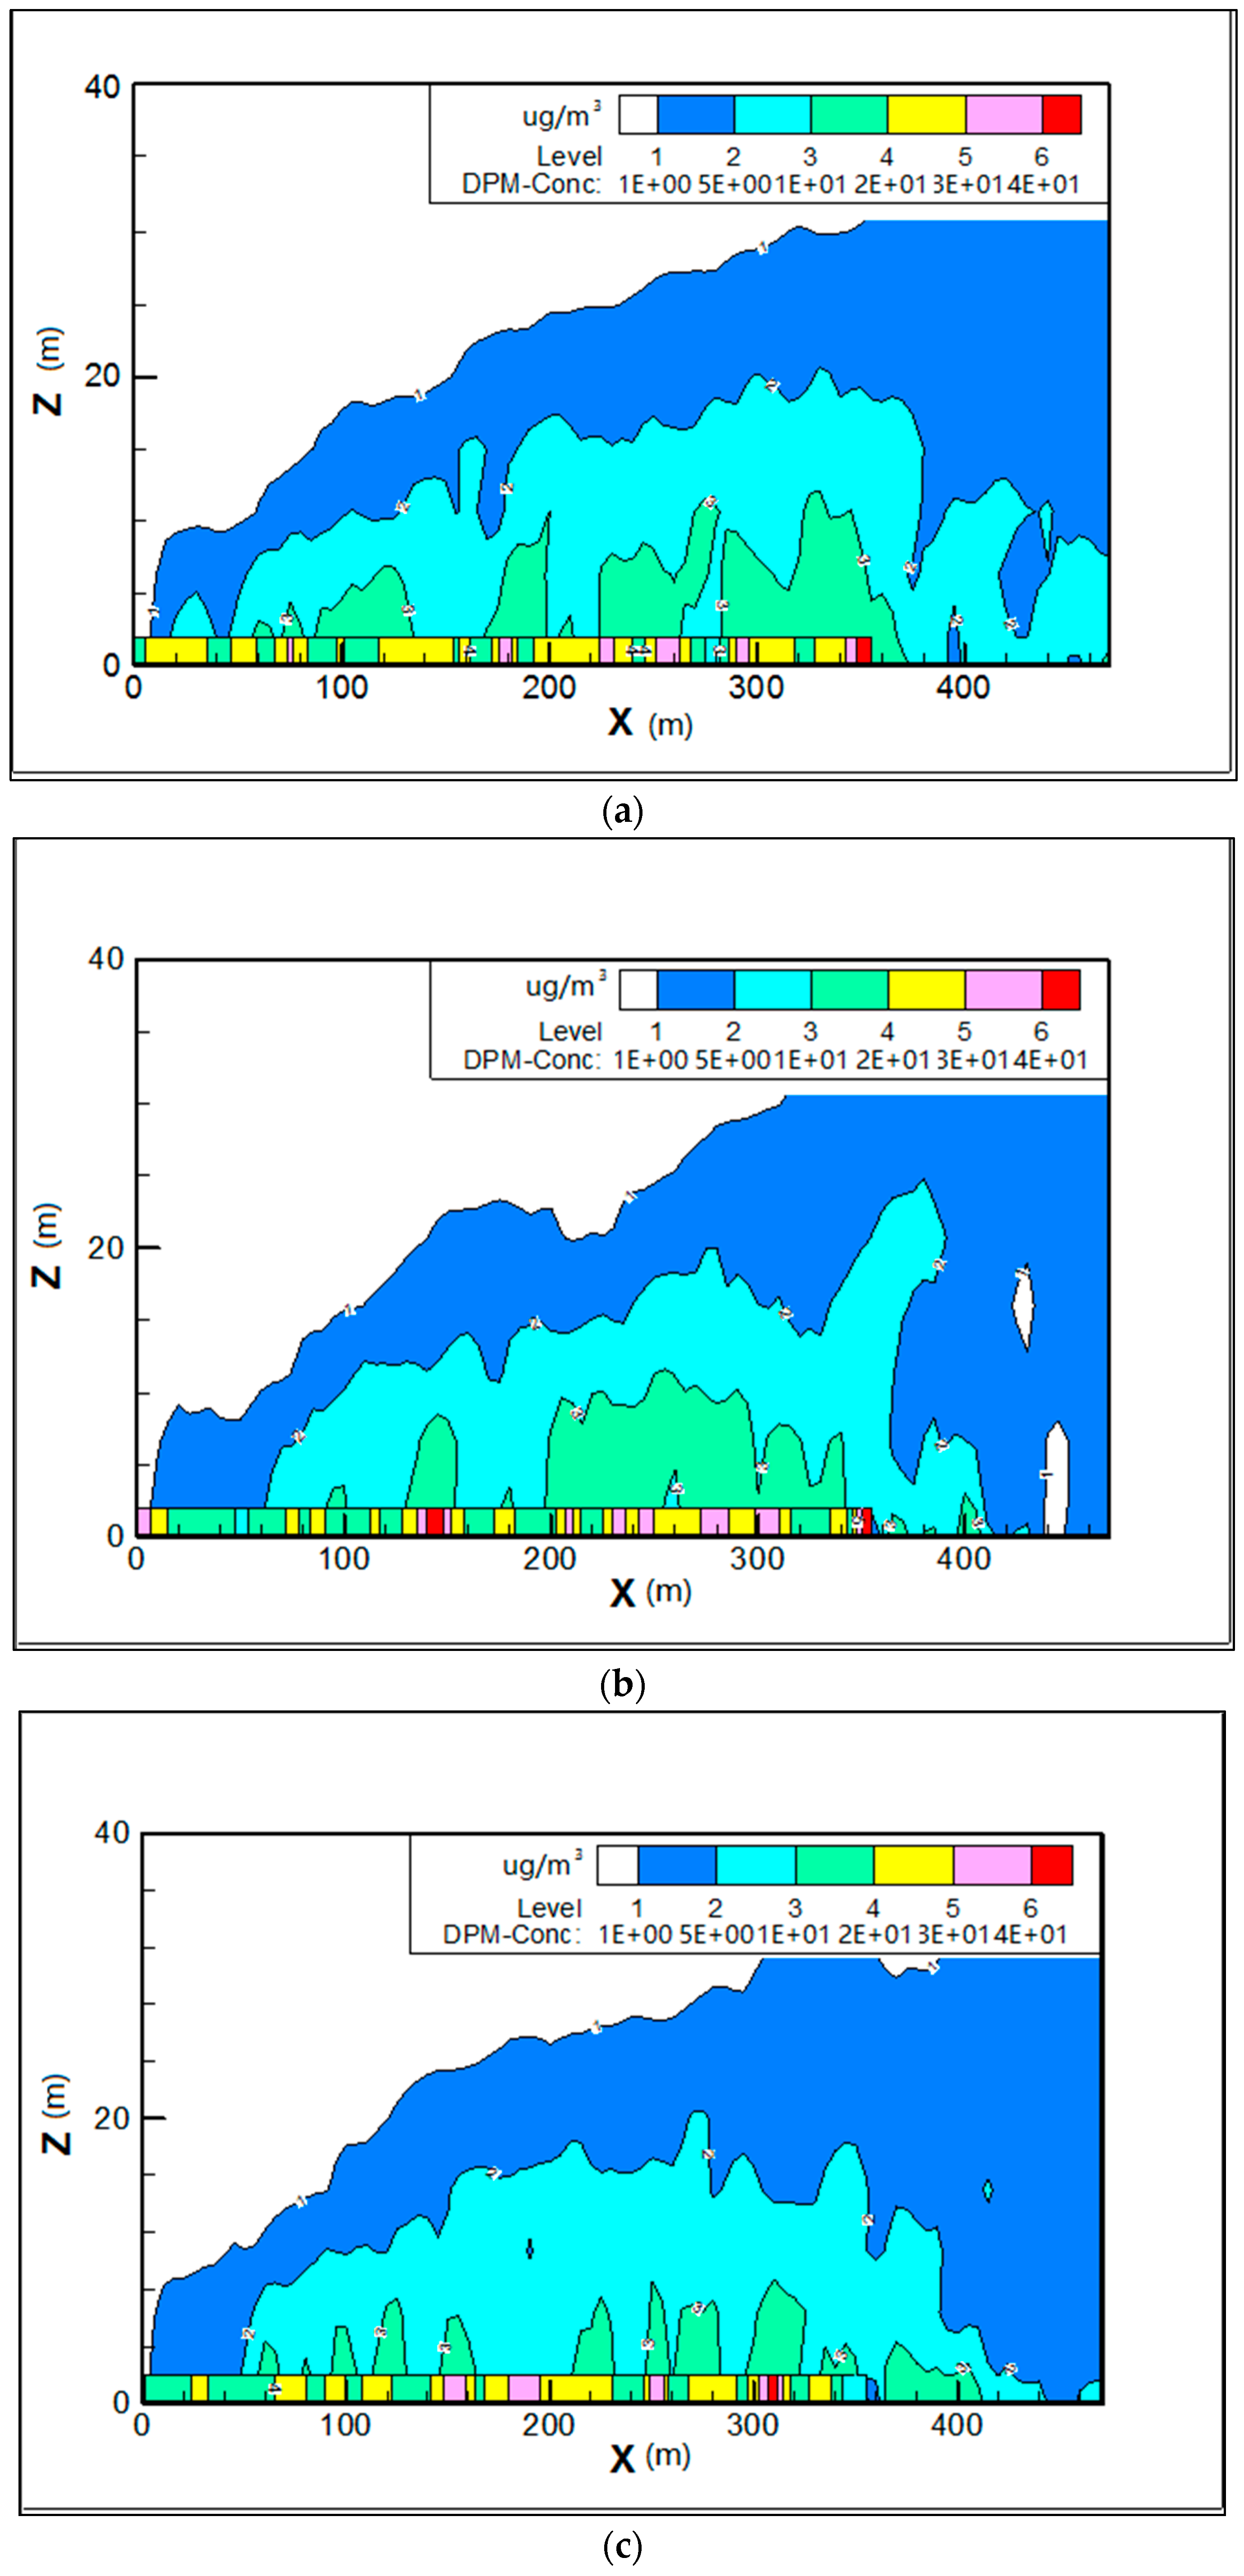
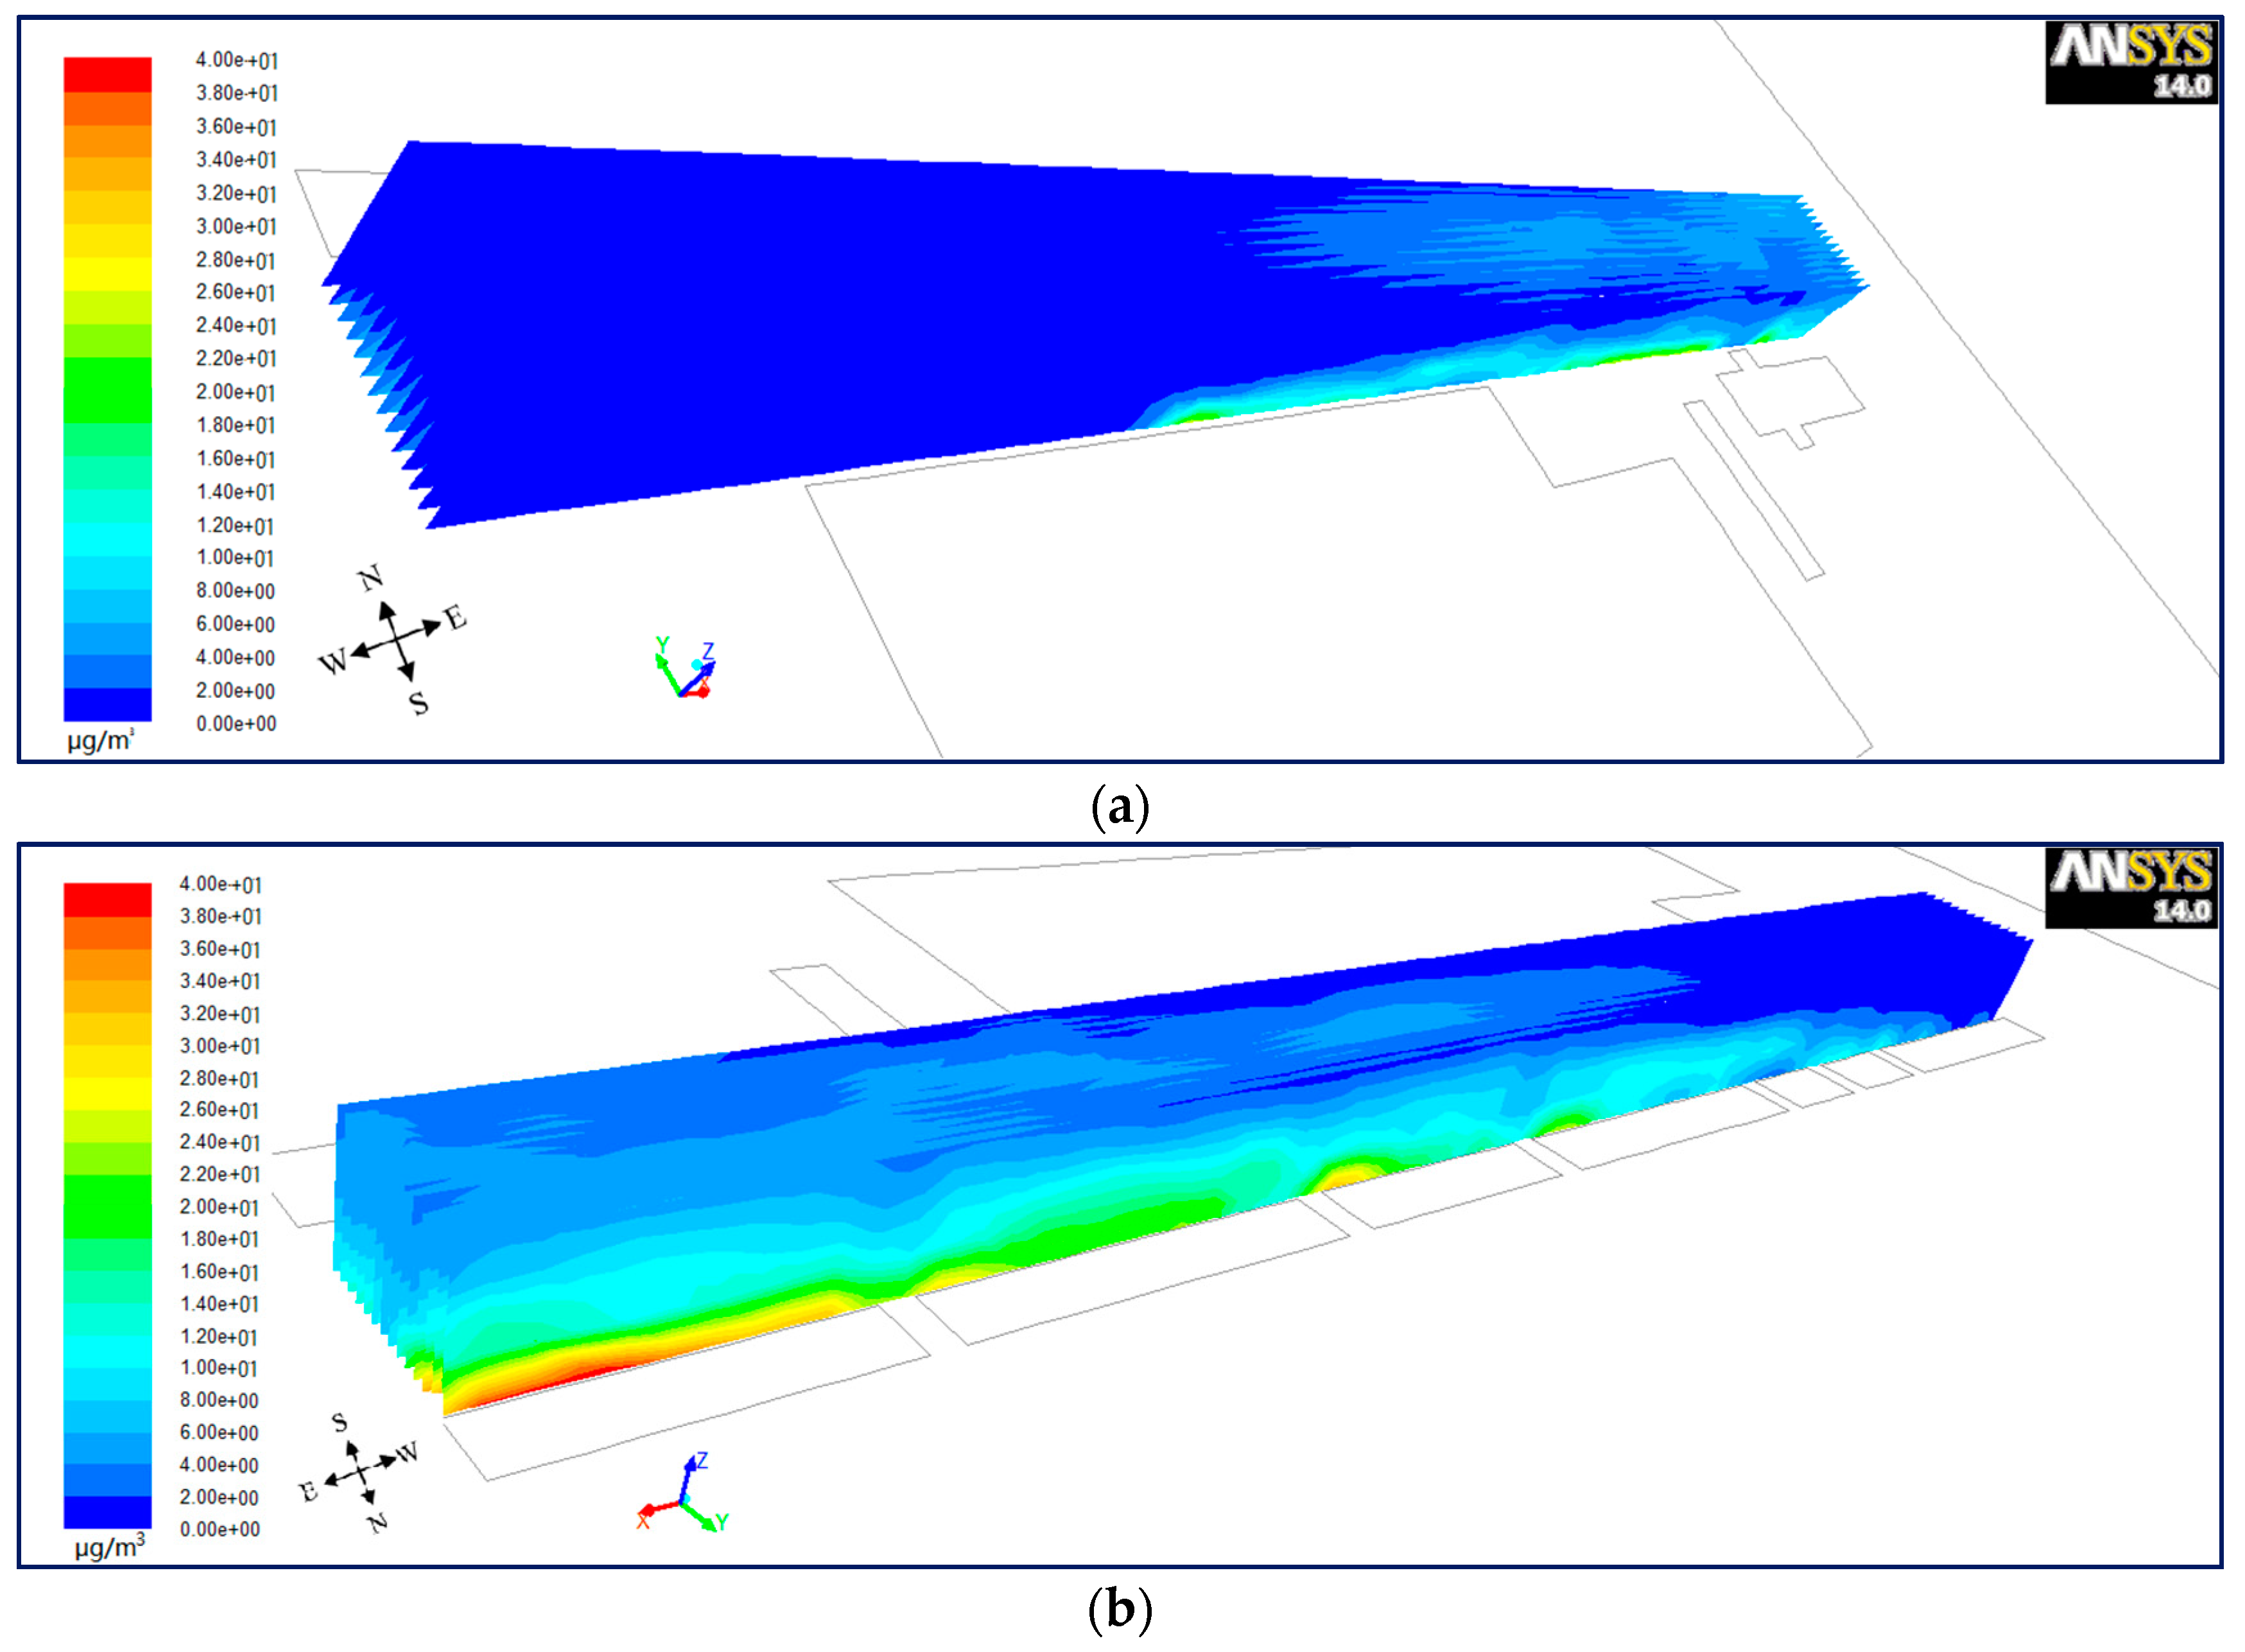
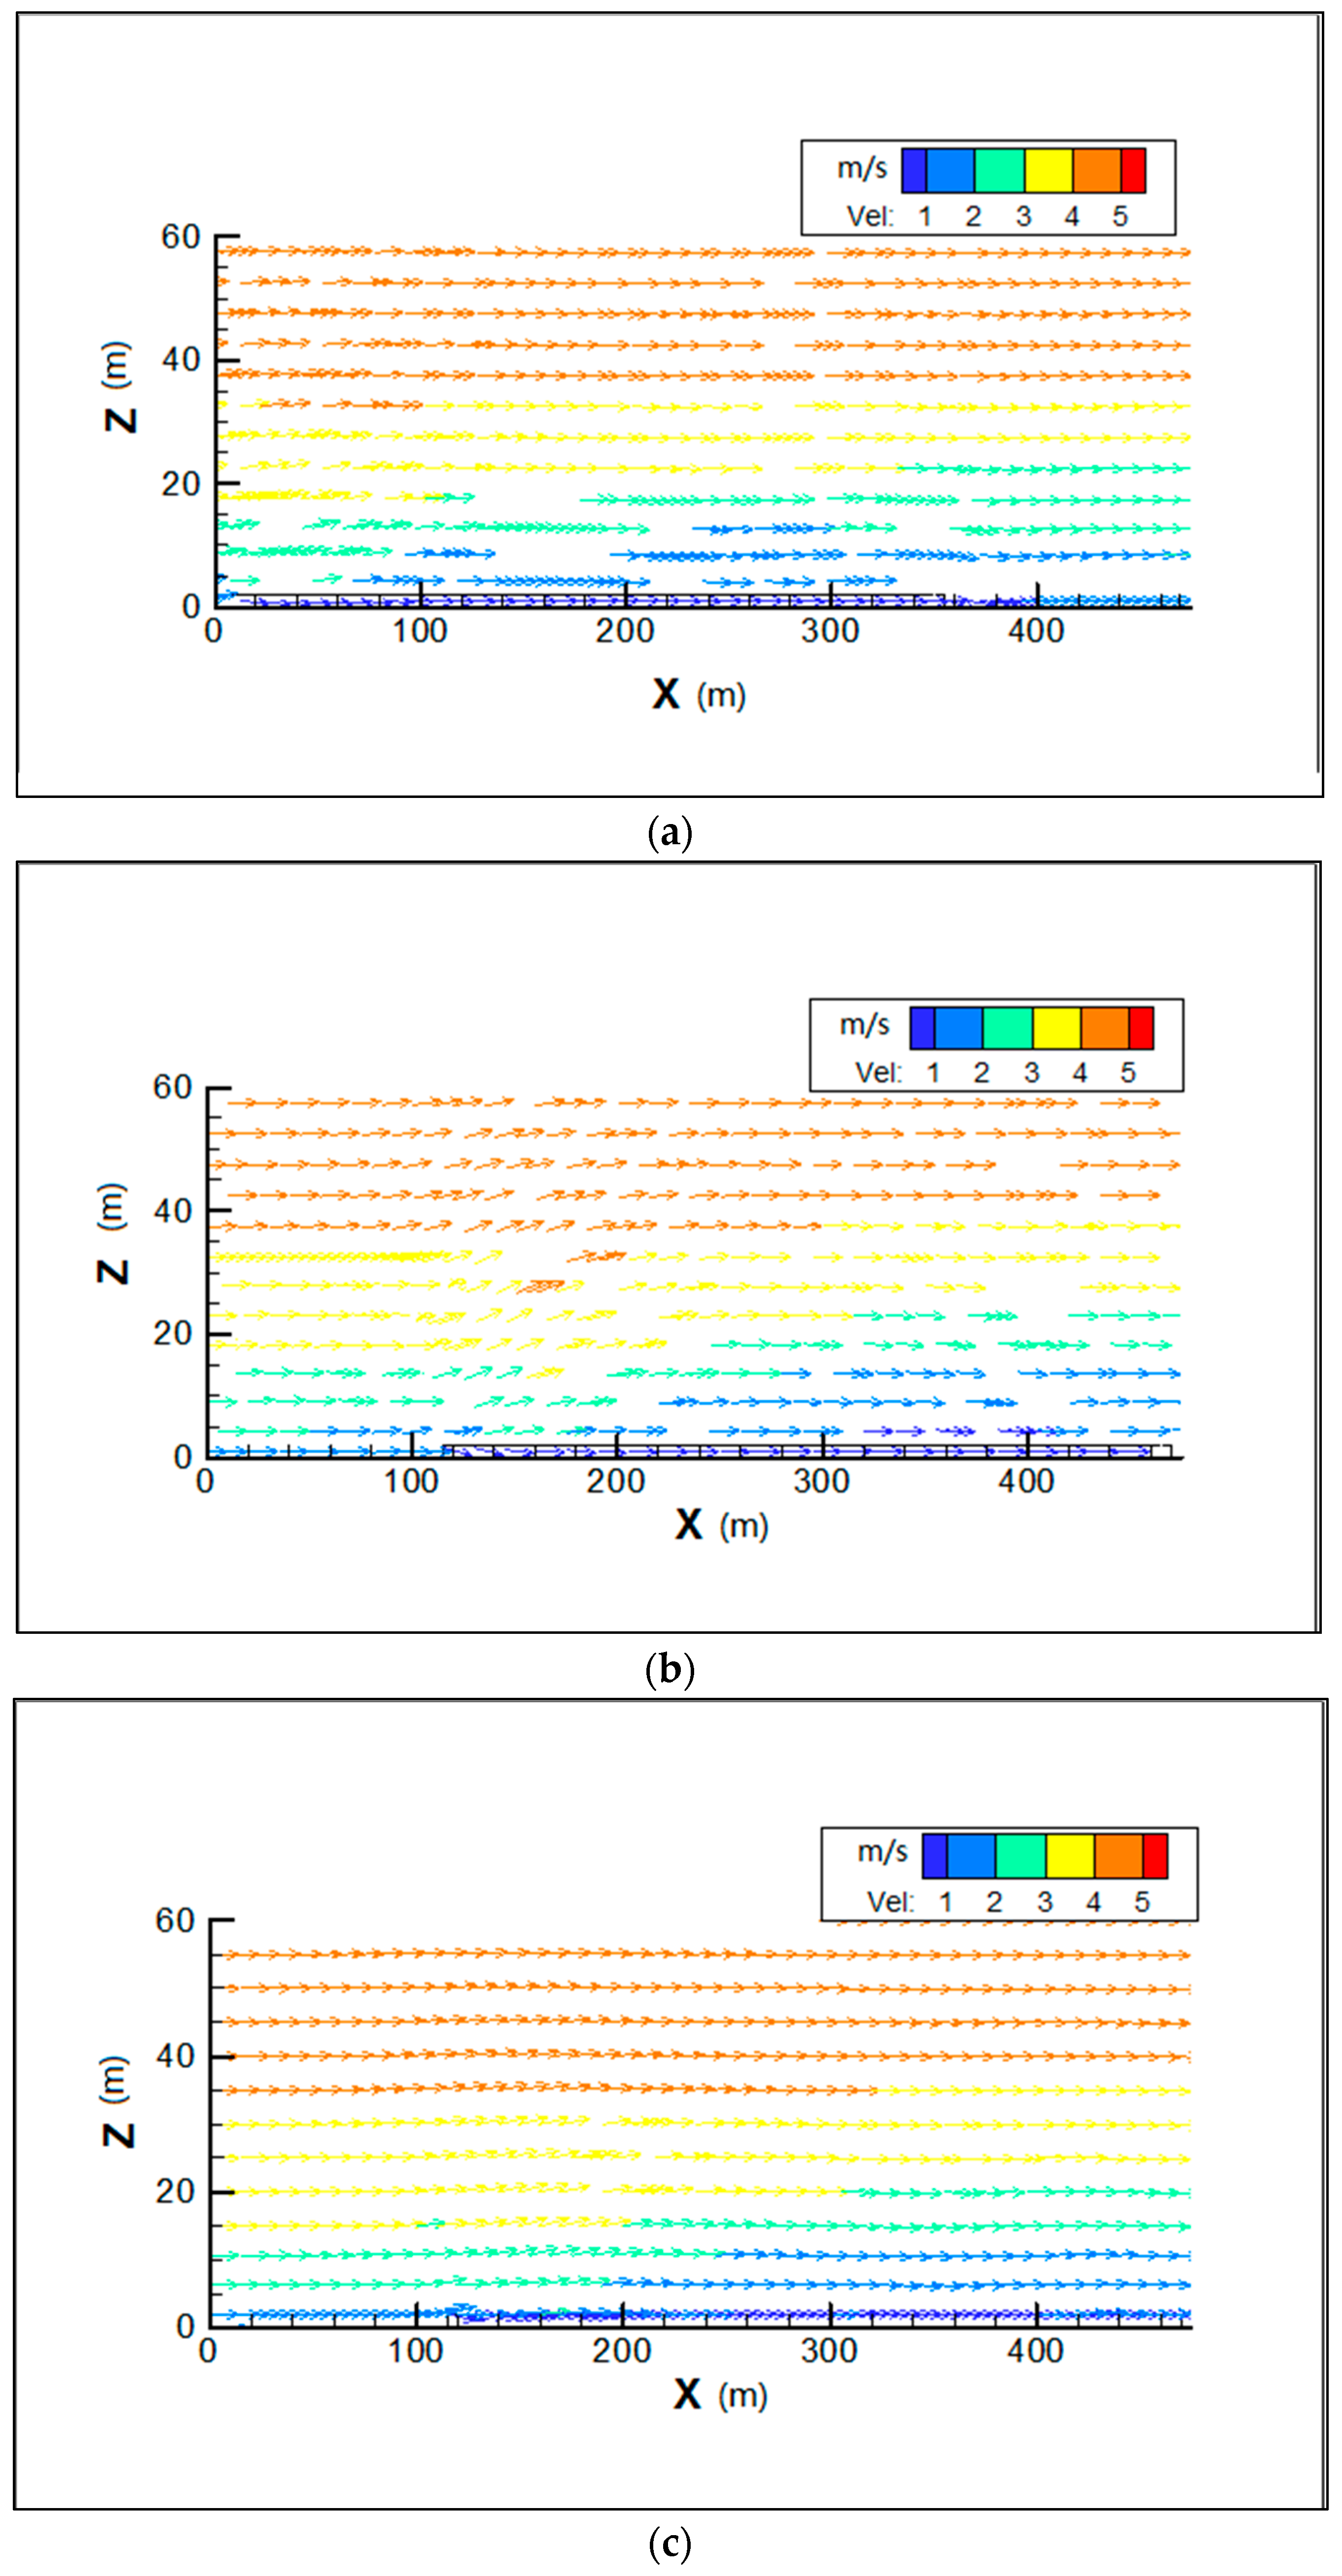
6.1.2. Vertical Plane for Wind from West
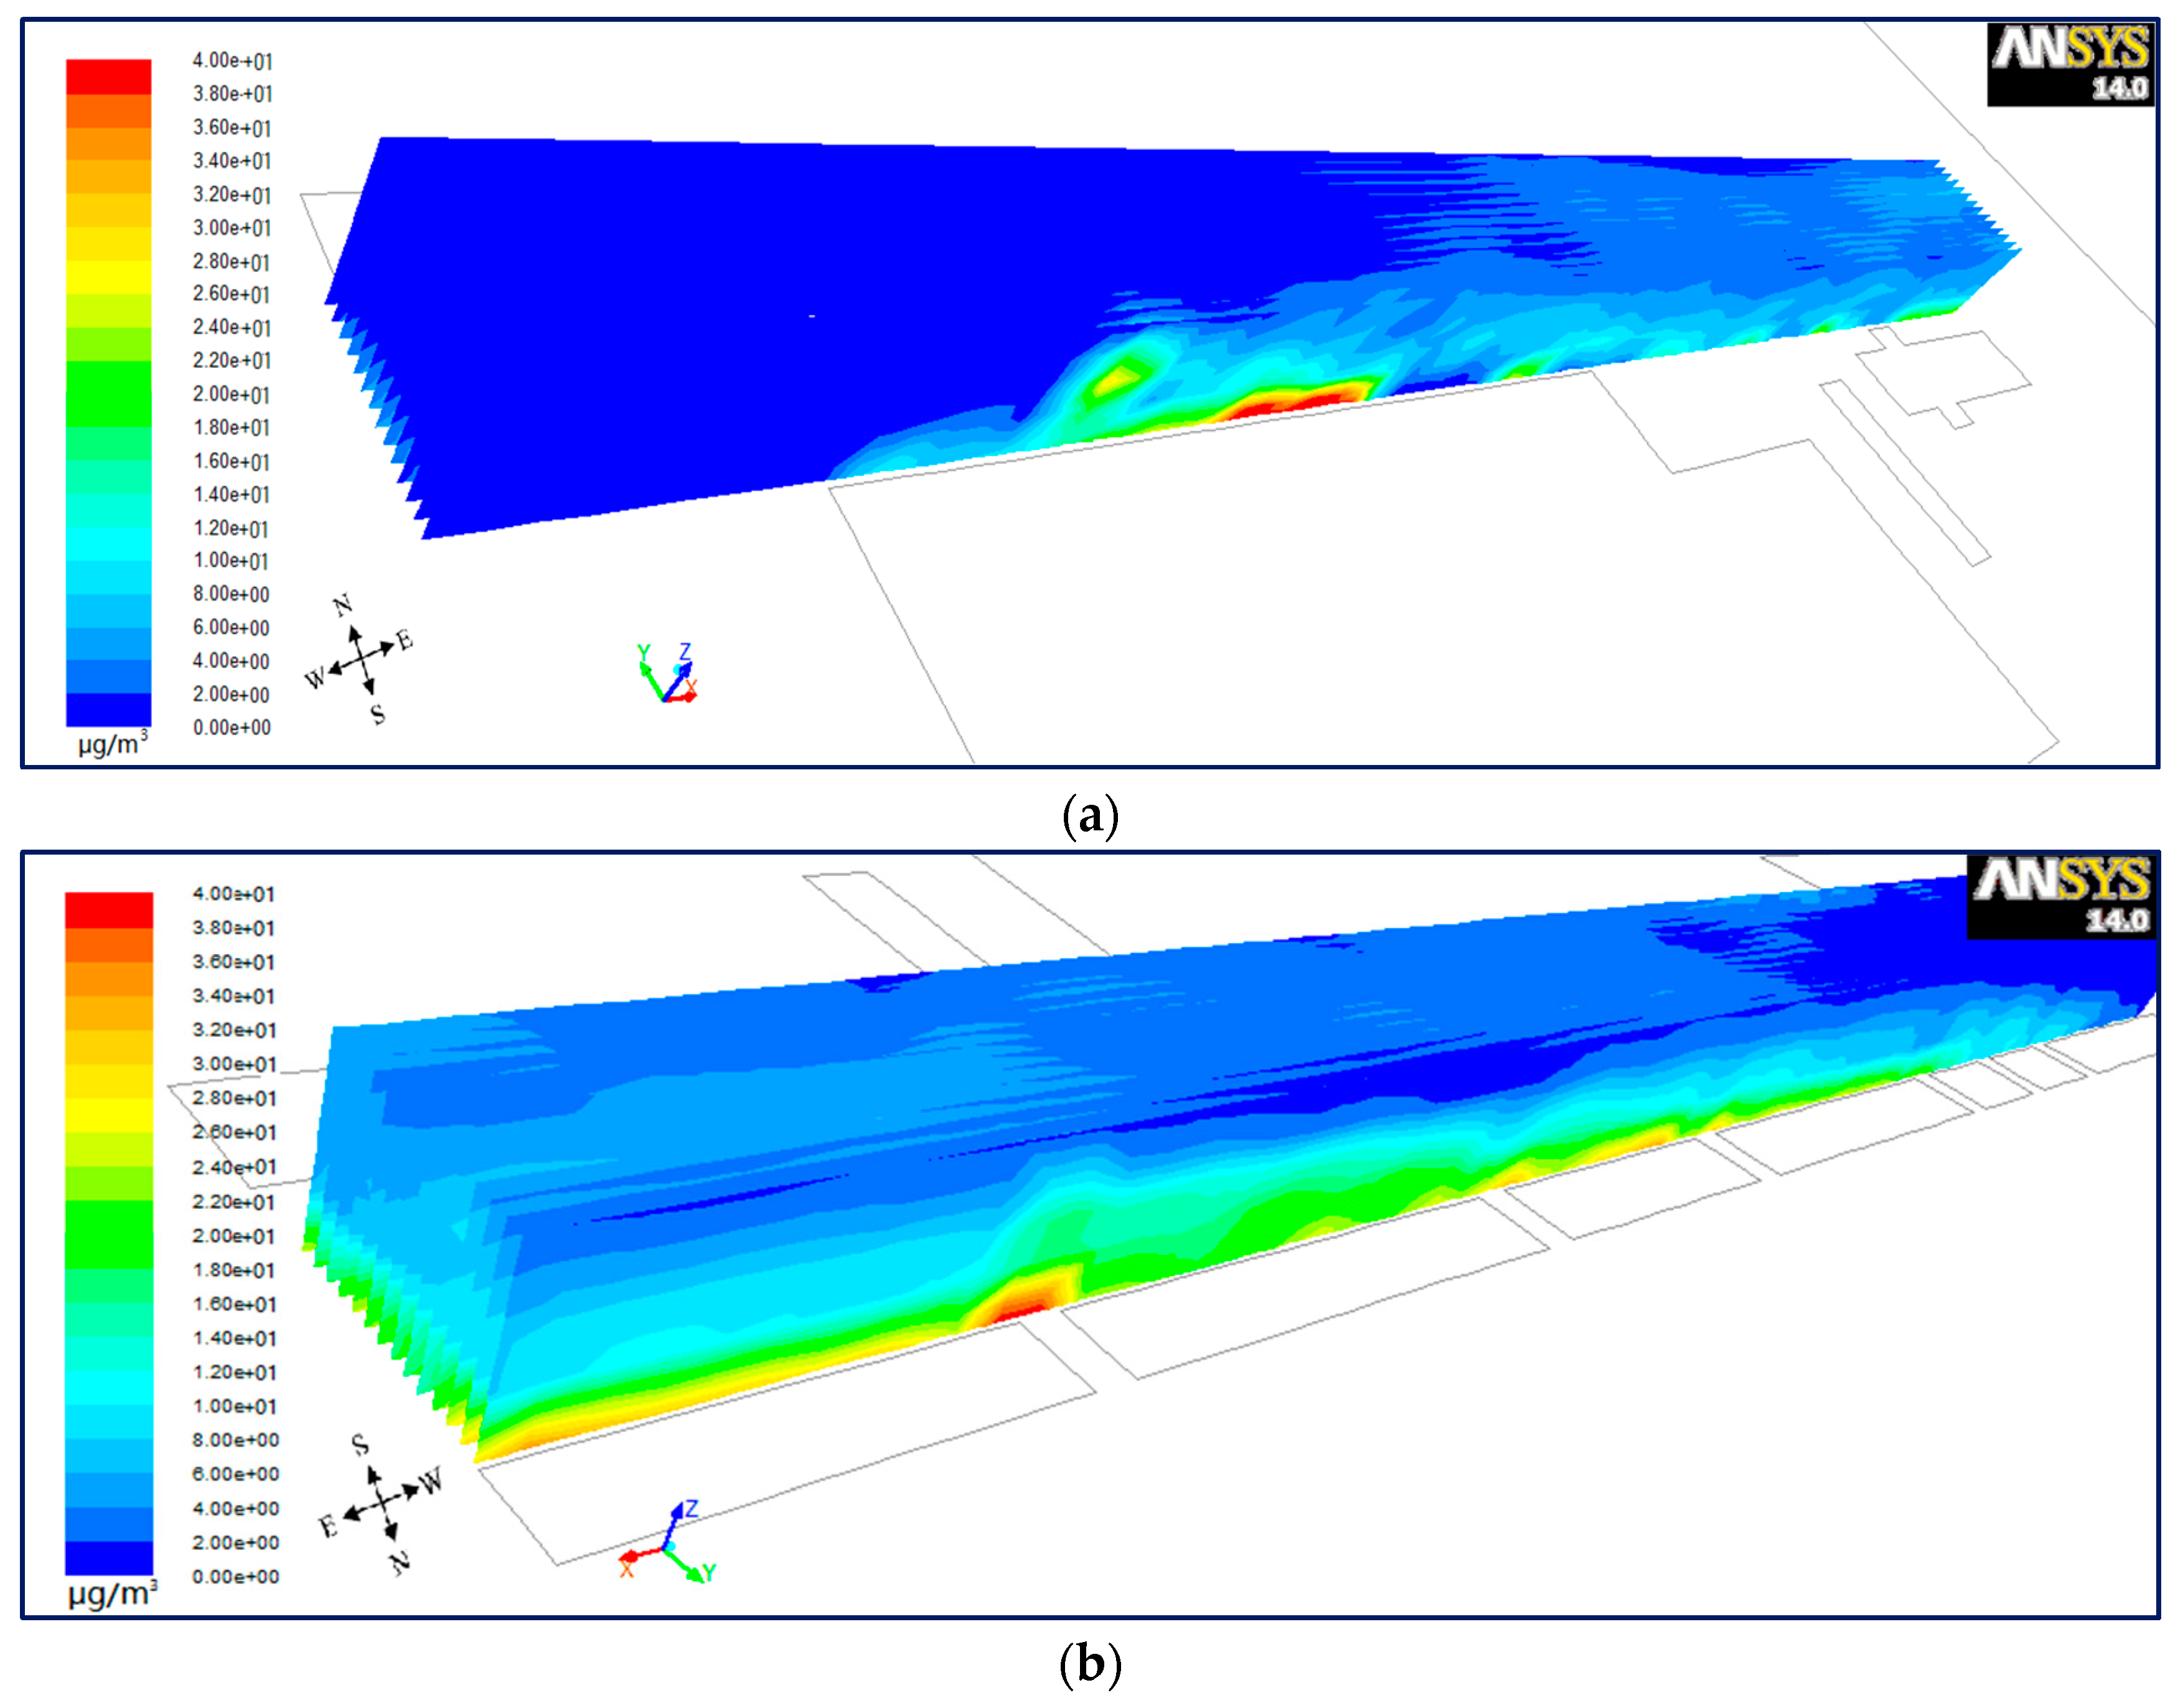
6.1.3. Lateral Plane for Wind from West
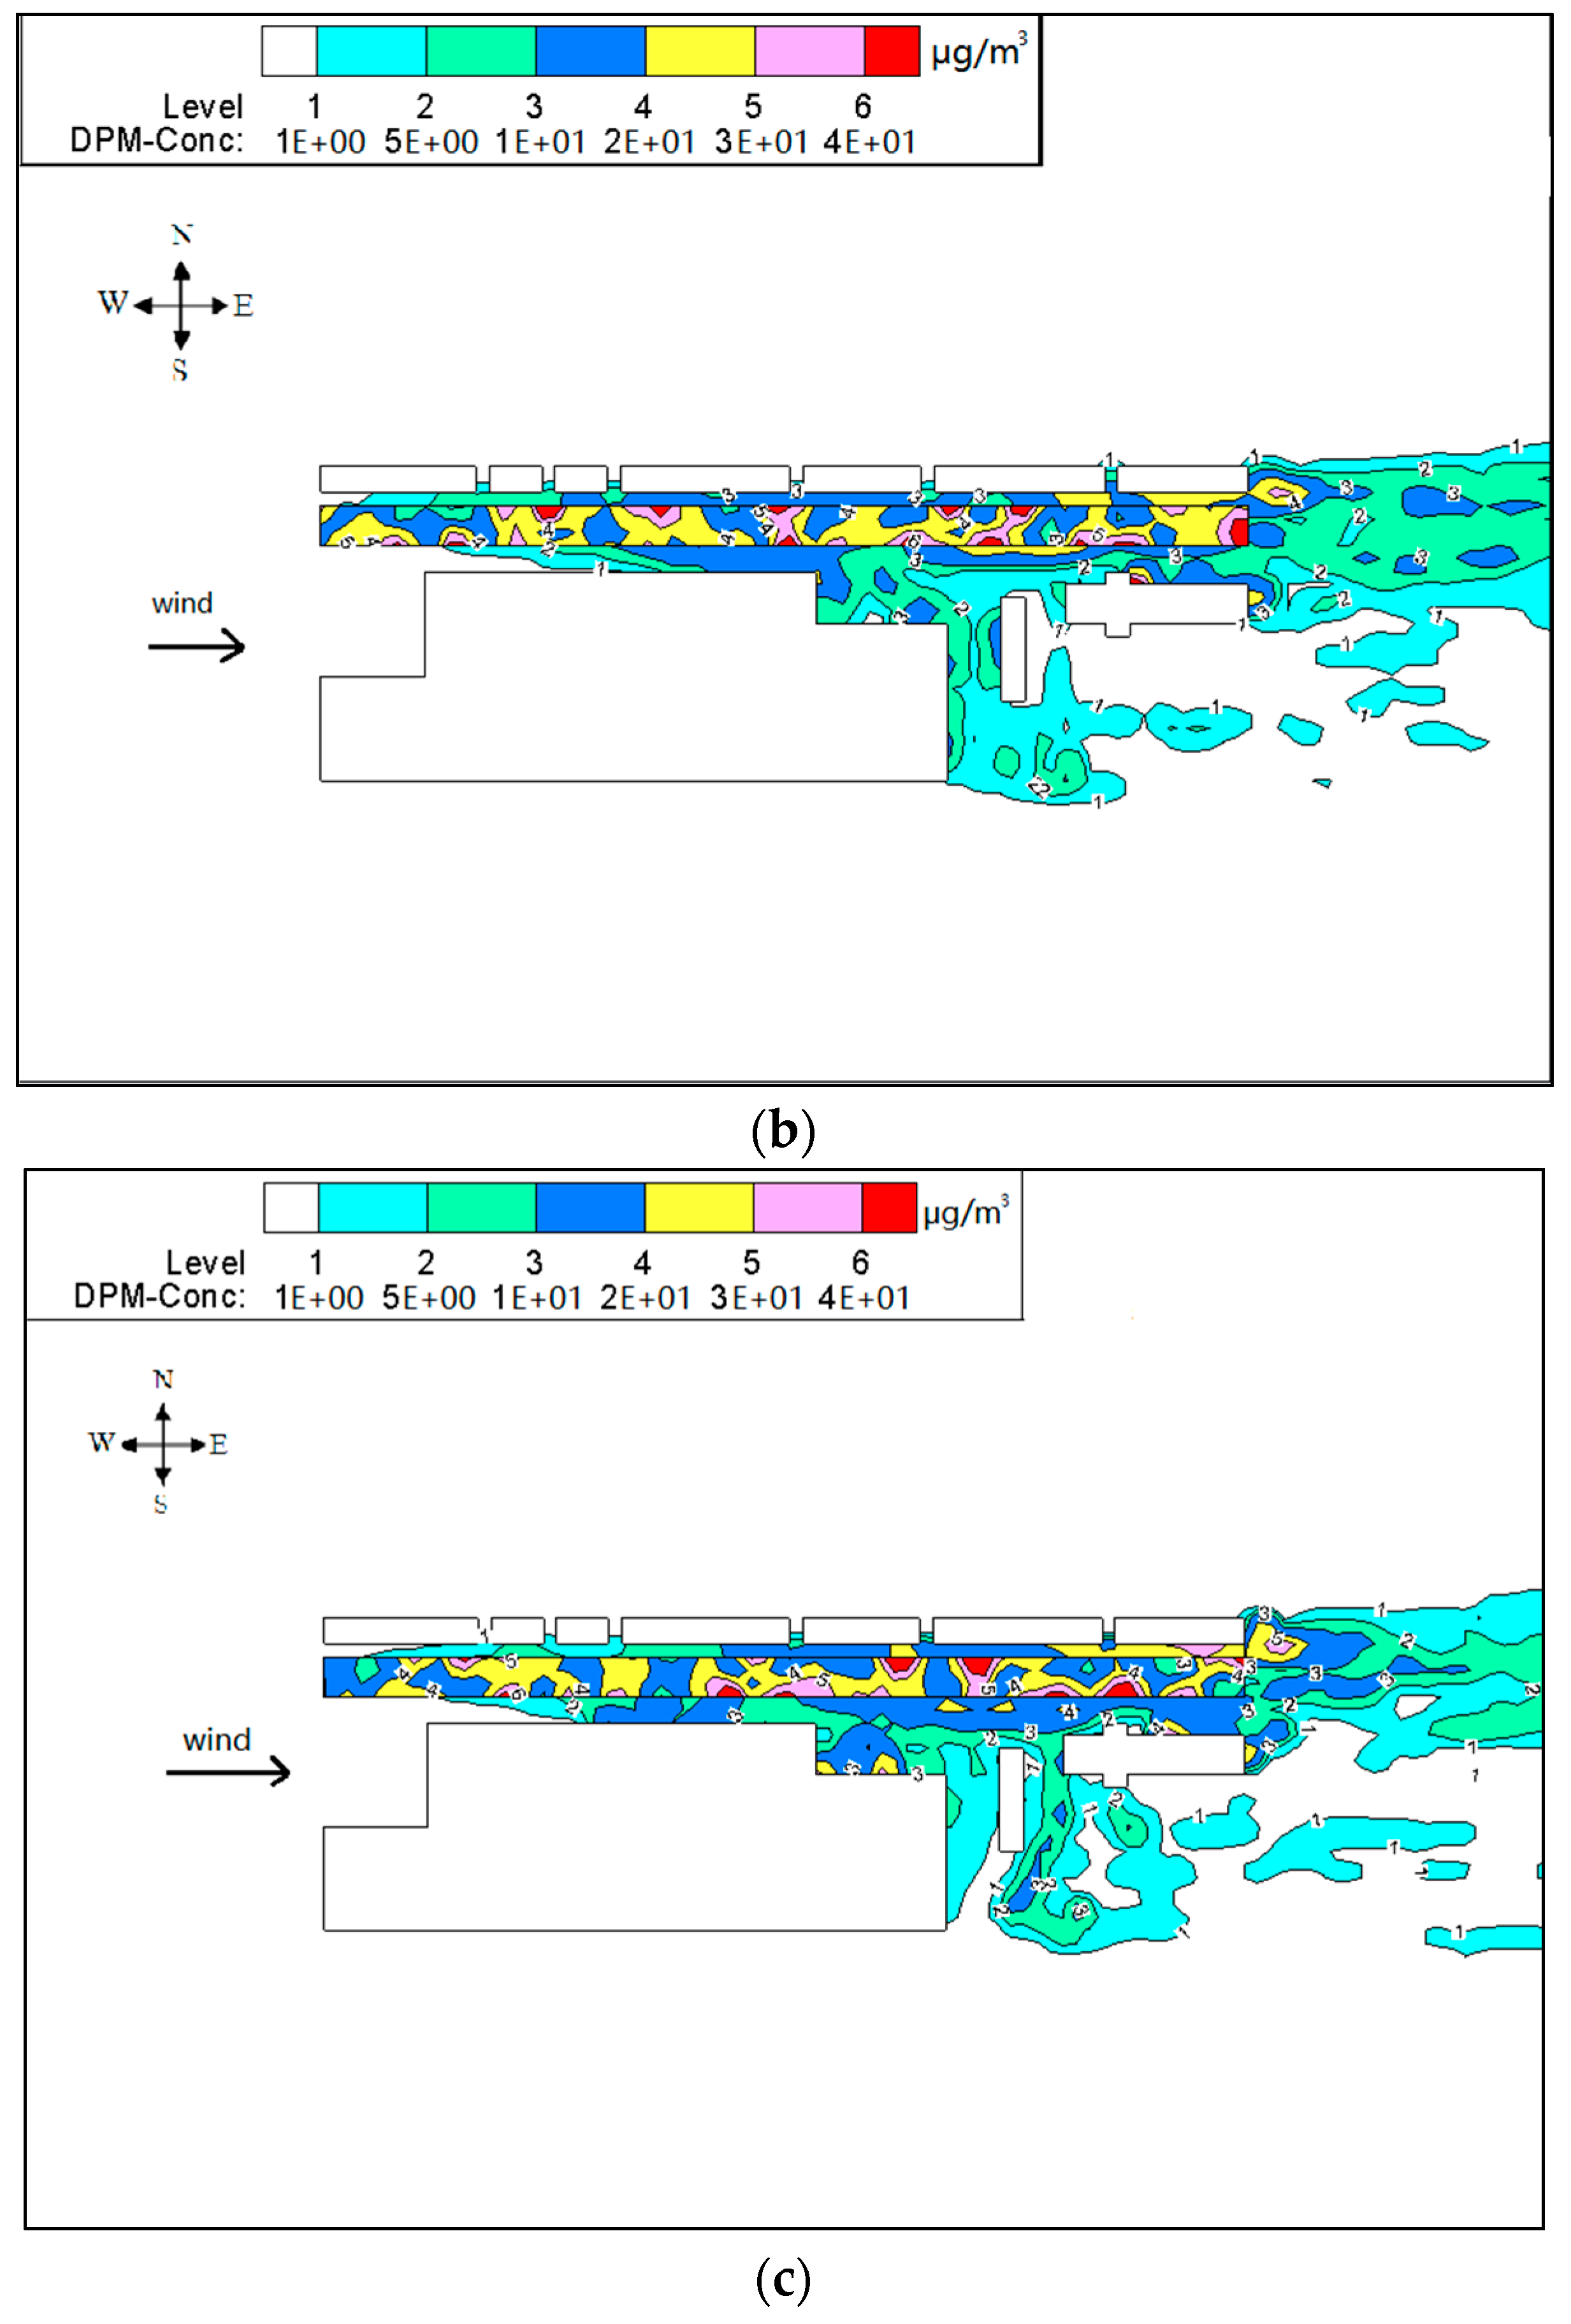
6.2. Influence of Wind Direction on Distributions of PM10
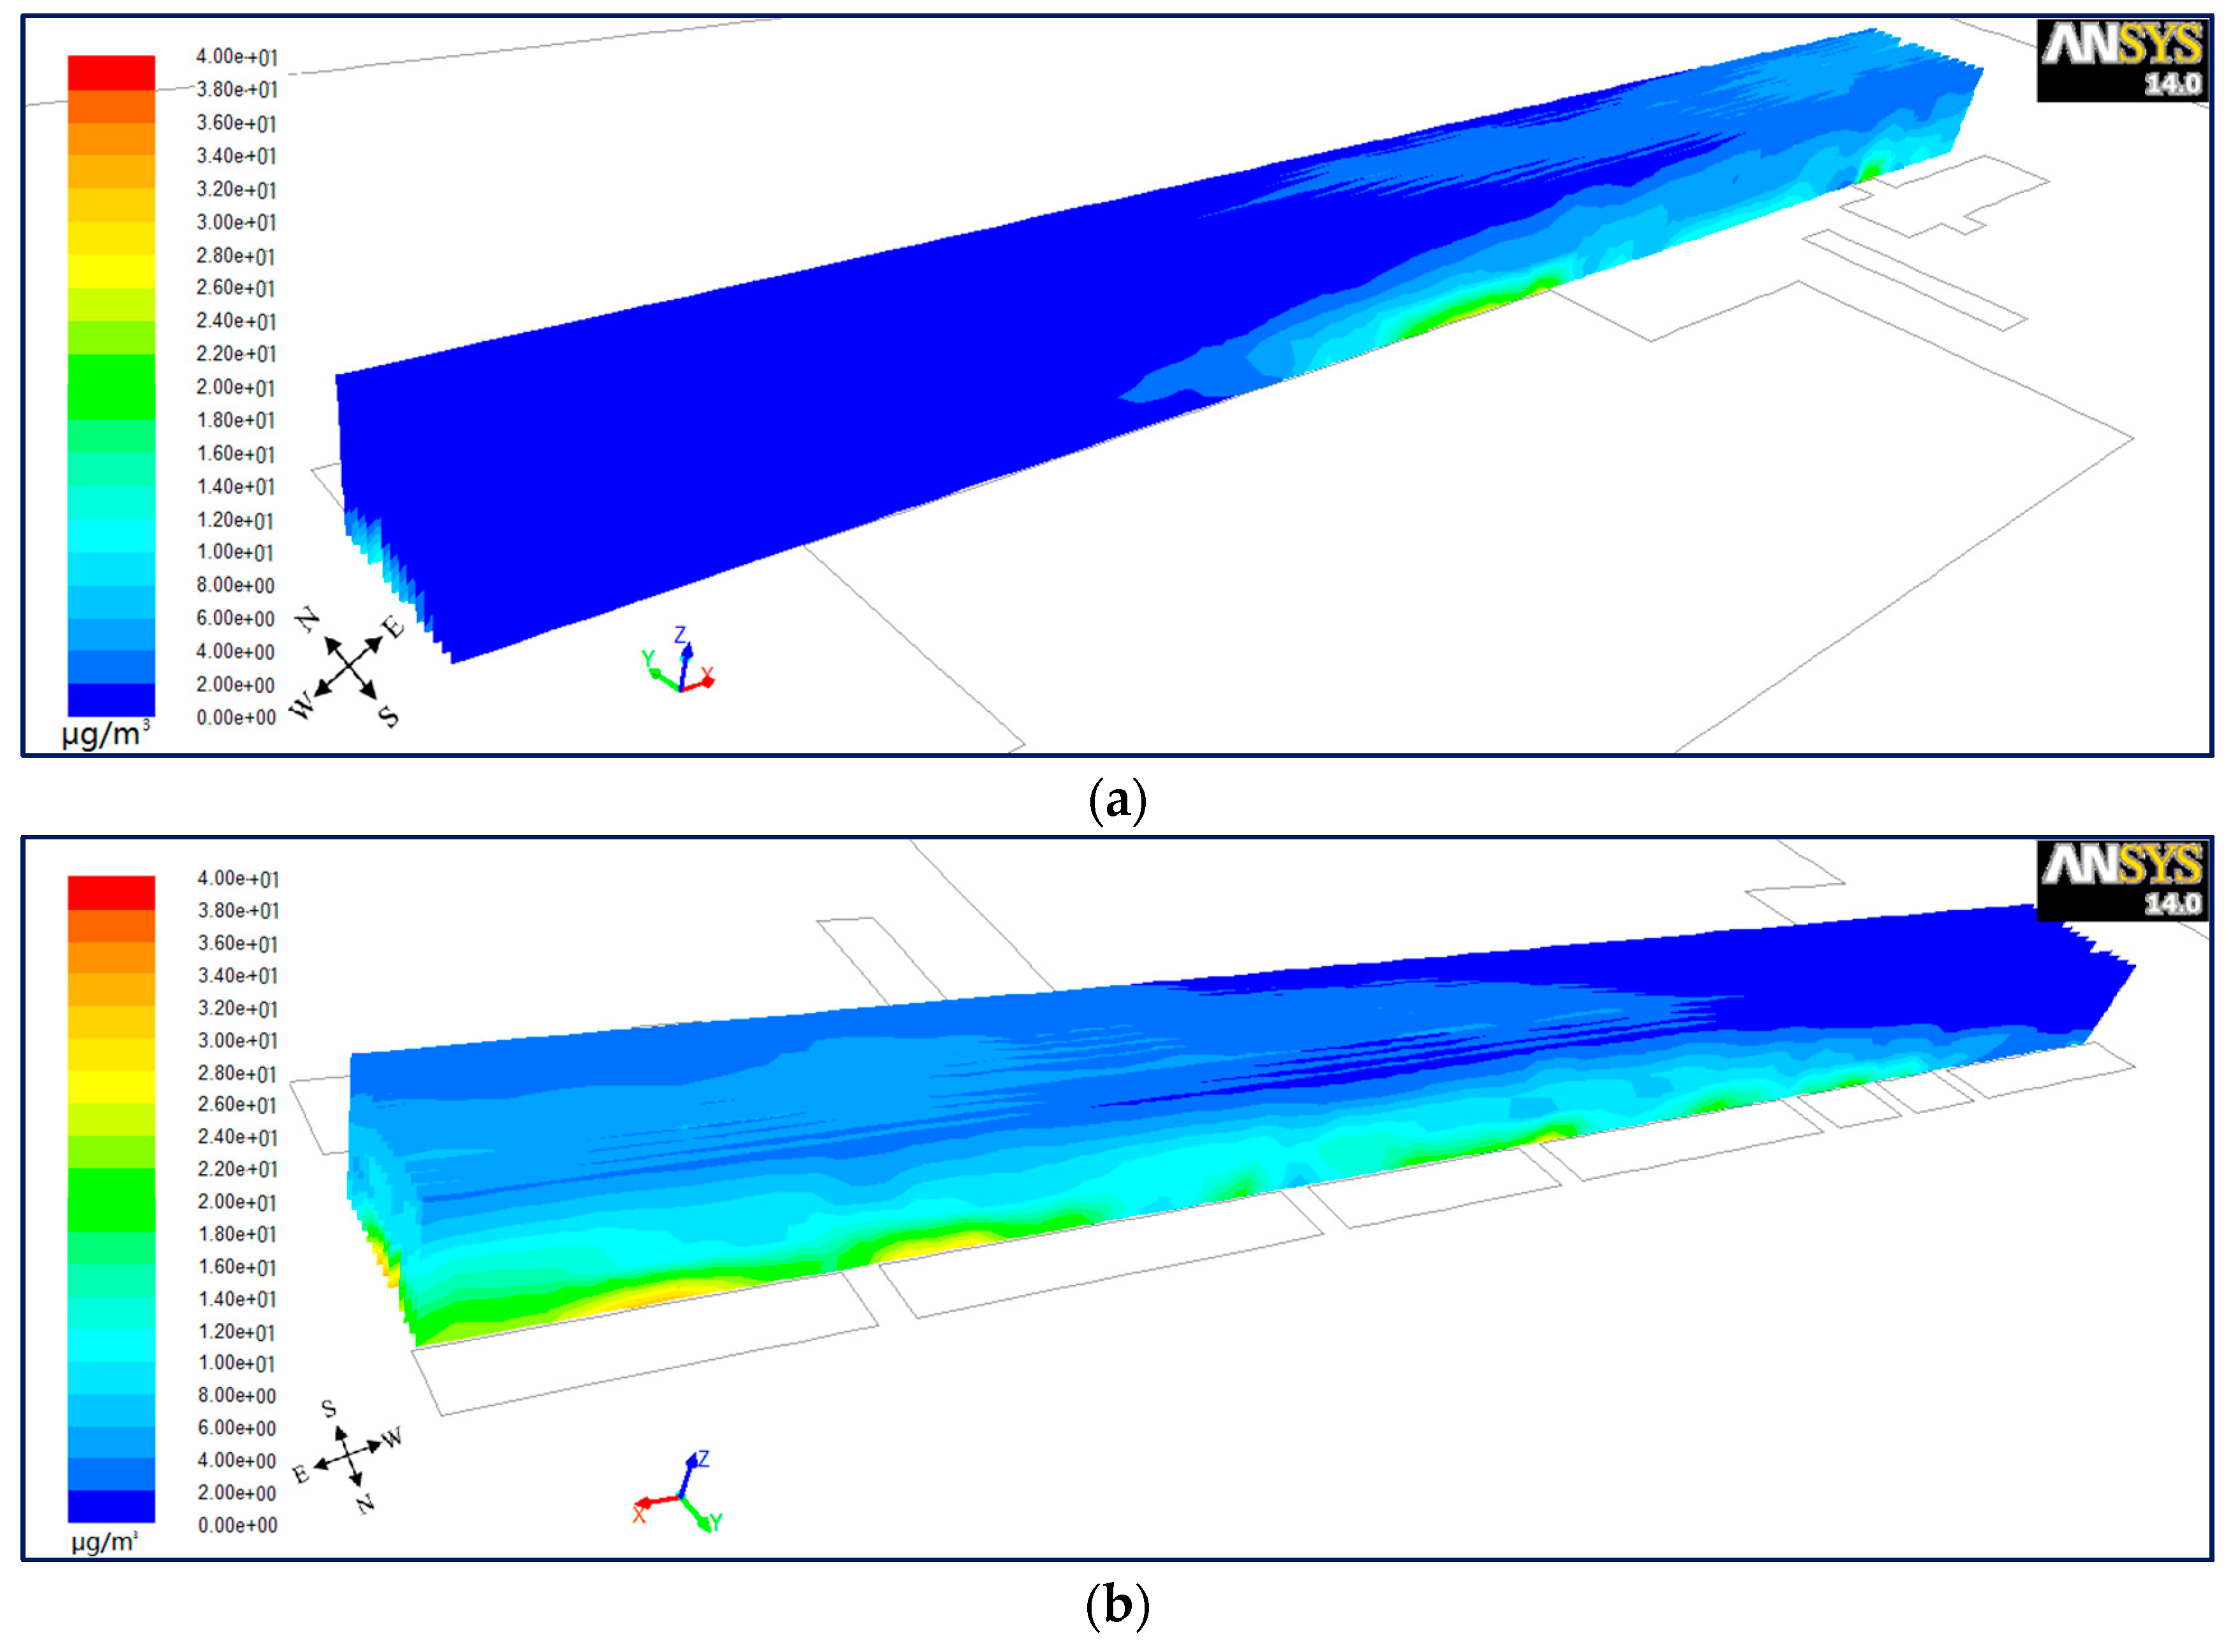
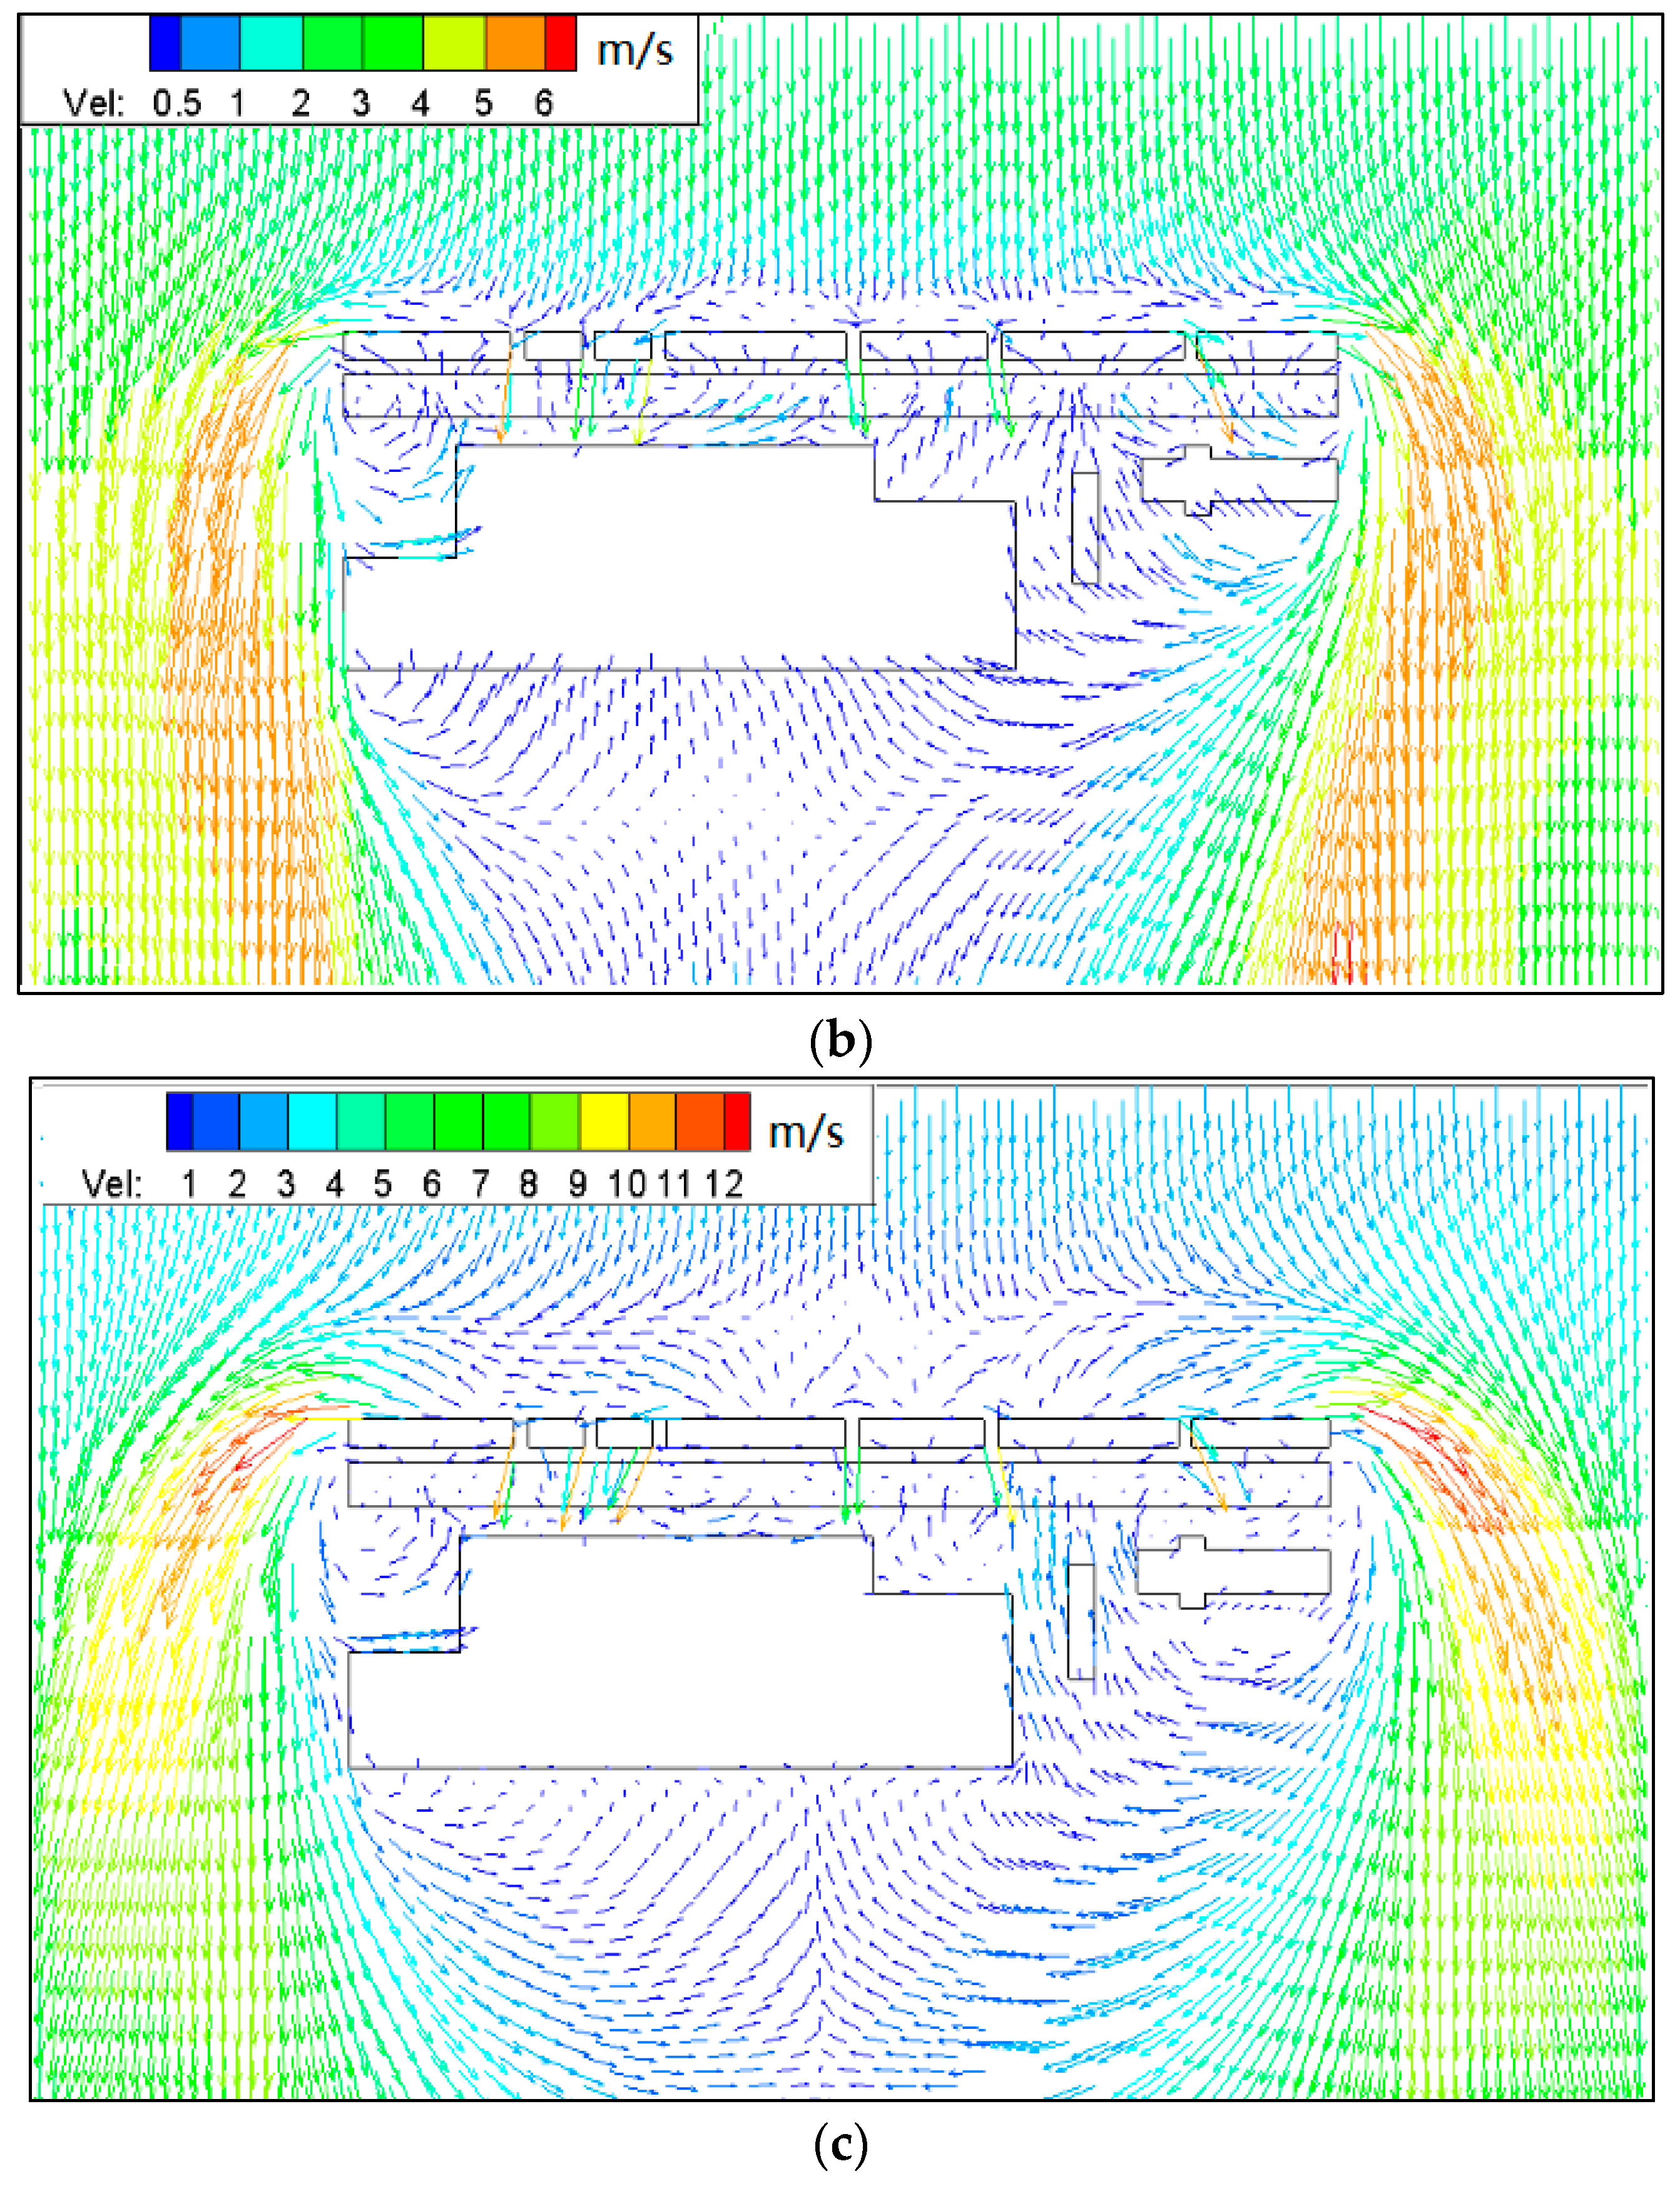
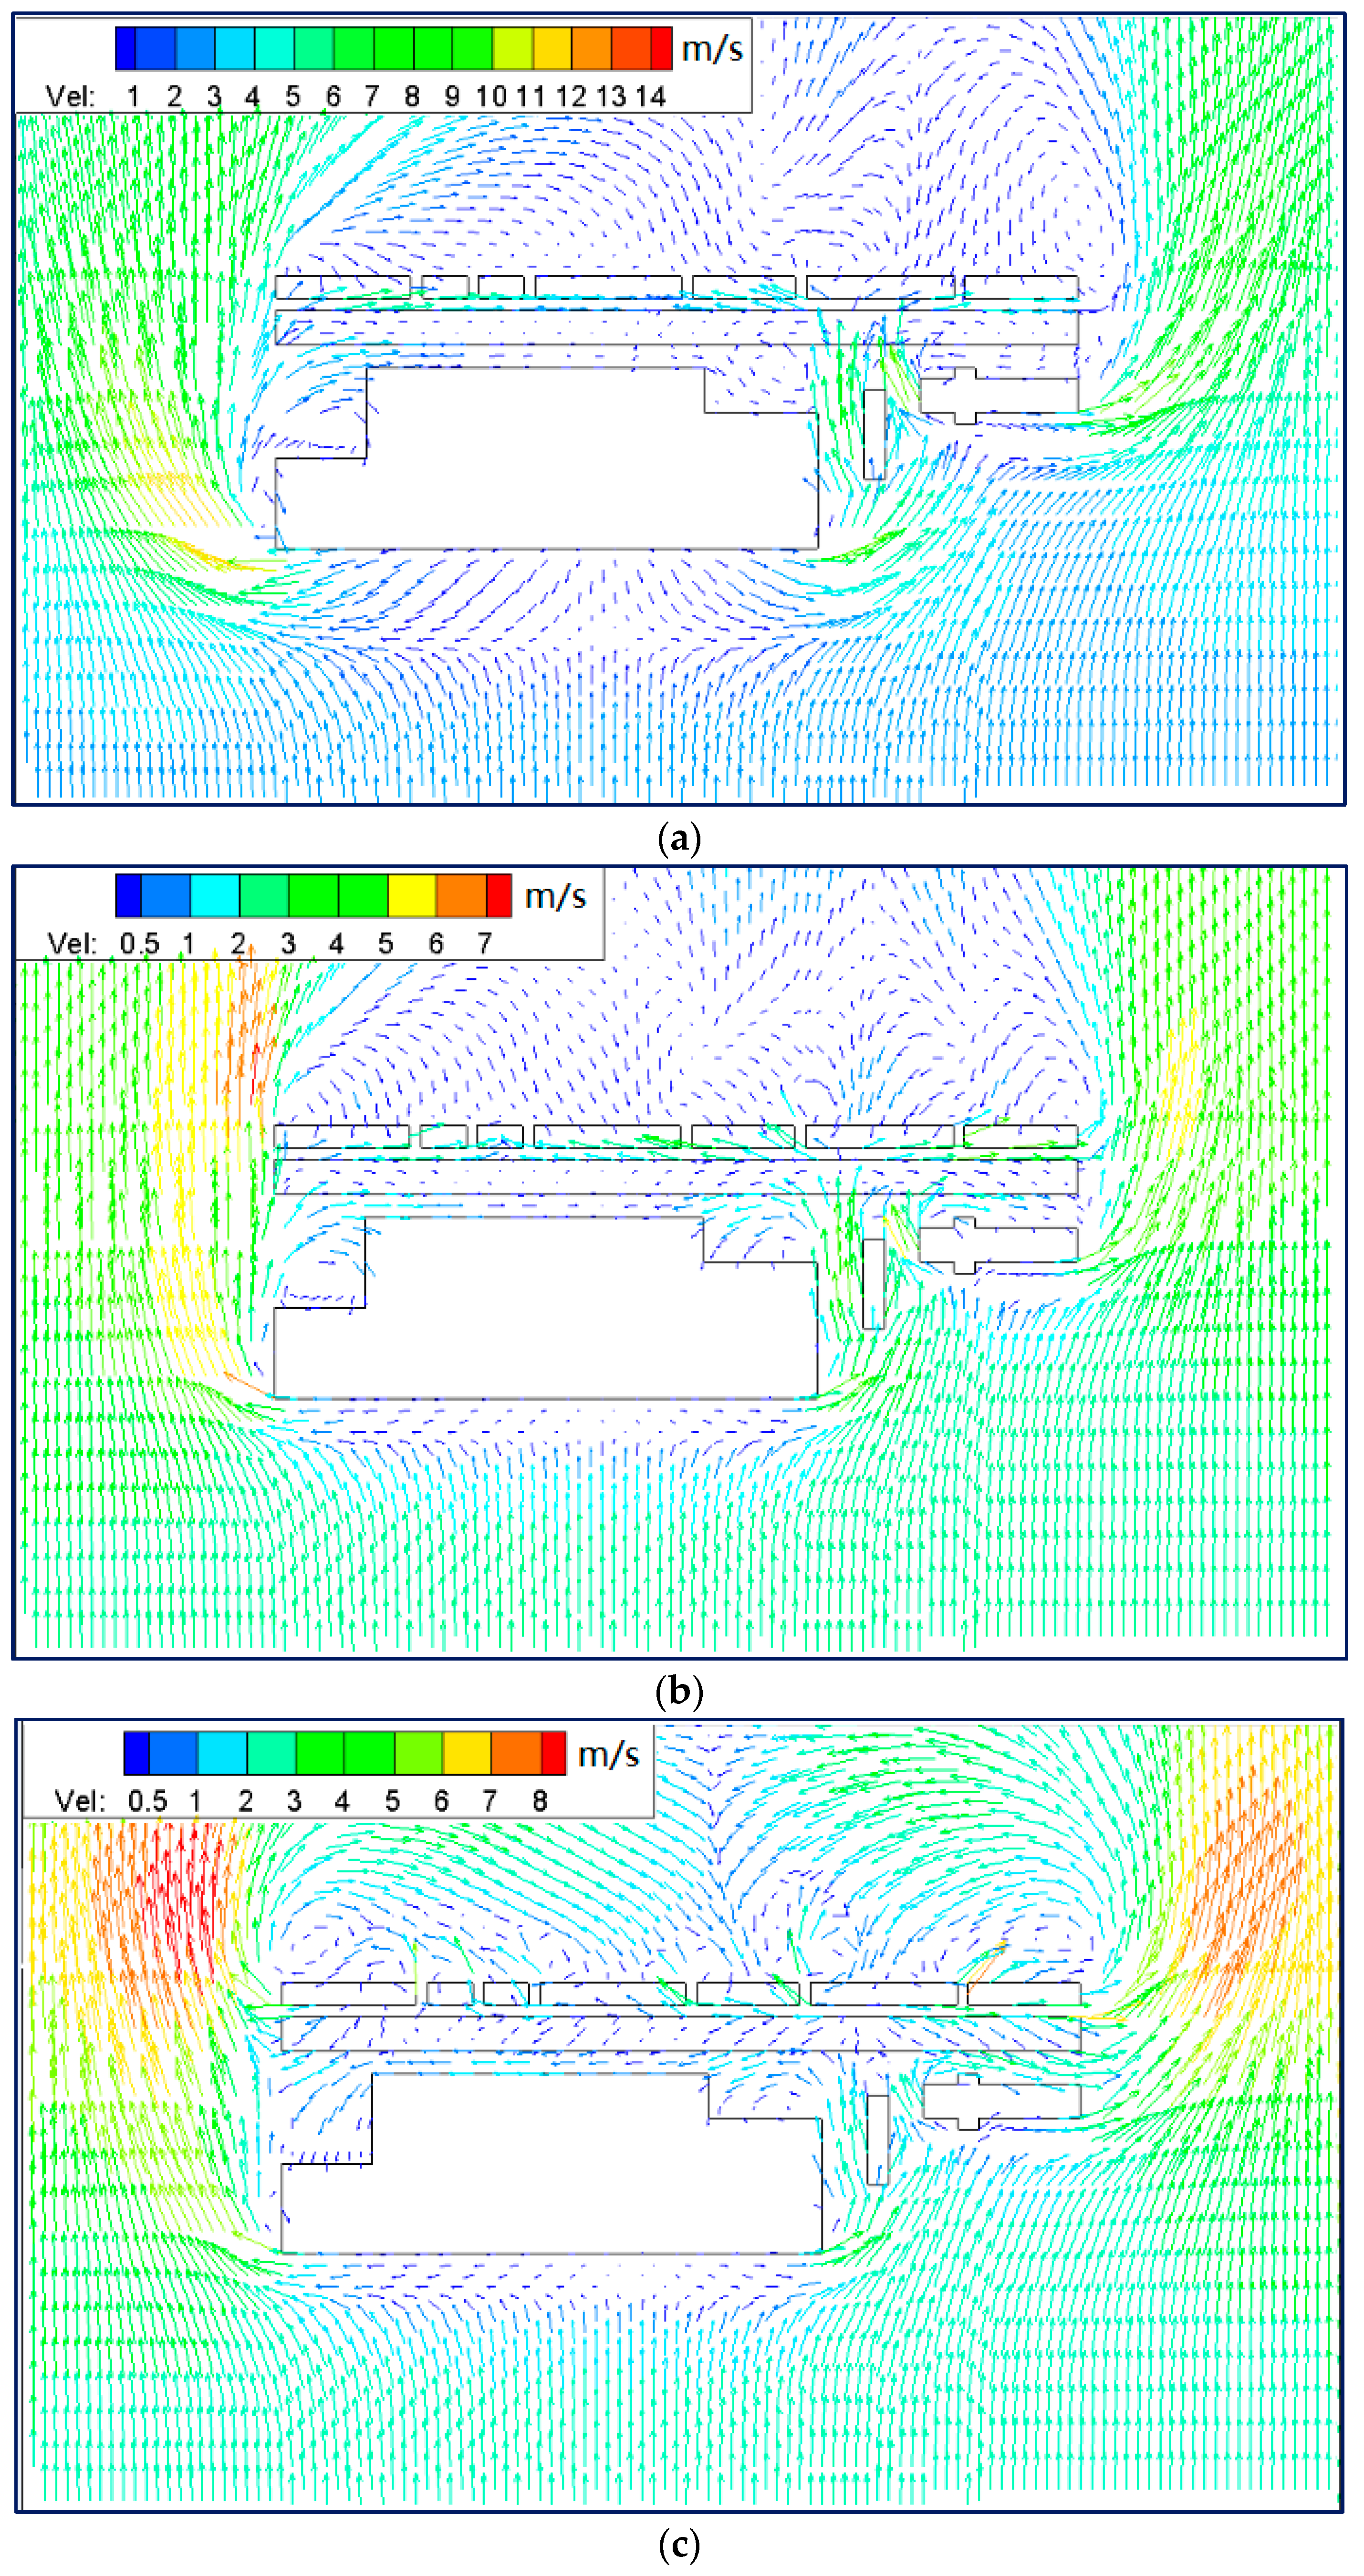
6.2.1. Distribution of PM10 and Streamlines of Wind Speed for Different Wind Directions
North Wind Direction
South Wind Direction
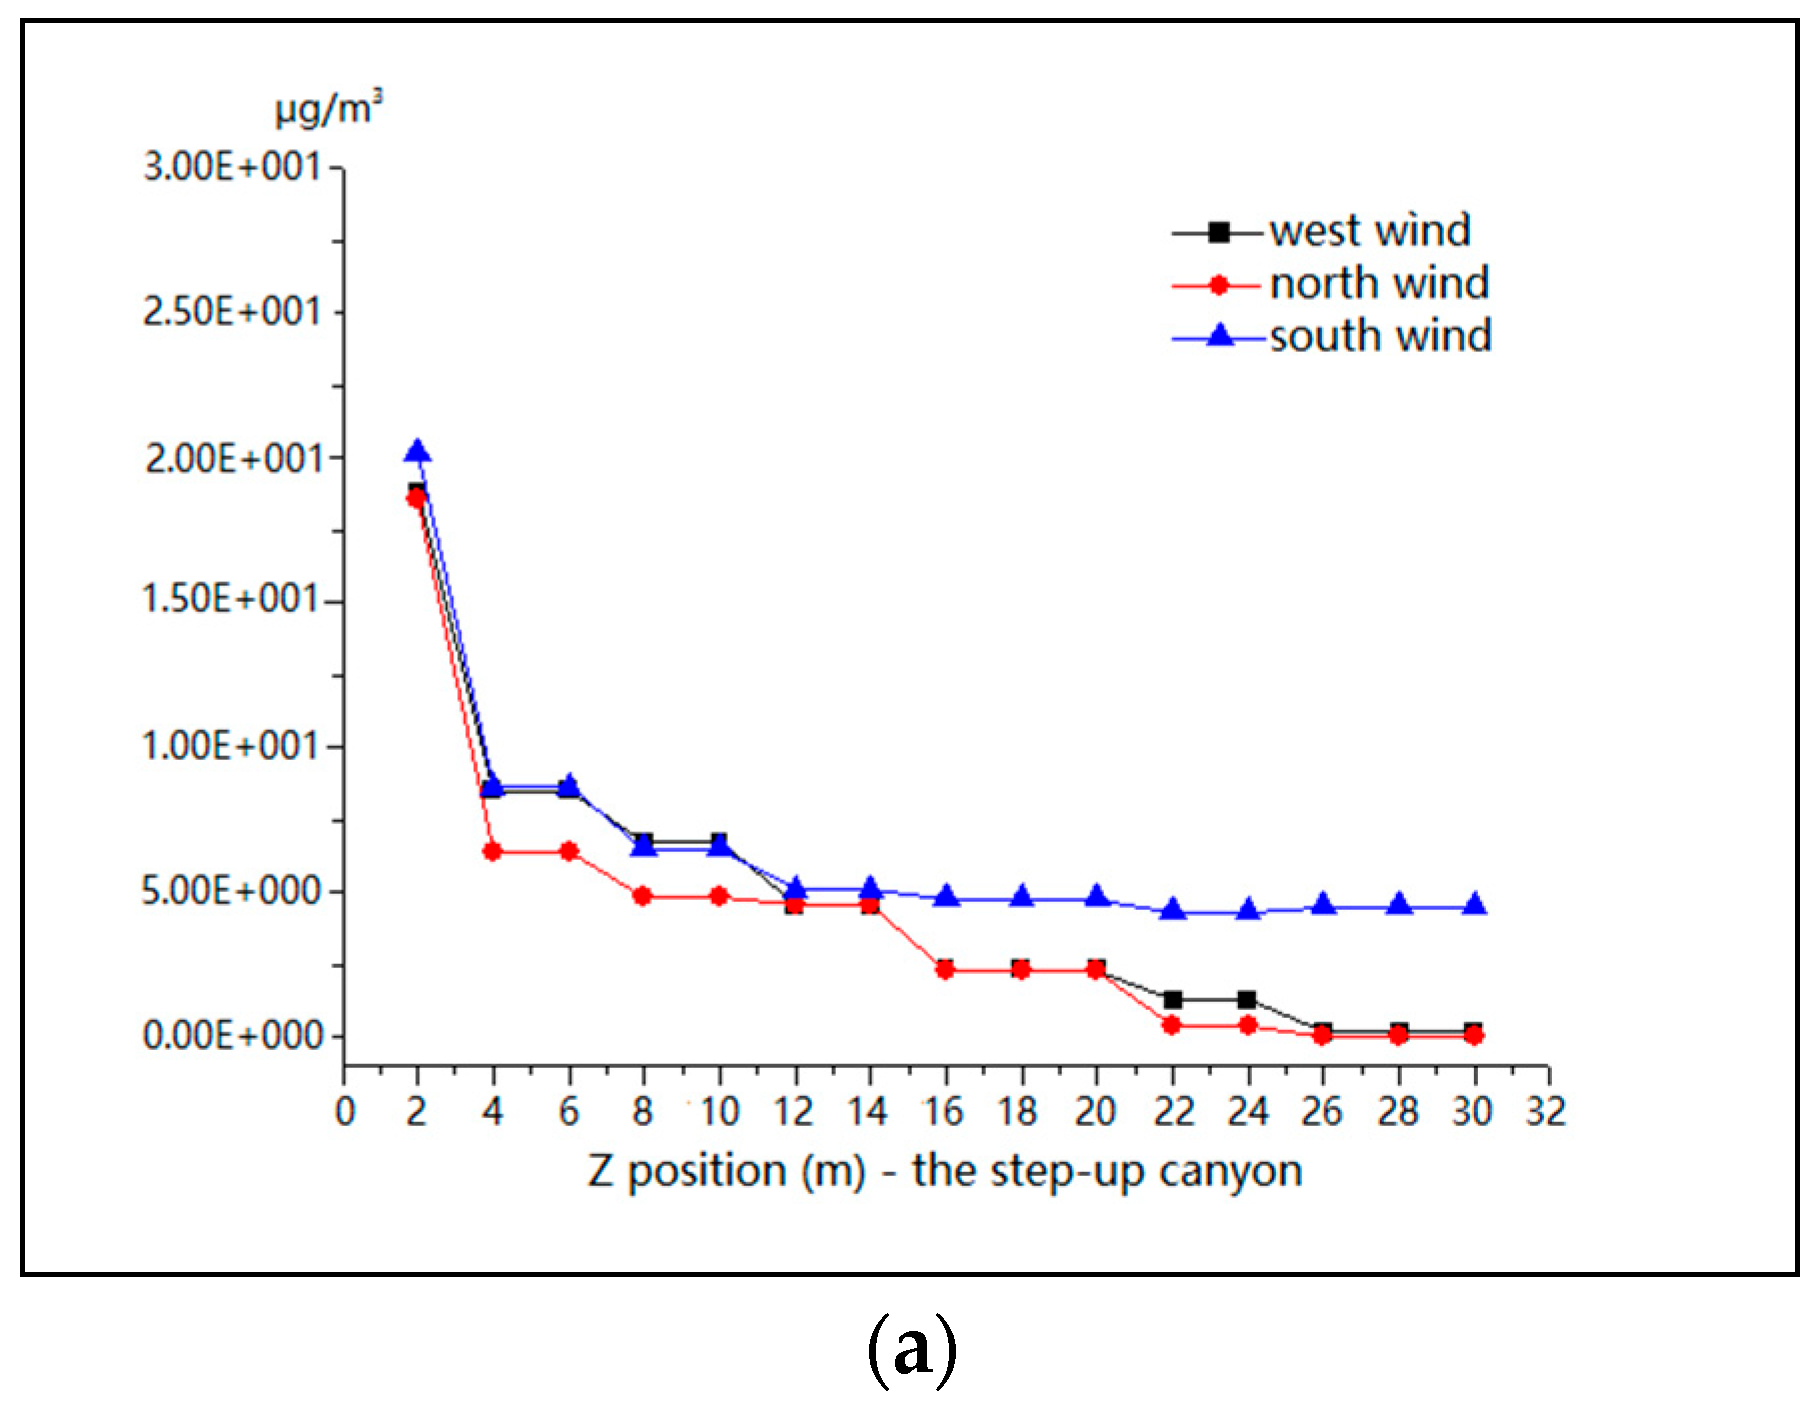
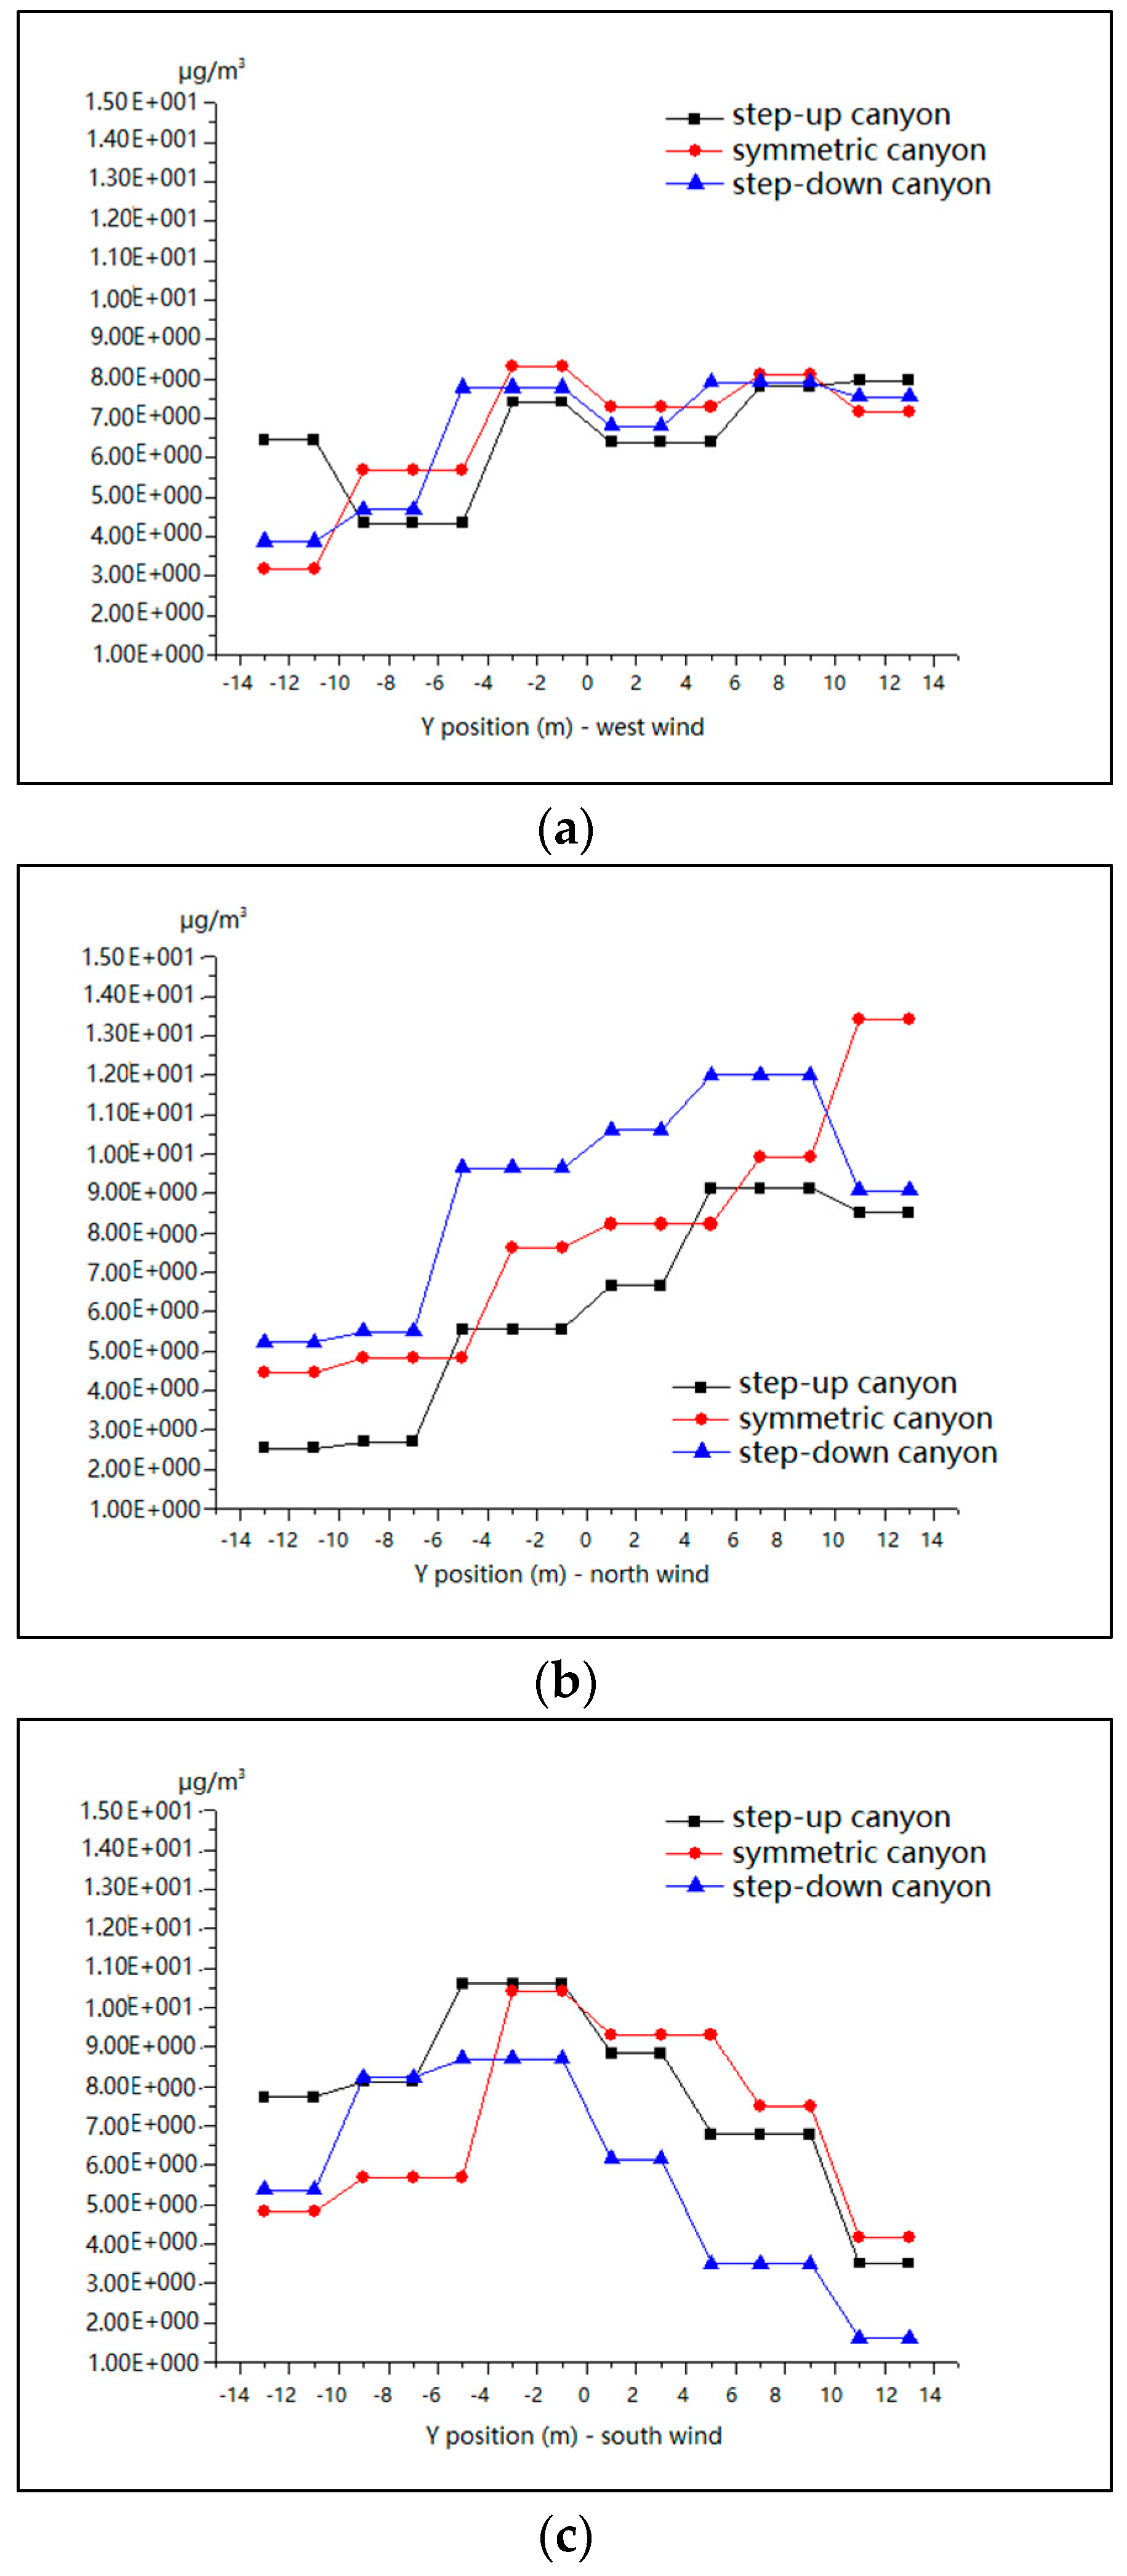
6.2.2. Mean Values of PM10 for Different Wind Directions
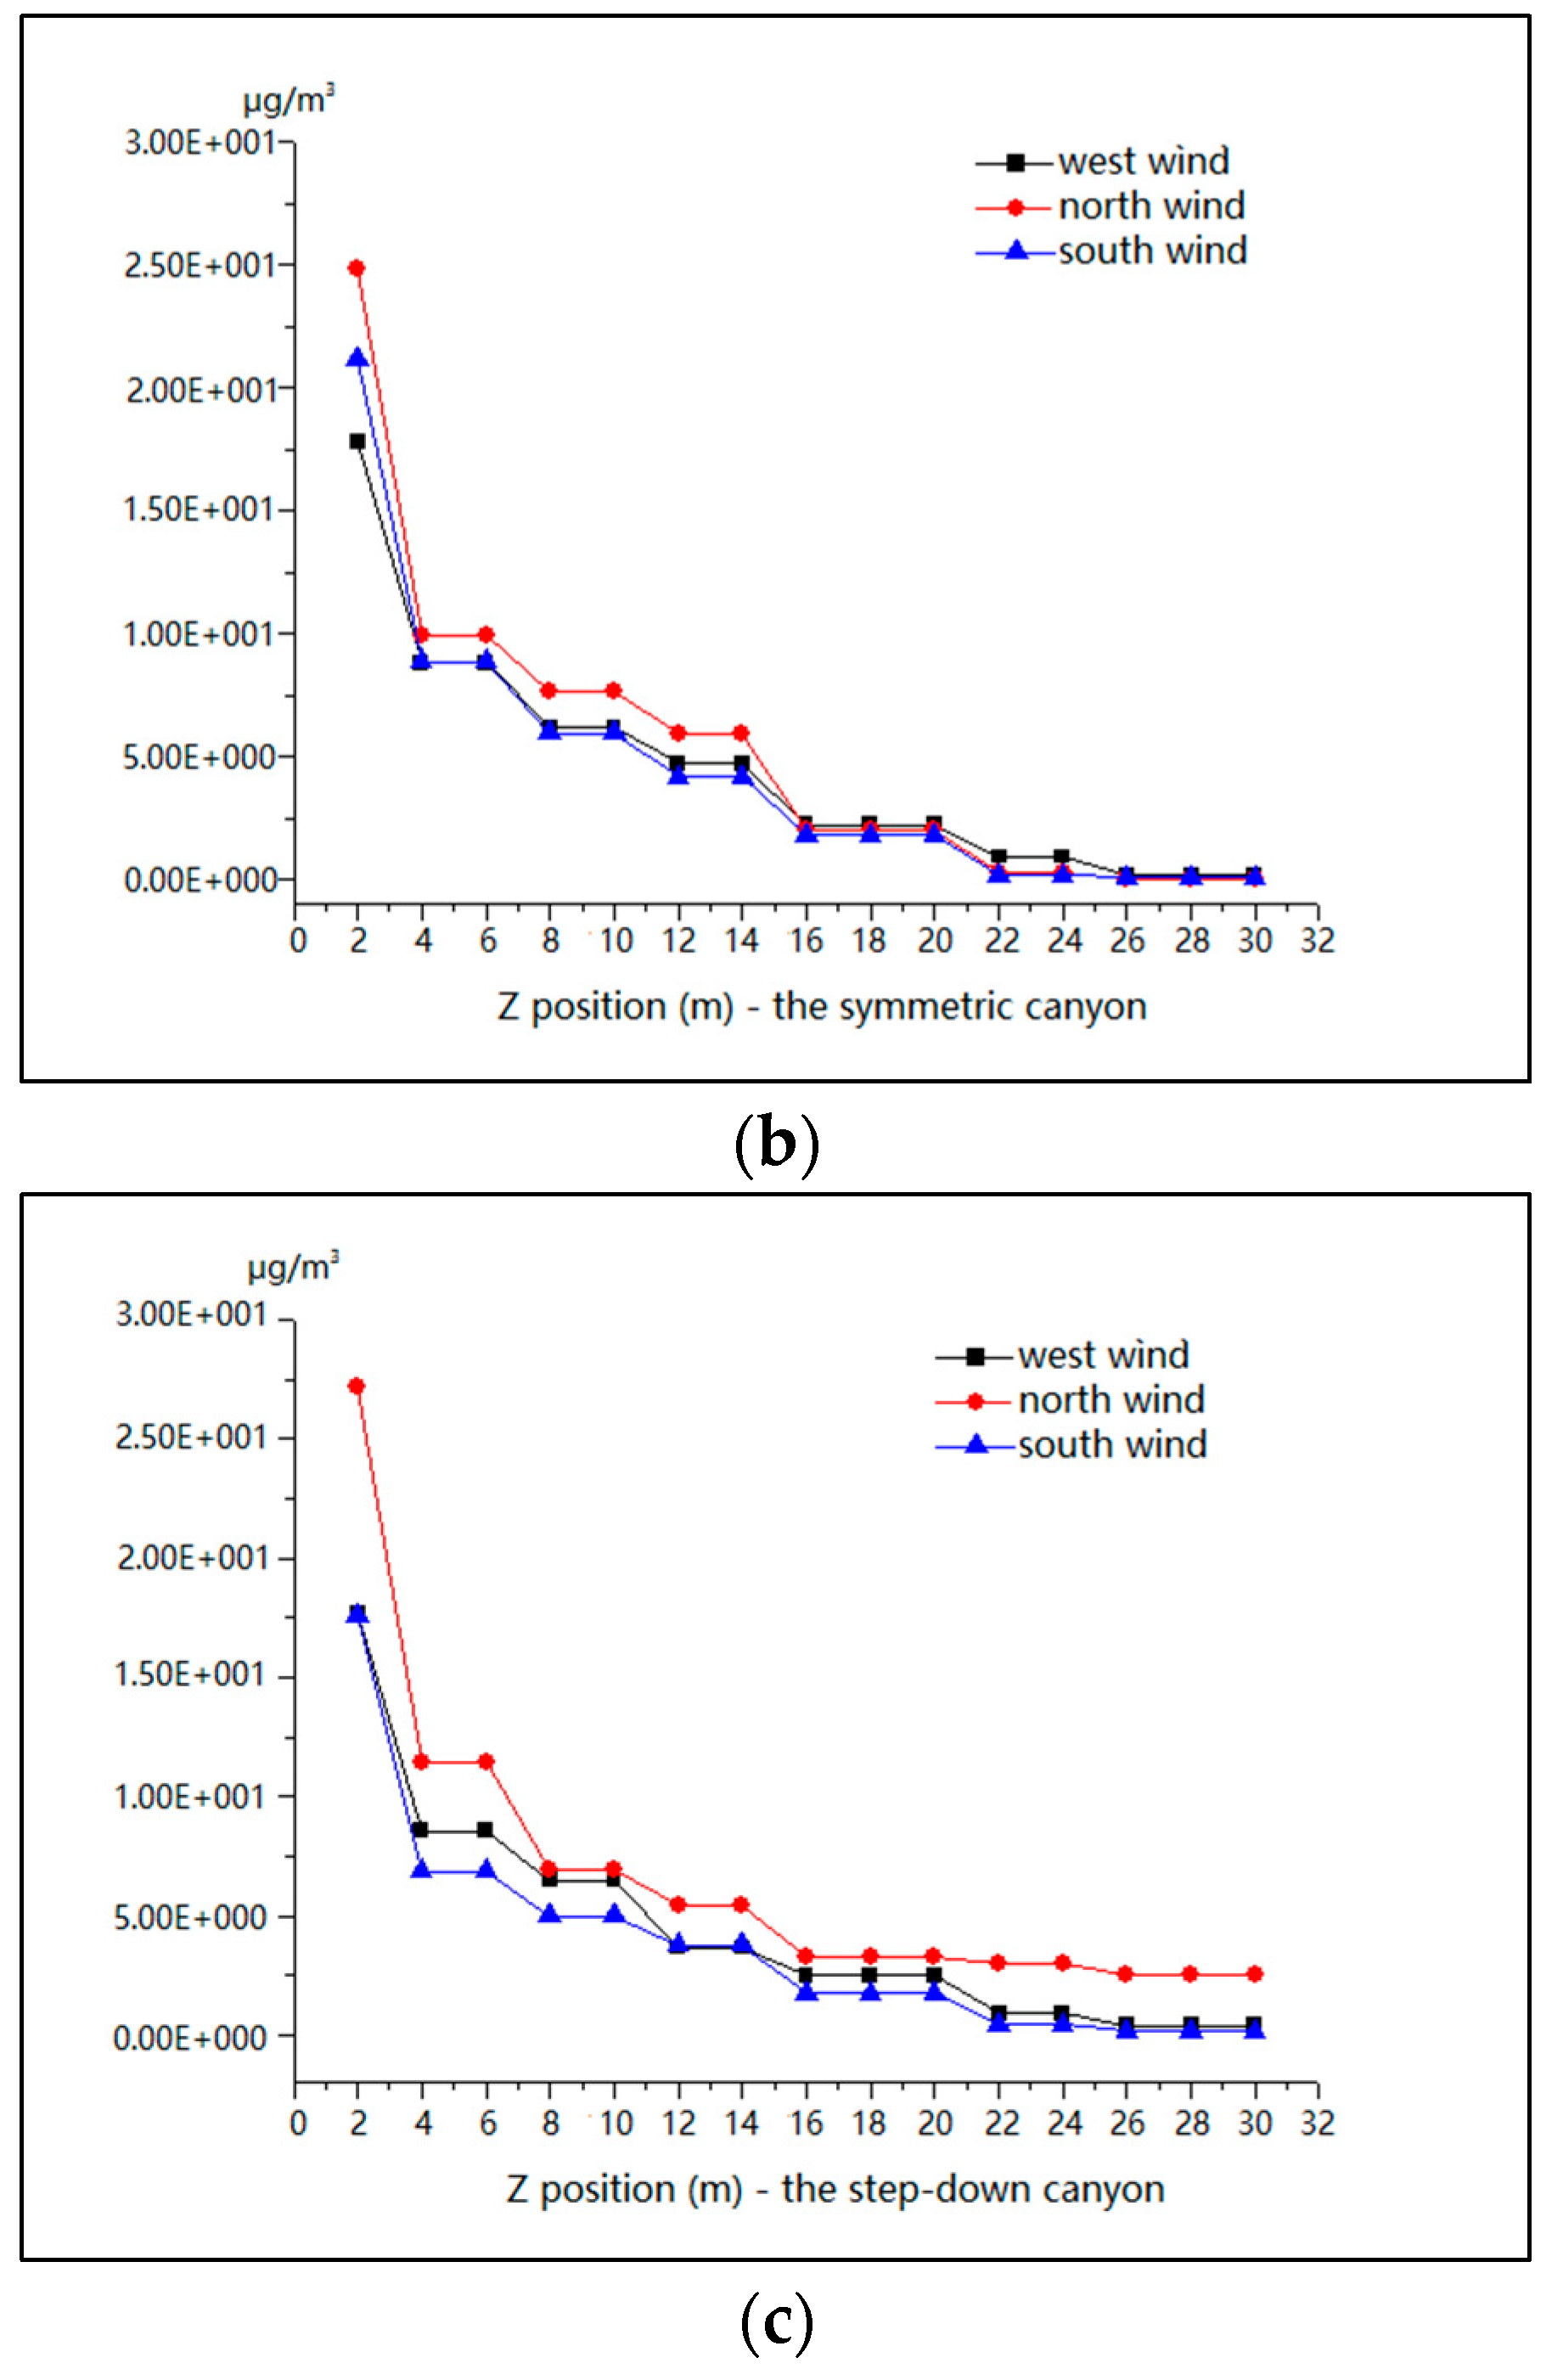
6.2.3. Mean Values of PM10 in Horizontal, Vertical and Lateral Planes for Different Wind Directions
7. Discussion
8. Conclusions
Acknowledgments
Author Contributions
Conflicts of Interest
References
- Habilomatis, G.; Chaloulakou, A. Ultrafine particles dispersion modeling in a street canyon: Development and evaluation of a composite lattice Boltzmann model. Sci. Total Environ. 2013, 463, 478–487. [Google Scholar] [CrossRef] [PubMed]
- Knibbs, L.D.; Cole-Hunter, T.; Morawska, L. A review of commuter exposure to ultrafine particles and its health effects. Atmos. Environ. 2011, 45, 2611–2622. [Google Scholar] [CrossRef] [Green Version]
- Li, X.X.; Liu, C.H.; Leung, D.Y.C.; Lam, K.M. Recent progress in CFD modelling of wind field and pollutant transport in street canyons. Atmos. Environ. 2006, 40, 5640–5658. [Google Scholar] [CrossRef]
- Deng, Q.H.; Lu, C.; Yu, C.W.F. Characterizing ambient concentration of PM10 in urban environment of central south China. Indoor Built Environ. 2015, 24, 324–339. [Google Scholar] [CrossRef]
- Han, S.Q.; Bian, H.; Zhang, Y.F.; Wu, J.H.; Wang, Y.M.; Tie, X.X.; Li, Y.H.; Li, X.J.; Yao, Q. Effect of Aerosols on Visibility and Radiation in Spring 2009 in Tianjin, China. Aerosol Air Qual. Res. 2012, 12, 211–217. [Google Scholar] [CrossRef]
- Peters, A.; Liu, E.; Verrier, R.L.; Schwartz, J.; Gold, D.R.; Mittleman, M.; Baliff, J.; Oh, J.A.; Allen, G.; Monahan, K.; et al. Air pollution and incidence of cardiac arrhythmia. Epidemiology 2000, 11, 11–17. [Google Scholar] [CrossRef] [PubMed]
- Loomis, D.; Grosse, Y.; Lauby-Secretan, B.; Ghissassi, F.E.; Bouvard, V.; Benbrahim-Tallaa, L.; Guha, N.; Baan, R.; Mattock, H.; Straif, K. The carcinogenicity of outdoor air pollution. Lancet Oncol. 2013, 14, 1262–1263. [Google Scholar] [CrossRef]
- Kampa, M.; Castanas, E. Human health effects of air pollution. Environ. Pollut. 2008, 151, 362–367. [Google Scholar] [CrossRef] [PubMed]
- Perez, N.; Pey, J.; Reche, C.; Cortes, J.; Alastuey, A.; Querol, X. Impact of harbour emissions on ambient PM10 and PM2.5 in Barcelona (Spain): Evidences of secondary aerosol formation within the urban area. Sci. Total Environ. 2016, 571, 237–250. [Google Scholar] [CrossRef] [PubMed]
- Karagulian, F.; Belis, C.A.; Dora, C.F.C.; Pruss-Ustun, A.M.; Bonjour, S.; Adair-Rohani, H.; Amann, M. Contributions to cities’ ambient particulate matter (PM): A systematic review of local source contributions at global level. Atmos. Environ. 2015, 120, 475–483. [Google Scholar] [CrossRef]
- Shi, G.L.; Tian, Y.Z.; Ma, T.; Song, D.L.; Zhou, L.D.; Han, B.; Feng, Y.C.; Russell, A.G. Size distribution, directional source contributions and pollution status of PM from Chengdu, China during a long-term sampling campaign. J. Environ. Sci. 2016, 56, 1–11. [Google Scholar] [CrossRef] [PubMed]
- Wu, Z.Z.; Zhang, X.L.; Wu, M. Mitigating construction dust pollution: State of the art and the way forward. J. Clean. Prod. 2016, 112, 1658–1666. [Google Scholar] [CrossRef]
- Zhang, X.L.; Shen, L.Y.; Zhang, L. Life cycle assessment of the air emissions during building construction process: A case study in Hong Kong. Renew. Sustain. Energy Rev. 2013, 17, 160–169. [Google Scholar] [CrossRef]
- Xie, H.M.; Huang, Z.J.; Wang, S. The impact of urban street layout on local atmospheric environment. Build. Environ. 2006, 41, 1352–1363. [Google Scholar]
- Zhou, Y.; Levy, J.I. The impact of urban street canyons on population exposure to traffic-related primary pollutants. Atmos. Environ. 2008, 42, 3087–3098. [Google Scholar] [CrossRef]
- Vardoulakis, S.; Fisher, B.E.A.; Pericleous, K.; Gonzalez-Flesca, N. Modelling air quality in street canyons: A review. Atmos. Environ. 2003, 37, 155–182. [Google Scholar] [CrossRef]
- Faber, P.; Drewnick, F.; Borrmann, S. Aerosol particle and trace gas emissions from earthworks, road construction, and asphalt paving in Germany: Emission factors and influence on local air quality. Atmos. Environ. 2015, 122, 662–671. [Google Scholar] [CrossRef]
- Habilomatis, G.; Chaloulakou, A. A CFD modeling study in an urban street canyon for ultrafine particles and population exposure: The intake fraction approach. Sci. Total Environ. 2015, 530, 227–232. [Google Scholar] [CrossRef] [PubMed]
- Yazid, A.W.M.; Sidik, N.A.C.; Salim, S.M.; Saqr, K.M. A review on the flow structure and pollutant dispersion in urban street canyons for urban planning strategies. Simulation 2014, 90, 892–916. [Google Scholar] [CrossRef]
- Jin, X.M.; Yang, L.J.; Du, X.Z.; Yang, Y.P. Sensitivity analyses of ultrafine particle dispersion inside an isolated street canyon. Powder Technol. 2016, 304, 143–156. [Google Scholar] [CrossRef]
- Ahmad, K.; Khare, M.; Chaudhry, K.K. Wind tunnel simulation studies on dispersion at urban street canyons and intersections—A review. J. Wind Eng. Ind. Aerod. 2005, 93, 697–717. [Google Scholar] [CrossRef]
- Stabile, L.; Arpino, F.; Buonanno, G.; Russi, A.; Frattolillo, A. A simplified benchmark of ultrafine particle dispersion in idealized urban street canyons: A wind tunnel study. Build. Environ. 2015, 93, 186–198. [Google Scholar] [CrossRef]
- Li, X.L.; Wang, J.S.; Tu, X.D.; Liu, W.; Huang, Z. Vertical variations of particle number concentration and size distribution in a street canyon in Shanghai, China. Sci. Total Environ. 2007, 378, 306–316. [Google Scholar] [CrossRef] [PubMed]
- Kumar, P.; Fennell, P.; Britter, R. Measurements of particles in the 5–1000 nm range close to road level in an urban street canyon. Sci. Total Environ. 2008, 390, 437–447. [Google Scholar] [CrossRef] [PubMed] [Green Version]
- Kumar, P.; Fennell, P.; Langley, D.; Britter, R. Pseudo-simultaneous measurements for the vertical variation of Coarse, fine and ultrafine particles in an urban street canyon. Atmos. Environ. 2008, 42, 4304–4319. [Google Scholar] [CrossRef] [Green Version]
- Perret, L.; Blackman, K.; Savory, E. Combining Wind-Tunnel and Field Measurements of Street-Canyon Flow via Stochastic Estimation. Bound. Layer Meteorol. 2016, 161, 491–517. [Google Scholar] [CrossRef]
- Cui, P.Y.; Li, Z.; Tao, W.Q. Wind-tunnel measurements for thermal effects on the air flow and pollutant dispersion through different scale urban areas. Build. Environ. 2016, 97, 137–151. [Google Scholar] [CrossRef]
- Blackman, K.; Perret, L.; Savory, E.; Piquet, T. Field and wind tunnel modeling of an idealized street canyon flow. Atmos. Environ. 2015, 106, 139–153. [Google Scholar] [CrossRef]
- Mirzaei-Parham, A.; Carmeliet, J. Dynamical computational fluid dynamics modeling of the stochastic wind for application of urban studies. Build. Environ. 2013, 70, 161–170. [Google Scholar] [CrossRef]
- Memon, R.A.; Leung, D.Y.C.; Liu, C.H. Effects of building aspect ratio and wind speed on air temperatures in urban-like street canyons. Build. Environ. 2010, 45, 176–188. [Google Scholar] [CrossRef]
- Vardoulakis, S.; Dimitrova, R.; Richards, K.; Hamlyn, D.; Camilleri, G.; Weeks, M.; Sini, J.-F.; Britter, R.; Borrego, C.; Schatzmann, M.; et al. Numerical Model Inter-comparison for Wind Flow and Turbulence Around Single-Block Buildings. Environ. Model. Assess. 2011, 16, 169–181. [Google Scholar] [CrossRef]
- Tominaga, Y.; Stathopoulos, T. CFD modeling of pollution dispersion in a street canyon: Comparison between LES and RANS. J. Wind Eng. Ind. Aerod. 2011, 99, 340–348. [Google Scholar] [CrossRef]
- Hang, J.; Li, Y.G.; Sandberg, M.; Buccolieri, R.; Di Sabatino, S. The influence of building height variability on pollutant dispersion and pedestrian ventilation in idealized high-rise urban areas. Build. Environ. 2012, 56, 346–360. [Google Scholar] [CrossRef]
- Ai, Z.T.; Mak, C.M. CFD simulation of flow in a long street canyon under a perpendicular wind direction: Evaluation of three computational settings. Build. Environ. 2017, 114, 293–306. [Google Scholar] [CrossRef]
- Mei, D.; Deng, Q.H.; Wen, M.; Fang, Z. Evaluating Dust Particle Transport Performance within Urban Street Canyons with Different Building Heights. Aerosol. Air Qual. Res. 2016, 16, 1483–1496. [Google Scholar] [CrossRef]
- Chan, A.T.; Au, W.T.W.; So, E.S.P. Strategic guidelines for street canyon geometry to achieve sustainable street air quality—Part II: Multiple canopies and canyons. Atmos. Environ. 2003, 37, 2761–2772. [Google Scholar] [CrossRef]
- Hoydysh, W.G.; Dabberdt, W.F. Kinematics and Dispersion Characteristics of Flows in Asymmetric Street Canyons. Atmos. Environ. 1988, 22, 2677–2689. [Google Scholar] [CrossRef]
- Assimakopoulos, V.D.; ApSimon, H.M.; Moussiopoulos, N. A numerical study of atmospheric pollutant dispersion in different two-dimensional street canyon configurations. Atmos. Environ. 2003, 37, 4037–4049. [Google Scholar] [CrossRef]
- Garcia, J.; Cerdeira, R.; Tavares, N.; Coelho, L.M.R.; Kumar, P.; Carvalho, M.G. Influence of virtual changes in building configurations of a real street canyon on the dispersion of PM10. Urban Clim. 2013, 5, 68–81. [Google Scholar] [CrossRef] [Green Version]
- Kim, J.J.; Baik, J.J. A numerical study of the effects of ambient wind direction on flow and dispersion in urban street canyons using the RNG k-epsilon turbulence model. Atmos. Environ. 2004, 38, 3039–3048. [Google Scholar] [CrossRef]
- Soulhac, L.; Perkins, R.J.; Salizzoni, P. Flow in a street canyon for any external wind direction. Bound. Layer Meteorol. 2008, 126, 365–388. [Google Scholar] [CrossRef]
- Soulhac, L.; Salizzoni, P. Dispersion in a street canyon for a wind direction parallel to the street axis. J. Wind Eng. Ind. Aerod. 2010, 98, 903–910. [Google Scholar] [CrossRef]
- Buccolieri, R.; Salim, S.M.; Leo, L.S.; Di Sabatino, S.; Chan, A.D.; Ielpo, P.; de Gennaro, G.; Gromke, C. Analysis of local scale tree-atmosphere interaction on pollutant concentration in idealized street canyons and application to a real urban junction. Atmos. Environ. 2011, 45, 1702–1713. [Google Scholar] [CrossRef]
- Kao, H.M.; Chang, T.J.; Hsieh, Y.F.; Wang, C.H.; Hsieh, C.I. Comparison of airflow and particulate matter transport in multi-room buildings for different natural ventilation patterns. Energy Build. 2009, 41, 966–974. [Google Scholar] [CrossRef]
- Xinhuanet. Official Reply of the National Development and Reform Commission on the Planning of the Urban Rail Transit in Wuhan City (Stage 3). Available online: http://www.xinhuanet.com/politics/2016-09/08/c_129274313.htm (accessed on 8 September 2016).
- A Large Scale of Subways under Construction: The Urban Rail Transit Planning Has Received Approval in Cities. Available online: http://www.sdpc.gov.cn/gzdt/201506/t20150623_696771.html (accessed on 12 June 2015).
- Best Practice Guideline for the CFD Simulation of Flows in the Urban Environment. Available online: http://theairshed.com/pdf/COST%20732%20Best%20Practice%20Guideline%20May%202007.pdf (accessed on 1 May 2017).
- Miao, Y.C.; Liu, S.H.; Zheng, Y.J.; Wang, S.; Li, Y. Numerical Study of Traffic Pollutant Dispersion within Different Street Canyon Configurations. Adv. Meteorol. 2014, 3, 1–14. [Google Scholar] [CrossRef]
- Feustel, H.E. COMIS—An international multizone air-flow and contaminant transport model. Energy Build. 1999, 30, 3–18. [Google Scholar] [CrossRef]
- Wieringa, J. Updating the Davenport Roughness Classification. J. Wind Eng. Ind. Aerod. 1992, 41, 357–368. [Google Scholar] [CrossRef]
- Fu, Z.; Sun, Z.; Yang, W.; Xie, X.F. Numerical simulation of fine particles dispersion in urban street canyon based on DPM model. J. China Univ. Metrol. 2011, 22, 322–326. (In Chinese) [Google Scholar]
- Zhong, J.; Cai, X.M.; Bloss, W.J. Coupling dynamics and chemistry in the air pollution modelling of street canyons: A review. Environ. Pollut. 2016, 214, 690–704. [Google Scholar] [CrossRef] [PubMed]
- Tiwari, S.; Dumka, U.C.; Gautam, A.S.; Kaskaoutis, D.G.; Srivastava, A.K.; Bisht, D.S.; Chakrabarty, R.K.; Sumlin, B.J.; Solmon, F. Assessment of PM2.5 and PM10 over Guwahati in Brahmaputra River Valley: Temporal evolution, source apportionment and meteorological dependence. Atmos. Pollut. Res. 2017, 8, 13–28. [Google Scholar] [CrossRef]
- Muleski, G.E.; Cowherd, C.; Kinsey, J.S. Particulate emissions from construction activities. J. Air Waste Manag. 2005, 55, 772–783. [Google Scholar] [CrossRef]
- Aggregate Handling and Storage Piles. Available online: https://www3.epa.gov/ttn/chief/ap42/ch13/final/c13s0204.pdf (accessed on 24 January 2018).
- Emission Factor Documentation for AP-42. Available online: https://www3.epa.gov/ttn/chief/ap42/ch13/bgdocs/b13s0201.pdf (accessed on 24 January 2018).
- Gao, H. Analysis on Raised Dust Pollution Emission during Road Subgrade Construction; Shandong University: Jinan, China, 2007. [Google Scholar]
- Xie, S.; Zhang, Y.; Qi, L.; Tang, X. Spatial distribution of traffic-related pollutant concentrations in street canyons. Atmos. Environ. 2003, 37, 3213–3224. [Google Scholar] [CrossRef]
- Pavageau, M.; Schatzmann, M. Wind tunnel measurements of concentration fluctuations in an urban street canyon. Atmos. Environ. 1999, 33, 3961–3971. [Google Scholar] [CrossRef]
- Dabberdt, W.F.; Hoydysh, W.G. Street Canyon Dispersion—Sensitivity to Block Shape and Entrainment. Atmos. Environ. 1991, 25, 1143–1153. [Google Scholar] [CrossRef]
- Baik, J.J.; Kim, J.J. On the escape of pollutants from urban street canyons. Atmos. Environ. 2002, 36, 527–536. [Google Scholar] [CrossRef]
- Longley, I.D.; Gallagher, M.W.; Dorsey, J.R.; Flynn, M.; Bower, K.N.; Allan, J.D. Street canyon aerosol pollutant transport measurements. Sci. Total Environ. 2004, 334, 327–336. [Google Scholar] [CrossRef] [PubMed]
- Vakeva, M.; Hameri, K.; Kulmala, M.; Lahdes, R.; Ruuskanen, J.; Laitinen, T. Street level versus rooftop concentrations of submicron aerosol particles and gaseous pollutants in an urban street canyon. Atmos. Environ. 1999, 33, 1385–1397. [Google Scholar] [CrossRef]
- Longley, I.D.; Gallagher, M.W.; Dorsey, J.R.; Flynn, M.; Allan, J.D.; Alfarra, M.R.; Inglis, D. A case study of aerosol (4.6 nm < D-p < 10 μm) number and mass size distribution measurements in a busy street canyon in Manchester, UK. Atmos. Environ. 2003, 37, 1563–1571. [Google Scholar]
- Huang, H.; Akutsu, Y.; Arai, M.; Tamura, M. A two-dimensional air quality model in an urban street canyon: Evaluation and sensitivity analysis. Atmos. Environ. 2000, 34, 689–698. [Google Scholar] [CrossRef]


| Caption | W (m) | L (m) | H (m) | HA (m) | HB (m) | HA/HB | Classification |
|---|---|---|---|---|---|---|---|
| model 1 | 30 | 355 | 15 | 15 | 30 | 0.5 | Step-up street canyon |
| model 2 | 30 | 355 | 15 | 15 | 15 | 1 | Symmetric street canyon |
| model 3 | 30 | 355 | 15 | 30 | 15 | 2 | Step-down street canyon |
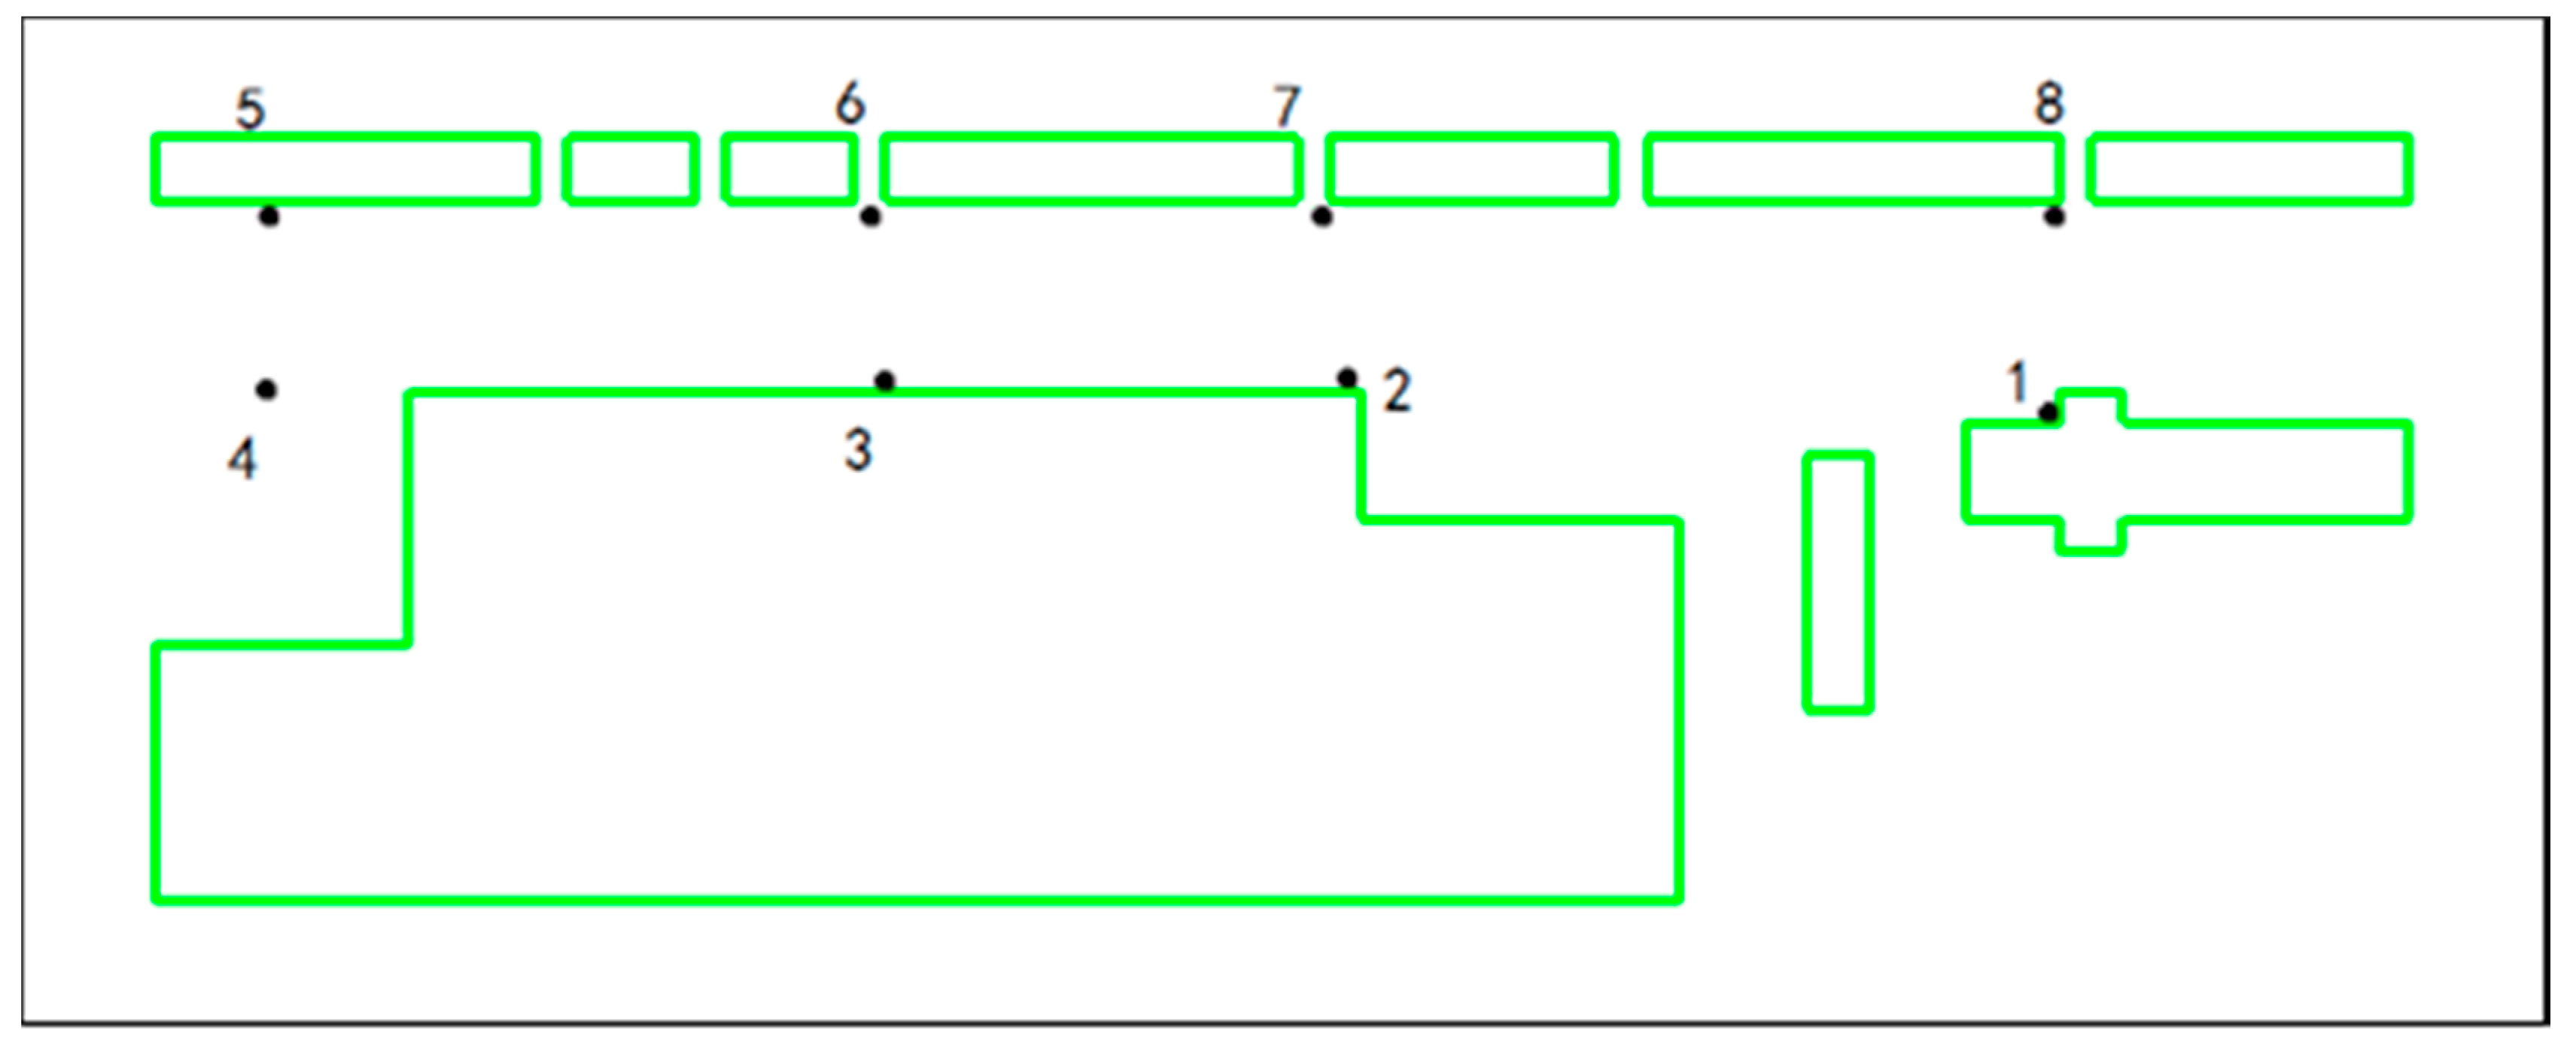
| PM10 Concentration (μg m−3) | Measurement | Numerical Simulation X2 | Deviation |X2−X1|/X1 | ||
|---|---|---|---|---|---|
| Average Value X1 | Max. | Min. | |||
| Point 1 | 52 | 57 | 24 | 51 | 1.9% |
| Point 2 | 47 | 55 | 14 | 45 | 4.2% |
| Point 3 | 47 | 54 | 46 | 44 | 6.3% |
| Point 4 | 28 | 35 | 18 | 25 | 10.7% |
| Point 5 | 32 | 46 | 15 | 28 | 12.5% |
| Point 6 | 41 | 53 | 16 | 39 | 4.8% |
| Point 7 | 43 | 48 | 19 | 45 | 4.6% |
| Point 8 | 47 | 57 | 33 | 50 | 6.3% |
| Mean value | 42 | 51 | 23 | 40 | 4.7% |
| Caption | Parallel Flow | Perpendicular Flow | |
|---|---|---|---|
| West Wind | North Wind | South Wind | |
| model 1 | 18.7 | 18.6 | 20.2 |
| model 2 | 17.8 | 21.8 | 19.8 |
| model 3 | 17.7 | 27.2 | 17.6 |
© 2018 by the authors. Licensee MDPI, Basel, Switzerland. This article is an open access article distributed under the terms and conditions of the Creative Commons Attribution (CC BY) license (http://creativecommons.org/licenses/by/4.0/).
Share and Cite
Wang, Y.; Zhou, Y.; Zuo, J.; Rameezdeen, R. A Computational Fluid Dynamic (CFD) Simulation of PM10 Dispersion Caused by Rail Transit Construction Activity: A Real Urban Street Canyon Model. Int. J. Environ. Res. Public Health 2018, 15, 482. https://doi.org/10.3390/ijerph15030482
Wang Y, Zhou Y, Zuo J, Rameezdeen R. A Computational Fluid Dynamic (CFD) Simulation of PM10 Dispersion Caused by Rail Transit Construction Activity: A Real Urban Street Canyon Model. International Journal of Environmental Research and Public Health. 2018; 15(3):482. https://doi.org/10.3390/ijerph15030482
Chicago/Turabian StyleWang, Yang, Ying Zhou, Jian Zuo, and Raufdeen Rameezdeen. 2018. "A Computational Fluid Dynamic (CFD) Simulation of PM10 Dispersion Caused by Rail Transit Construction Activity: A Real Urban Street Canyon Model" International Journal of Environmental Research and Public Health 15, no. 3: 482. https://doi.org/10.3390/ijerph15030482