Neighborhood Variation of Sustainable Urban Morphological Characteristics

 , , ,
, , , 
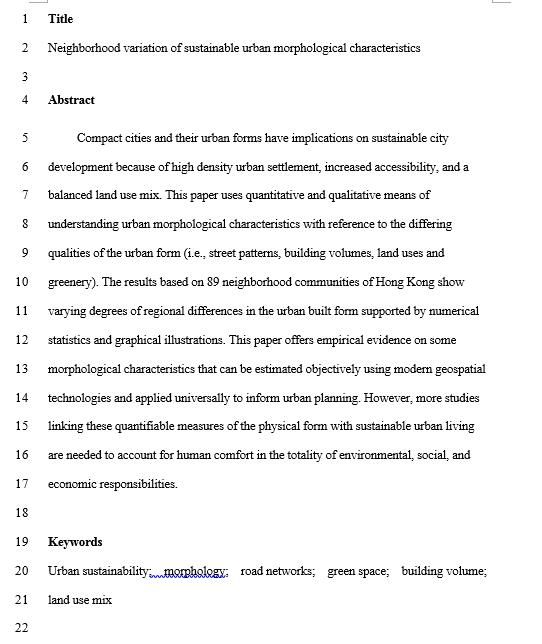
Abstract
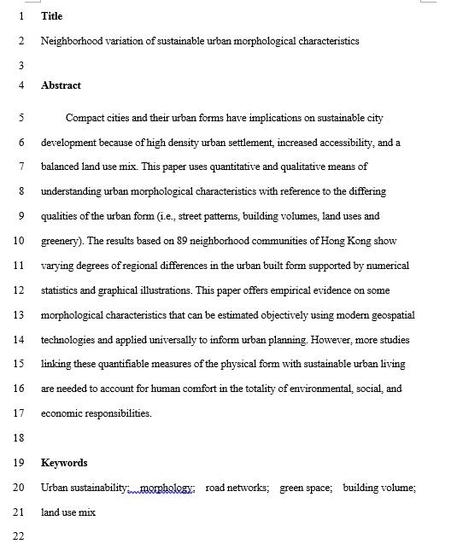
1. Introduction
2. Methods
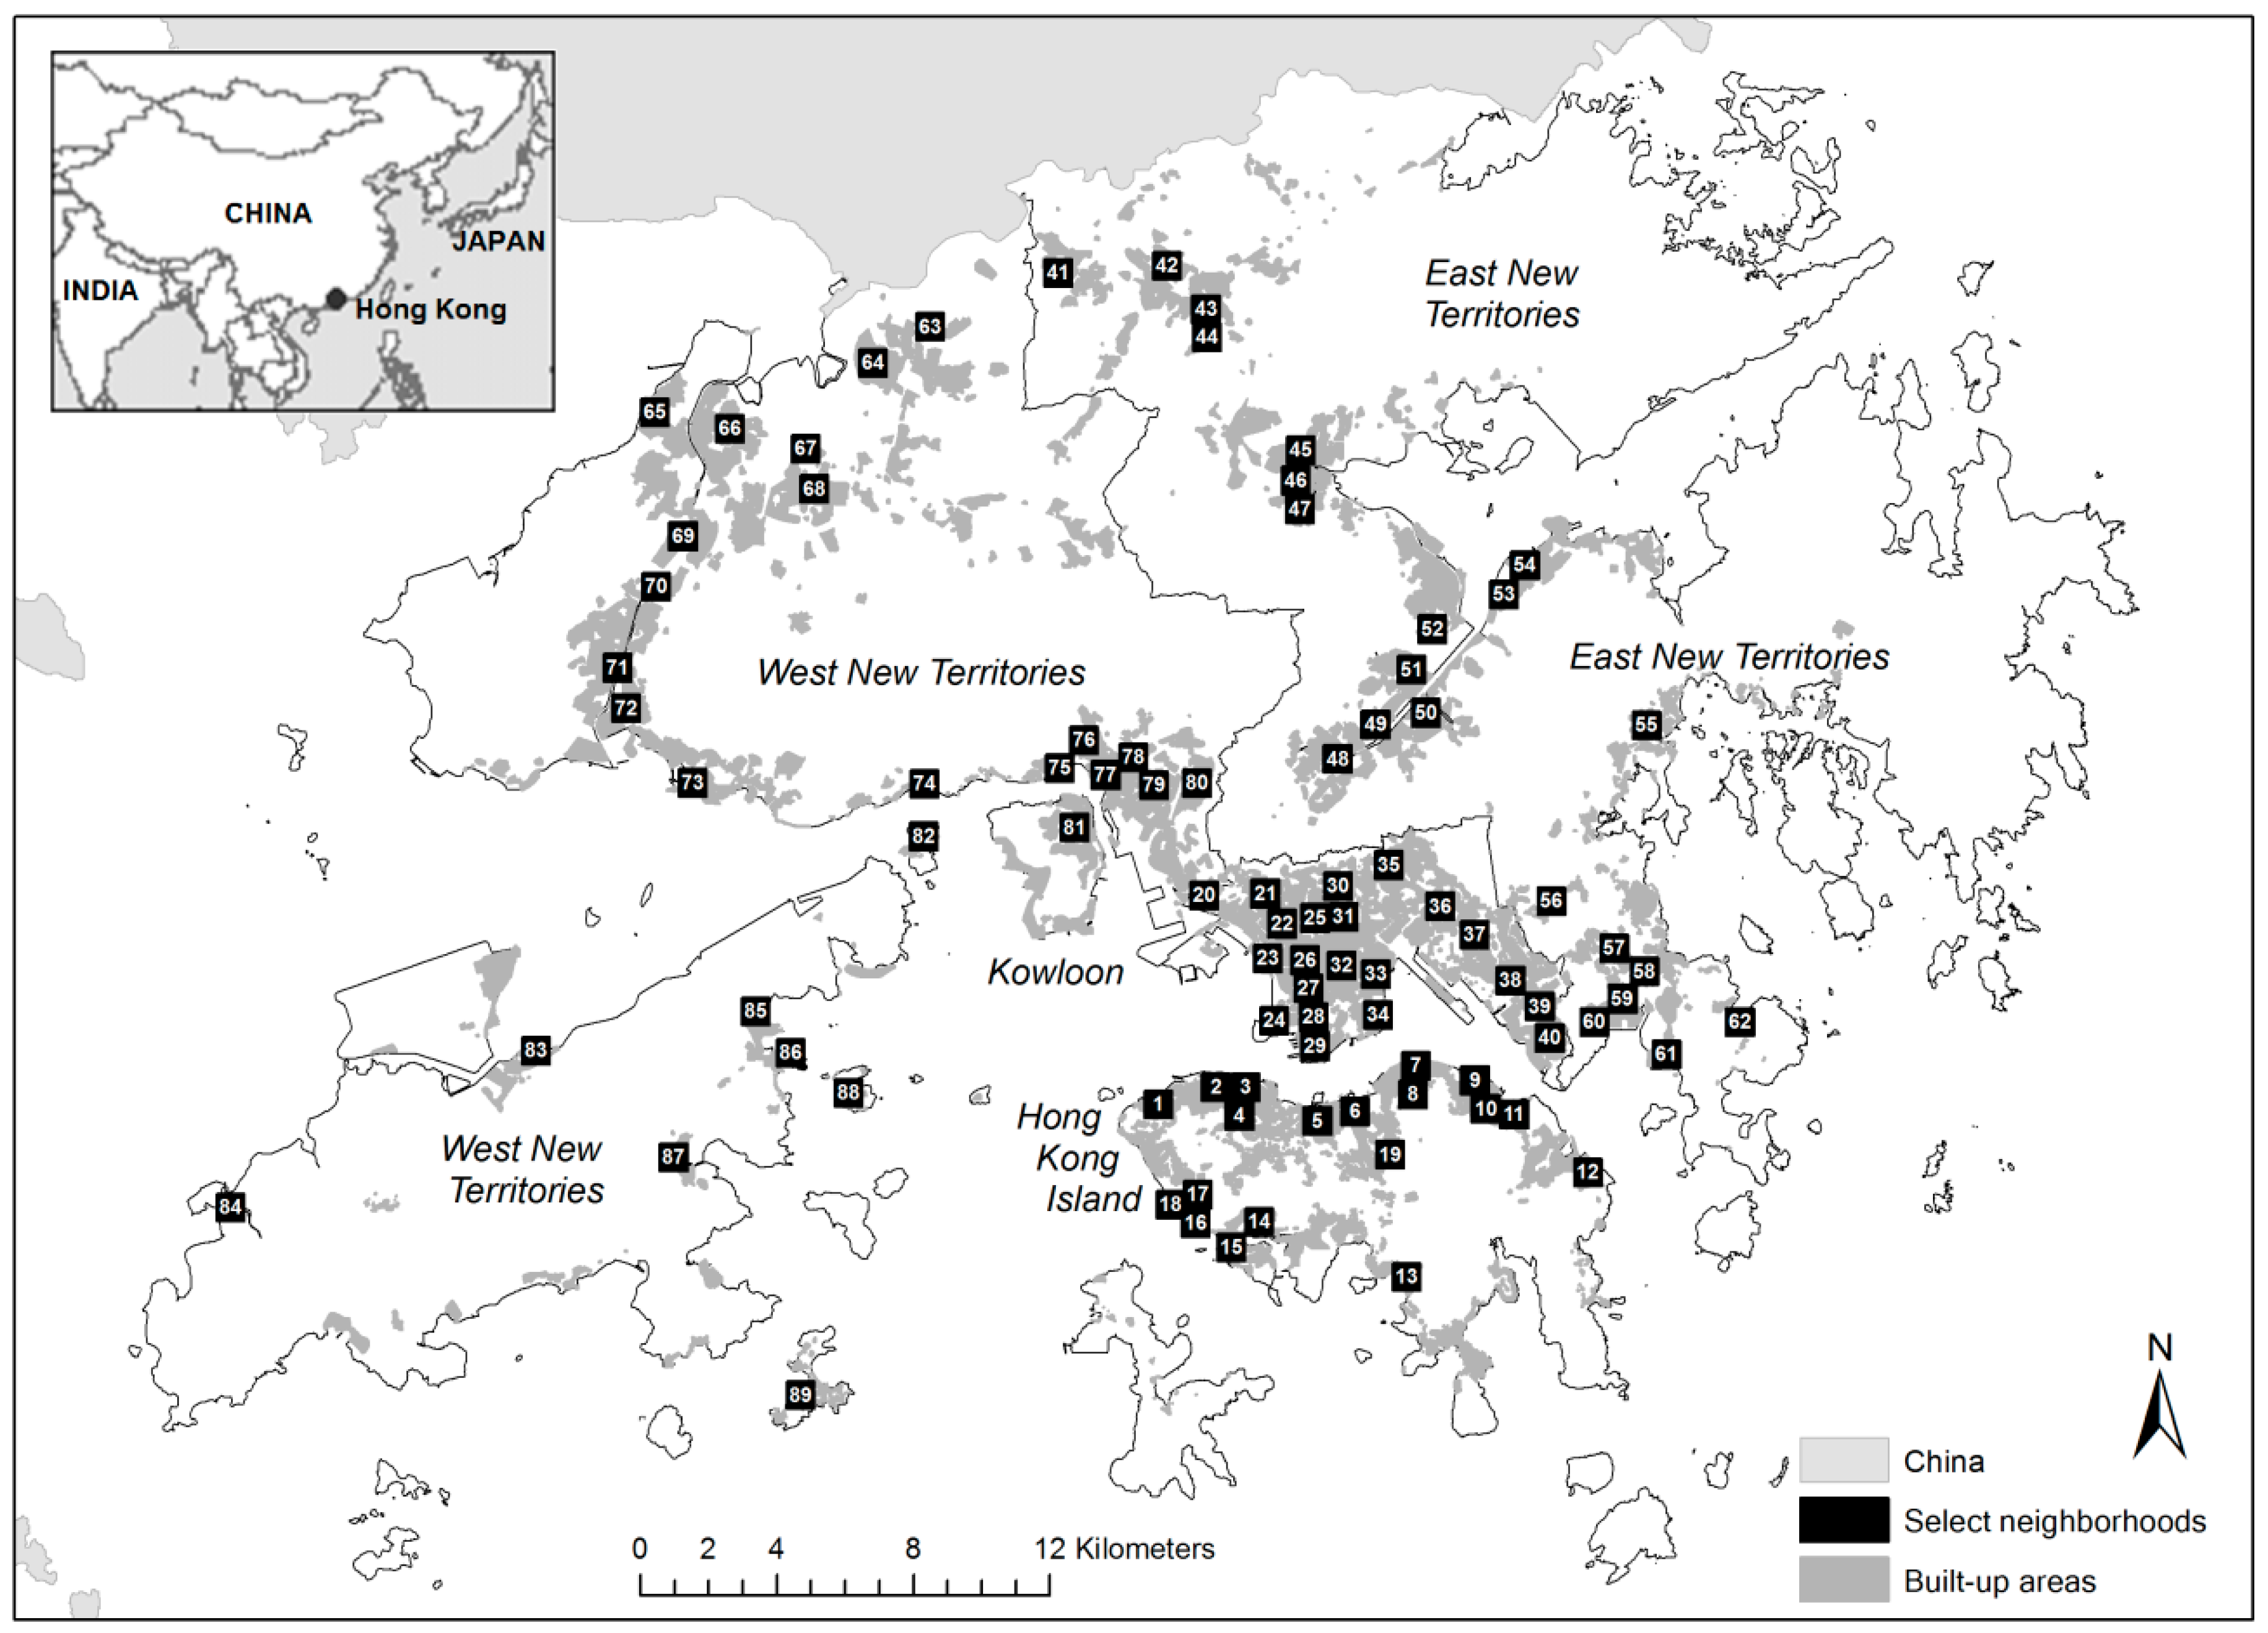
2.1. Study Area
2.2. Data
2.3. Morphological Measures
2.4. Methods of Analysis
3. Results
3.1. Numerical Analyses
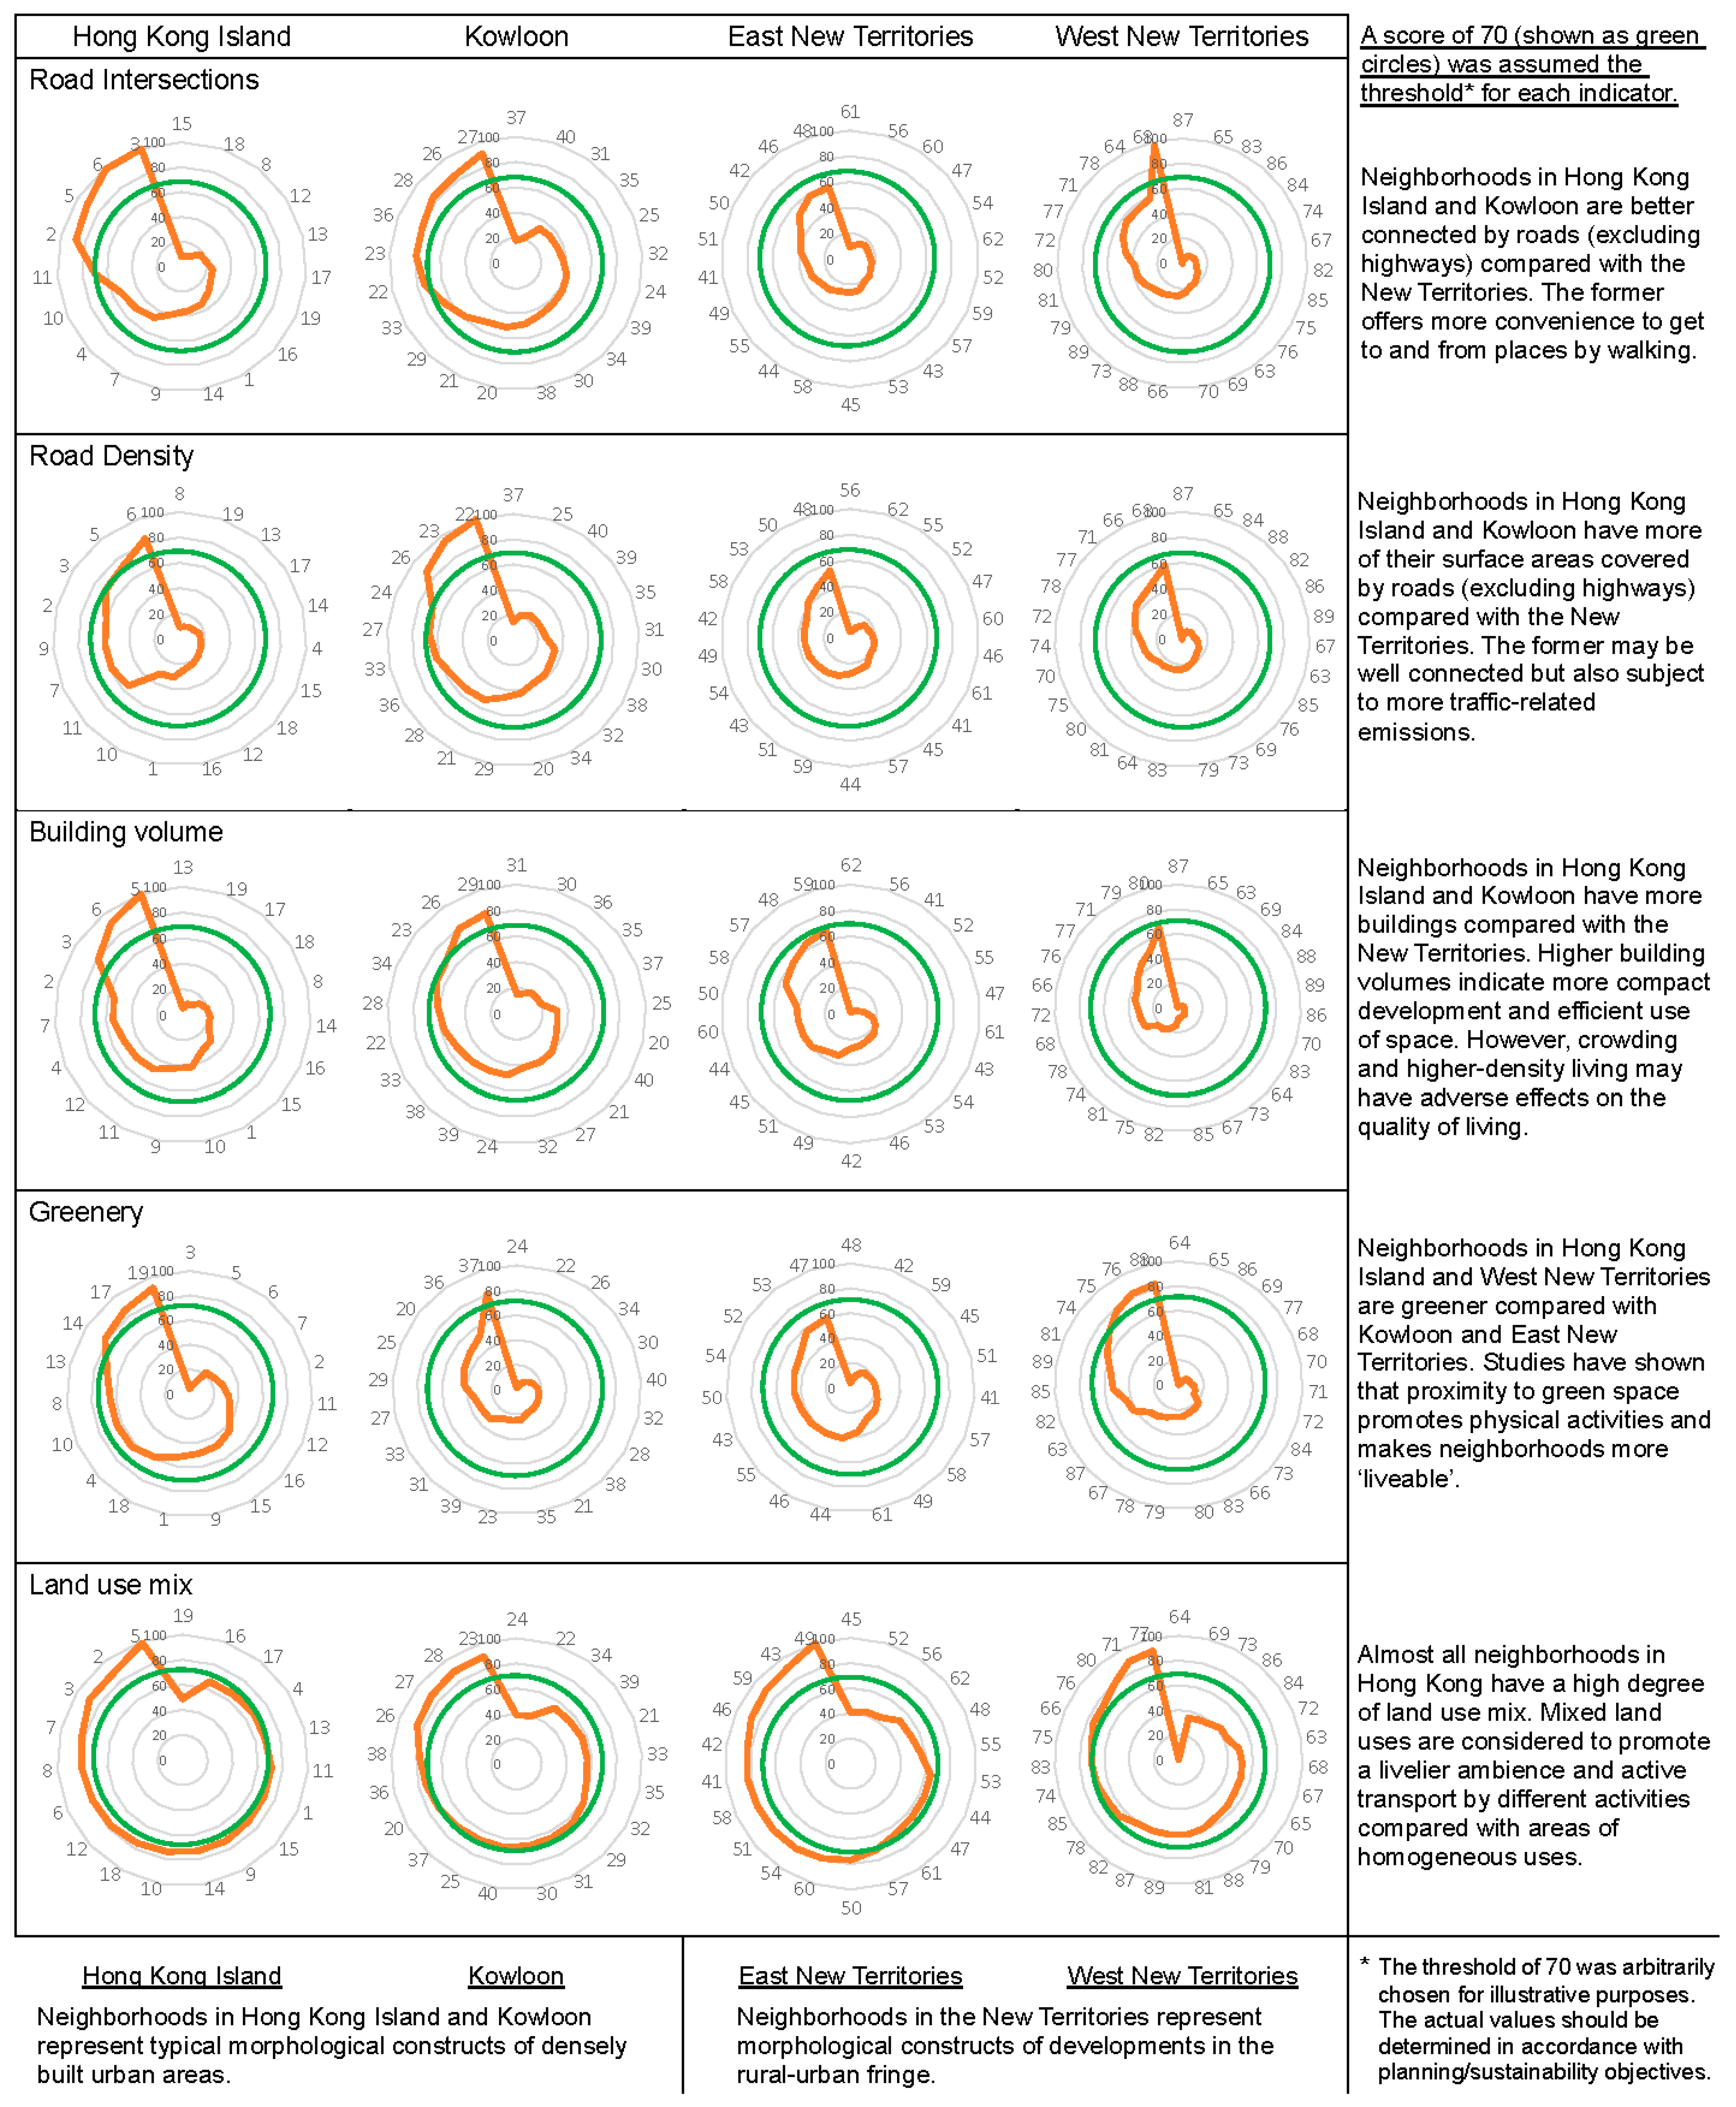
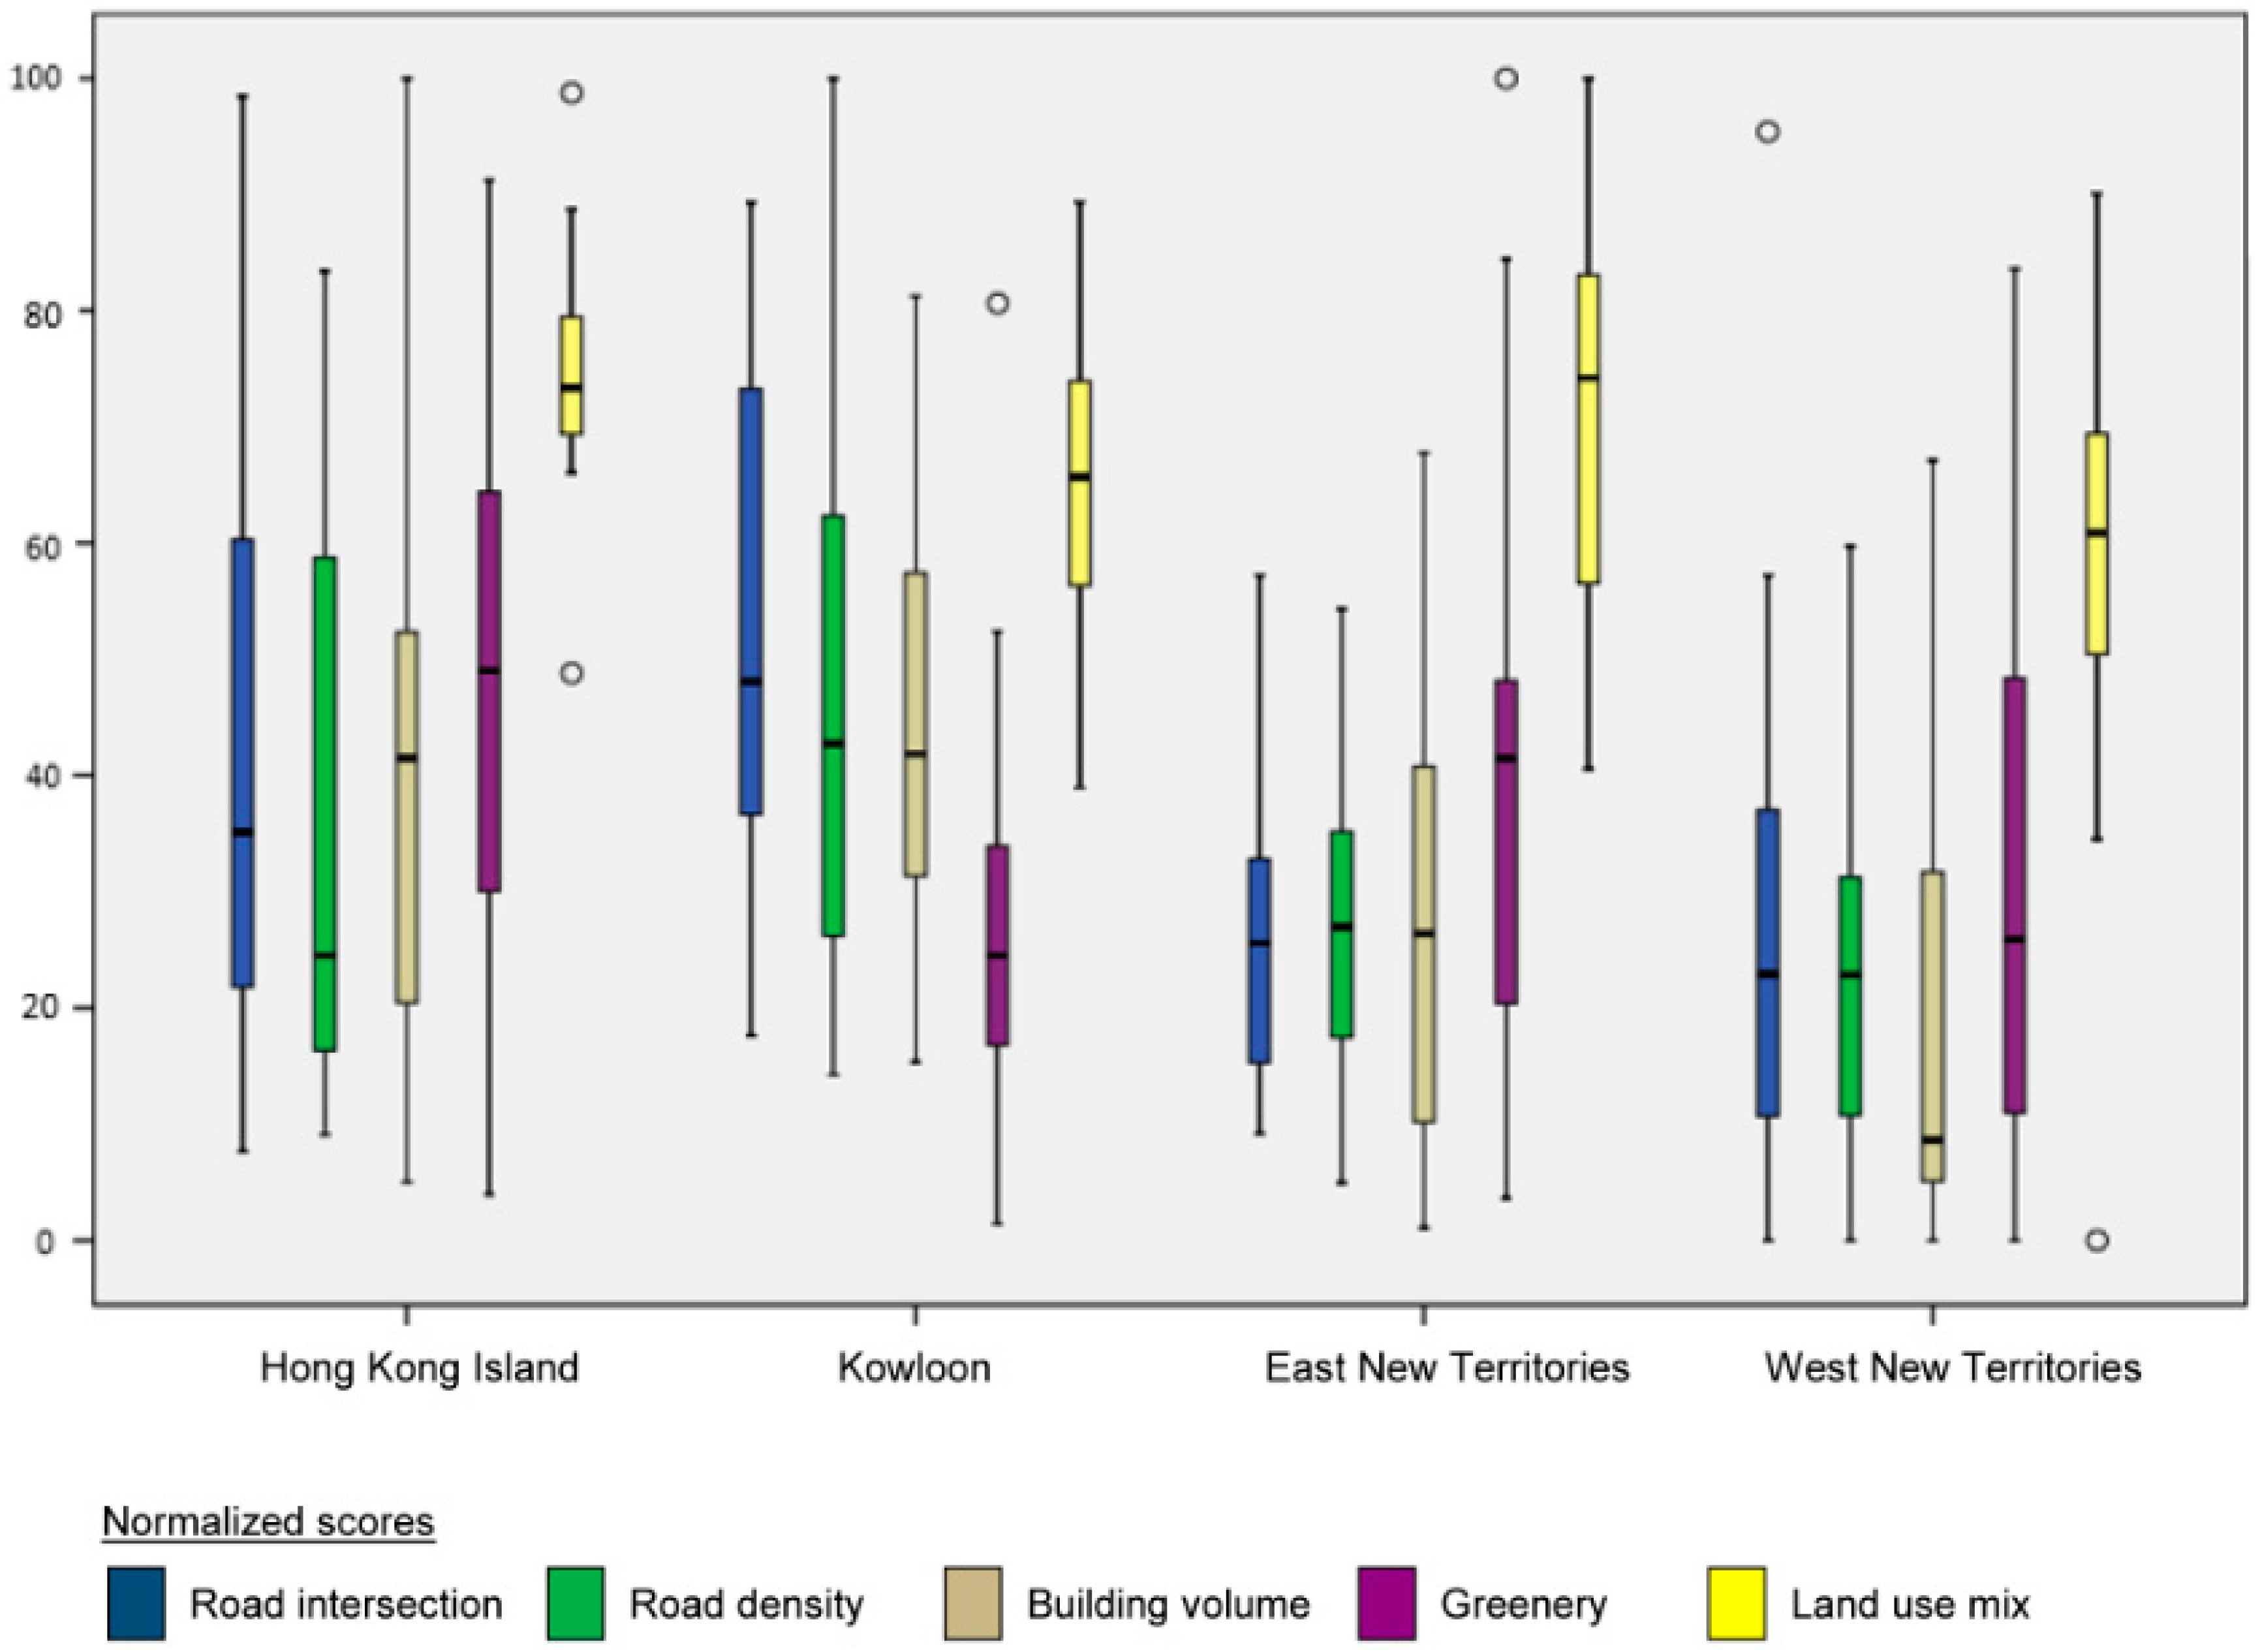
3.2. Graphical Analyses
4. Discussion
5. Conclusions
Acknowledgments
Author Contributions
Conflicts of Interest
References
- Lau, S.S.Y. Physical environment of tall residential buildings: The case of Hong Kong. In High-Rise Living in Asian Cities; Yuen, B., Yeh, A.G.O., Eds.; Springer: New York, NY, USA, 2011; pp. 25–48. [Google Scholar]
- Shane, D.G. Transcending type: Designing for urban complexity. Archit. Des. 2011, 81, 128–134. [Google Scholar] [CrossRef]
- Ng, E. (Ed.) Designing High-Density Cities: For Social and Environmental Sustainability; Routledge: London, UK, 2009. [Google Scholar]
- Edussuriya, P.; Chan, A.; Ye, A. Urban morphology and air quality in dense residential environments in Hong Kong. Part I: District-level analysis. Atmos. Environ. 2011, 45, 4789–4803. [Google Scholar] [CrossRef]
- Hang, J.; Li, Y.; Sandberg, M.; Buccolieri, R.; Di Sabatino, S. The influence of building height variability on pollutant dispersion and pedestrian ventilation in idealized high-rise urban areas. Build. Environ. 2012, 56, 346–360. [Google Scholar] [CrossRef]
- Li, D.H.W.; Tsang, E.K.W.; Edmonds, I.R. Performance of light redirection systems in model buildings under typical sky and building obstruction conditions encountered in Hong Kong. Indoor Built Environ. 2012, 20, 638–648. [Google Scholar] [CrossRef]
- Siu, L.W.; Hart, M.A. Quantifying urban heat island intensity in Hong Kong SAR, China. Environ. Monit. Assess. 2013, 185, 4383–4398. [Google Scholar] [CrossRef] [PubMed]
- Wong, P.Y.; Lai, P.C.; Low, C.T.; Chen, S.; Hart, M. The impact of environmental and human factors on urban heat and micro-climate variability. Build. Environ. 2016, 95, 199–208. [Google Scholar] [CrossRef]
- Hobday, R. Designing Houses for Health—A Review; VELUX Company Ltd.: Hørsholm, Denmark, 2010. [Google Scholar]
- Ng, E.; Cheng, V. Urban human thermal comfort in hot and humid Hong Kong. Energy Build. 2012, 55, 51–65. [Google Scholar] [CrossRef]
- Lai, P.C.; Choi, C.C.Y.; Wong, P.Y.; Thach, T.Q.; Wong, M.S.; Cheng, W.; Krämer, A.; Wong, C.M. Spatial analytical methods for deriving a historical map of physiological equivalent temperature of Hong Kong. Build. Environ. 2016, 99, 22–28. [Google Scholar] [CrossRef]
- Wong, N.H.; Jusuf, S.K.; Syafii, N.I.; Chen, Y.; Hajadi, N.; Sathyanarayanan, H.; Manickavasagam, Y.V. Evaluation of the impact of the surrounding urban morphology on building energy consumption. Sol. Energy 2011, 85, 57–71. [Google Scholar] [CrossRef]
- Pisman, A.; Allaert, G.; Lombaerde, P. Urban and suburban lifestyles and residential preferences in a highly urbanized society. Experiences from a case study in Ghent (Flanders, Belgium). Belgeo Revue Belge de Géographie 2011, 1–2, 89–104. [Google Scholar]
- Burian, S.J.; Han, W.S.; Brown, M.J. Morphological Analyses Using 3D Building Databases: Oklahoma City, Oklahoma. Los Alamos National Laboratory, October 2003. Available online: https://www.researchgate.net/publication/260286743_Morphological_analyses_using_3D_building_databases_Oklahoma_City_Oklahoma (accessed on 20 August 2012).
- Rode, P.; Keim, C.; Robazza, G.; Viejo, P.; Schofield, J. Cities and Energy: Urban Morphology and Residential Heat-Energy Demand. Environ. Plan. B Plan. Des. 2014, 41, 138–162. [Google Scholar] [CrossRef]
- Schirmer, P.M.; Axhausen, K.W. A multiscale classification of urban morphology. J. Transp. Land Use 2015, 9, 101–130. [Google Scholar] [CrossRef]
- Venerandi, A.; Zanella, M.; Romice, O.; Dibble, J.; Porta, S. Form and urban change—An urban morphometric study of five gentrified neighbourhoods in London. Environ. Plan. B Plan. Des. 2016. [Google Scholar] [CrossRef]
- Holden, E. Ecological footprints and sustainable urban form. J. Hous. Built Environ. 2004, 19, 91–109. [Google Scholar] [CrossRef]
- Berke, E.M.; Gottlieb, L.M.; Moudon, A.V.; Larson, E.B. Protective association between neighborhood walkability and depression in older men. J. Am. Geriatr. Soc. 2007, 55, 526–533. [Google Scholar] [CrossRef] [PubMed]
- Gong, Y.; Palmer, S.; Gallacher, J.; Marsden, T.; Fone, D. A systematic review of the relationship between objective measurements of the urban environment and psychological distress. Environ. Int. 2016, 96, 48–57. [Google Scholar] [CrossRef] [PubMed]
- Gomaa, B.; Sakr, N. Social Sustainability; Maintenance of Socio-Cultural Characteristics: A Case Study of El-Raml Station. Eur. J. Sustain. Dev. 2015, 4, 203–212. [Google Scholar] [CrossRef]
- Huisingh, D. Components and structures of the pillars of sustainability. J. Clean. Prod. 2015, 88, 1–12. [Google Scholar] [CrossRef]
- Zorpas, A.A.; Lasaridi, K.; Voukkali, I.; Loizia, P.; Chroni, C. Household waste compositional analysis variation from insular communities in the framework of waste prevention strategy plans. Waste Manag. 2015, 38, 3–11. [Google Scholar] [CrossRef] [PubMed]
- Strohbach, M.W.; Arnold, E.; Haase, D. The carbon footprint of urban green space—A life cycle approach. Landsc. Urban Plan. 2012, 104, 220–229. [Google Scholar] [CrossRef]
- Burton, E. Measuring urban compactness in UK towns and cities. Environ. Plan. B Plan. Des. 2002, 29, 219–250. [Google Scholar] [CrossRef]
- Frenkel, A. Land-Use patterns in the classification of cities: The Israeli Case. Environ. Plan. B Plan. Des. 2004, 31, 711–730. [Google Scholar] [CrossRef]
- Krehl, A.; Siedentop, S.; Taubenböck, H.; Wurm, M. A Comprehensive View on Urban Spatial Structure: Urban Density Patterns of German City Regions. ISPRS Int. J. Geo-Inf. 2016, 5, 76. [Google Scholar] [CrossRef]
- Yu, B.; Liu, H.; Wu, J.; Hu, Y.; Zhang, L. Automated derivation of urban building density information using airborne LiDAR data and object-based method. Landsc. Urban Plan. 2010, 98, 210–219. [Google Scholar] [CrossRef]
- DeKay, M. Daylighting and urban form: An urban fabric of light. J. Archit. Plan. Res. 2010, 27, 35–56. [Google Scholar]
- Martilli, A. Numerical study of urban impact on boundary layer structure: Sensitivity to wind speed, urban morphology, and rural soil moisture. J. Appl. Meteorol. 2002, 41, 1247–1266. [Google Scholar] [CrossRef]
- Davies, R.G.; Barbosa, O.; Fuller, R.A.; Tratalos, J.; Burke, N.; Lewis, D.; Warren, P.H.; Gaston, K.J. City-wide relationships between green spaces, urban land use and topography. Urban Ecosyst. 2008, 11, 269–287. [Google Scholar] [CrossRef]
- Ball, K.; Bauman, A.; Leslie, E.; Owen, N. Perceived environmental aesthetics and convenience and company are associated with walking for exercise among Australian adults. Prev. Med. 2001, 33, 434–440. [Google Scholar] [CrossRef] [PubMed]
- Humpel, N.; Owen, N.; Leslie, E. Environmental factors associated with adults’ participation in physical activity: A review. Am. J. Prev. Med. 2002, 22, 188–199. [Google Scholar] [CrossRef]
- Leslie, E.; Coffee, N.; Frank, L.; Owen, N.; Bauman, A.; Hugo, G. Walkability of local communities: Using geographic information systems to objectively assess relevant environmental attributes. Health Place 2007, 13, 111–122. [Google Scholar] [CrossRef] [PubMed]
- Kockelman, K. Travel behaviour as function of accessibility, land use mixing, and land use balance: Evidence from San Francisco Bay Area. Transp. Res. Rec. J. Transp. Res. Board 1997, 1607, 116–125. [Google Scholar] [CrossRef]
- Plazzi, A.; Torous, W.; Valkanov, R. Expected returns and expected growth in rents of commercial real estate. Rev. Financ. Stud. 2010, 23, 3469–3519. [Google Scholar] [CrossRef]
- Bhopal, R.S.; Phillimore, P.; Moffatt, S.; Foy, C. Is living near a coking works harmful to health? A study of industrial air pollution. J. Epidemiol. Community Health 1994, 48, 237–247. [Google Scholar] [CrossRef] [PubMed]
- Block, R.L.; Block, C.R. Space, place and crime: Hot spot areas and hot places of liquor-related crime. Crime Place 1995, 4, 145–184. [Google Scholar]
- Jiang, B.; Claramunt, C.; Batty, M. Geometric accessibility and geographic information: Extending desktop GIS to space syntax. Comput. Environ. Urban Syst. 1999, 23, 127–146. [Google Scholar] [CrossRef]
- Jabareen, Y.R. Sustainable urban forms their typologies, models, and concepts. J. Plan. Educ. Res. 2006, 26, 38–52. [Google Scholar] [CrossRef]
- Jones, D.; Wienckowski, J. Street Topology and Urban Morphology: A Northeast Baltimore Case Study. In Proceedings of the 2nd WSEAS International Conference on Urban Rehabilitation and Sustainability, Baltimore, MD, USA, 7–9 November 2009. [Google Scholar]
- Marshall, W.E.; Garrick, N.W. Street network types and road safety: A study of 24 California cities. Urban Des. Int. 2010, 15, 133–147. [Google Scholar] [CrossRef]
- Marshall, W.E.; Garrick, N.W. Does street network design affect traffic safety? Accid. Anal. Prev. 2011, 43, 769–781. [Google Scholar] [CrossRef] [PubMed]
- De Ridder, K.; Adamec, V.; Banuelos, A.; Bruse, M.; Bürger, M.; Damsgaard, O.; Dufek, J.; Hirsch, J.; Lefebre, F.; Pe’rez-Lacorzana, J.M.; et al. An integrated methodology to assess the benefits of urban green space. Sci. Total Environ. 2004, 334–335, 489–497. [Google Scholar] [CrossRef] [PubMed]
- Lau, S.S.Y.; Lin, P.; Qin, H. A preliminary study on environmental performances of pocket parks in high-rise and high-density urban context in Hong Kong. Int. J. Low-Carbon Technol. 2012, 7, 215–225. [Google Scholar] [CrossRef]
- Marans, R.W. Quality of urban life & environmental sustainability studies: Future linkage opportunities. Habitat Int. 2015, 45, 47–52. [Google Scholar]
- Mahon, M.; Fahy, F.; Ó’Cinnéide, M. The significance of quality of life and sustainability at the urban-rural fringe in the making of place-based community. GeoJournal 2012, 77, 265–278. [Google Scholar] [CrossRef]
- Hong Kong Planning Department. Land Utilization in Hong Kong 2015. Available online: http://www.pland.gov.hk/pland_en/info_serv/statistic/landu.html (accessed on 24 April 2016).
- Hong Kong Census and Statistics Department. Summary Results of 2016 Population By-Census Announced. Available online: https://www.censtatd.gov.hk/press_ release/pressReleaseDetail.jsp?charsetID=1&pressRID=4158 (accessed on 24 April 2016).
- Lau, K.K.L.; Ng, E.; Ren, C.; Ho, J.C.K.; Wan, L.; Shi, Y.; Zheng, Y.; Gong, F.; Cheng, V.; Yuan, C.; et al. Defining the environmental performance of neighbourhoods in high-density cities. Build. Res. Inf. 2017, 1–12. [Google Scholar] [CrossRef]
- Lotfi, S.; Koohsari, M.J. Analyzing Accessibility Dimension of Urban Quality of Life: Where Urban Designers Face Duality between Subjective and Objective Reading of Place. Soc. Indic. Res. 2009, 94, 417–435. [Google Scholar] [CrossRef]
- Carver, A.; Timperio, A.; Hesketh, K.; Crawford, D. Are safety-related features of the road environment associated with smaller declines in physical activity among youth? J. Urban Health Bull. N. Y. Acad. Med. 2010, 87, 29–43. [Google Scholar] [CrossRef] [PubMed]
- Survey and Mapping Office, Lands Department of Hong Kong. Geoinfo Map. Available online: http://www1.map.gov.hk/gih3/view/index.jsp (accessed on 24 April 2016).
- Herold, M.; Couclelis, H.; Clarke, K.C. The role of spatial metrics in the analysis and modeling of urban land use change. Comput. Environ. Urban Syst. 2005, 29, 369–399. [Google Scholar] [CrossRef]
- Duncan, M.J.; Winkler, E.; Sugiyama, T.; Cerin, E.; Leslie, E.; Owen, N. Relationships of land use mix with walking for transport: Do land uses and geographical scale matter. J. Urban Health 2010, 87, 782–795. [Google Scholar] [CrossRef] [PubMed]
- Environmental Systems Research Institute (ESRI). ArcGIS Desktop: Release 10. Redlands 2011; Environmental Systems Research Institute: Redlands, CA, USA, 2011. [Google Scholar]
- Ellis, G.; Hunter, R.F.; Tully, M.; Donnelly, M.; Kelleher, L.; Kee, F. Connectivity and Physical activity: Using footpath networks to measure the walkability of built environments. Environ. Plan. B Plan. Des. 2016, 43, 130–151. [Google Scholar] [CrossRef]
- McIntosh, J.; Trubka, R.; Kenworthy, J.; Newman, P. The role of urban form and transit in city car dependence: Analysis of 26 global cities from 1960 to 2000. Transp. Res. Part D Transp. Environ. 2014, 33, 95–110. [Google Scholar] [CrossRef]
- Saary, M.J. Radar plots: A useful way for presenting multivariate health care data. J. Clin. Epidemiol. 2008, 61, 311–317. [Google Scholar] [CrossRef] [PubMed]
- Chen, S. Measuring Environmental Quality of Life: A GIS Approach to Deriving Objective Measures Using Hong Kong as a Case Study. Ph.D. Thesis, The University of Hong Kong, Hong Kong, China, 2015. [Google Scholar]
- Chang, Y.C.; Chang, C.J.; Chen, K.T.; Lei, C.L. Radar chart: Scanning for satisfactory QoE in QoS dimensions. IEEE Netw. 2012, 26. [Google Scholar] [CrossRef]
- Kalonia, C.; Kumru, O.S.; Kim, J.H.; Middaugh, C.R.; Volkin, D.B. Radar chart array analysis to visualize effects of formulation variables on IgG1 particle formation as measured by multiple analytical techniques. J. Pharm. Sci. 2013, 102, 4256–4267. [Google Scholar] [CrossRef] [PubMed]
- Li, X.; Hong, W.; Wang, J.; Song, J.; Kang, J. Research on the radar chart theory applied to the indoor environmental comfort level evaluation. In Proceedings of the Sixth World Congress on Intelligent Control and Automation, Dalian, China, 21–23 June 2006; IEEE: New York, NY, USA, 2006; Volume 1, pp. 5214–5217. [Google Scholar]
- Forman, R.T.T. Land Mosaics: The Ecology of Landscapes and Regions; Cambridge University Press: Cambridge, UK, 1995. [Google Scholar]
- European Commission. Indicators for Sustainable Cities, Science for Environmental Policy In-Depth Report. 2015. Available online: http://ec.europa.eu/environment/ integration/research/newsalert/pdf/indicators_for_sustainable_cities_IR12_en.pdf (accessed on 20 April 2016).


| Morphological Metrics | Mean (89) | Std. Dev. | Std. Error | 95% CI (Mean) | Mean Scores by Regions | ||||
|---|---|---|---|---|---|---|---|---|---|
| Lower Bound | Upper Bound | HKI (19) | KLN (21) | ENT (22) | WNT (27) | ||||
| Road intersection | 37.29 | 24.88 | 2.64 | 32.05 | 42.53 | 44.63 | 53.16 * | 27.63 | 27.65 |
| Road density | 32.68 | 21.62 | 2.30 | 28.12 | 37.23 | 35.81 | 48.02 * | 26.74 | 23.38 |
| Building volume | 32.01 | 23.53 | 2.49 | 27.05 | 36.97 | 40.77 | 44.21 * | 29.12 | 18.72 |
| Greenery | 36.28 | 24.71 | 2.62 | 31.08 | 41.48 | 48.67 * | 27.18 | 39.96 | 31.65 |
| Land use mix | 66.56 | 16.83 | 1.78 | 63.01 | 70.10 | 74.76 * | 66.16 | 70.53 | 57.87 |
| Source of Variation | Sum of Squares | df | Mean Square | F | Sig. | |
|---|---|---|---|---|---|---|
| Road intersection | Between Groups | 10,876.28 | 3 | 3625.43 | 7.070 | 0.000 * |
| Within Groups | 43,586.84 | 85 | 512.79 | |||
| Total | 54,463.13 | 88 | ||||
| Road density | Between Groups | 8237.40 | 3 | 2745.80 | 7.097 | 0.000 * |
| Within Groups | 32,883.82 | 85 | 386.87 | |||
| Total | 41,121.22 | 88 | ||||
| Building volume | Between Groups | 9534.75 | 3 | 3178.25 | 6.895 | 0.000 * |
| Within Groups | 39,181.04 | 85 | 460.95 | |||
| Total | 48,715.78 | 88 | ||||
| Greenery | Between Groups | 5534.23 | 3 | 1844.74 | 3.255 | 0.026 * |
| Within Groups | 48,179.90 | 85 | 566.82 | |||
| Total | 53,714.13 | 88 | ||||
| Land use mix | Between Groups | 3666.29 | 3 | 1222.10 | 4.889 | 0.003 * |
| Within Groups | 21,248.39 | 85 | 249.98 | |||
| Total | 24,914.68 | 88 | ||||
© 2018 by the authors. Licensee MDPI, Basel, Switzerland. This article is an open access article distributed under the terms and conditions of the Creative Commons Attribution (CC BY) license (http://creativecommons.org/licenses/by/4.0/).
Share and Cite
Lai, P.-C.; Chen, S.; Low, C.-T.; Cerin, E.; Stimson, R.; Wong, P.Y.P. Neighborhood Variation of Sustainable Urban Morphological Characteristics. Int. J. Environ. Res. Public Health 2018, 15, 465. https://doi.org/10.3390/ijerph15030465
Lai P-C, Chen S, Low C-T, Cerin E, Stimson R, Wong PYP. Neighborhood Variation of Sustainable Urban Morphological Characteristics. International Journal of Environmental Research and Public Health. 2018; 15(3):465. https://doi.org/10.3390/ijerph15030465
Chicago/Turabian StyleLai, Poh-Chin, Si Chen, Chien-Tat Low, Ester Cerin, Robert Stimson, and Pui Yun Paulina Wong. 2018. "Neighborhood Variation of Sustainable Urban Morphological Characteristics" International Journal of Environmental Research and Public Health 15, no. 3: 465. https://doi.org/10.3390/ijerph15030465
APA StyleLai, P.-C., Chen, S., Low, C.-T., Cerin, E., Stimson, R., & Wong, P. Y. P. (2018). Neighborhood Variation of Sustainable Urban Morphological Characteristics. International Journal of Environmental Research and Public Health, 15(3), 465. https://doi.org/10.3390/ijerph15030465