Evaluation of the Quebec Healthy Enterprise Standard: Effect on Adverse Psychosocial Work Factors and Psychological Distress

 , ,
, ,
Abstract
:1. Introduction
2. Materials and Methods
2.1. QHES Implementation and Certification Process
2.2. Interventions in the Management Practices Area of the QHES
2.3. Study Design and Population
2.4. Data Collection and Measures
2.4.1. Intervention Exposure in the Management Practices Area of the QHES
2.4.2. Adverse Psychosocial Work Factors
2.4.3. Psychological Distress
2.4.4. Control Variables
2.5. Statistical Analyses
2.6. Ethical Considerations
3. Results
4. Discussion
5. Conclusions
Supplementary Materials
Acknowledgments
Author Contributions
Conflicts of Interest
Appendix A

| Versions 1 and 2 of the T2 Questionnaire | Response Choices | Dichotomization of Responses |
|---|---|---|
| Version 1: 7 organizations (n = 2192; 86% of study participants) | ||
| Since the implementation of the “Healthy Enterprise” initiative in my workplace, I have noticed changes with regard to (5 items): | No changes implemented | Not exposed = Participant replied “No changes” and “I do not know” for all 5 items |
| My workload (number of employees, change of duties, time to do tasks, etc.) | Improved my work situation | |
| My autonomy (participation in decisions that concern me, choice of working methods, etc.) | Did not change my work situation | |
| The support I receive from my colleagues (sharing of tools and information, meetings, work committees, etc.) | Deteriorated my work situation | Exposed = Participant replied “Improved”, “Did not change” or “Deteriorated” my work situation to at least one item |
| The support I receive from my immediate superior (team meetings, individual meetings, etc.) | I do not know | |
| Recognition of my work (efforts and achievements are recognized, promotion prospects, etc.) | ||
| Version 2: 3 organizations (n = 368; 14% of study participants) | ||
| As part of the implementation of the “Healthy Enterprise” initiative in my workplace, I noticed changes in the area of activity (1 item): | None at all | Not exposed = Participant replied “None at all” |
| A little | ||
| Work organization and management practices (e.g., autonomy, relations with colleagues and superior, consultation, communication, recognition) | Enough | Exposed = Participant replied “Little”, “Enough”, or “Many” |
| Many | ||
References
- Whiteford, H.A.; Degenhardt, L.; Rehm, J.; Baxter, A.J.; Ferrari, A.J.; Erskine, H.E.; Charlson, F.J.; Norman, R.E.; Flaxman, A.D.; Johns, N.; et al. Global burden of disease attributable to mental and substance use disorders: Findings from the global burden of disease study 2010. Lancet 2013, 382, 1575–1586. [Google Scholar] [CrossRef]
- World Health Organization. The European Mental Health Action Plan 2013–2020; World Health Organization: Copenhagen, Denmark, 2015. [Google Scholar]
- Mental Health Commission of Canada. Making the Case for Investing in Mental Health in Canada; Mental Health Commission of Canada: Ottawa, ON, Canada, 2016.
- Bourbonnais, R.; Brisson, C.; Vezina, M.; Masse, B.; Blanchette, C. Psychosocial work environment and certified sick leave among nurses during organizational changes and downsizing. Ind. Relations 2005, 60, 483–509. [Google Scholar] [CrossRef]
- Henderson, M.; Glozier, N.; Holland Elliott, K. Long term sickness absence. BMJ 2005, 330, 802–803. [Google Scholar] [CrossRef] [PubMed]
- Dewa, C.S.; Lesage, A.; Goering, P.; Caveen, M. Nature and prevalence of mental illness in the workplace. Healthc. Papers 2004, 5, 12–25. [Google Scholar] [CrossRef]
- Koopmans, P.C.; Bultmann, U.; Roelen, C.A.; Hoedeman, R.; van der Klink, J.J.; Groothoff, J.W. Recurrence of sickness absence due to common mental disorders. Int. Arch. Occup. Environ. Health 2011, 84, 193–201. [Google Scholar] [CrossRef] [PubMed]
- McTernan, W.P.; Dollard, M.F.; LaMontagne, A.D. Depression in the workplace: An economic cost analysis of depression-related productivity loss attributable to job strain and bullying. Work Stress 2013, 27, 321–338. [Google Scholar] [CrossRef]
- Drapeau, A.; Marchand, A.; Beaulieu-Prévost, D. Epidemiology of psychological distress. In Mental Illnesses—Understanding, Prediction Control; InTech: Rijeka, Croatia, 2012. [Google Scholar]
- Kessler, R.C.; Andrews, G.; Colpe, L.J.; Hiripi, E.; Mroczek, D.K.; Normand, S.L.T.; Walters, E.E.; Zaslavsky, A.M. Short screening scales to monitor population prevalences and trends in non-specific psychological distress. Psychol. Med. 2002, 32, 959–976. [Google Scholar] [CrossRef] [PubMed]
- Kessler, R.C.; Green, J.G.; Gruber, M.J.; Sampson, N.A.; Bromet, E.; Cuitan, M.; Furukawa, T.A.; Gureje, O.; Hinkov, H.; Hu, C.Y.; et al. Screening for serious mental illness in the general population with the k6 screening scale: Results from the who world mental health (WMH) survey initiative. Int. J. Methods Psychiatr. Res. 2010, 19, 4–22. [Google Scholar] [CrossRef] [PubMed]
- Furukawa, T.A.; Kessler, R.C.; Slade, T.; Andrews, G. The performance of the K6 and K10 screening scales for psychological distress in the Australian National Survey of Mental Health and Well-Being. Psychol. Med. 2003, 33, 357–362. [Google Scholar] [CrossRef] [PubMed]
- Van Hoffen, M.F.A.; Joling, C.I.; Heymans, M.W.; Twisk, J.W.; Roelen, C.A. Mental health symptoms identify workers at risk of long-term sickness absence due to mental disorders: Prospective cohort study with 2-year follow-up. BMC Public Health 2015, 15, 1235. [Google Scholar] [CrossRef] [PubMed]
- Roelen, C.A.; Hoedeman, R.; van Rhenen, W.; Groothoff, J.W.; van der Klink, J.J.; Bultmann, U. Mental health symptoms as prognostic risk markers of all-cause and psychiatric sickness absence in office workers. Eur. J. Public Health 2014, 24, 101–105. [Google Scholar] [CrossRef] [PubMed]
- Hilton, M.F.; Whiteford, H.A.; Sheridan, J.S.; Cleary, C.M.; Chant, D.C.; Wang, P.S.; Kessler, R.C. The prevalence of psychological distress in employees and associated occupational risk factors. J. Occup. Environ. Med. 2008, 50, 746–757. [Google Scholar] [CrossRef] [PubMed]
- Vezina, M.; Bourbonnais, R.; Marchand, A.; Arcand, R. Psychosocial stresses of work and mental health problems in Quebec: An analysis of the gender. Can. J. Public Health 2010, 101, S23–S28. [Google Scholar] [PubMed]
- Bonde, J.P.E. Psychosocial factors at work and risk of depression: A systematic review of the epidemiological evidence. Occup. Environ. Med. 2008, 65, 438–445. [Google Scholar] [CrossRef] [PubMed]
- Netterstrøm, B.; Conrad, N.; Bech, P.; Fink, P.; Olsen, O.; Rugulies, R.; Stansfeld, S. The relation between work-related psychosocial factors and the development of depression. Epidemiol. Rev. 2008, 30, 118–132. [Google Scholar] [CrossRef] [PubMed]
- Stansfeld, S.; Candy, B. Psychosocial work environment and mental health—A meta-analytic review. Scand. J. Work Environ. Health 2006, 32, 443–462. [Google Scholar] [CrossRef] [PubMed]
- Theorell, T.; Hammarstrom, A.; Aronsson, G.; Traskman Bendz, L.; Grape, T.; Hogstedt, C.; Marteinsdottir, I.; Skoog, I.; Hall, C. A systematic review including meta-analysis of work environment and depressive symptoms. BMC Public Health 2015, 15, 738. [Google Scholar] [CrossRef] [PubMed]
- Brisson, C.; Gilbert-Ouimet, M.; Duchaine, C.S.; Trudel, X.; Vézina, M. Workplace interventions aiming to improve psychosocial work factors and related health. In Work Stress and Health in a Globalized Economy: The Model of Effort-Reward Imbalance; Siegrist, J., Wahrendorf, M., Eds.; Springer: Berlin, Germany, 2016; pp. 333–364. [Google Scholar]
- Karasek, R. Job demands, job decision latitude, and mental strain: Implications for job redesign. Adm. Sci. Q. 1979, 24, 285–308. [Google Scholar] [CrossRef]
- Johnson, J.V. Introduction: Theoretical developments in psychosocial work environment research. Int. J. Health Serv. 1989, 19, 457–458. [Google Scholar] [CrossRef] [PubMed]
- Siegrist, J. Adverse health effects of high-effort/low-reward conditions. J. Occup. Health Psychol. 1996, 1, 27–41. [Google Scholar] [CrossRef] [PubMed]
- Bond, F.W.; Bunce, D. Job control mediates change in a work reorganization intervention for stress reduction. J. Occup. Health Psychol. 2001, 6, 290–302. [Google Scholar] [CrossRef] [PubMed]
- Bourbonnais, R.; Brisson, C.; Vézina, M. Long-term effects of an intervention on psychosocial work factors among healthcare professionals in a hospital setting. Occup. Environ. Med. 2011, 68, 479–486. [Google Scholar] [CrossRef] [PubMed]
- Bourbonnais, R.; Brisson, C.; Vinet, A.; Vezina, M.; Abdous, B.; Gaudet, M. Effectiveness of a participative intervention on psychosocial work factors to prevent mental health problems in a hospital setting. Occup. Environ. Med. 2006, 63, 335–342. [Google Scholar] [CrossRef] [PubMed]
- Bourbonnais, R.; Gauthier, N.; Vézina, M.; Viens, C.; Durand, P.; Brisson, C.; Alderson, M.; Bégin, P.; Ouellet, J.-P. Une intervention en centres d’hébergement et de soins de longue durée visant à réduire les problèmes de santé mentale liés au travail. PISTES 2005, 7, 1–35. [Google Scholar] [CrossRef]
- Landsbergis, P.A.; Vivona-Vaughan, E. Evaluation of an occupational stress intervention in a public agency. J. Organ. Behav. 1995, 16, 29–48. [Google Scholar] [CrossRef]
- Mikkelsen, A.; Saksvik, P.O. Impact of a participatory organizational intervention on job characteristics and job stress. Int. J. Health Serv. 1999, 29, 871–893. [Google Scholar] [CrossRef] [PubMed]
- Petterson, I.; Arnetz, B.B. Psychosocial stressors and well-being in health care workers. The impact of an intervention program. Soc. Sci. Med. 1998, 47, 1763–1772. [Google Scholar] [CrossRef]
- Tsutsumi, A.; Nagami, M.; Yoshikawa, T.; Kogi, K.; Kawakami, N. Participatory intervention for workplace improvements on mental health and job performance among blue-collar workers: A cluster randomized controlled trial. J. Occup. Environ. Med. 2009, 51, 554–563. [Google Scholar] [CrossRef] [PubMed]
- Uchiyama, A.; Odagiri, Y.; Ohya, Y.; Takamiya, T.; Inoue, S.; Shimomitsu, T. Effect on mental health of a participatory intervention to improve psychosocial work environment: A cluster randomized controlled trial among nurses. J. Occup. Health 2013, 55, 173–183. [Google Scholar] [CrossRef] [PubMed]
- Leka, S.; Jain, A.; Iavicoli, S.; Di Tecco, C. An evaluation of the policy context on psychosocial risks and mental health in the workplace in the European Union: Achievements, challenges, and the future. BioMed Res. Int. 2015. [Google Scholar] [CrossRef] [PubMed]
- Leka, S.; Cox, T.; Zwetsloot, G. The European framework for psychosocial risk management. In PRIMA-EF; WHO Publications: Nottingham, UK, 2008. [Google Scholar]
- British Standards Institute. Guidance on the management of psychosocial risks in the workplace United Kingdom 2011; British Standards Institute: London, UK, 2011. [Google Scholar]
- Health and Safety Executive. Managing the Causes of Work-Related Stress: A Step-by-Step Approach Using the Management Standards. Available online: http://www.hse.gov.uk/stress/standards/index.htm (accessed on 30 August 2016).
- Leka, S.; Jain, A.; Widerszal-Bazyl, M.; Żołnierczyk-Zreda, D.; Zwetsloot, G. Developing a standard for psychosocial risk management: Pas 1010. Saf. Sci. 2011, 49, 1047–1057. [Google Scholar] [CrossRef]
- Safe Work Australia. Australian Work Health and Safety Strategy 2012–2022; Safe Work Australia: Canberra, Australia, 2012.
- Moen, P.; Kelly, E.L.; Fan, W.; Lee, S.R.; Almeida, D.; Kossek, E.E.; Buxton, O.M. Does a flexibility/support organizational initiative improve high-tech employees’ well-being? Evidence from the work, family, and health network. Am. Sociol. Rev. 2016, 81, 134–164. [Google Scholar] [CrossRef]
- Bureau de Normalisation du Québec. Prévention, Promotion et Pratiques Organisationnelles Favorables à la Santé en Milieu de Travail; Bibliothèque et Archives Nationales du Québec: Québec, QC, Canada, 2008. [Google Scholar]
- Canadian Standards Association; Bureau de Normalisation du Québec. Psychological Health and Safety in the Workplace—Prevention, Promotion, and Guidance to Staged Implementation; Bibliothèque et Archives Nationales du Québec: Québec, QC, Canada, 2013. [Google Scholar]
- Bureau de Normalisation du Québec. Protocole de Certification bnq 9700-880/2014; Bibliothèque et Archives nationales du Québec: Québec, QC, Canada, 2014. [Google Scholar]
- Hasson, H.; Brisson, C.; Guérin, S.; Gilbert-Ouimet, M.; Baril-Gingras, G.; Vézina, M.; Bourbonnais, R. An organizational-level occupational health intervention: Employee perceptions of exposure to changes, and psychosocial outcomes. Work Stress 2014, 28, 1–19. [Google Scholar] [CrossRef]
- Karasek, R.A.; Brisson, C.; Kawakami, N.; Houtman, I.; Bongers, P.; Amick, B. The job content questionnaire (JCQ): An instrument for internationally comparative assessments of psychosocial job characteristics. J. Occup. Health Psychol. 1998, 3, 322–355. [Google Scholar] [CrossRef] [PubMed]
- Karasek, R.A. Job Content Questionnaire and User’s Guide; University of Massachusetts: Lowell, MA, USA, 1985. [Google Scholar]
- Kristensen, T.S.; Hannerz, H.; Hogh, A.; Borg, V. The Copenhagen psychosocial questionnaire—A tool for the assessment and improvement of the psychosocial work environment. Scand. J. Work Environ. Health 2005, 31, 438–449. [Google Scholar] [CrossRef] [PubMed]
- Brisson, C.; Larocque, B. Validité des indices de demande psychologique et de latitude décisionnelle utilisés dans l’enquête nationale sur la santé de la population (ENSP) de 1994–1995. Can. J. Public Health 2001, 92, 468–474. [Google Scholar] [PubMed]
- Larocque, B.; Brisson, C.; Blanchette, C. Cohérence interne, validité factorielle et validité discriminante de la traduction française des échelles de demande psychologique et de latitude décisionnelle du job content questionnaire de karasek. Revue D'épidémiologie et de Santé Publique 1998, 46, 371–381. [Google Scholar] [PubMed]
- Niedhammer, I.; Siegrist, J.; Landre, M.; Goldberg, M.; Leclerc, A. Étude des qualités psychométriques de la version française du modèle du déséquilibre efforts/récompenses. Revue D'épidémiologie et de Santé Publique 2000, 48, 419–438. [Google Scholar] [PubMed]
- Siegrist, J.; Li, J.; Montano, D. Psychometric Properties of the Effort-Reward Imbalance Questionnaire. Available online: http://www.uniklinik-duesseldorf.de/fileadmin/Datenpool/einrichtungen/institut_fuer_medizinische_soziologie_id54/ERI/PsychometricProperties.pdf (accessed on 25 February 2017).
- Vézina, M.; Cloutier, E.; Stock, S.; Lippel, K.; Fortin, E. Enquête Québécoise sur des Conditions de Travail, D’emploi, et de Santé et de Sécurité du Travail (Eqcotesst); Institut de Recherche Robert-Sauvé en Santé et Sécurité du Travail—Institut National de Santé Publique du Québec et Institut de la Statistique du Québec: Montréal, QC, Canada, 2011; p. 986. [Google Scholar]
- Prochaska, J.J.; Sung, H.Y.; Max, W.; Shi, Y.; Ong, M. Validity study of the k6 scale as a measure of moderate mental distress based on mental health treatment need and utilization. Int. J. Methods Psychiatr. Res. 2012, 21, 88–97. [Google Scholar] [CrossRef] [PubMed]
- Vézina, M. Stress au Travail et Santé Mentale chez les Adultes Québécois: Enquête sur la Santé Dans les Collectivités Canadiennes (Cycle 1.2); Institut de la Statistique du Québec: Québec, QC, Canada, 2008; p. 51. [Google Scholar]
- Litière, S.; Alonso, A.; Molenberghs, G. Type I and type II error under random-effects misspecification in generalized linear mixed models. Biometrics 2007, 63, 1038–1044. [Google Scholar] [CrossRef] [PubMed]
- SAS Institute Inc. What’s New in Sas® 9.4; SAS Institute Inc.: Cary, NC, USA, 2013. [Google Scholar]
- Biron, C.; Ivers, H.; Brun, J.P. Capturing the active ingredients of multicomponent participatory organizational stress interventions using an adapted study design. Stress Health 2016, 32, 275–284. [Google Scholar] [CrossRef] [PubMed]
- Sørensen, O.H.; Holman, D. A participative intervention to improve employee well-being in knowledge work jobs: A mixed-methods evaluation study. Work Stress 2014, 28, 67–86. [Google Scholar] [CrossRef]
- Bambra, C.; Egan, M.; Thomas, S.; Petticrew, M.; Whitehead, M. The psychosocial and health effects of workplace reorganisation. 2. A systematic review of task restructuring interventions. J. Epidemiol. Community Health 2007, 61, 1028–1037. [Google Scholar] [CrossRef] [PubMed] [Green Version]
- Egan, M.; Bambra, C.; Thomas, S.; Petticrew, M.; Whitehead, M.; Thomson, H. The psychosocial and health effects of workplace reorganisation. 1. A systematic review of organizational-level interventions that aim to increase employee control. J. Epidemiol. Community Health 2007, 61, 945–954. [Google Scholar] [CrossRef] [PubMed] [Green Version]
- Mackay, C.; Palferman, D.; Saul, H.; Webster, S.; Packham, C. Implementation of the management standards for work-related stress in Great Britain. In Improving Organizational Interventions for Stress and Well-Being: Addressing Process and Context; Routledge/Taylor & Francis Group: New York, NY, USA, 2012; pp. 285–312. [Google Scholar]
- Randall, R.; Griffiths, A.; Cox, T. Evaluating organizational stress-management interventions using adapted study designs. Eur. J. Work Organ. Psychol. 2005, 14, 23–41. [Google Scholar] [CrossRef]
- Biron, C.; Gatrell, C.; Cooper, C.L. Autopsy of a failure: Evaluating process and contextual issues in an organizational-level work stress intervention. Int. J. Stress Manag. 2010, 17, 135–158. [Google Scholar] [CrossRef]
- Shadish, W.R.; Cook, T.D.; Campbell, D.T. Experimental and Quasi-Experimental Designs for Generalized Causal Inference; Houghton Mifflin: Boston, MA, USA, 2002; p. 623. [Google Scholar]
- Schelvis, R.M.; Oude Hengel, K.M.; Burdorf, A.; Blatter, B.M.; Strijk, J.E.; van der Beek, A.J. Evaluation of occupational health interventions using a randomized controlled trial: Challenges and alternative research designs. Scand. J. Work Environ. Health 2015, 41, 491–503. [Google Scholar] [CrossRef] [PubMed]

| Sociodemographic Characteristics and Lifestyle Habits | All Organizations Combined (n = 2849) | More Exposed Organizations (n = 776) | Less Exposed Organizations (n = 2073) | |||
|---|---|---|---|---|---|---|
| n | % | n | % | n | % | |
| Gender | ||||||
| Women | 1402 | 49.2 | 421 | 54.3 | 981 | 47.3 |
| Men | 1447 | 50.8 | 355 | 45.8 | 1092 | 52.7 |
| Age (years) | ||||||
| <25 | 74 | 2.6 | 13 | 1.7 | 61 | 2.9 |
| 25–44 | 1336 | 46.9 | 221 | 28.5 | 1115 | 53.8 |
| 45–54 | 947 | 33.3 | 310 | 40.0 | 637 | 30.7 |
| ≥55 | 491 | 17.2 | 231 | 29.8 | 260 | 12.5 |
| Education (highest level completed) | ||||||
| Less than high school | 37 | 1.3 | 9 | 1.2 | 28 | 1.4 |
| High school degree | 751 | 26.4 | 375 | 48.5 | 376 | 18.2 |
| College degree 2 | 1024 | 36.0 | 251 | 32.5 | 773 | 37.3 |
| University degree | 1033 | 36.3 | 138 | 17.9 | 895 | 43.2 |
| Frequency of physical activity per week | ||||||
| <1 | 425 | 15.0 | 173 | 22.5 | 252 | 12.2 |
| 1–2 | 596 | 21.0 | 182 | 23.6 | 414 | 20.0 |
| 3–4 | 1118 | 39.4 | 252 | 32.7 | 866 | 41.8 |
| ≥5 | 701 | 24.7 | 163 | 21.2 | 538 | 26.0 |
| Smoking status | ||||||
| Non-smoker | 1608 | 56.6 | 341 | 44.3 | 1267 | 61.2 |
| Ex-smoker | 813 | 28.6 | 274 | 35.6 | 539 | 26.0 |
| Occasional smoker | 136 | 4.8 | 37 | 4.8 | 99 | 4.8 |
| Regular smoker | 283 | 10.0 | 117 | 15.2 | 166 | 8.0 |
| Fruit and vegetable intake (servings/day) | ||||||
| ≤2 | 293 | 10.3 | 119 | 15.5 | 174 | 8.4 |
| 3–4 | 1643 | 57.9 | 467 | 61.0 | 1176 | 56.8 |
| ≥5 | 902 | 31.8 | 180 | 23.5 | 722 | 34.9 |
| Adverse Psychosocial Work Factors | Prevalence of High Psychological Distress | Crude | Model 1 2 | Model 2 3 | ||||
|---|---|---|---|---|---|---|---|---|
| Exposed % | Unexposed % | PR (95% CI 1) | p-Value | PR (95% CI 1) | p-Value | PR (95% CI 1) | p-Value | |
| High psychological demands | 38.1 | 24.5 | 1.55 (1.42–1.70) * | <0.0001 | 1.58 (1.46–1.72) * | <0.0001 | 1.57 (1.45–1.70) * | <0.0001 |
| Low decision latitude | 32.6 | 23.3 | 1.40 (1.23–1.59) * | <0.0001 | 1.36 (1.20–1.55) * | <0.0001 | 1.34 (1.18–1.53) * | <0.0001 |
| Job strain | 41.6 | 25.4 | 1.64 (1.48–1.82) * | <0.0001 | 1.62 (1.45–1.81) * | <0.0001 | 1.59 (1.40–1.79) * | <0.0001 |
| Low social support at work | 36.3 | 21.3 | 1.70 (1.48–1.96) * | <0.0001 | 1.71 (1.51–1.94) * | <0.0001 | 1.67 (1.48–1.89) * | <0.0001 |
| Low rewards | 36.1 | 19.6 | 1.84 (1.57–2.17) * | <0.0001 | 1.82 (1.55–2.14) * | <0.0001 | 1.76 (1.52–2.05) * | <0.0001 |
| ERI 1 | 46.3 | 22.7 | 2.04 (1.75–2.39) * | <0.0001 | 2.08 (1.76–2.45) * | <0.0001 | 2.02 (1.72–2.37) * | <0.0001 |
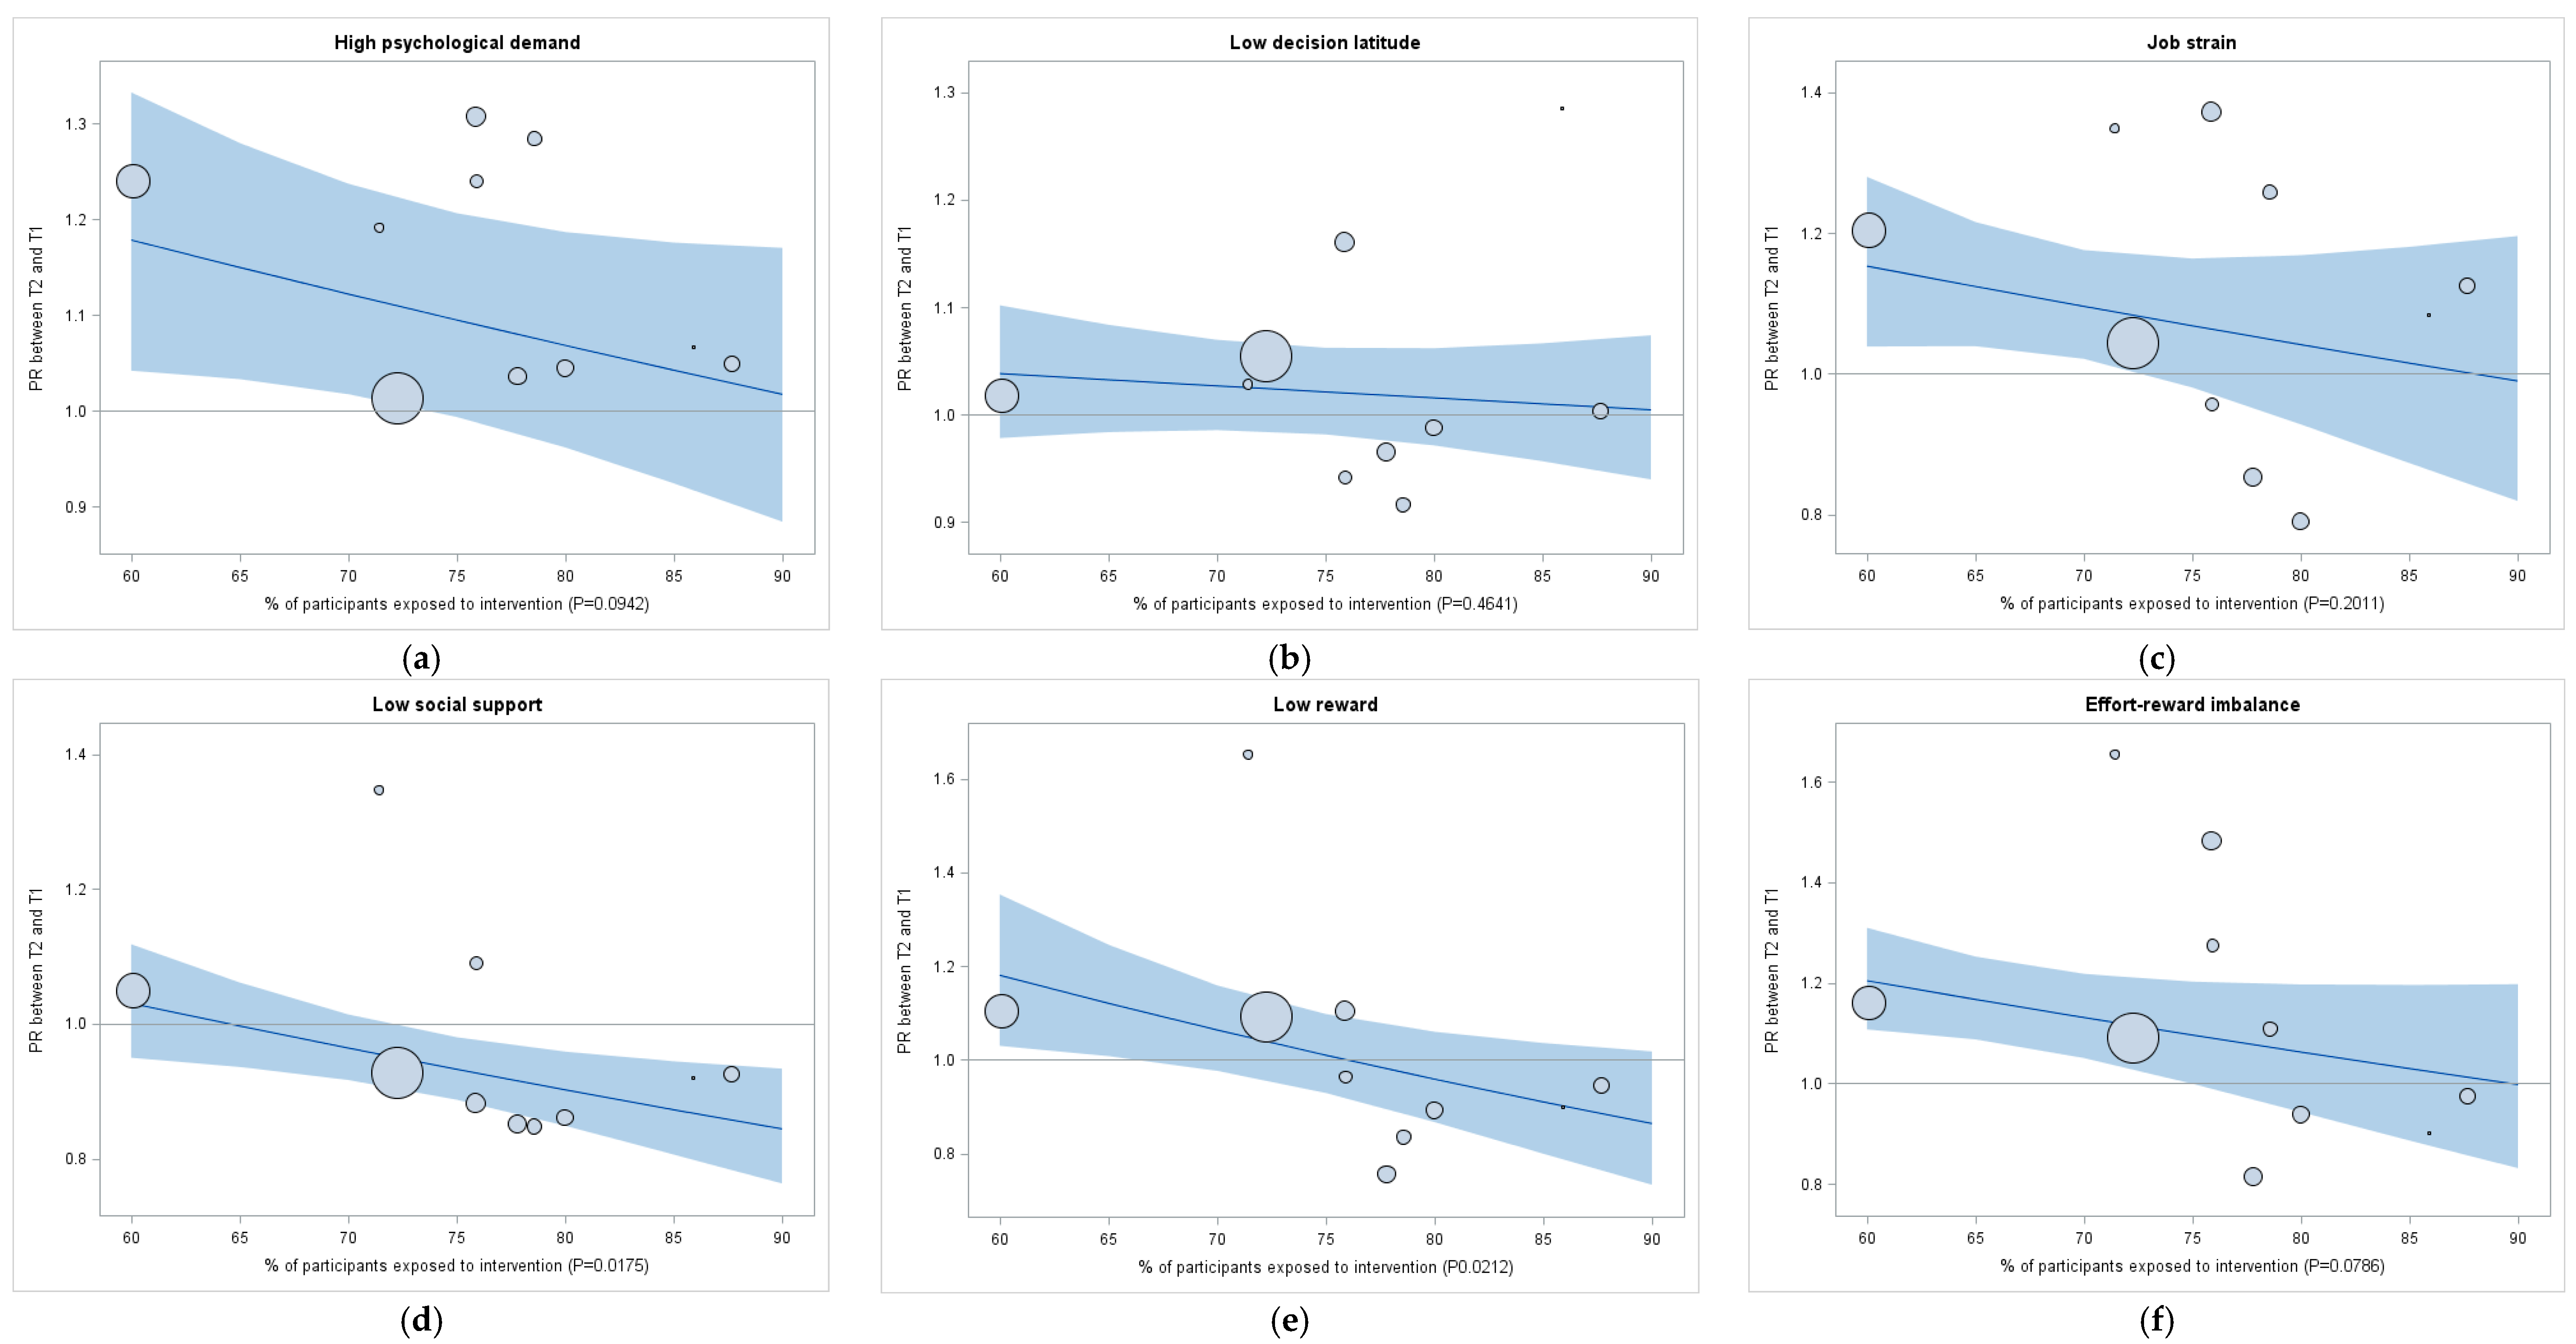
| Adverse Psychosocial Work Factors | More Exposed Organizations (n = 5) | Less Exposed Organizations (n = 5) | Net Effect of Interventions | |||||
|---|---|---|---|---|---|---|---|---|
| T1 % | T2 % | PR (95% CI 1) | T1 % | T2 % | PR (95% CI 1) | Ratio of PRs 2 (95% CI 1) | p-Value 3 | |
| High psychological demands | 33.1 | 36.0 | 1.09 (0.92–1.29) | 38.1 | 42.4 | 1.11 (1.02–1.22) * | 0.97 (0.81–1.18) | 0.790 |
| Low decision latitude | 68.4 | 67.3 | 0.99 (0.92–1.05) | 53.1 | 55.4 | 1.04 (0.99–1.10) | 0.94 (0.87–1.03) | 0.149 |
| Job strain | 20.4 | 20.4 | 1.00 (0.82–1.21) | 19.6 | 21.7 | 1.11 (0.99–1.25) | 0.90 (0.72–1.13) | 0.325 |
| Low social support at work | 60.8 | 52.8 | 0.87 (0.77–0.98) * | 44.1 | 43.1 | 0.98 (0.89–1.07) | 0.89 (0.77–1.03) | 0.099 |
| Low rewards | 60.1 | 51.5 | 0.86 (0.74–0.99) * | 54.2 | 60.1 | 1.11 (1.02–1.21) * | 0.77 (0.66–0.91) * | 0.007 * |
| ERI 1 | 28.7 | 26.9 | 0.94 (0.77–1.14) | 31.7 | 37.2 | 1.17 (1.06–1.30) * | 0.80 (0.64–0.99) * | 0.048 * |
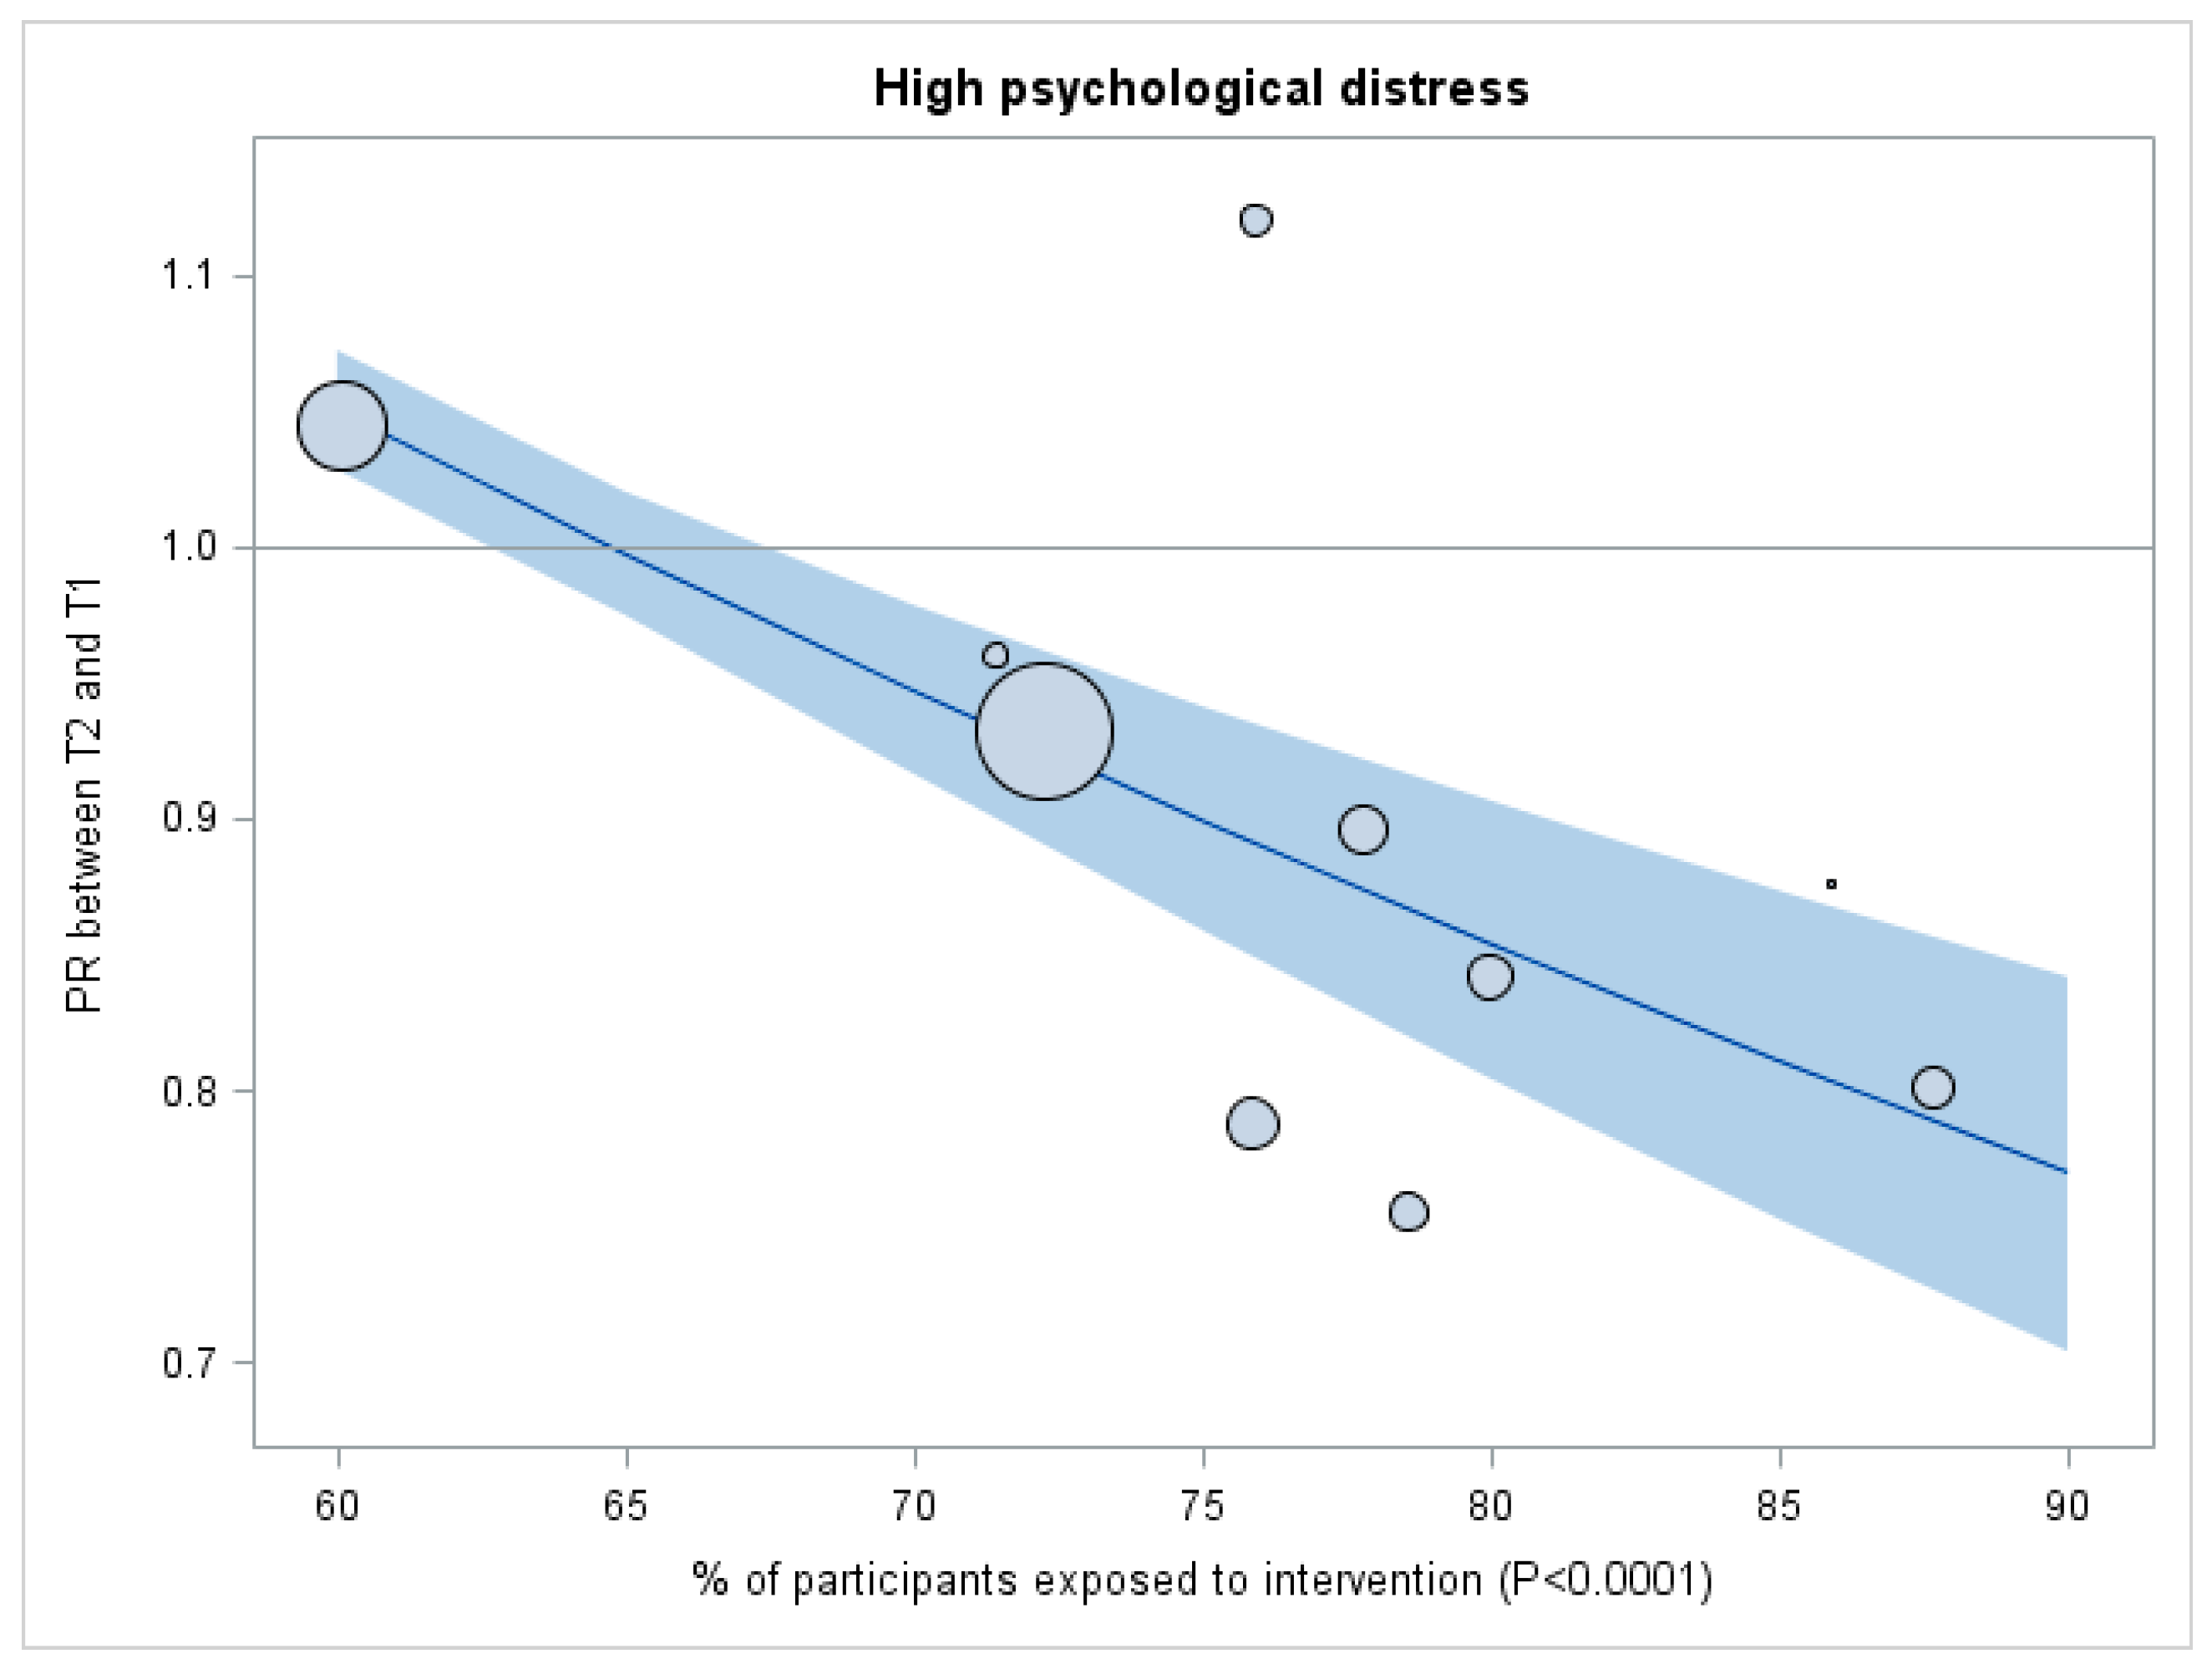
| Psychological Distress | More Exposed Organizations (n = 5) | Less Exposed Organizations (n = 5) | Net Effect of Interventions | |||||
|---|---|---|---|---|---|---|---|---|
| T1 % | T2 % | PR (95% CI 1) | T1 % | T2 % | PR (95% CI 1) | Ratio of PRs 2 (95% CI 1) | p-Value 3 | |
| High psychological distress | 32.2 | 26.6 | 0.83 (0.73–0.93) * | 28.6 | 27.3 | 0.96 (0.88–1.03) | 0.86 (0.75–0.998) * | 0.048 * |
© 2018 by the authors. Licensee MDPI, Basel, Switzerland. This article is an open access article distributed under the terms and conditions of the Creative Commons Attribution (CC BY) license (http://creativecommons.org/licenses/by/4.0/).
Share and Cite
Letellier, M.-C.; Duchaine, C.S.; Aubé, K.; Talbot, D.; Mantha-Bélisle, M.-M.; Sultan-Taïeb, H.; St-Hilaire, F.; Biron, C.; Vézina, M.; Brisson, C. Evaluation of the Quebec Healthy Enterprise Standard: Effect on Adverse Psychosocial Work Factors and Psychological Distress. Int. J. Environ. Res. Public Health 2018, 15, 426. https://doi.org/10.3390/ijerph15030426
Letellier M-C, Duchaine CS, Aubé K, Talbot D, Mantha-Bélisle M-M, Sultan-Taïeb H, St-Hilaire F, Biron C, Vézina M, Brisson C. Evaluation of the Quebec Healthy Enterprise Standard: Effect on Adverse Psychosocial Work Factors and Psychological Distress. International Journal of Environmental Research and Public Health. 2018; 15(3):426. https://doi.org/10.3390/ijerph15030426
Chicago/Turabian StyleLetellier, Marie-Claude, Caroline S. Duchaine, Karine Aubé, Denis Talbot, Marie-Michèle Mantha-Bélisle, Hélène Sultan-Taïeb, France St-Hilaire, Caroline Biron, Michel Vézina, and Chantal Brisson. 2018. "Evaluation of the Quebec Healthy Enterprise Standard: Effect on Adverse Psychosocial Work Factors and Psychological Distress" International Journal of Environmental Research and Public Health 15, no. 3: 426. https://doi.org/10.3390/ijerph15030426