Toxicity of Urban PM10 and Relation with Tracers of Biomass Burning


Abstract
:1. Introduction
2. Methods
2.1. Site Description
2.2. PM Sampling
2.2.1. PM Sampling for Toxicity Studies
2.2.2. PM Sampling for Chemical Characterization
2.3. Oxidative Potential (OP)
2.4. Beas-2B Cell Culture
2.5. Interleukin-8
2.6. Endotoxin
2.7. Ames II
2.8. Statistics
3. Results
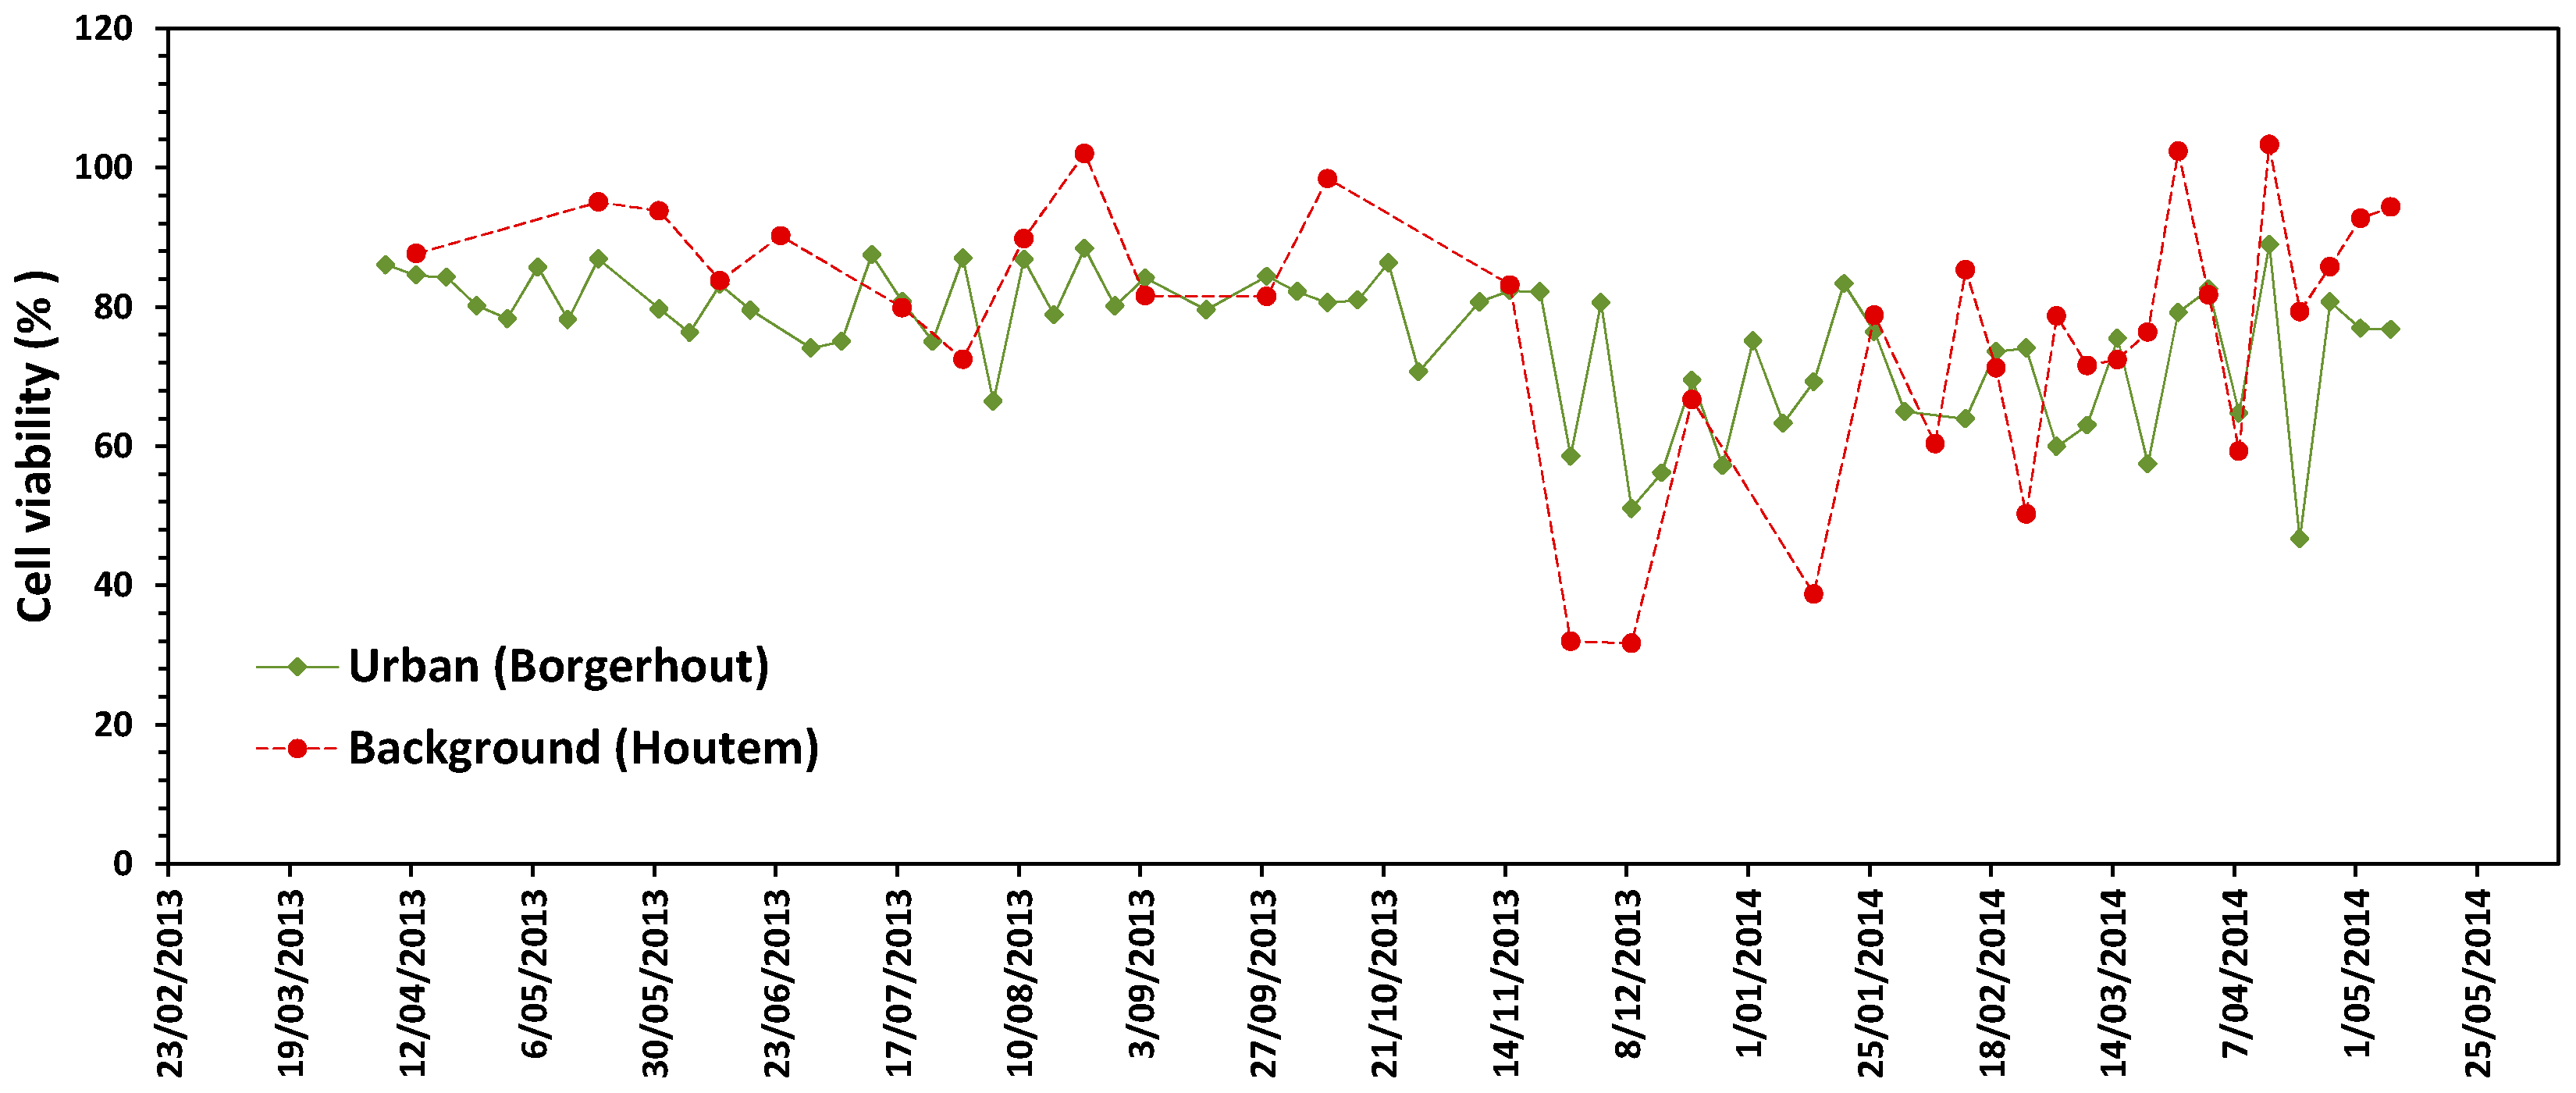
3.1. Cytotoxicity
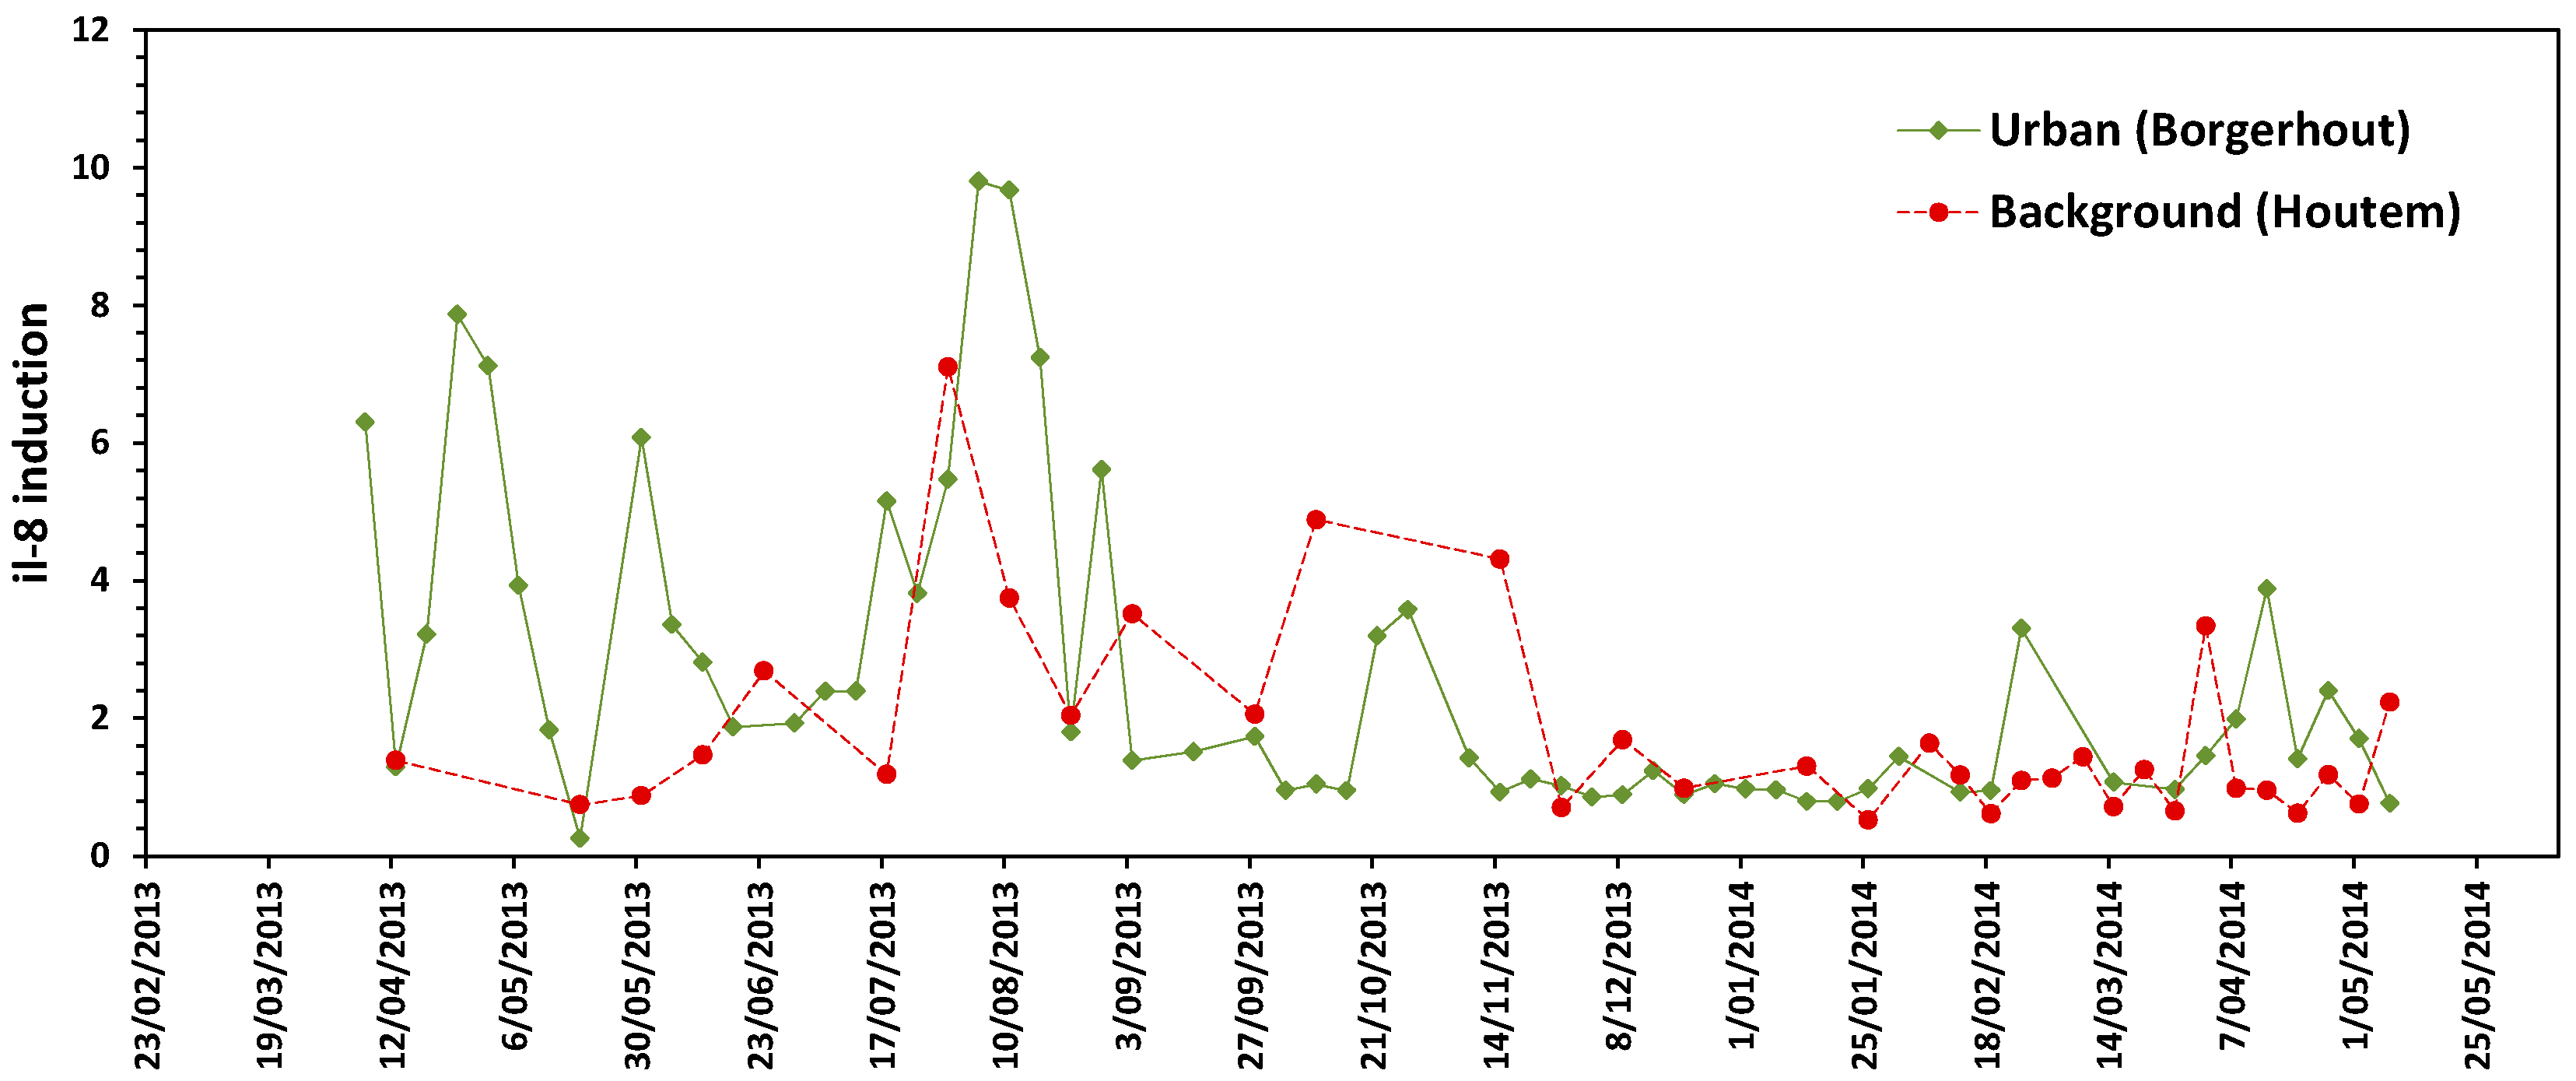
3.2. Pro-Inflammatory Response
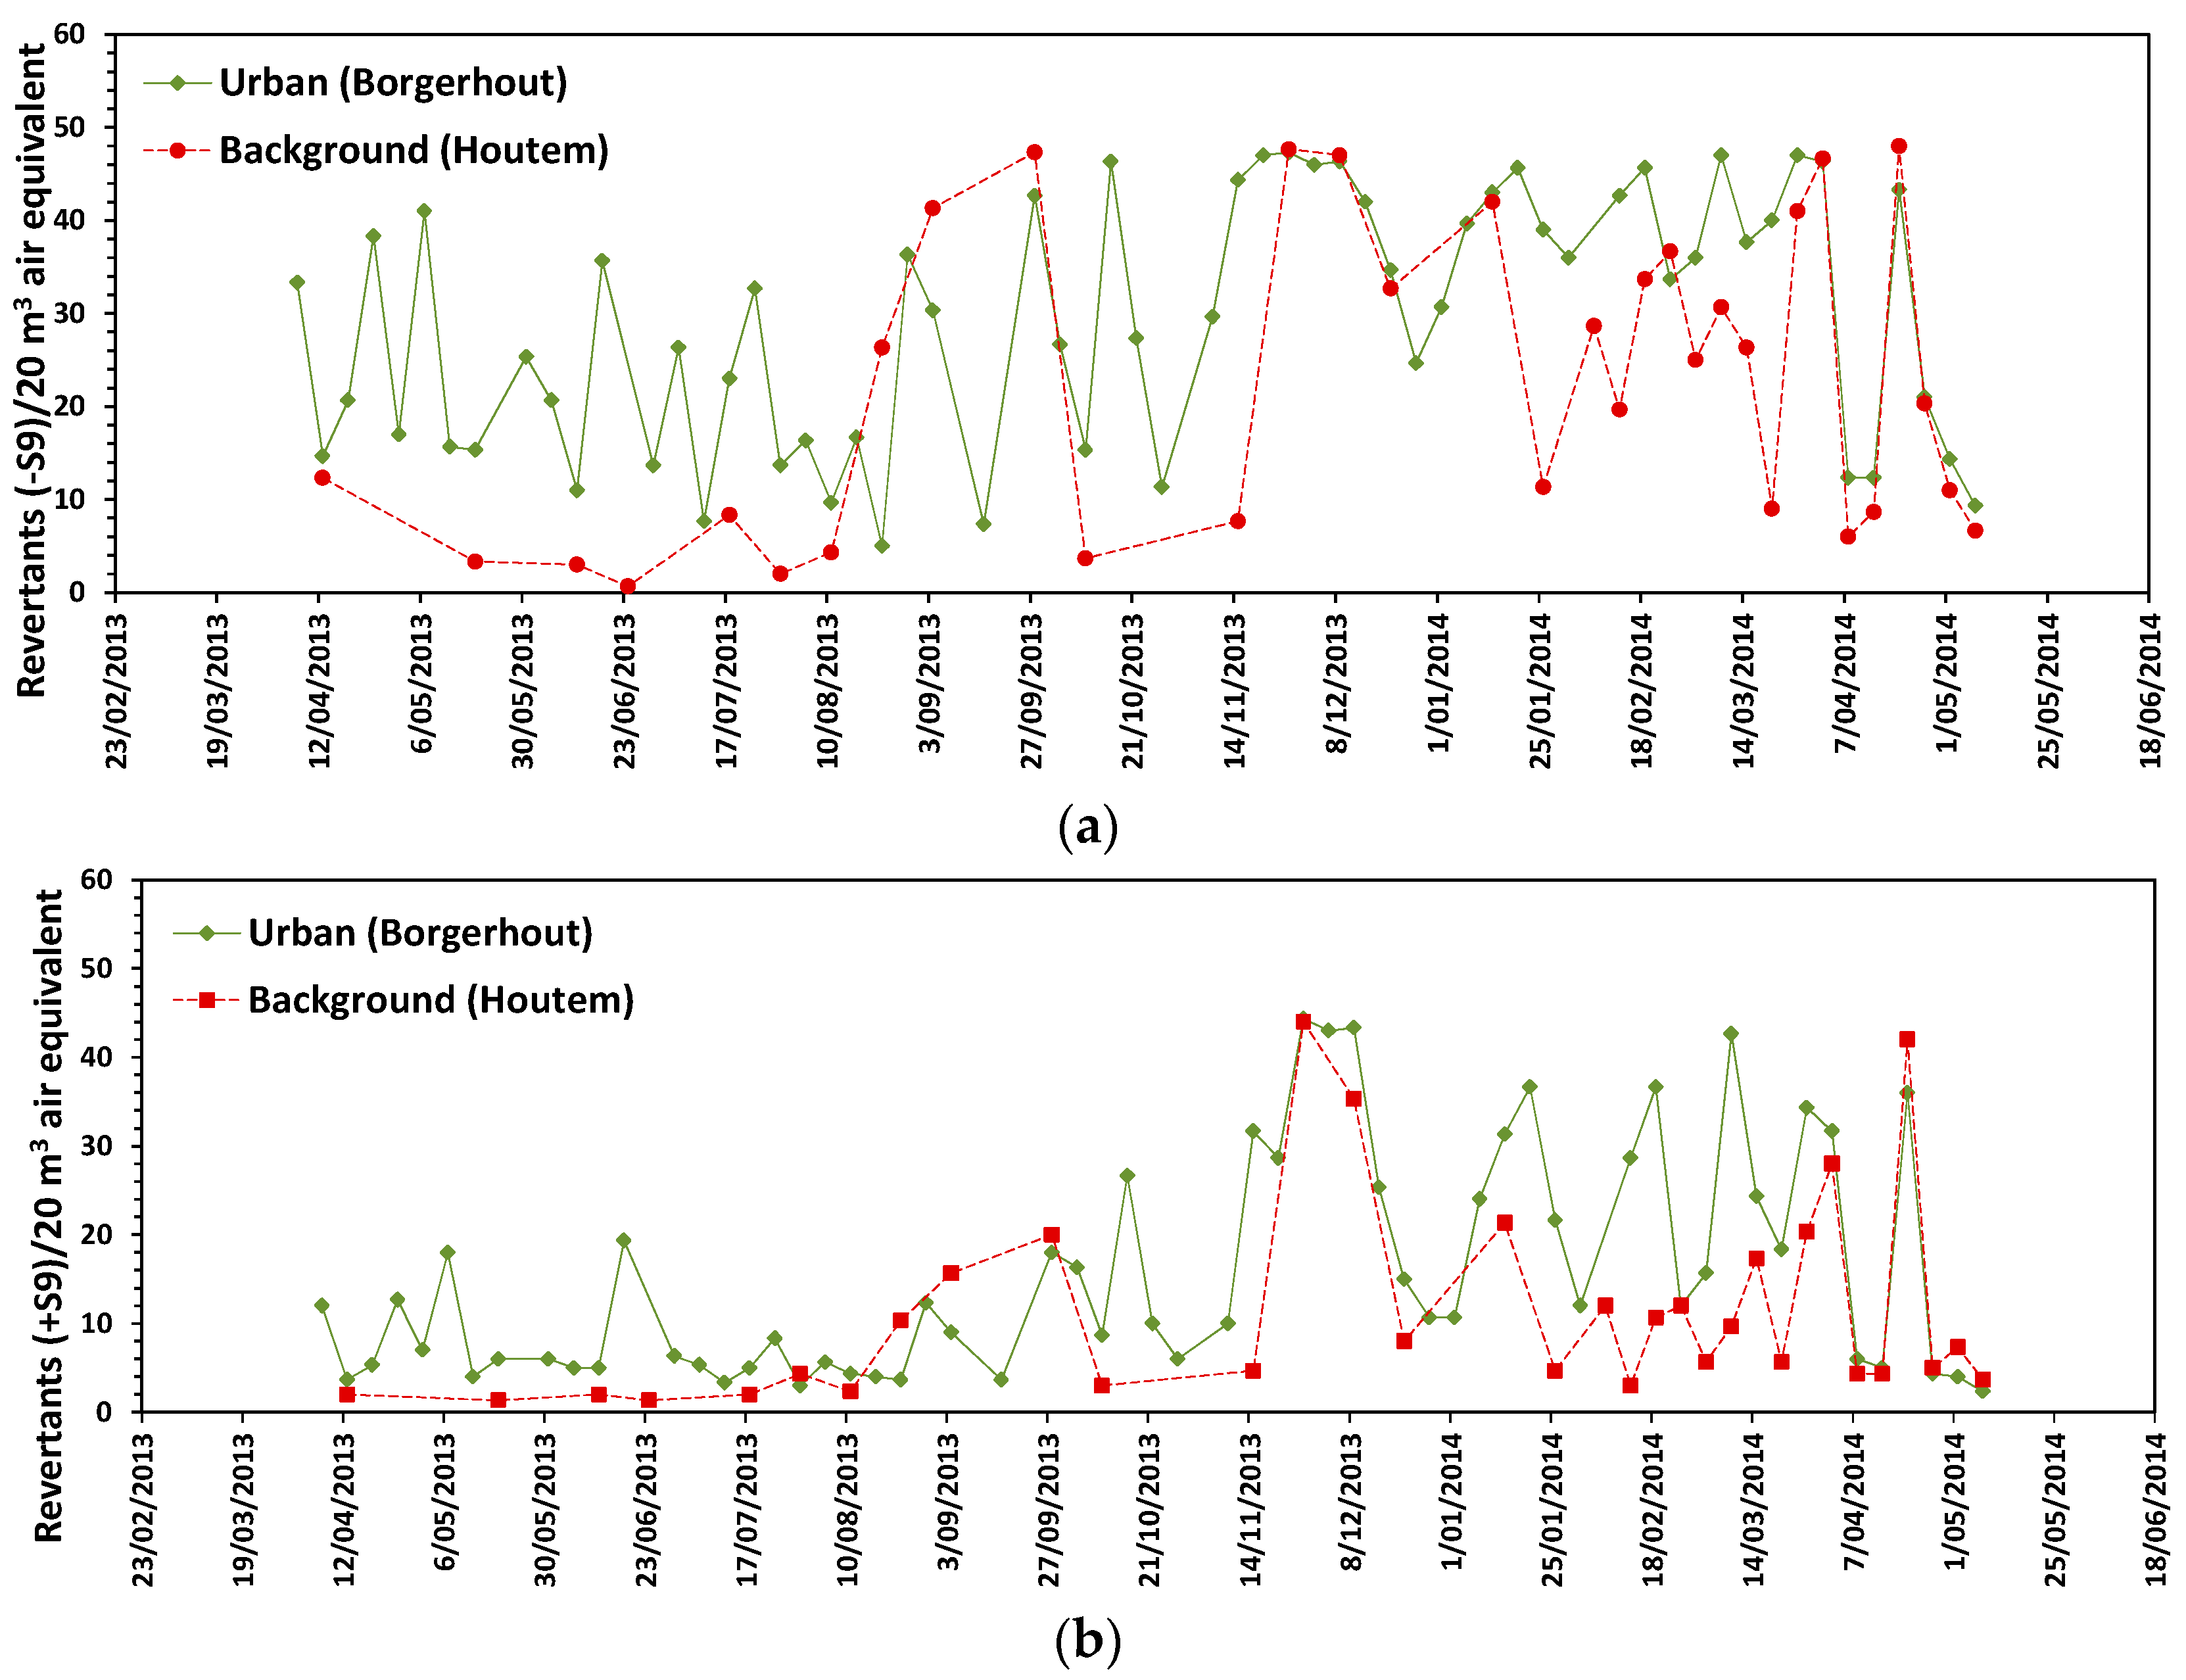
3.3. Mutagenic Response
3.4. Endotoxin
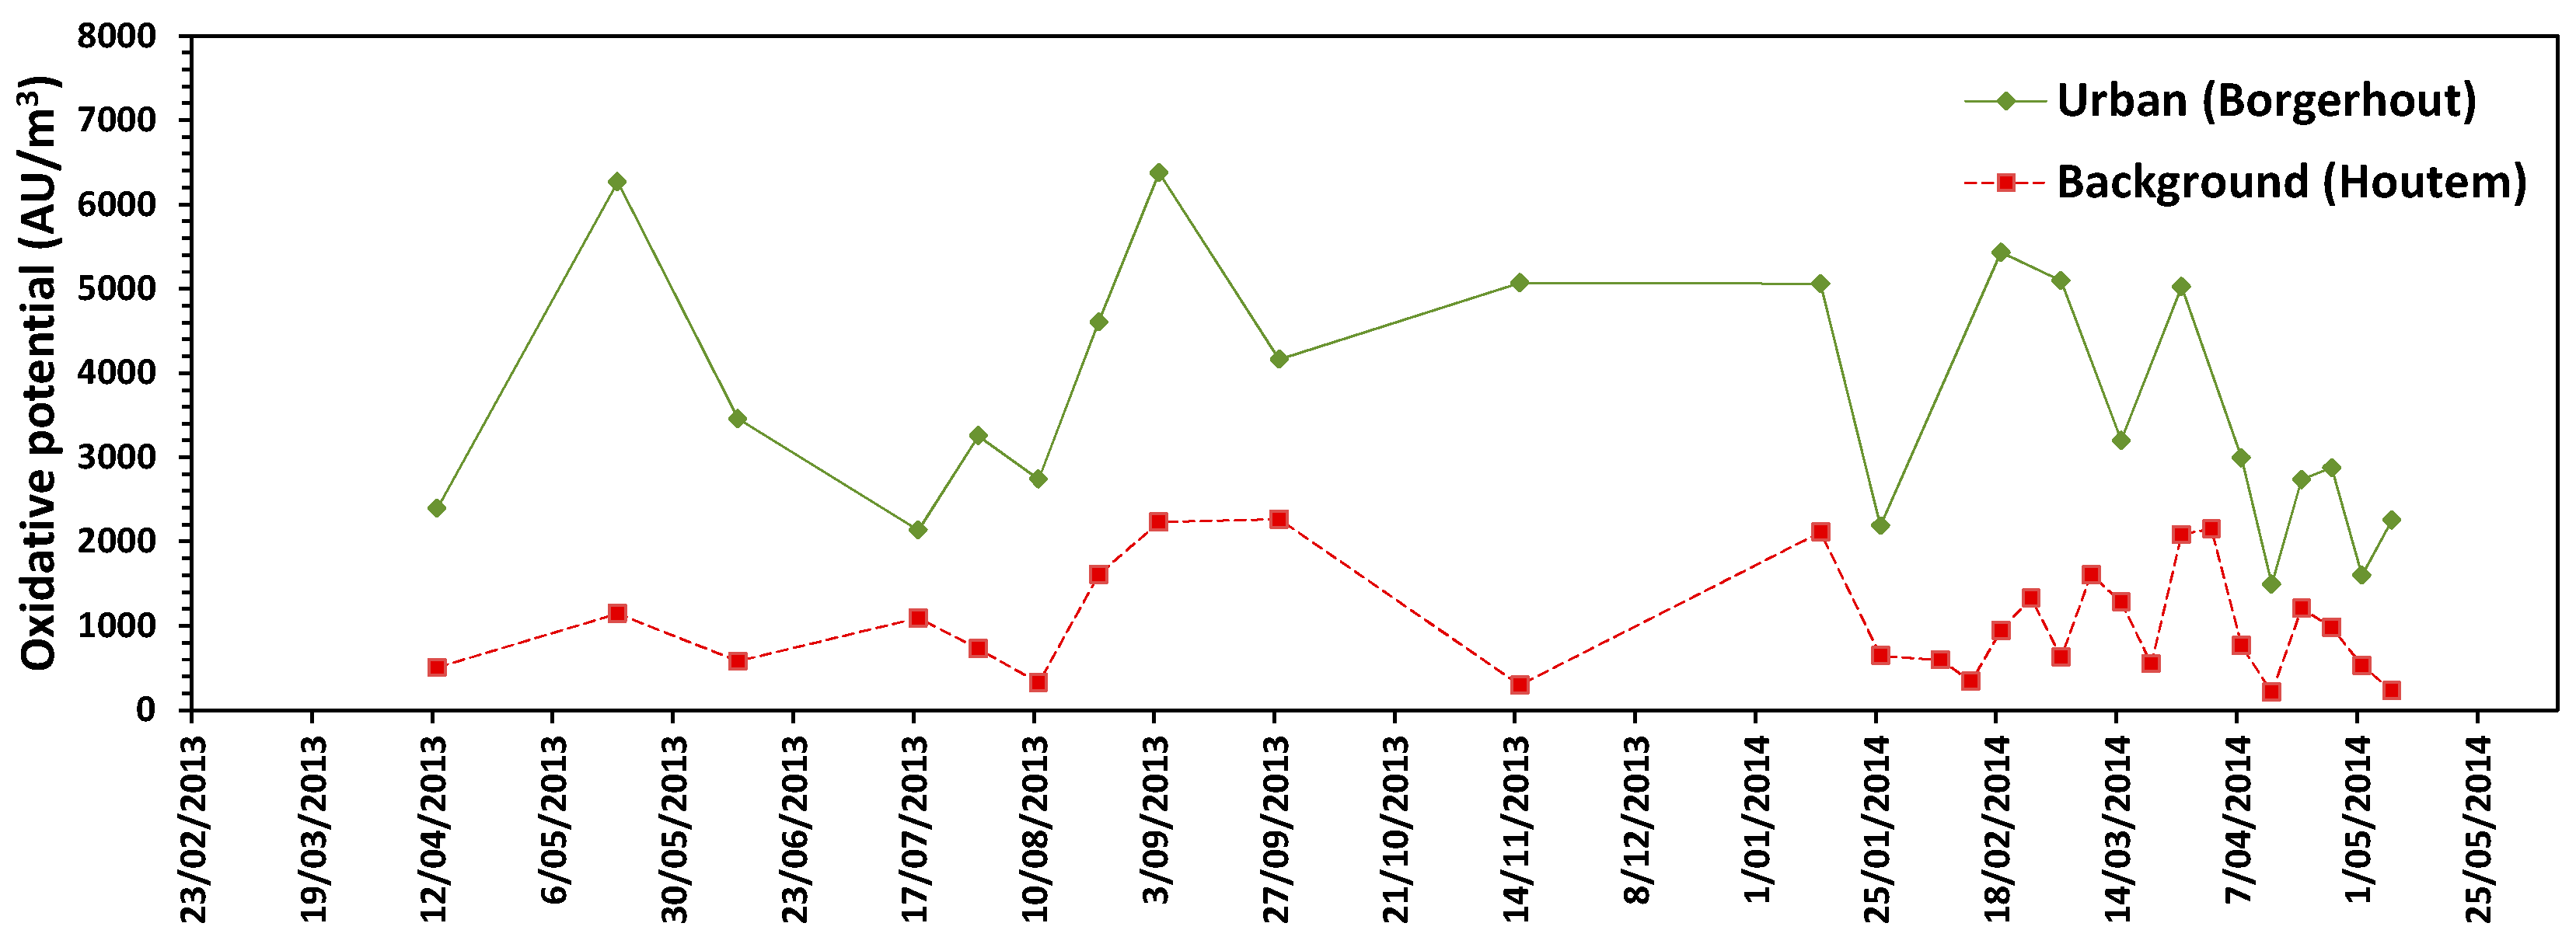
3.5. Oxidative Potential
3.6. Chemical Characteristics in Urban Air
4. Discussion
5. Conclusions
Acknowledgments
Author Contributions
Conflicts of Interest
References
- Kelly, F.J.; Fussell, J.C. Size, source and chemical composition as determinants of toxicity attributable to ambient particulate matter. Atmos. Environ. 2012, 60, 504–526. [Google Scholar] [CrossRef]
- Lippmann, M.; Chen, L.C.; Gordon, T.; Ito, K.; Thurston, G.D. National Particle Component Toxicity (NPACT) Initiative: Integrated epidemiologic and toxicologic studies of the health effects of particulate matter components. Res. Rep. Health Eff. Inst. 2013, 177, 5–13. [Google Scholar]
- Bell, M.L.; Ebisu, K.; Leaderer, B.P.; Gent, J.F.; Lee, H.J.; Koutrakis, P.; Wang, Y.; Dominici, F.; Peng, R.D. Associations of PM2.5 constituents and sources with hospital admissions, Analysis of four counties in connecticut and massachusetts (USA) for persons ≥ 65 years of age. Environ. Health Perspect. 2014, 122, 138–144. [Google Scholar] [CrossRef] [PubMed] [Green Version]
- Kelly, F.J.; Fuller, G.W.; Walton, H.A.; Fussell, J.C. Monitoring air pollution: Use of early warning systems for public health. Respirology 2012, 17, 7–19. [Google Scholar] [CrossRef] [PubMed]
- Lippmann, M.; Chen, L.C. Health effects of concentrated ambient air particulate matter (CAPs) and its components. Crit. Rev. Toxicol. 2009, 39, 865–913. [Google Scholar] [CrossRef] [PubMed]
- Stanek, L.S.; Dutton, S.; Dubois, J.-J. Attributing health effects to apportioned components and sources of particulate matter: An evaluation of collective results. Atmos. Environ. 2011, 45, 5655–5663. [Google Scholar] [CrossRef]
- Cassee, F.R.; Heroux, M.E.; Gerlofs-Nijland, M.E.; Kelly, F.J. Particulate matter beyond mass, Recent health evidence on the role of fractions, chemical constituents and sources of emission. Inhal. Toxicol. 2013, 25, 802–812. [Google Scholar] [CrossRef] [PubMed]
- Grahame, T.J.; Klemm, R.; Schlesinger, R.B. Public health and components of particulate matter: The changing assessment of black carbon. J. Air Waste Manag. Assoc. 2014, 64, 620–660. [Google Scholar] [CrossRef] [PubMed]
- Chen, L.C.; Lippmann, M. Effects of metals within ambient air particulate matter (PM) on human health. Inhal. Toxicol. 2009, 21, 1–31. [Google Scholar] [CrossRef] [PubMed]
- Gray, D.L.; Wallace, L.A.; Brinkman, M.C.; Buehler, S.S.; La Londe, C. Respiratory and cardiovascular effects of metals in ambient particulate matter: A critical review. Rev. Environ. Contam. Toxicol. 2015, 234, 135–203. [Google Scholar] [PubMed]
- Sarigiannis, D.A.; Karakitsios, S.P.; Kermenidou, M.V. Health impact and monetary cost of exposure to particulate matter emitted from biomass burning in large cities. Sci. Total Environ. 2015, 524–525, 319–330. [Google Scholar] [CrossRef] [PubMed]
- VMM. Chemkar PM10: Chemische Karakterisering van Fijn Stof in Vlaanderen—2010. 2010. Available online: https://www.vmm.be/publicaties/chemkar-pm10-chemische-karakterisering-van-fijn-stof-in-vlaanderen-2010 (accessed on 10 January 2018).
- VMM. Chemkar PM10—Stedencampagne: Chemische Karakterisering van fijn stof in Antwerpen, Gent, Brugge en Oostende 2011–2012. 2013. Available online: https://www.vlaanderen.be/nl/publicaties/detail/chemkar-pm10-stedencampagne-1 (accessed on 10 January 2018).
- Naeher, L.P.; Brauer, M.; Lipsett, M.; Zelikoff, J.T.; Simpson, C.D.; Koenig, J.Q.; Smith, K.R. Woodsmoke health effects: A review. Inhal. Toxicol. 2007, 19, 67–106. [Google Scholar] [CrossRef] [PubMed]
- Jedynska, A.; Hoek, G.; Wang, M.; Eeftens, M.; Cyrys, J.; Beelen, R.; Cirach, M.; De Nazelle, A.; Keuken, M.; Visschedijk, A.; et al. Spatial variations of levoglucosan in four European study areas. Sci. Total Environ. 2015, 505, 1072–1081. [Google Scholar] [CrossRef] [PubMed]
- Maenhaut, W.; Vermeylen, R.; Claeys, M.; Vercauteren, J.; Matheeussen, C.; Roekens, E. Assessment of the contribution from wood burning to the PM10 aerosol in Flanders, Belgium. Sci. Total Environ. 2012, 437, 226–236. [Google Scholar] [CrossRef] [PubMed]
- Maenhaut, W.; Vermeylen, R.; Claeys, M.; Vercauteren, J.; Roekens, E. Sources of the PM10 aerosol in Flanders, Belgium, and re-assessment of the contribution from wood burning. Sci. Total Environ. 2016, 562, 550–560. [Google Scholar] [CrossRef] [PubMed]
- Reis, F.J.; Marshall, J.D.; Brauer, M. Intake fraction of urban wood smoke. Environ. Sci. Technol. 2009, 43, 4701–4706. [Google Scholar] [CrossRef]
- Caseiro, A.; Bauer, H.; Schmidl, C.; Pio, C.A.; Puxbaum, H. Wood burning impact on PM10 in three Austrian regions. Atmos. Environ. 2009, 43, 2186–2195. [Google Scholar] [CrossRef]
- Fuller, G.W.; Tremper, A.H.; Baker, T.D.; Yttri, K.E.; Butterfield, D. Contribution of wood burning to PM10 in London. Atmos. Environ. 2014, 87, 87–94. [Google Scholar] [CrossRef] [Green Version]
- Estrellan, C.R.; Iino, F. Toxic emissions from open burning. Chemosphere 2010, 80, 193–207. [Google Scholar] [CrossRef] [PubMed]
- Jayarathne, T.T.; Stockwell, C.E.; Bhave, P.V.; Praveen, P.S.; Rathnayake, C.M.; Islam, M.R.; Panday, A.K.; Adhikari, S.; Maharjan, R.; Goetz, J.D.; et al. Nepal Ambient Monitoring and Source Testing Experiment (NAMaSTE): Emissions of particulate matter from wood and dung cooking fires, garbage and crop residue burning, brick kilns, and other sources. Atmos. Chem. Phys. 2017. [Google Scholar] [CrossRef]
- Simoneit, B.R.T.; Schauer, J.J.; Nolte, C.G.; Oros, D.R.; Elias, V.O.; Fraser, M.P.; Rogge, W.F.; Cass, G.R. Levoglucosan, a tracer for cellulose in biomass burning and atmospheric particles. Atmos. Environ. 1999, 33, 173–182. [Google Scholar] [CrossRef]
- Cordell, R.L.; Mazet, M.; Dechoux, C.; Hama, S.M.L.; Staelens, J.; Hofman, J.; Stroobants, C.; Roekens, E.; Kos, G.P.A.; Weijers, E.P.; et al. Evaluation of biomass burning across North West Europe and its impact on air quality. Atmos. Environ. 2016, 141, 276–286. [Google Scholar] [CrossRef]
- Fine, P.M.; Cass, G.R.; Simoneit, B.R.T. Chemical characterization of fine particle emissions from the fireplace combustion of wood types grown in the Midwestern and Western United States. Environ. Eng. Sci. 2004, 21, 387–409. [Google Scholar] [CrossRef]
- Engling, G.; Carrico, C.M.; Kreidenweis, S.M.; Collett, J.L., Jr.; Day, D.E.; Malm, W.C.; Lincoln, E.; Hao, W.M.; Iinuma, Y.; Herrmann, H.; et al. Determination of levoglucosan in biomass combustion aerosol by high-performance anion-exchange chromatography with pulsed amperometric detection. Atmos. Environ. 2006, 40, 299–311. [Google Scholar] [CrossRef]
- Vicente, E.D.; Duarte, M.A.; Tarelho, L.A.C.; Nunes, T.F.; Amato, F.; Querol, X.; Colombi, C.; Gianelle, V.; Alves, C.A. Particulate and gaseous emissions from the combustion of different biofuels in a pellet stove. Atmos. Environ. 2015, 120, 15–27. [Google Scholar] [CrossRef]
- MSDS Online Library of Safety Data Sheets. Available online: https://www.msdsonline.com/msds-search/ (accessed on 10 January 2018).
- PubChem Open Chemistry Database. Available online: https://pubchem.ncbi.nlm.nih.gov/compound/2724705#section=Top (accessed on 10 January 2018).
- Muala, A.; Rankin, G.; Sehlstedt, M.; Unosson, J.; Bosson, J.A.; Behndig, A.; Pourazar, J.; Nyström, R.; Pettersson, E.; Bergvall, C.; et al. Acute exposure to wood smoke from incomplete combustion--indications of cytotoxicity. Part. Fibre Toxicol. 2015, 12, 33. [Google Scholar] [CrossRef] [PubMed]
- Bonlokke, J.H.; Riddervold, I.S.; Gronborg, T.K.; Skogstrand, K.; Hougaard, D.M.; Barregard, L.; Sigsgaard, T. Systemic effects of wood smoke in a short-term experimental exposure study of atopic volunteers. J. Occup. Environ. Med. 2014, 56, 177–183. [Google Scholar] [CrossRef] [PubMed]
- Kocbach Bølling, A.; Pagels, J.; Yttri, K.; Barregard, L.; Sallsten, G.; Schwarze, P.E.; Boman, C. Health effects of residential wood smoke particles, The importance of combustion conditions and physicochemical particle properties. Part. Fibre Toxicol. 2009, 6, 29. [Google Scholar] [CrossRef] [PubMed]
- Kurmi, O.P.; Semple, S.; Devereux, G.S.; Gaihre, S.; Lam, K.B.; Sadhra, S.; Steiner, M.F.; Simkhada, P.; Smith, W.C.; Ayres, J.G. The effect of exposure to biomass smoke on respiratory symptoms in adult rural and urban Nepalese populations. Environ. Health 2014, 13, 92. [Google Scholar] [CrossRef] [PubMed] [Green Version]
- Lee, A.; Kinney, P.; Chillrud, S.; Jack, D. A systematic review of innate immunomodulatory effects of household air pollution secondary to the burning of biomass fuels. Ann. Glob. Health 2015, 81, 368–374. [Google Scholar] [CrossRef] [PubMed]
- Liu, J.C.; Pereira, G.; Uhl, S.A.; Bravo, M.A.; Bell, M.L. A systematic review of the physical health impacts from non-occupational exposure to wildfire smoke. Environ. Res. 2015, 136, 120–132. [Google Scholar] [CrossRef] [PubMed]
- Riddervold, I.S.; Bonlokke, J.H.; Olin, A.C.; Gronborg, T.K.; Schlunssen, V.; Skogstrand, K.; Hougaard, D.; Massling, A.; Sigsgaard, T. Effects of wood smoke particles from wood-burning stoves on the respiratory health of atopic humans. Part. Fibre Toxicol. 2012, 9, 12. [Google Scholar] [CrossRef] [PubMed]
- Stockfelt, L.; Sallsten, G.; Almerud, P.; Basu, S.; Barregard, L. Short-term chamber exposure to low doses of two kinds of wood smoke does not induce systemic inflammation, coagulation or oxidative stress in healthy humans. Inhal. Toxicol. 2013, 25, 417–425. [Google Scholar] [CrossRef] [PubMed]
- Unosson, J.; Blomberg, A.; Sandstrom, T.; Muala, A.; Boman, C.; Nystrom, R.; Westerholm, R.; Mills, N.L.; Newby, D.E.; Langrish, J.P.; et al. Exposure to wood smoke increases arterial stiffness and decreases heart rate variability in humans. Part. Fibre Toxicol. 2013, 10, 20. [Google Scholar] [CrossRef] [PubMed] [Green Version]
- Nemmar, A.; Holme, J.A.; Rosas, I.; Schwarze, P.E.; Alfaro-Moreno, E. Recent advances in particulate matter and nanoparticle toxicology: A review of the in vivo and in vitro studies. BioMed Res. Int. 2013, 2013, 279371. [Google Scholar] [CrossRef] [PubMed]
- Dergham, M.; Lepers, C.; Verdin, A.; Cazier, F.; Billet, S.; Courcot, D.; Shirali, P.; Garçon, G. Temporal-spatial variations of the physicochemical characteristics of air pollution Particulate Matter (PM2.5–0.3) and toxicological effects in human bronchial epithelial cells (BEAS-2B). Environ. Res. 2015, 137, 256–267. [Google Scholar] [CrossRef] [PubMed]
- Lepers, C.; Dergham, M.; Armand, L.; Billet, S.; Verdin, A.; Andre, V.; Pottier, D.; Courcot, D.; Shirali, P.; Sichel, F. Mutagenicity and clastogenicity of native airborne particulate matter samples collected under industrial, urban or rural influence. Toxicol. In Vitro 2014, 28, 866–874. [Google Scholar] [CrossRef] [PubMed]
- Møller, P.; Jacobsen, N.R.; Folkmann, J.K.; Danielsen, P.H.; Mikkelsen, L.; Hemmingsen, J.G.; Vesterdal, L.K. Role of oxidative damage in toxicity of particulates. Free Radic. Res. 2010, 44, 1–46. [Google Scholar] [CrossRef] [PubMed]
- Perrone, M.G.; Gualtieri, M.; Consonni, V.; Ferrero, L.; Sangiorgi, G.; Longhin, E.; Ballabio, D.; Bolzacchini, E.; Camatini, M. Particle size, chemical composition, seasons of the year and urban, rural or remote site origins as determinants of biological effects of particulate matter on pulmonary cells. Environ. Pollut. 2013, 176, 215–227. [Google Scholar] [CrossRef] [PubMed]
- Steenhof, M.; Gosens, I.; Strak, M.; Godri, K.J.; Hoek, G.; Cassee, F.R.; Mudway, I.S.; Kelly, F.J.; Harrison, R.M.; Lebret, E.; et al. In vitro toxicity of particulate matter (PM) collected at different sites in the Netherlands is associated with PM composition, size fraction and oxidative potential—The RAPTES project. Part. Fibre Toxicol 2011, 8, 26. [Google Scholar] [CrossRef] [PubMed]
- Chirizzi, D.; Cesari, D.; Guascito, M.R.; Dinoi, A.; Giotta, L.; Donateo, A.; Contini, D. Influence of Saharan dust outbreaks and carbon content on oxidative potential of water-soluble fractions of PM2.5 and PM10. Atmos. Environ. 2017, 163, 1–8. [Google Scholar] [CrossRef]
- Argyropoulos, G.; Besis, A.; Voutsa, D.; Samara, C.; Sowlat, M.H.; Hasheminassab, S.; Sioutas, C. Source apportionment of the redox activity of urban quasi-ultrafine particles (PM0.49) in Thessaloniki following the increased biomass burning due to the economic crisis in Greece. Sci. Total Environ. 2016, 568, 124–136. [Google Scholar] [CrossRef] [PubMed]
- Mishra, V.K.; Kumar, P.; Van Poppel, M.; Bleux, N.; Frijns, E.; Reggente, M.; Berghmans, P.; Int Panis, L.; Samson, R. Wintertime spatio-temporal variation of ultrafine particles in a Belgian city. Sci. Total Environ. 2012, 431, 307–313. [Google Scholar] [CrossRef] [PubMed] [Green Version]
- Mooibroek, D.; Staelens, J.; Cordell, R.; Panteliadis, P.; Delaunay, D.; Weijers, E.; Vercauteren, J.; Hoogerbrugge, R.; Dijkema, M.; Monks, P.S.; et al. PM10 Source Apportionment in Five North Western European Cities—Outcome of the Joaquin Project. Environ. Sci. Technol. 2016, 42, 264–292. [Google Scholar]
- Joaquin. Composition and source apportionment of PM10. Joint Air Quality Initiative, Work Package 1 Action 2 and 3. Flanders Environment Agency, Aalst. 2015. Available online: http://www.joaquin.eu (accessed on 10 January 2018).
- Cordell, R.L.; White, I.R.; Monks, P.S. Validation of an assay for the determination of levoglucosan and associated monosaccharide anhydrides for the quantification of wood smoke in atmospheric aerosol. Anal. Bioanal. Chem. 2014, 406, 5283–5292. [Google Scholar] [CrossRef] [PubMed]
- VMM. Luchtkwaliteit in Het Vlaamse Gewest—Jaarverslag Immissiemeetnetten. 2014. Available online: https://www.vmm.be/publicaties/luchtkwaliteit-in-het-vlaamse-gewest-jaarverslag-immissiemeetnetten-2013 (accessed on 10 January 2018).
- Yang, A.; Hellack, B.; Leseman, D.; Brunekreef, B.; Kuhlbusch, T.A.; Cassee, F.R.; Hoek, G.; Janssen, N.A.H. Temporal and spatial variation of the metal-related oxidative potential of PM2.5 and its relation to PM2.5 mass and elemental composition. Atmos. Environ. 2015, 102, 62–69. [Google Scholar] [CrossRef]
- Hellack, B.; Yang, A.; Cassee, F.; Janssen, N.A.; Schins, R.P.; Kuhlbusch, T.A.J. Intrinsic hydroxyl radical generation measurements directly from sampled filters as a metric for the oxidative potential of ambient particulate matter. J. Aerosol Sci. 2014, 72, 47–55. [Google Scholar] [CrossRef]
- Van Den Heuvel, R.; Den Hond, E.; Govarts, E.; Colles, A.; Koppen, G.; Staelens, J.; Mampaey, M.; Janssen, N.; Schoeters, G. Identification of PM10 characteristics involved in cellular responses in human bronchial epithelial cells (Beas-2b). Environ. Res. 2016, 149, 48–56. [Google Scholar] [CrossRef] [PubMed]
- Smith, K.E.; Heringa, M.B.; Uytewaal, M.; Mayer, P. The dosing determines mutagenicity of hydrophobic compounds in the Ames II assay with metabolic transformation: Passive dosing versus solvent spiking. Mutat. Res. 2013, 750, 12–18. [Google Scholar] [CrossRef] [PubMed]
- Akhtar, U.S.; McWhinney, R.D.; Rastogi, N.; Abbatt, J.P.; Evans, G.J.; Scott, J.A. Cytotoxic and proinflammatory effects of ambient and source-related particulate matter (PM) in relation to the production of reactive oxygen species (ROS) and cytokine adsorption by particles. Inhal. Toxicol. 2010, 22, 37–47. [Google Scholar] [CrossRef] [PubMed]
- Cachon, B.F.; Firmin, S.; Verdin, A.; Ayi-Fanou, L.; Billet, S.; Cazier, F.; Martin, P.J.; Aissi, F.; Courcot, D.; Sanni, A.; et al. Proinflammatory effects and oxidative stress within human bronchial epithelial cells exposed to atmospheric particulate matter (PM2.5 and PM>2.5) collected from Cotonou, Benin. Environ. Pollut. 2014, 185, 340–351. [Google Scholar] [CrossRef] [PubMed]
- Michael, S.; Montag, M.; Dott, W. Pro-inflammatory effects and oxidative stress in lung macrophages and epithelial cells induced by ambient particulate matter. Environ. Pollut. 2013, 183, 19–29. [Google Scholar] [CrossRef] [PubMed]
- Perrone, M.G.; Gualtieri, M.; Ferrero, L.; Lo, P.C.; Udisti, R.; Bolzacchini, E.; Camatini, M. Seasonal variations in chemical composition and in vitro biological effects of fine PM from Milan. Chemosphere 2010, 78, 1368–1377. [Google Scholar] [CrossRef] [PubMed]
- Bengalli, R.; Molteni, E.; Longhin, E.; Refsnes, M.; Camatini, M.; Gualtieri, M. Release of IL-1 beta triggered by Milan summer PM10, Molecular pathways involved in the cytokine release. BioMed Res. Int. 2013, 2013, 158093. [Google Scholar] [CrossRef]
- Silbajoris, R.; Osornio-Vargas, A.R.; Simmons, S.O.; Reed, W.; Bromberg, P.A.; Dailey, L.A.; Samet, J.M. Ambient particulate matter induces interleukin-8 expression through an alternative NF-κB (nuclear factor-kappa B) mechanism in human airway epithelial cells. Environ. Health Perspect. 2011, 119, 1379–1383. [Google Scholar] [CrossRef] [PubMed]
- Dergham, M.; Lepers, C.; Verdin, A.; Billet, S.; Cazier, F.; Courcot, D.; Shirali, P.; Garçon, G. Prooxidant and proinflammatory potency of air pollution particulate matter (PM2.5–0.3) produced in rural, urban, or industrial surroundings in human bronchial epithelial cells (BEAS-2B). Chem. Res. Toxicol. 2012, 25, 904–919. [Google Scholar] [CrossRef] [PubMed]
- Dieme, D.; Cabral-Ndior, M.; Garcon, G.; Verdin, A.; Billet, S.; Cazier, F.; Courcot, D.; Diouf, A.; Shirali, P. Relationship between physicochemical characterization and toxicity of fine particulate matter (PM2.5) collected in Dakar city (Senegal). Environ. Res. 2012, 113, 1–13. [Google Scholar] [CrossRef] [PubMed]
- Mitschik, S.; Schierl, R.; Nowak, D.; Jorres, R.A. Effects of particulate matter on cytokine production in vitro: A comparative analysis of published studies. Inhal. Toxicol. 2008, 20, 399–414. [Google Scholar] [CrossRef] [PubMed]
- Gualtieri, M.; Ovrevik, J.; Holme, J.A.; Perrone, M.G.; Bolzacchini, E.; Schwarze, P.E.; Camatini, M. Differences in cytotoxicity versus pro-inflammatory potency of different PM fractions in human epithelial lung cells. Toxicol. In Vitro 2010, 24, 29–39. [Google Scholar] [CrossRef] [PubMed]
- Happo, M.; Markkanen, A.; Markkanen, P.; Jalava, P.; Kuuspalo, K.; Leskinen, A.; Sippula, O.; Lehtinen, K.; Jokiniemi, J.; Hirvonen, M. Seasonal variation in the toxicological properties of size-segregated indoor and outdoor air particulate matter. Toxicol. In Vitro 2013, 27, 1550–1561. [Google Scholar] [CrossRef] [PubMed]
- Hetland, R.B.; Cassee, F.R.; Refsnes, M.; Schwarze, P.E.; Lag, M.; Boere, A.J.F.; Dybing, E. Release of inflammatory cytokines, cell toxicity and apoptosis in epithelial lung cells after exposure to ambient air particles of different size fractions. Toxicol. In Vitro 2004, 18, 203–212. [Google Scholar] [CrossRef]
- Salonen, R.O.; Halinen, A.I.; Pennanen, A.S.; Hirvonen, M.R.; Sillanpaa, M.; Hillamo, R.; Shi, T.; Borm, P.; Sandell, E.; Koskentalo, T.; et al. Chemical and in vitro toxicologic characterization of wintertime and springtime urban-air particles with an aerodynamic diameter below 10 microm in Helsinki. Scand. J. Work Environ. Health 2004, 30, 80–90. [Google Scholar] [PubMed]
- Hetland, R.B.; Cassee, F.R.; Lag, M.; Refsnes, M.; Dybing, E.; Schwarze, P.E. Cytokine release from alveolar macrophages exposed to ambient particulate matter: Heterogeneity in relation to size, city and season. Part. Fibre Toxicol. 2005, 2, 4. [Google Scholar] [CrossRef] [PubMed] [Green Version]
- Den Hartigh, L.J.; Lame, M.W.; Ham, W.; Kleeman, M.J.; Tablin, F.; Wilson, D.W. Endotoxin and polycyclic aromatic hydrocarbons in ambient fine particulate matter from Fresno, California initiate human monocyte inflammatory responses mediated by reactive oxygen species. Toxicol. In Vitro 2010, 24, 1993–2002. [Google Scholar] [CrossRef] [PubMed]
- De Kok, T.M.; Driece, H.A.; Hogervorst, J.G.; Briede, J.J. Toxicological Assessment of ambient and traffic-related particulate matter, A review of recent studies. Mutat. Res. 2006, 613, 103–122. [Google Scholar] [CrossRef] [PubMed]
- De Kok, T.M.; Hogervorst, J.G.; Briede, J.J.; van Herwijnen, M.H.; Maas, L.M.; Moonen, E.J.; Driece, H.A.; Kleinjans, J.C. Genotoxicity and physicochemical characteristics of traffic-related ambient particulate matter. Environ. Mol. Mutagen. 2005, 46, 71–80. [Google Scholar] [CrossRef] [PubMed]
- Coronas, M.V.; Pereira, T.S.; Rocha, J.A.; Lemos, A.T.; Fachel, J.M.; Salvadori, D.M.; Vargas, V.M. Genetic biomonitoring of an urban population exposed to mutagenic airborne pollutants. Environ. Int. 2009, 35, 1023–1029. [Google Scholar] [CrossRef] [PubMed]
- Gilli, G.; Pignata, C.; Schiliro, T.; Bono, R.; La, R.A.; Traversi, D. The mutagenic hazards of environmental PM2.5 in Turin. Environ. Res. 2007, 103, 168–175. [Google Scholar] [CrossRef] [PubMed]
- Lemos, A.T.; Coronas, M.V.; Rocha, J.A.; Vargas, V.M. Mutagenicity of particulate matter fractions in areas under the impact of urban and industrial activities. Chemosphere 2012, 89, 1126–1134. [Google Scholar] [CrossRef] [PubMed]
- Cassoni, F.; Bocchi, C.; Martino, A.; Pinto, G.; Fontana, F.; Buschini, A. The salmonella mutagenicity of urban airborne particulate matter (PM2.5) from eight sites of the emilia-romagna regional monitoring network (Italy). Sci. Total Environ. 2004, 324, 79–90. [Google Scholar] [CrossRef] [PubMed]
- Cerna, M.; Pochmanova, D.; Pastorkova, A.; Benes, I.; Lenicek, J.; Topinka, J.; Binkova, B. Genotoxicity of urban air pollutants in the Czech Republic, Part I, Bacterial mutagenic potencies of organic compounds adsorbed on PM10 particulates. Mutat. Res. 2000, 469, 71–82. [Google Scholar] [PubMed]
- Du Four, V.A.; Janssen, C.R.; Brits, E.; Van Larebeke, N. Genotoxic and mutagenic activity of environmental air samples from different rural, urban and industrial sites in Flanders, Belgium. Mutat. Res. 2005, 588, 106–117. [Google Scholar] [CrossRef] [PubMed]
- Traversi, D.; Degan, R.; De, M.R.; Gilli, G.; Pignata, C.; Ponzio, M.; Rava, M.; Sessarego, F.; Villani, S.; Bono, R. Mutagenic properties of PM2.5 air pollution in the Padana Plain (Italy) before and in the course of XX Winter Olympic Games of “Torino 2006”. Environ. Int. 2008, 34, 966–970. [Google Scholar] [CrossRef] [PubMed]
- Claxton, L.D.; Matthews, P.P.; Warren, S.H. The genotoxicity of ambient outdoor air, a review: Salmonella mutagenicity. Mutat. Res. 2004, 567, 347–399. [Google Scholar] [CrossRef] [PubMed]
- Vargas, V.M. Mutagenic activity as a parameter to assess ambient air quality for protection of the environment and human health. Mutat. Res. 2003, 544, 313–319. [Google Scholar] [CrossRef] [PubMed]
- Healy, D.A.; Hellebust, S.; Silvari, V.; Lopez, J.M.; Whittaker, A.G.; Wenger, J.C.; Heffron, J.J.A.; Sodeau, J.R. Using a pattern recognition approach to link inorganic chemical fingerprints of ambient PM2.5–0.1 with in vitro biological effects. Air Qual. Atmos. Health 2012, 5, 125–147. [Google Scholar] [CrossRef]
- Kocbach, A.; Herseth, J.I.; Låg, M.; Refsnes, M.; Schwarze, P.E. Particles from wood smoke and traffic induce differential pro-inflammatory response patterns in co-cultures. Toxicol. Appl. Pharmacol. 2008, 232, 317–326. [Google Scholar] [CrossRef] [PubMed]
- Bolling, A.K.; Totlandsdal, A.I.; Sallsten, G.; Braun, A.; Westerholm, R.; Bergvall, C.; Boman, J.; Dahlman, H.; Sehlstedt, M.; Cassee, F.; et al. Wood smoke particles from different combustion phases induce similar pro-inflammatory effects in a co-culture of monocyte and pneumocyte cell lines. Part. Fibre Toxicol. 2012, 9, 45. [Google Scholar] [CrossRef] [PubMed] [Green Version]
- Danielsen, P.H.; Moller, P.; Jensen, K.A.; Sharma, A.K.; Wallin, H.; Bossi, R.; Autrup, H.; Mølhave, L.; Ravanat, J.-L.; Briedé, J.J.; et al. Oxidative stress, DNA damage, and inflammation induced by ambient air and wood smoke particulate matter in human A549 and THP-1 cell lines. Chem. Res. Toxicol. 2011, 24, 168–184. [Google Scholar] [CrossRef] [PubMed]
- Kocbach, A.; Namork, E.; Schwarze, P.E. Pro-inflammatory potential of wood smoke and traffic-derived particles in a monocytic cell line. Toxicology 2008, 247, 123–132. [Google Scholar] [CrossRef] [PubMed]
- Karlsson, H.L.; Ljungman, A.G.; Lindbom, J.; Moller, L. Comparison of genotoxic and inflammatory effects of particles generated by wood combustion, a road simulator and collected from street and subway. Toxicol. Lett. 2006, 165, 203–211. [Google Scholar] [CrossRef] [PubMed]
- Jalava, P.; Salonen, R.; Nuutinen, K.; Pennanen, A.; Happo, M.; Tissari, J.; Frey, A.; Hillamo, R.; Jokiniemi, J.; Hirvonen, M.-R. Effect of combustion condition on cytotoxic and inflammatory activity of residential wood combustion particles. Atmos. Environ. 2010, 44, 1691–1698. [Google Scholar] [CrossRef]
- Hamad, S.H.; Schauer, J.J.; Antkiewicz, D.S.; Shafer, M.M.; Kadhim, A. ROS production and gene expression in alveolar macrophages exposed to PM2.5) from Baghdad, Iraq: Seasonal trends and impact of chemical composition. Sci. Total Environ. 2016, 543, 739–745. [Google Scholar] [CrossRef] [PubMed]
- Kurmi, O.P.; Dunster, C.; Ayres, J.G.; Kelly, F.J. Oxidative potential of smoke from burning wood and mixed biomass fuels. Free Radic. Res. 2013, 47, 829–835. [Google Scholar] [CrossRef] [PubMed]
- Leonard, S.S.; Castranova, V.; Chen, B.T.; Schwegler-Berry, D.; Hoover, M.; Piacitelli, C.; Gaughan, D.M. Particle size-dependent radical generation from wildland fire smoke. Toxicology 2007, 236, 103–113. [Google Scholar] [CrossRef] [PubMed]
- Danielsen, P.H.; Loft, S.; Kocbach, A.; Schwarze, P.E.; Moller, P. Oxidative damage to DNA and repair induced by norwegian wood smoke particles in human A549 and THP-1 cell lines. Mutat. Res. 2009, 674, 116–122. [Google Scholar] [CrossRef] [PubMed]

| n | Mean ± SD | ||
|---|---|---|---|
| PM10 | µg/m³ | 61 | 25.19 ±12.65 |
| OC | µg/m³ | 58 | 3.74 ±1.93 |
| EC | µg/m³ | 58 | 1.45 ± 1.03 |
| Galactosan | ng/m³ | 61 | 5.79 ± 6.85 |
| Mannosan | ng/m³ | 61 | 15.68 ± 18.91 |
| Levoglucosan | ng/m³ | 61 | 66.34 ± 73.04 |
| Fluoranthene | ng/m³ | 35 | 0.49 ± 0.41 |
| Pyrene | ng/m³ | 35 | 0.35 ± 0.41 |
| Benzo(a)anthracene | ng/m³ | 35 | 0.21 ± 0.38 |
| Chrysene | ng/m³ | 35 | 0.23 ± 0.23 |
| Benzo(b)fluoranthene | ng/m³ | 35 | 0.15 ± 0.20 |
| Benzo(k)fluoranthene | ng/m³ | 35 | 0.08 ± 0.14 |
| Benzo(a)pyrene | ng/m³ | 35 | 0.15 ± 0.32 |
| Benzo(ghi)perylene | ng/m³ | 35 | 0.13 ± 0.19 |
| Indeno(1,2,3-cd)pyrene | ng/m³ | 35 | 0.09 ± 0.13 |
| n | Levoglucosan | Galactosan | Mannosan | |
|---|---|---|---|---|
| EC | 61 | 0.60 ** | 0.59 ** | 0.56 ** |
| Fluorantheen | 35 | 0.47 ** | 0.44 ** | 0.39 * |
| Pyreen | 35 | 0.59 ** | 0.56 ** | 0.50 ** |
| Benzo(a)anthraceen | 35 | 0.67 ** | 0.66 ** | 0.61 ** |
| Chryseen | 35 | 0.58 ** | 0.59 ** | 0.54 ** |
| Benzo(b)fluorantheen | 35 | 0.67 ** | 0.63 ** | 0.64 ** |
| Benzo(k)fluorantheen | 35 | 0.68 ** | 0.68 ** | 0.63 ** |
| Benzo(a)pyreen | 35 | 0.70 ** | 0.71 ** | 0.65 ** |
| Benzo(ghi)peryleen | 35 | 0.67 ** | 0.67 ** | 0.62 ** |
| Indeno(1,2,3-cd)pyreen | 35 | 0.57 ** | 0.57 ** | 0.52 ** |
| Chemical Compound | Direct Mutagenicity | Indirect Mutagenicity |
|---|---|---|
| MA (n = 61) | ||
| Galactosan | 0.60 *** | 0.78 *** |
| Mannosan | 0.55 *** | 0.70 *** |
| Levoglucosan | 0.64 *** | 0.77 *** |
| PAHs (n = 35) | ||
| Fluoranthene | 0.18 | 0.39 * |
| Pyrene | 0.29 | 0.54 *** |
| Benzo(a)anthracene | 0.25 | 0.60 *** |
| Chrysene | 0.43 ** | 0.68 *** |
| Benzo(b)fluoranthene | 0.25 | 0.60 *** |
| Benzo(k)fluoranthene | 0.42 * | 0.69 *** |
| Benzo(a)pyrene | 0.45 ** | 0.72 *** |
| Benzo(ghi)perylene | 0.43 ** | 0.64 *** |
| Indeno(1,2,3-cd)pyrene | 0.30 | 0.53 *** |
| Sum PAHs | 0.38 * | 0.63 *** |
| Sum cPAHs $ | 0.45 ** | 0.73 *** |
| Sum non-cPAHs $$ | 0.25 | 0.50 ** |
| OC (n = 61) | 0.47 *** | 0.31 * |
| EC (n = 55) | 0.44 *** | 0.40 ** |
© 2018 by the authors. Licensee MDPI, Basel, Switzerland. This article is an open access article distributed under the terms and conditions of the Creative Commons Attribution (CC BY) license (http://creativecommons.org/licenses/by/4.0/).
Share and Cite
Van Den Heuvel, R.; Staelens, J.; Koppen, G.; Schoeters, G. Toxicity of Urban PM10 and Relation with Tracers of Biomass Burning. Int. J. Environ. Res. Public Health 2018, 15, 320. https://doi.org/10.3390/ijerph15020320
Van Den Heuvel R, Staelens J, Koppen G, Schoeters G. Toxicity of Urban PM10 and Relation with Tracers of Biomass Burning. International Journal of Environmental Research and Public Health. 2018; 15(2):320. https://doi.org/10.3390/ijerph15020320
Chicago/Turabian StyleVan Den Heuvel, Rosette, Jeroen Staelens, Gudrun Koppen, and Greet Schoeters. 2018. "Toxicity of Urban PM10 and Relation with Tracers of Biomass Burning" International Journal of Environmental Research and Public Health 15, no. 2: 320. https://doi.org/10.3390/ijerph15020320
APA StyleVan Den Heuvel, R., Staelens, J., Koppen, G., & Schoeters, G. (2018). Toxicity of Urban PM10 and Relation with Tracers of Biomass Burning. International Journal of Environmental Research and Public Health, 15(2), 320. https://doi.org/10.3390/ijerph15020320