The Association between Children’s and Parents’ Co-TV Viewing and Their Total Screen Time in Six European Countries: Cross-Sectional Data from the Feel4diabetes-Study

 , , , , , and
Abstract
:1. Introduction
2. Materials and Methods
2.1. Study Background
2.2. Measures
2.3. Data Analysis
2.4. Ethics Approval and Consent to Participate
3. Results
3.1. Descriptives
3.2. Association of Co-TV Viewing and Screen Time of the Child
3.2.1. Total Sample
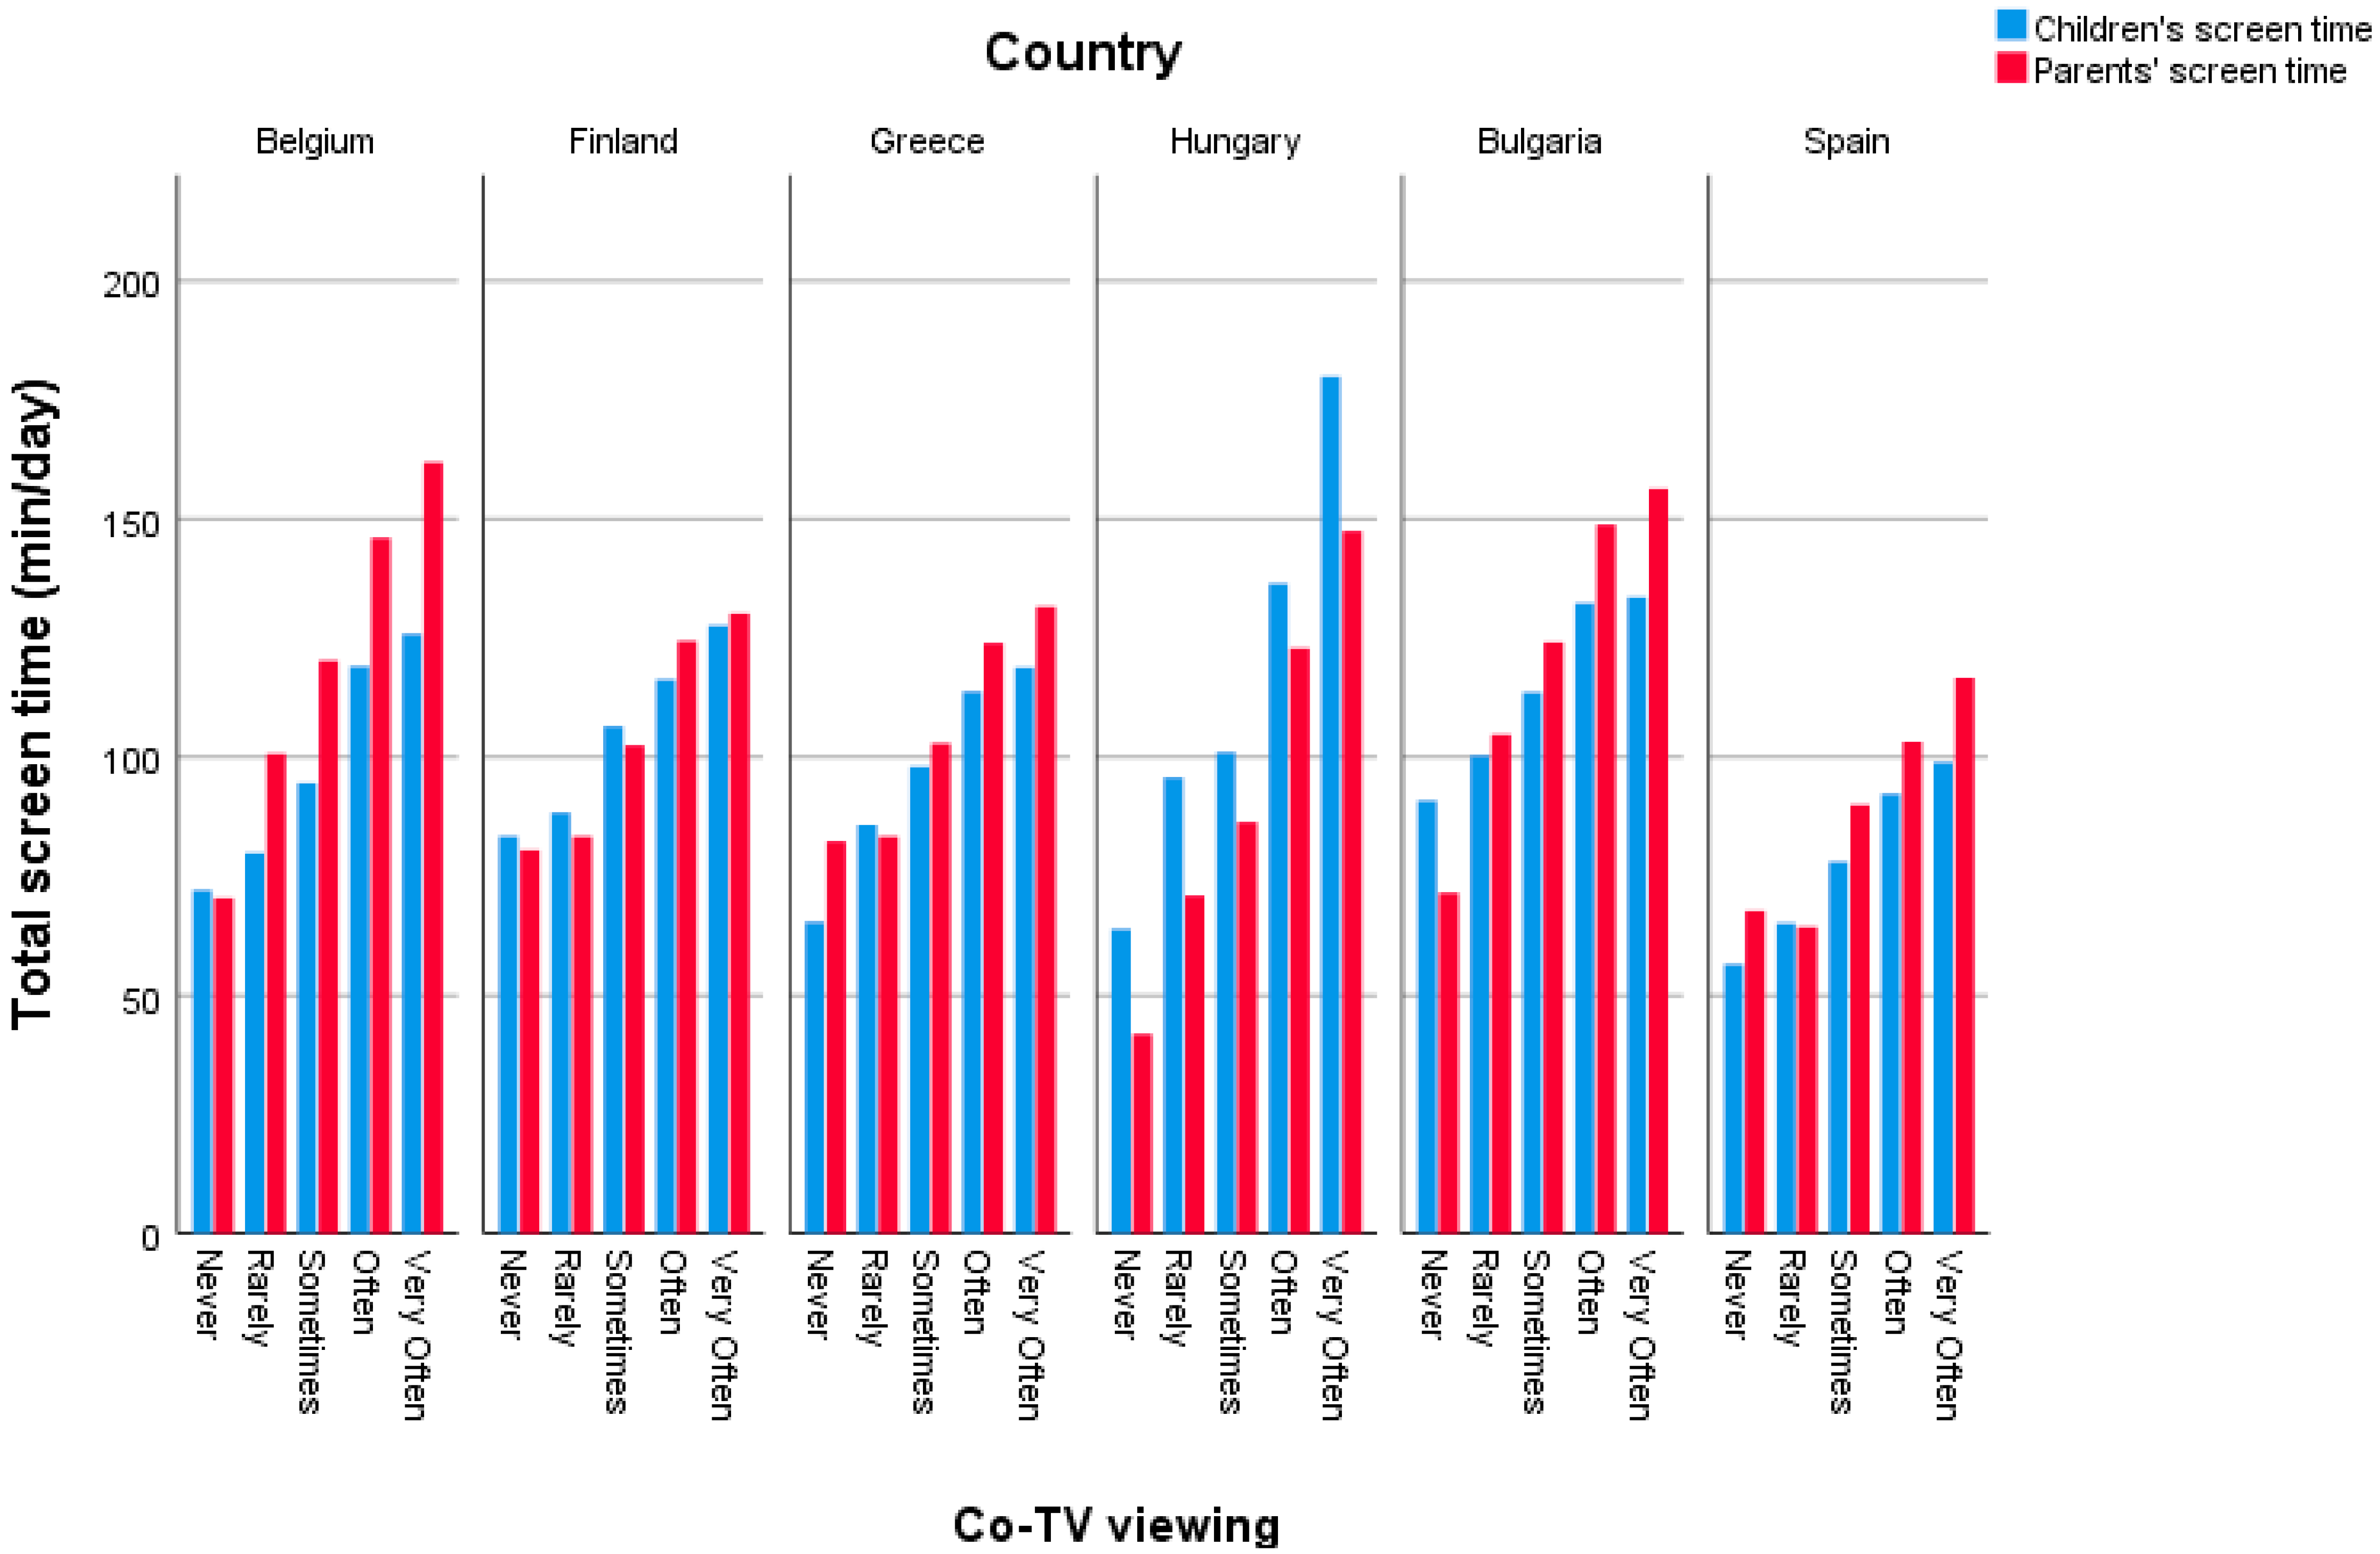
3.2.2. Effects per Country
3.3. Association of Co-TV Viewing and Screen Time of the Parent
3.3.1. Total Sample
3.3.2. Effects per Country
4. Discussion
5. Conclusions
Author Contributions
Funding
Acknowledgments
The Feel4Diabetes-study group consists of
The Feel4Diabetes member group
Conflicts of Interest
References
- Biddle, S.J.; Gorely, T.; Marshall, S.J. Is television viewing a suitable marker of sedentary behavior in young people? Ann. Behav. Med. 2009, 38, 147–153. [Google Scholar] [CrossRef] [PubMed]
- Biddle, S.J.; O′Connell, S.; Braithwaite, R.E. Sedentary behaviour interventions in young people: A meta-analysis. Br. J. Sports Med. 2011, 45, 937–942. [Google Scholar] [CrossRef] [PubMed] [Green Version]
- Tremblay, M.S.; Carson, V.; Chaput, J.-P.; Connor Gorber, S.; Dinh, T.; Duggan, M.; Faulkner, G.; Gray, C.E.; Gruber, R.; Janson, K. Canadian 24-hour movement guidelines for children and youth: An integration of physical activity, sedentary behaviour, and sleep. Appl. Physoil. Nutr. Metab. 2016, 41, 311–327. [Google Scholar] [CrossRef] [PubMed]
- Hinkley, T.; Salmon, J.; Okely, A.D.; Crawford, D.; Hesketh, K. Preschoolers′ physical activity, screen time, and compliance with recommendations. Med. Sci. Sports Exerc. 2012, 44, 458–465. [Google Scholar] [CrossRef] [PubMed]
- American Academy of Pediatrics. Announces New Recommendations for Children’s Media Use 2016. Available online: https://www.aap.org/en-us/about-the-aap/aap-press-room/Pages/American-Academy-of-Pediatrics-Announces-New-Recommendations-for-Childrens-Media-Use.aspx (accessed on 18 November 2018).
- Santaliestra-Pasias, A.M.; Mouratidou, T.; Verbestel, V.; Bammann, K.; Molnar, D.; Sieri, S.; Siani, A.; Veidebaum, T.; Marild, S.; Lissner, L.; et al. Physical activity and sedentary behaviour in European children: The IDEFICS study. Public Health Nutr. 2014, 17, 2295–2306. [Google Scholar] [CrossRef] [PubMed]
- Maher, C.; Olds, T.S.; Eisenmann, J.C.; Dollman, J. Screen time is more strongly associated than physical activity with overweight and obesity in 9-to 16-year-old Australians. Acta Pædiatr. 2012, 101, 1170–1174. [Google Scholar] [CrossRef] [PubMed]
- Rey-Lopez, J.P.; Vicente-Rodríguez, G.; Biosca, M.; Moreno, L.A. Sedentary behaviour and obesity development in children and adolescents. Nutr. Metab. Cardiovasc. Dis. 2008, 18, 242–251. [Google Scholar] [CrossRef] [PubMed]
- Tremblay, M.S.; LeBlanc, A.G.; Kho, M.E.; Saunders, T.J.; Larouche, R.; Colley, R.C.; Goldfield, G.; Gorber, S.C. Systematic review of sedentary behaviour and health indicators in school-aged children and youth. Int. J. Behav. Nutr. Phy. 2011, 8, 98. [Google Scholar] [CrossRef] [PubMed] [Green Version]
- Jago, R.; Baranowski, T.; Baranowski, J.C.; Thompson, D.; Greaves, K. BMI from 3–6 y of age is predicted by TV viewing and physical activity, not diet. Int. J. Obes. 2005, 29, 557. [Google Scholar] [CrossRef] [PubMed]
- Ekelund, U.; Brage, S.; Froberg, K.; Harro, M.; Anderssen, S.A.; Sardinha, L.B.; Riddoch, C.; Andersen, L.B. TV viewing and physical activity are independently associated with metabolic risk in children: The European Youth Heart Study. PLoS Med. 2006, 3, e488. [Google Scholar] [CrossRef] [PubMed]
- Corder, K.; Atkin, A.J.; Bamber, D.J.; Brage, S.; Dunn, V.J.; Ekelund, U.; Owens, M.; van Sluijs, E.M.; Goodyer, I.M. Revising on the run or studying on the sofa: Prospective associations between physical activity, sedentary behaviour, and exam results in British adolescents. Int. J. Behav. Nutr. Phy. 2015, 12, 106. [Google Scholar] [CrossRef] [PubMed] [Green Version]
- Page, A.S.; Cooper, A.R.; Griew, P.; Jago, R. Children′s screen viewing is related to psychological difficulties irrespective of physical activity. Pediatrics 2010, 157, 1154. [Google Scholar]
- Wen, L.M.; Baur, L.A.; Rissel, C.; Xu, H.; Simpson, J.M. Correlates of body mass index and overweight and obesity of children aged 2 years: Findings from the healthy beginnings trial. Obesity. 2014, 22, 1723–1730. [Google Scholar] [CrossRef] [PubMed] [Green Version]
- Jones, R.A.; Hinkley, T.; Okely, A.D.; Salmon, J. Tracking physical activity and sedentary behavior in childhood: A. systematic review. Am. J. Prev. Med. 2013, 44, 651–658. [Google Scholar] [CrossRef] [PubMed]
- Chaput, J.-P.; Carson, V.; Gray, C.E.; Tremblay, M.S. Importance of all movement behaviors in a 24 hour period for overall health. Int. J. Environ. Res. Public Health 2014, 11, 12575–12581. [Google Scholar] [CrossRef] [PubMed]
- DeMattia, L.; Lemont, L.; Meurer, L. Do interventions to limit sedentary behaviours change behaviour and reduce childhood obesity? A critical review of the literature. Obes. Rev. 2007, 8, 69–81. [Google Scholar] [CrossRef] [PubMed]
- Epstein, L.H.; Paluch, R.A.; Gordy, C.C.; Dorn, J. Decreasing sedentary behaviors in treating pediatric obesity. Arch. Pediatr. Adolesc. Med. 2000, 154, 220–226. [Google Scholar] [CrossRef] [PubMed]
- Wahi, G.; Parkin, P.C.; Beyene, J.; Uleryk, E.M.; Birken, C.S. Effectiveness of interventions aimed at reducing screen time in children: A systematic review and meta-analysis of randomized controlled trials. Arch. Pediatr. Adolesc. Med. 2011, 165, 979–986. [Google Scholar] [CrossRef] [PubMed]
- Schmidt, M.E.; Haines, J.; O′brien, A.; McDonald, J.; Price, S.; Sherry, B.; Taveras, E.M. Systematic review of effective strategies for reducing screen time among young children. Obesity. 2012, 20, 1338–1354. [Google Scholar] [CrossRef] [PubMed]
- Cillero, I.H.; Jago, R. Systematic review of correlates of screen-viewing among young children. Prev. Med. 2010, 51, 3–10. [Google Scholar] [CrossRef] [PubMed]
- Marsh, S.; Foley, L.; Wilks, D.; Maddison, R. Family-based interventions for reducing sedentary time in youth: A systematic review of randomized controlled trials. Obes. Rev. 2014, 15, 117–133. [Google Scholar] [CrossRef] [PubMed]
- Xu, H.; Wen, L.M.; Rissel, C. Associations of parental influences with physical activity and screen time among young children: A systematic review. J. Obes. 2015, 2015, 1–23. [Google Scholar] [CrossRef] [PubMed]
- Trost, S.G.; Sallis, J.F.; Pate, R.R.; Freedson, P.S.; Taylor, W.C.; Dowda, M. Evaluating a model of parental influence on youth physical activity. Am. J. Prev. Med. 2003, 25, 277–282. [Google Scholar] [CrossRef]
- Bauman, K.E.; Ennett, S.T.; Foshee, V.A.; Pemberton, M.; Hicks, K. Correlates of participation in a family-directed tobacco and alcohol prevention program for adolescents. Health Educ. Behav. 2001, 28, 440–461. [Google Scholar] [CrossRef] [PubMed]
- Granich, J.; Rosenberg, M.; Knuiman, M.; Timperio, A. Understanding children′s sedentary behaviour: A qualitative study of the family home environment. Health Educ. Res. 2008, 25, 199–210. [Google Scholar] [CrossRef] [PubMed]
- Atkin, A.J.; Sharp, S.J.; Corder, K.; van Sluijs, E.M.; International Children’s Accelerometry Database (ICAD) Collaborators. Prevalence and correlates of screen time in youth: An international perspective. Am. J. Prev. Med. 2014, 47, 803–807. [Google Scholar] [CrossRef] [PubMed] [Green Version]
- Sleddens, sF.; Gerards, S.M.; Thijs, C.; De Vries, N.K.; Kremers, S.P. General parenting, childhood overweight and obesity-inducing behaviors: A review. Int. J. Pediatr. Obes. 2011, 6, 12–27. [Google Scholar] [CrossRef] [PubMed]
- Verloigne, M.; Van Lippevelde, W.; Maes, L.; Brug, J.; De Bourdeaudhuij, I. Family-and school-based correlates of energy balance-related behaviours in 10–12-year-old children: A systematic review within the ENERGY (EuropeaN Energy balance Research to prevent excessive weight Gain among Youth) project. Public Health Nutr. 2012, 15, 1380–1395. [Google Scholar] [CrossRef] [PubMed]
- Aggio, D.; Smith, L.; Fisher, A.; Hamer, M. Mothers′ perceived proximity to green space is associated with TV viewing time in children: The Growing Up in Scotland study. Prev. Med. 2015, 70, 46–49. [Google Scholar] [CrossRef] [PubMed] [Green Version]
- Gorely, T.; Marshall, S.J.; Biddle, S.J. Couch kids: Correlates of television viewing among youth. Int. J. Behav. Med. 2004, 11, 152–163. [Google Scholar] [CrossRef] [PubMed]
- Dennison, B.A.; Erb, T.A.; Jenkins, P.L. Television viewing and television in bedroom associated with overweight risk among low-income preschool children. Pediatrics. 2002, 109, 1028–1035. [Google Scholar] [CrossRef] [PubMed]
- Kourlaba, G.; Kondaki, K.; Liarigkovinos, T.; Manios, Y. Factors associated with television viewing time in toddlers and preschoolers in Greece: The GENESIS study. J. Public Health 2009, 31, 222–230. [Google Scholar] [CrossRef] [PubMed]
- Pate, R.R.; Mitchell, J.A.; Byun, W.; Dowda, M. Sedentary behaviour in youth. Br. J. Sports Med. 2011, 45, 906–913. [Google Scholar] [CrossRef] [PubMed]
- Vandewater, E.A.; Bickham, D.S.; Lee, J.H.; Cummings, H.M.; Wartella, E.A.; Rideout, V.J. When the television is always on: Heavy television exposure and young children’s development. Am. Behav Sci. 2005, 48, 562–577. [Google Scholar] [CrossRef]
- Te Velde, S.J.; Van Der Horst, K.; Oenema, A.; Timperio, A.; Crawford, D.; Brug, J. Parental and home influences on adolescents’ TV viewing: A mediation analysis. Int. J. Pediatr. Obes. 2011, 6, 364–372. [Google Scholar] [CrossRef] [PubMed]
- Salmon, J.; Timperio, A.; Telford, A.; Carver, A.; Crawford, D. Association of family environment with children′s television viewing and with low level of physical activity. Obes. Res. 2005, 13, 1939–1951. [Google Scholar] [CrossRef] [PubMed]
- Minges, K.E.; Owen, N.; Salmon, J.; Chao, A.; Dunstan, D.W.; Whittemore, R. Reducing youth screen time: Qualitative metasynthesis of findings on barriers and facilitators. Health Psychol. 2015, 34, 381. [Google Scholar] [CrossRef] [PubMed]
- Pocock, M.; Trivedi, D.; Wills, W.; Bunn, F.; Magnusson, J. Parental perceptions regarding healthy behaviours for preventing overweight and obesity in young children: A systematic review of qualitative studies. Obes. Rev. 2010, 11, 338–353. [Google Scholar] [CrossRef] [PubMed]
- Solomon-Moore, E.; Matthews, J.; Reid, T.; Toumpakari, Z.; Sebire, S.J.; Thompson, J.L.; Lawlor, D.A.; Jago, R. Examining the challenges posed to parents by the contemporary screen environments of children: A qualitative investigation. BMC Pediatr. 2018, 18, 129. [Google Scholar] [CrossRef] [PubMed]
- Davison, K.K.; Jago, R. Change in parent and peer support across ages 9 to 15 yr and adolescent girls’ physical activity. Med. Sci. Sports Exerc. 2009, 41, 1816. [Google Scholar] [CrossRef] [PubMed]
- Jago, R.; Davison, K.K.; Brockman, R.; Page, A.S.; Thompson, J.L.; Fox, K.R. Parenting styles, parenting practices, and physical activity in 10-to 11-year olds. Prev. Med. 2011, 52, 44–47. [Google Scholar] [CrossRef] [PubMed]
- Totland, T.H.; Bjelland, M.; Lien, N.; Bergh, I.H.; Gebremariam, M.K.; Grydeland, M.; Ommundsen, Y.; Andersen, L.F. Adolescents’ prospective screen time by gender and parental education, the mediation of parental influences. Int. J. Behav. Nutr. Phy. 2013, 10, 89. [Google Scholar] [CrossRef] [PubMed] [Green Version]
- Prince, S.; Reed, J.; McFetridge, C.; Tremblay, M.; Reid, R. Correlates of sedentary behaviour in adults: A systematic review. Obes. Rev. 2017, 18, 915–935. [Google Scholar] [CrossRef] [PubMed]
- Atkinson, K.; Lowe, S.; Moore, S. Human development, occupational structure and physical inactivity among 47 low and middle income countries. Prev. Med. Rep. 2016, 3, 40–45. [Google Scholar] [CrossRef] [PubMed]
- Manios, Y.; Androutsos, O.; Lambrinou, C.P.; Cardon, G.; Lindstrom, J.; Annemans, L.; Mateo-Gallego, R.; de Sabata, M.S.; Iotova, V.; Kivela, J.; et al. A school- and community-based intervention to promote healthy lifestyle and prevent type 2 diabetes in vulnerable families across Europe: Design and implementation of the Feel4Diabetes-study. J. Public Health Nutr. 2018. [Google Scholar] [CrossRef] [PubMed]
- De Craemer, M.; Lateva, M.; Iotova, V.; De Decker, E.; Verloigne, M.; De Bourdeaudhuij, I.; Androutsos, O.; Socha, P.; Kulaga, Z.; Moreno, L.; et al. Differences in energy balance-related behaviours in European preschool children: The ToyBox-study. PLoS ONE 2015, 10, e0118303. [Google Scholar] [CrossRef] [PubMed] [Green Version]
- IBM Corp. IBM SPSS Statistics for Windows, Version 25.0; IBM Corp.: Armonk, NY, USA, 2017. [Google Scholar]
- Maas, C.J.; Hox, J.J. Sufficient sample sizes for multilevel modeling. Methodology. 2005, 1, 86–92. [Google Scholar] [CrossRef]
- Charlton, C.; Rasbash, J.; Browne, W.; Healy, M.; Cameron, B. MLwiN Version 3.00; Centre for Multilevel Modelling, University of Bristol: Bristol, UK, 2017. [Google Scholar]
- Morrison, M.; Krugman, D.M. A look at mass and computer mediated technologies: Understanding the roles of television and computers in the home. J. Broadcast. Electron. Media 2001, 45, 135–161. [Google Scholar] [CrossRef]
- Wartella, E.; Rideout, V.; Lauricella, A.R.; Connell, S. Parenting in the Age of Digital Technology. Report for the Center on Media and Human Development School of Communication Northwestern University. 2013. Available online: https://cmhd.northwestern.edu/events/parenting-in-the-age-of-digital-technology/ (accessed on 20 November 2018).
- Coyne, S.M.; Padilla-Walker, L.M.; Fraser, A.M.; Fellows, K.; Day, R.D. “Media Time = Family Time” Positive Media Use in Families with Adolescents. J. Adolesc. Res. 2014, 29, 663–688. [Google Scholar] [CrossRef]
- Morgan, P.J.; Lubans, D.R.; Callister, R.; Okely, A.D.; Burrows, T.L.; Fletcher, R.; Collins, C.E. The ‘Healthy Dads, Healthy Kids’ randomized controlled trial: Efficacy of a healthy lifestyle program for overweight fathers and their children. Int. J. Obes. 2011, 35, 436–447. [Google Scholar] [CrossRef] [PubMed]
- Morgan, P.J.; Collins, C.E.; Plotnikoff, R.C.; Callister, R.; Burrows, T.; Fletcher, R.; Okely, A.D.; Young, M.D.; Miller, A.; Lloyd, A.B. The ‘Healthy Dads, Healthy Kids’ community randomized controlled trial: A community-based healthy lifestyle program for fathers and their children. Prev. Med. 2014, 61, 90–99. [Google Scholar] [CrossRef] [PubMed]
- Verloigne, M.; Van Lippevelde, W.; Bere, E.; Manios, Y.; Kovacs, E.; Grillenberger, M.; Maes, L.; Brug, J.; De Bourdeaudhuij, I. Individual and family environmental correlates of television and computer time in 10- to 12-year-old European children: The ENERGY-project. BMC Public Health 2015, 15, 912. [Google Scholar] [CrossRef] [PubMed] [Green Version]
- Atkin, A.J.; Gorely, T.; Clemes, S.A.; Yates, T.; Edwardson, C.; Brage, S.; Salmon, J.; Marshall, S.J.; Biddle, S.J. Methods of measurement in epidemiology: Sedentary behaviour. Int. J. Epidemiol. 2012, 41, 1460–1471. [Google Scholar] [CrossRef] [PubMed]


| Sample Characteristics | Parents | Children | ||||
|---|---|---|---|---|---|---|
| All Parents | Fathers | Mothers | All Children | Boys | Girls | |
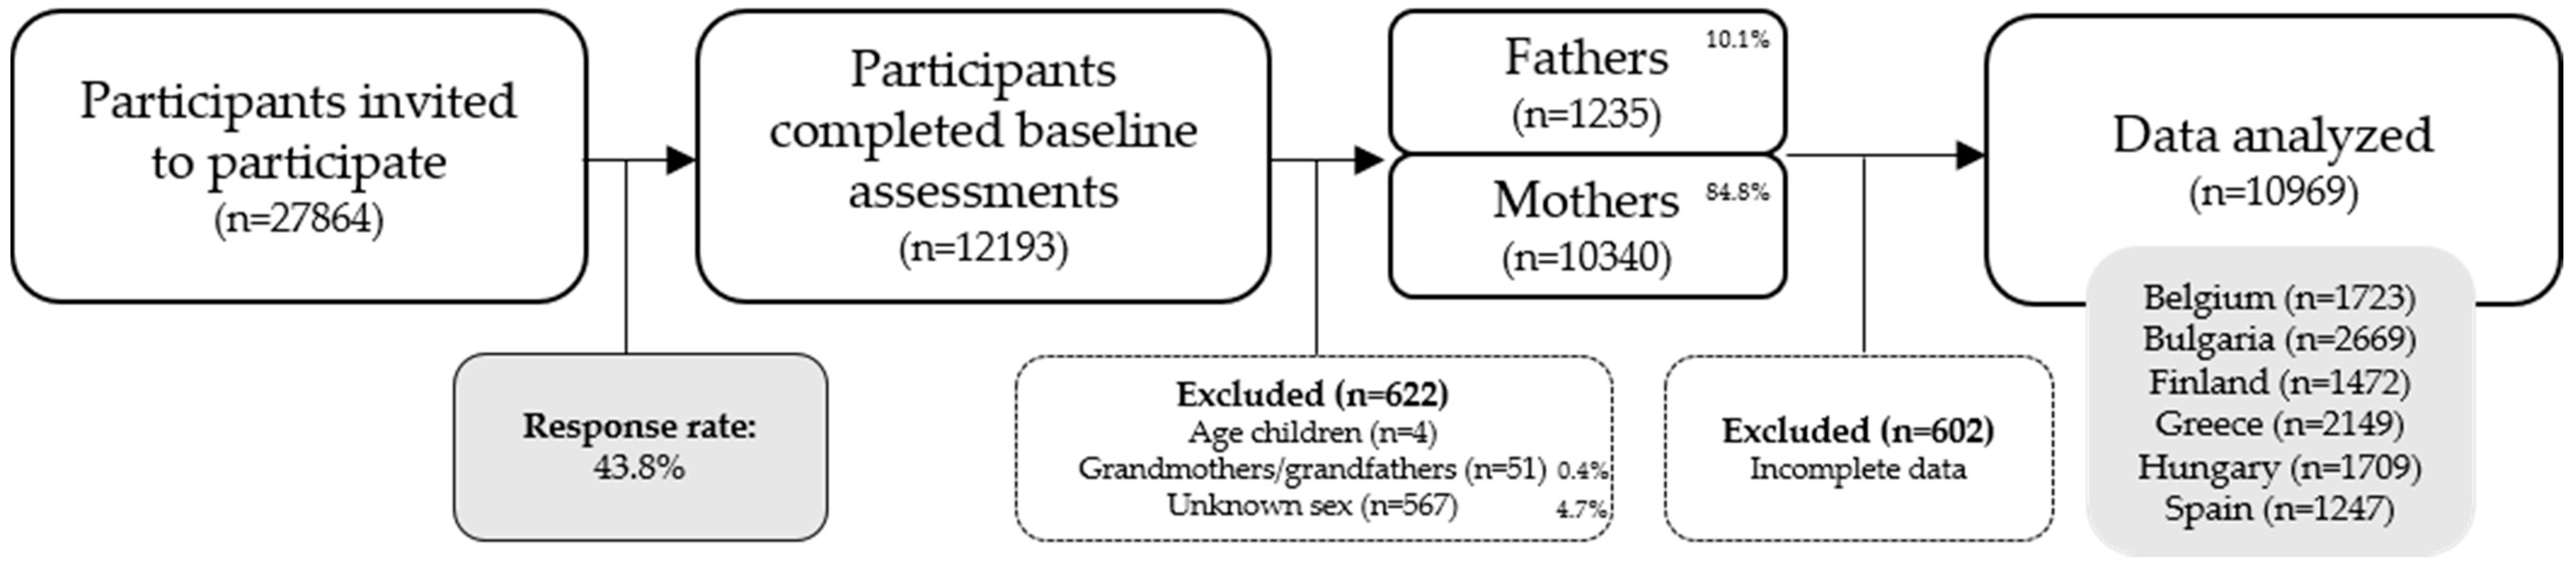
| n | 10,969 | 1183 | 9786 | 10,696 | 5380 | 5589 |
| Age, in years (SD) | 40.7 (5.3) | 43.6 (5.9) | 40.3 (5.1) | 8.2 (1.0) | 8.2 (1.0) | 8.2 (1.0) |
| Sex, % | 100 | 10.8 | 89.2 | 100 | 49.0 | 51.0 |
| BMI a, in kg/m² (SD) | 24.4 (4.6) | 27.1 (3.9) | 24.0 (4.6) | 17.3 (2.8) | 17.3 (2.8) | 17.3 (2.9) |
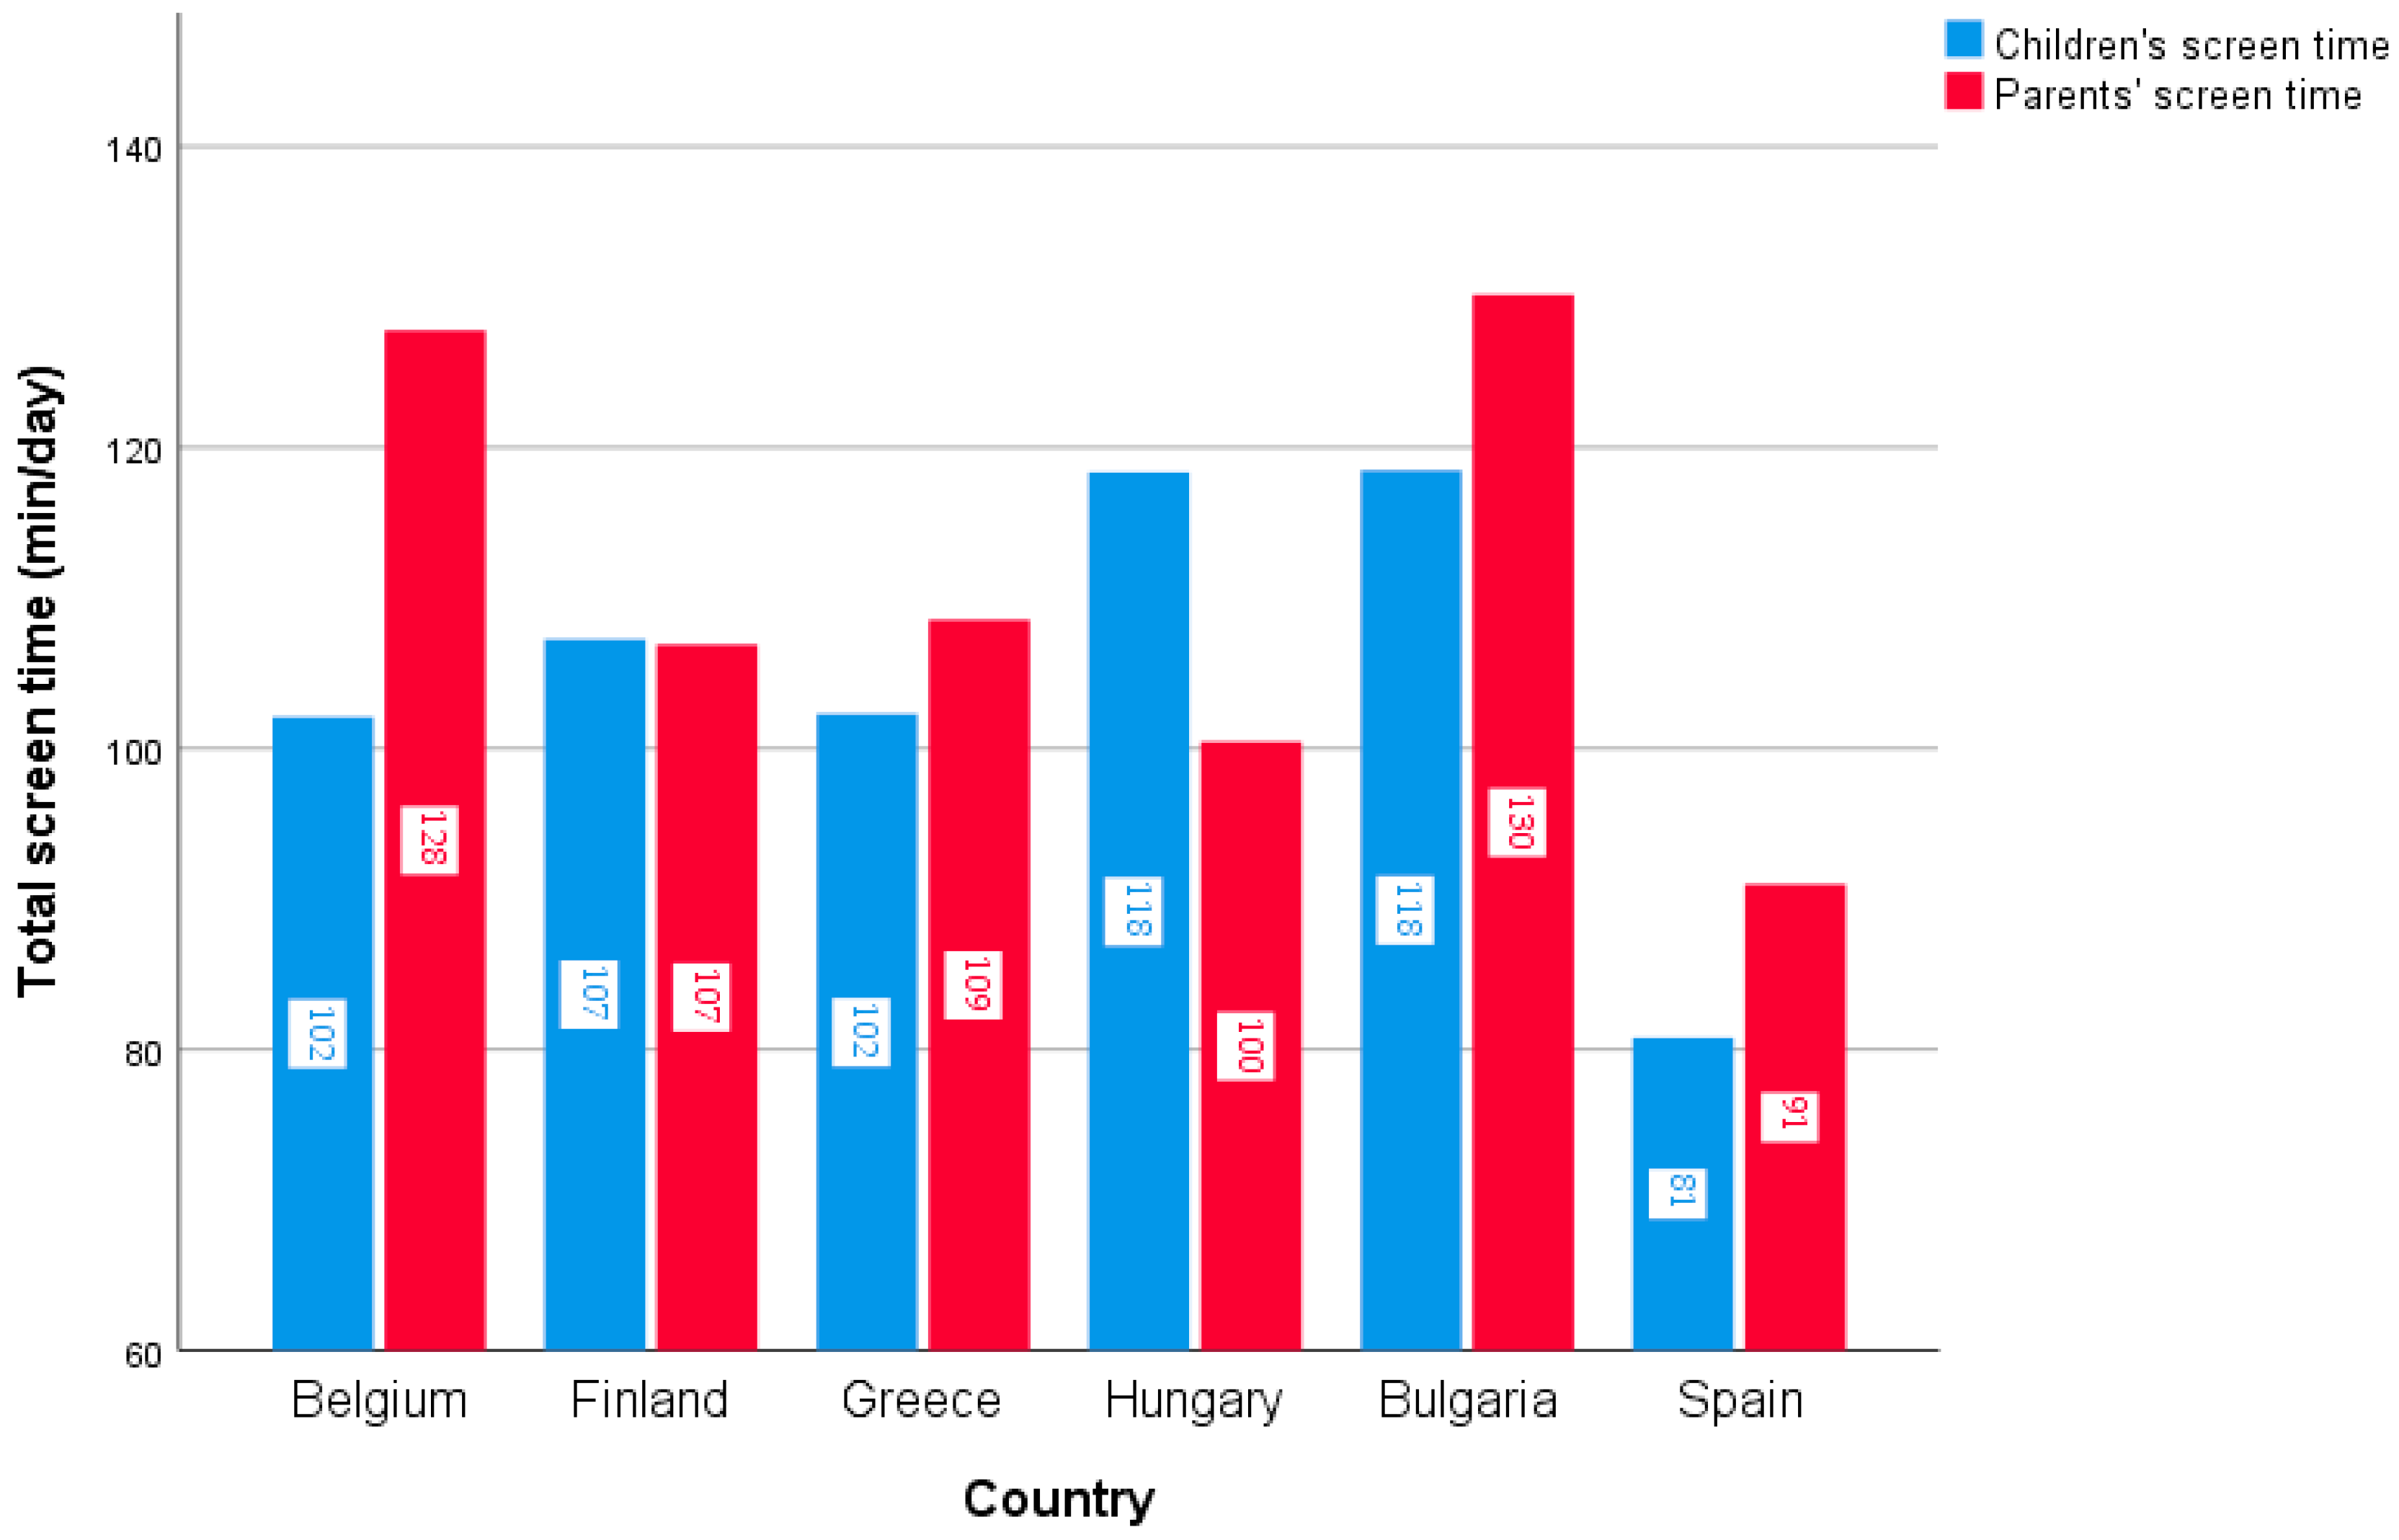
| Screen time, in min/day (SD) | 113.3 (80.7) | 132.2 (84.0) | 111.0 (80.0) | 106.9 (67.0) | 111.8 (67.8) | 102.3 (65.9) |
| Co-TV viewing, % (range) | Parent-child dyad | Father-child dyad | Mother-child dyad | Son-parent dyad | Daughter-parent dyad | |
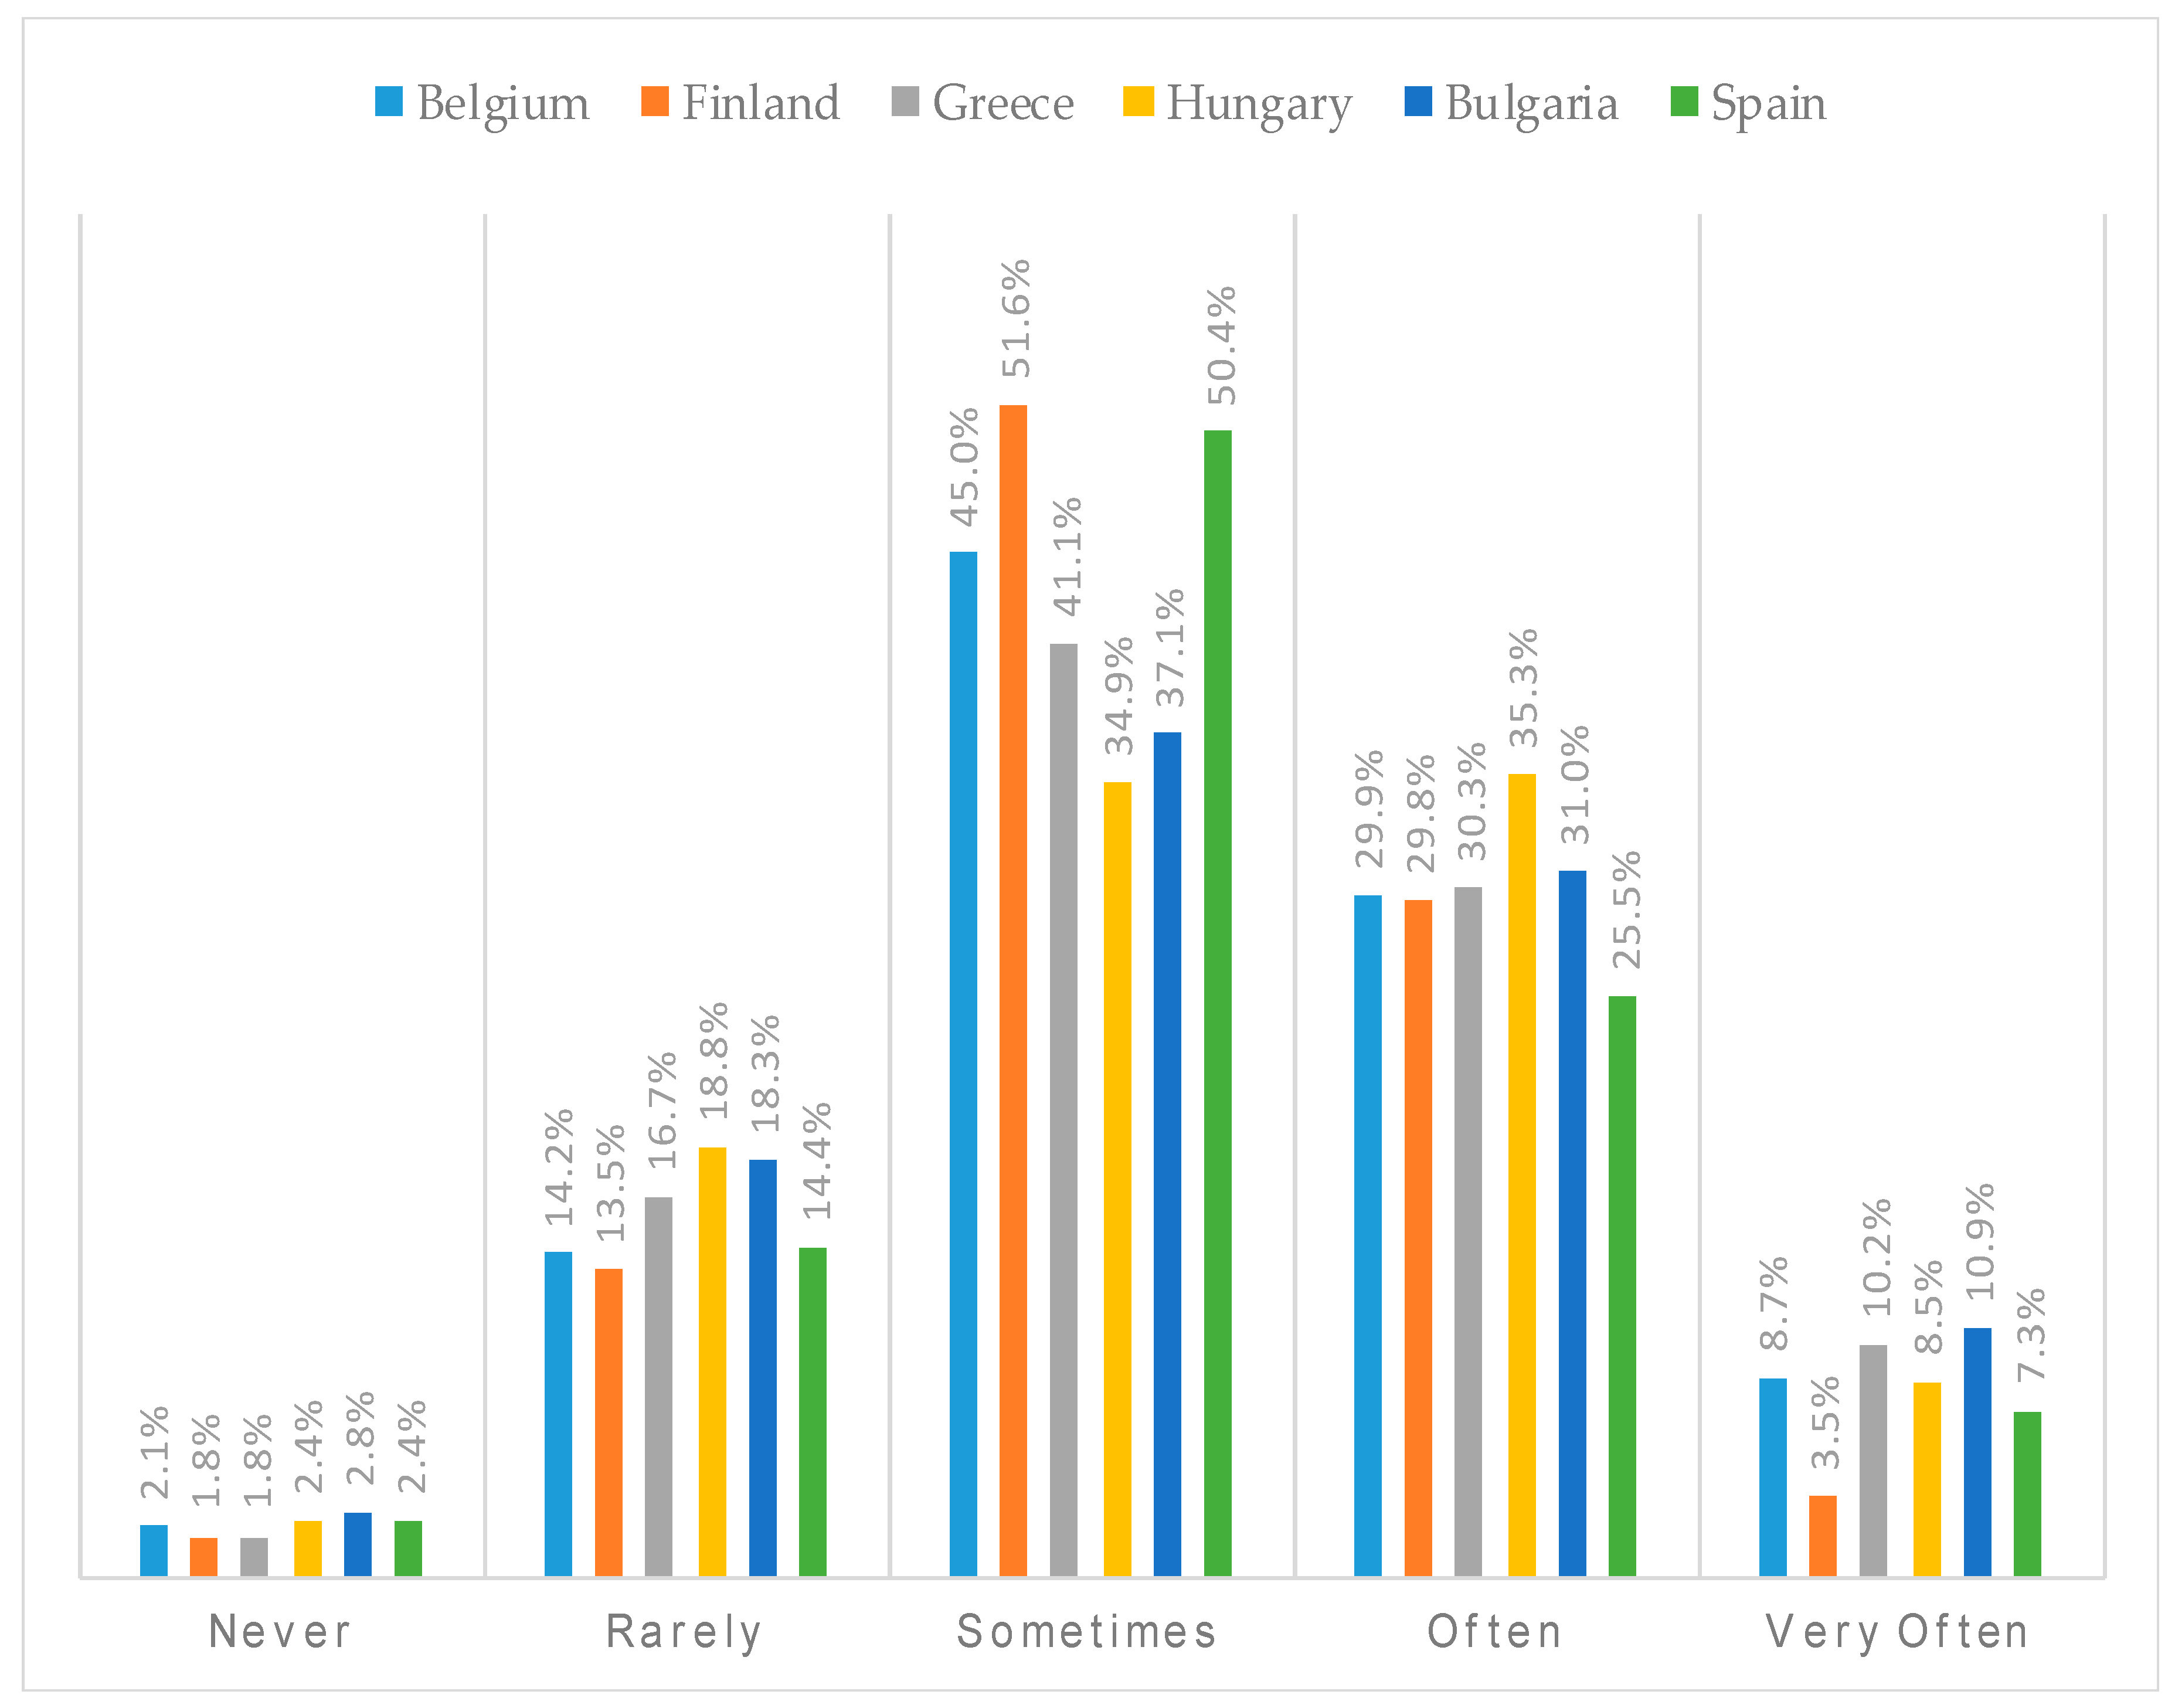
| Never | 2.2 (1.8–2.8) b | 2.0 (1.3–3.8) | 2.3 (1.8–2.5) | (see parent-child dyad) | 1.9 (1.4–2.6) | 2.6 (1.9–3.0) |
| Rarely | 16.3 (13.5–18.8) b | 14.0 (10.3–20.5) | 16.6 (13.9–18.7) | (see parent-child dyad) | 16.0 (11.2–18.8) | 16.6 (14.1–18.8) |
| Sometimes | 42.1 (34.9–51.6) b | 40.5 (24.6–53.7) | 42.4 (36.1–51.3) | (see parent-child dyad) | 42.9 (33.7–54.0) | 41.6 (36.0–49.2) |
| Often | 30.6 (25.5–35.5) b | 34.6 (30.3–43.9) | 30.1 (24.3–34.3) | (see parent-child dyad) | 30.8 (25.9–36.9) | 30.3 (25.1–33.8) |
| Very often | 8.6 (3.5–10.9) b | 8.9 (4.0–12.4) | 8.6 (3.4–11.0) | (see parent-child dyad) | 8.4 (3.4–10.4) | 8.9 (3.5–11.8) |
| Total (n = 9815) | Belgium (n = 1581) | Bulgaria (n = 2421) | Finland (n = 1168) | Greece (n = 1929) | Hungary (n = 1564) | Spain (n = 1152) | |
|---|---|---|---|---|---|---|---|
| Fixed Part | β (SE) | β (SE) | β (SE) | β (SE) | β (SE) | β (SE) | β (SE) |
| Intercept | 117.97 (3.31) | 114.65 (4.47) | 121.14 (6.50) | 126.26 (4.66) | 119.32 (4.66) | 140.53 (10.48) | 89.38 (4.95) |
| BMI child | 1.21 (0.24) *** | 2.30 (0.74) ** | 1.42 (0.47) ** | ns | ns | ns | 2.15 (0.64) ** |
| BMI parent | 0.33 (0.15) * | ns | ns | ns | 0.79 (0.32) * | ns | ns |
| Age child | 5.79 (0.71) *** | 5.70 (1.69) ** | 8.82 (1.58) *** | 10.60 (1.64) *** | ns | ns | ns |
| Age parent | −0.40 (0.13) ** | ns | ns | ns | ns | ns | ns |
| Sex child a | −10.37 (3.79) ** | −8.17 (2.95) ** | −9.33 (2.60) *** | −18.86 (3.01) *** | −11.98 (2.92) *** | ns | ns |
| Sex parent b | −8.78 (2.16) *** | −9.21 (4.46) * | ns | −10.85 (4.67) * | −12.72 (4.61) ** | ns | ns |
| PA level child | −3.33 (0.44) *** | ns | −4.05 (0.86) *** | −8.91 (1.24) *** | −3.32 (0.94) *** | ns | ns |
| PA level parent | 2.25 (0.33) *** | ns | 1.87 (0.68) ** | ns | ns | 3.99 (0.98) *** | ns |
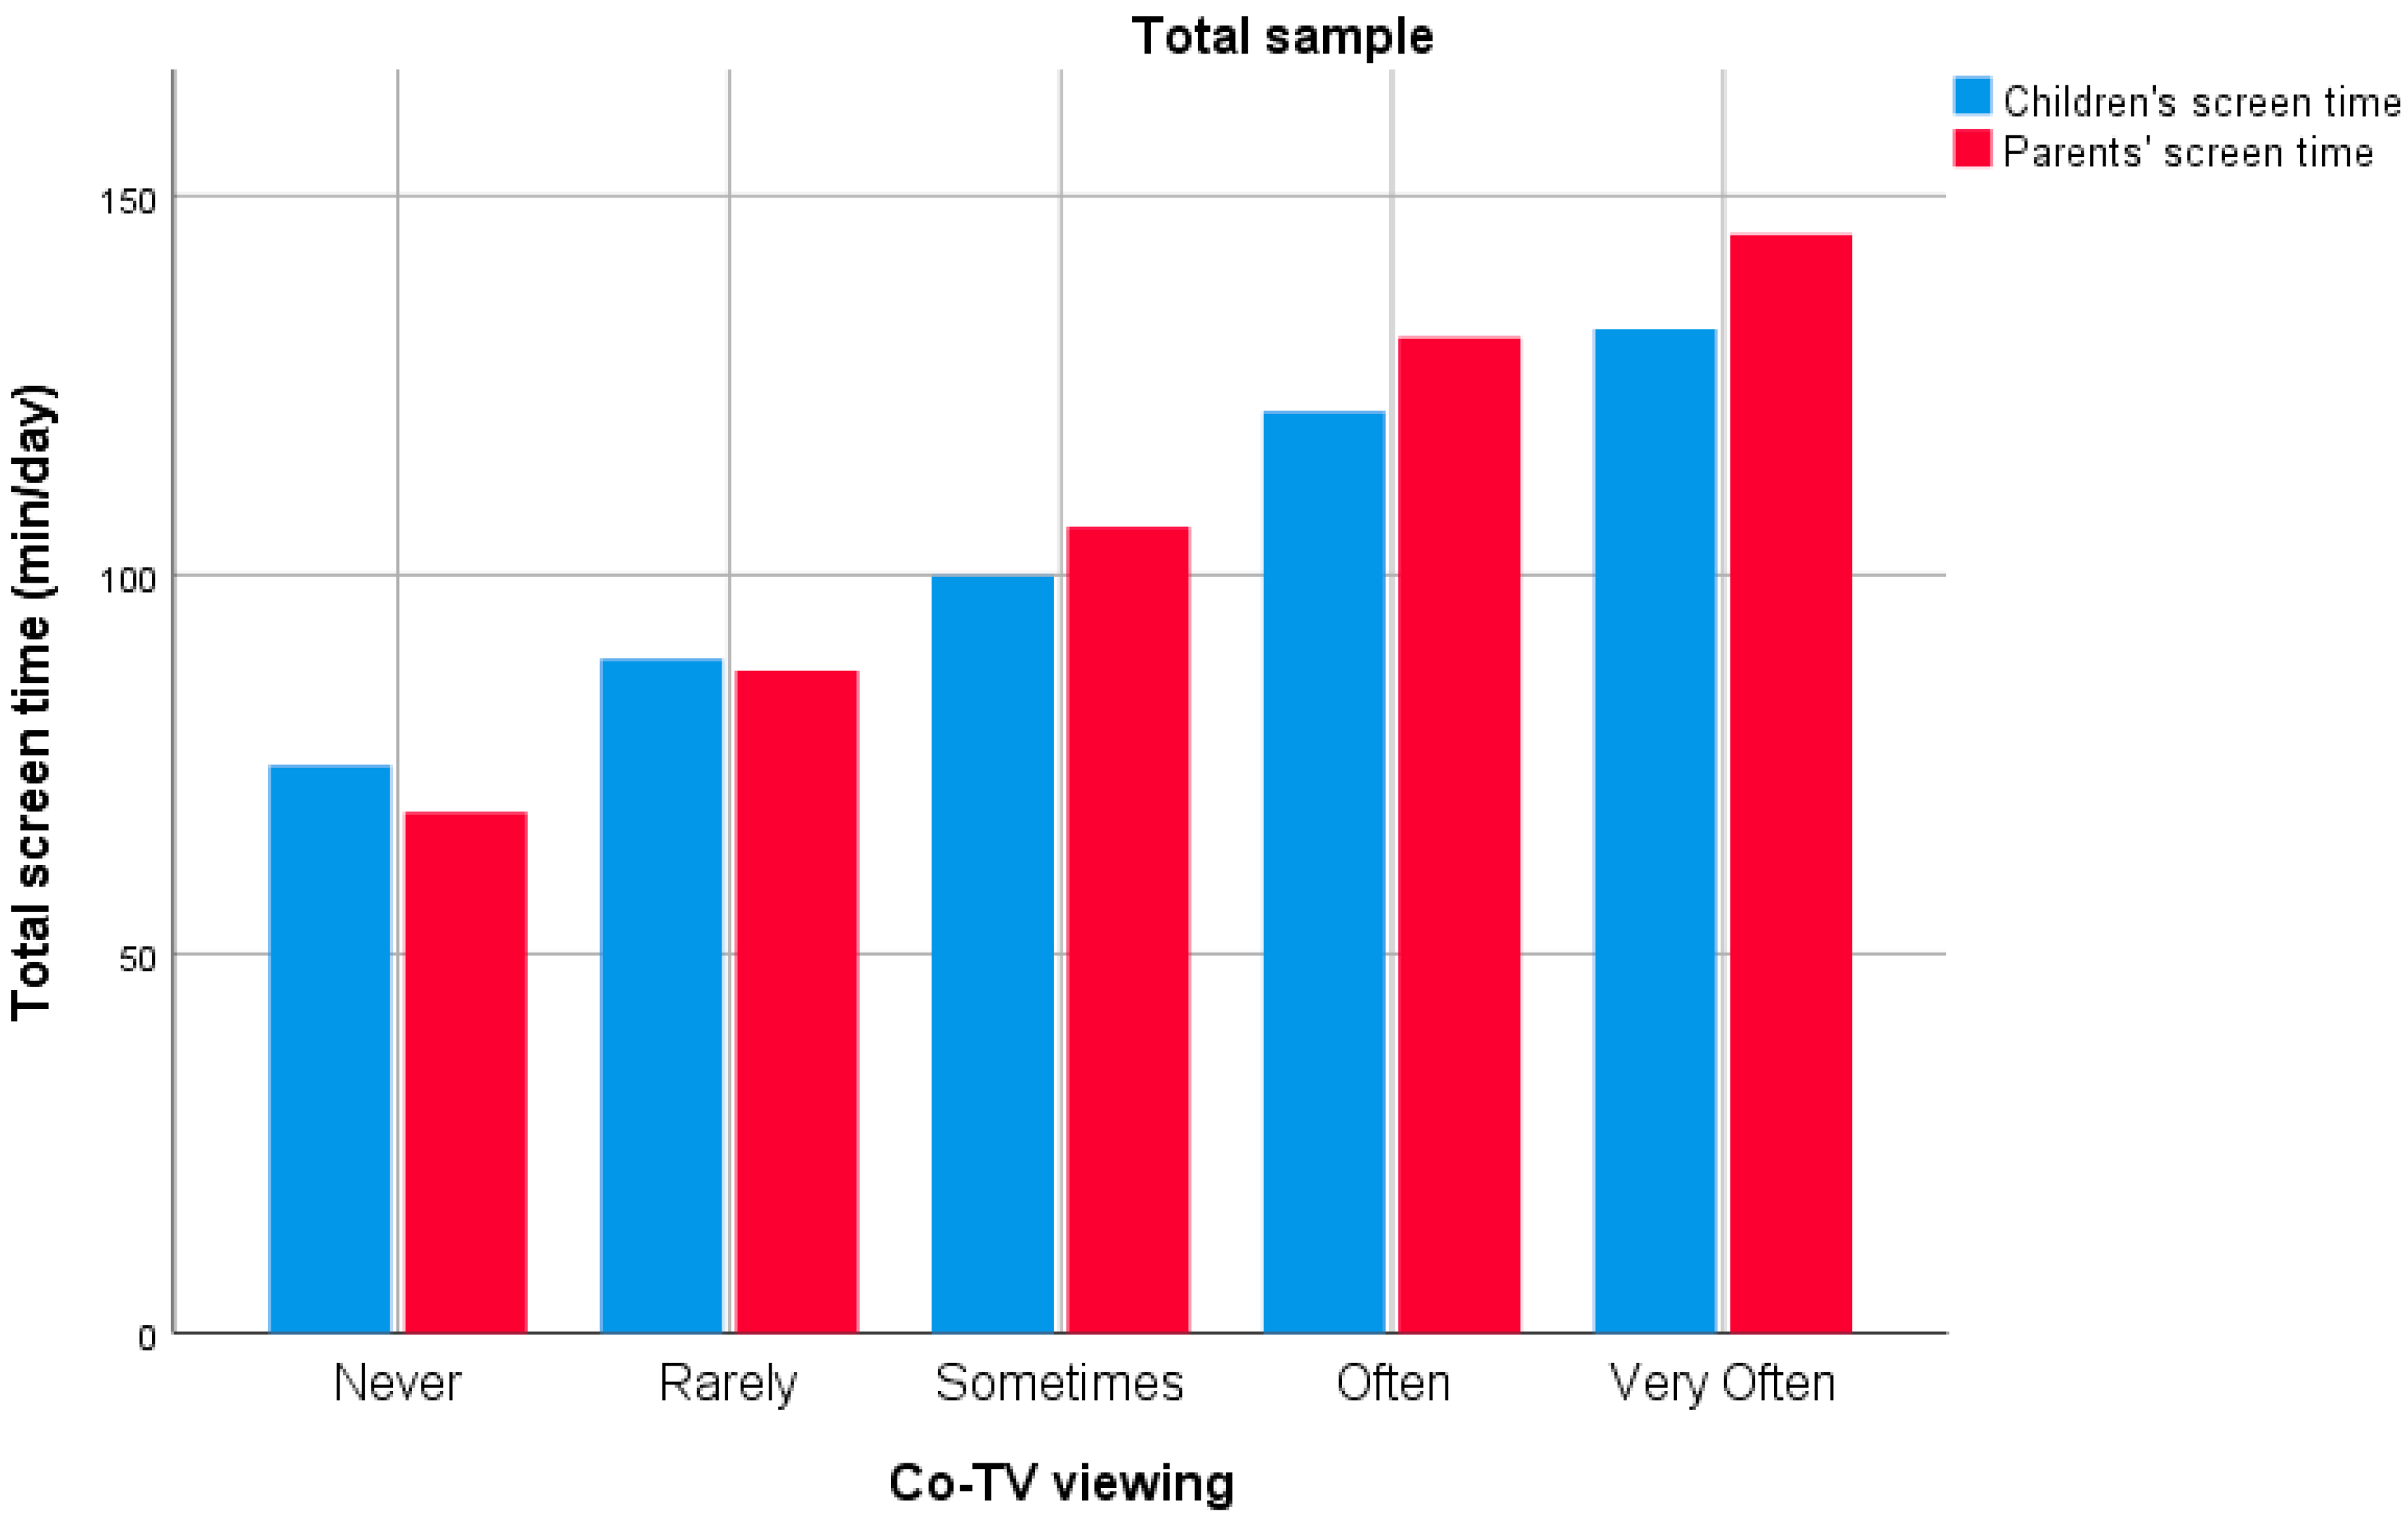
| Co-TV viewing | 11.85 (3.69) *** | 19.51 (5.98) ** | ns | ns | ns | 28.46 (9.34) ** | 25.90 (8.24) ** |
| Co-TV viewing * Sex child | ns | ns | ns | ns | ns | ns | ns |
| Co-TV viewing * Sex parent | ns | ns | ns | ns | 20.29 (6.70) ** | ns | ns |
| Stratified analysis c | |||||||
| Father-child dyads (n = 250) | - | - | - | - | ns | - | - |
| Mother-child dyads (n = 1679) | - | - | - | - | 14.19 (2.40) *** | - | - |
| Co-TV viewing * Sex child * Sex parent | ns | ns | ns | ns | ns | 26.00 (12.72) * | ns |
| Stratified analysis c | |||||||
| Son-father dyads (n = 84) | - | - | - | - | - | 33.09 (10.75) ** | - |
| Son-mother dyads (n = 667) | - | - | - | - | - | 18.18 (3.17) *** | |
| Daughter-father dyads (n = 74) | - | - | - | - | - | ns | - |
| Daughter-mother dyads (n = 739) | - | - | - | - | - | 22.94 (2.94) *** | - |
| Random part | σ2 (SE) | σ2 (SE) | σ2 (SE) | σ2 (SE) | σ2 (SE) | σ2 (SE) | σ2 (SE) |
| Country-level variance | 160.01 (37.28) *** | - | - | - | - | - | - |
| School-level variance | 0.00 (0.00) d | 64.07 (34.96) | 179.98 (72.77) * | 16.99 (20.07) | 32.00 (32.30) | 927.95 (390.41) * | 53.07 (36.07) |
| Class-level variance | 523.47 (214.20) * | 0.00 (0.00) d | 34.64 (40.45) | 0.00 (0.00) d | 81.16 (61.81) | 192.93 (80.44) * | 82.68 (57.01) |
| Individual-level variance | 3421.80 (217.64) *** | 3314.11 (119.81) *** | 3989.45 (120.05) *** | 2572.06 (107.45) *** | 3902.99 (134.92) *** | 5054.01 (187.23) *** | 2382.68 (108.62) *** |
| Total (n = 9830) | Belgium (n = 1588) | Bulgaria (n = 2420) | Finland (n = 1165) | Greece (n = 1931) | Hungary (n = 1568) | Spain (n = 1158) | |
|---|---|---|---|---|---|---|---|
| Fixed Part | β (SE) | β (SE) | β (SE) | β (SE) | β (SE) | β (SE) | β (SE) |
| Intercept | 130.35 (3.92) | 139.14 (5.64) | 145.12 (7.64) | 124.11 (5.01) | 139.82 (6.06) | 125.40 (6.79) | 107.45 (6.51) |
| BMI child | −0.64 (0.29) * | ns | ns | ns | ns | ns | ns |
| BMI parent | 1.28 (0.18) *** | 1.40 (0.50) ** | 1.06 (0.41) * | 1.85 (0.38) *** | 2.10 (0.42) *** | ns | 1.49 (0.49) ** |
| Age child | ns | ns | ns | ns | ns | ns | ns |
| Age parent | −0.94 (0.16) *** | ns | ns | −1.30 (0.33) *** | −0.80 (0.38) * | ns | 2.33 (2.28) *** |
| Sex child a | ns | ns | ns | ns | ns | ns | ns |
| Sex parent b | −22.11 (2.62) *** | −12.32 (5.82) * | ns | −20.21 (5.13) *** | −35.48 (6.02) *** | −27.36 (6.43) *** | −21.40 (6.61) ** |
| PA level child | ns | ns | ns | −3.86 (1.37) ** | ns | ns | 4.98 (1.40) *** |
| PA level parent | −0.97 (0.40) * | ns | ns | −2.45 (0.96) * | −1.98 (0.89) * | ns | ns |
| Co-TV viewing | 14.47 (4.43) ** | 16.33 (7.81) * | ns | 20.11 (8.41) * | ns | 39.18 (9.38) *** | ns |
| Co-TV viewing * Sex parent | ns | ns | ns | ns | 23.31 (8.76) ** | ns | ns |
| Stratified analysis c | |||||||
| Father-child dyads (n = 250) | - | - | - | - | ns | - | - |
| Mother-child dyads (n = 1681) | - | - | - | - | 18.89 (3.12) *** | - | - |
| Co-TV viewing * Sex child | ns | ns | ns | ns | ns | -36.66 (12.19) ** | ns |
| Stratified analysis c | |||||||
| Parent-son dyads (n = 753) | - | - | - | - | - | 40.44 (9.66) *** | - |
| Parent-daughter dyads (n = 815) | - | - | - | - | - | ns | - |
| Co-TV viewing * Sex parent * Sex child | ns | ns | ns | ns | ns | 37.19 (12.88) ** | ns |
| Stratified analysis c | |||||||
| Father – son dyads (n = 84) | - | - | - | - | - | 40.44 (9.66) *** | - |
| Father – daughter dyads (n = 73) | - | - | - | - | - | ns | - |
| Mother – son dyads (n = 669) | - | - | - | - | - | 28.72 (3.11) *** | - |
| Mother – daughter dyads (n = 742) | - | - | - | - | - | 27.20 (2.87) *** | - |
| Random part | σ2 (SE) | σ2 (SE) | σ2 (SE) | σ2 (SE) | σ2 (SE) | σ2 (SE) | σ2 (SE) |
| Country-level variance | 214.40 (51.03) *** | - | - | - | - | - | |
| School-level variance | 0.00 (0.00) d | 4.17 (34.71) | 42.57 (35.21) | 0.00 (0.00) d | 51.20 (52.11) | 59.59 (49.03) | 0.00 (0.00) d |
| Class-level variance | 846.67 (315.13) ** | 0.00 (0.00) d | 94.51 (73.52) | 0.00 (0.00) d | 79.18 (99.87) | 119.88 (69.54) | 0.00 (0.00) d |
| Individual-level variance | 4990.77 (319.73) *** | 5730.31 (206.16) *** | 6915.43 (208.17) *** | 3115.73 (129.10) *** | 6721.43 (231.96) *** | 5152.52 (190.49) *** | 4705.76 (195.57) *** |
© 2018 by the authors. Licensee MDPI, Basel, Switzerland. This article is an open access article distributed under the terms and conditions of the Creative Commons Attribution (CC BY) license (http://creativecommons.org/licenses/by/4.0/).
Share and Cite
Latomme, J.; Van Stappen, V.; Cardon, G.; Morgan, P.J.; Lateva, M.; Chakarova, N.; Kivelä, J.; Lindström, J.; Androutsos, O.; González-Gil, E.M.; et al. The Association between Children’s and Parents’ Co-TV Viewing and Their Total Screen Time in Six European Countries: Cross-Sectional Data from the Feel4diabetes-Study. Int. J. Environ. Res. Public Health 2018, 15, 2599. https://doi.org/10.3390/ijerph15112599
Latomme J, Van Stappen V, Cardon G, Morgan PJ, Lateva M, Chakarova N, Kivelä J, Lindström J, Androutsos O, González-Gil EM, et al. The Association between Children’s and Parents’ Co-TV Viewing and Their Total Screen Time in Six European Countries: Cross-Sectional Data from the Feel4diabetes-Study. International Journal of Environmental Research and Public Health. 2018; 15(11):2599. https://doi.org/10.3390/ijerph15112599
Chicago/Turabian StyleLatomme, Julie, Vicky Van Stappen, Greet Cardon, Philip J. Morgan, Mina Lateva, Nevena Chakarova, Jemina Kivelä, Jaana Lindström, Odysseas Androutsos, Esther M. González-Gil, and et al. 2018. "The Association between Children’s and Parents’ Co-TV Viewing and Their Total Screen Time in Six European Countries: Cross-Sectional Data from the Feel4diabetes-Study" International Journal of Environmental Research and Public Health 15, no. 11: 2599. https://doi.org/10.3390/ijerph15112599