Short-Term Effects of Ambient Air Pollution on Hospitalization for Respiratory Disease in Taiyuan, China: A Time-Series Analysis

 ,
,  , , ,
, , ,
Abstract
:1. Introduction
2. Materials and Methods
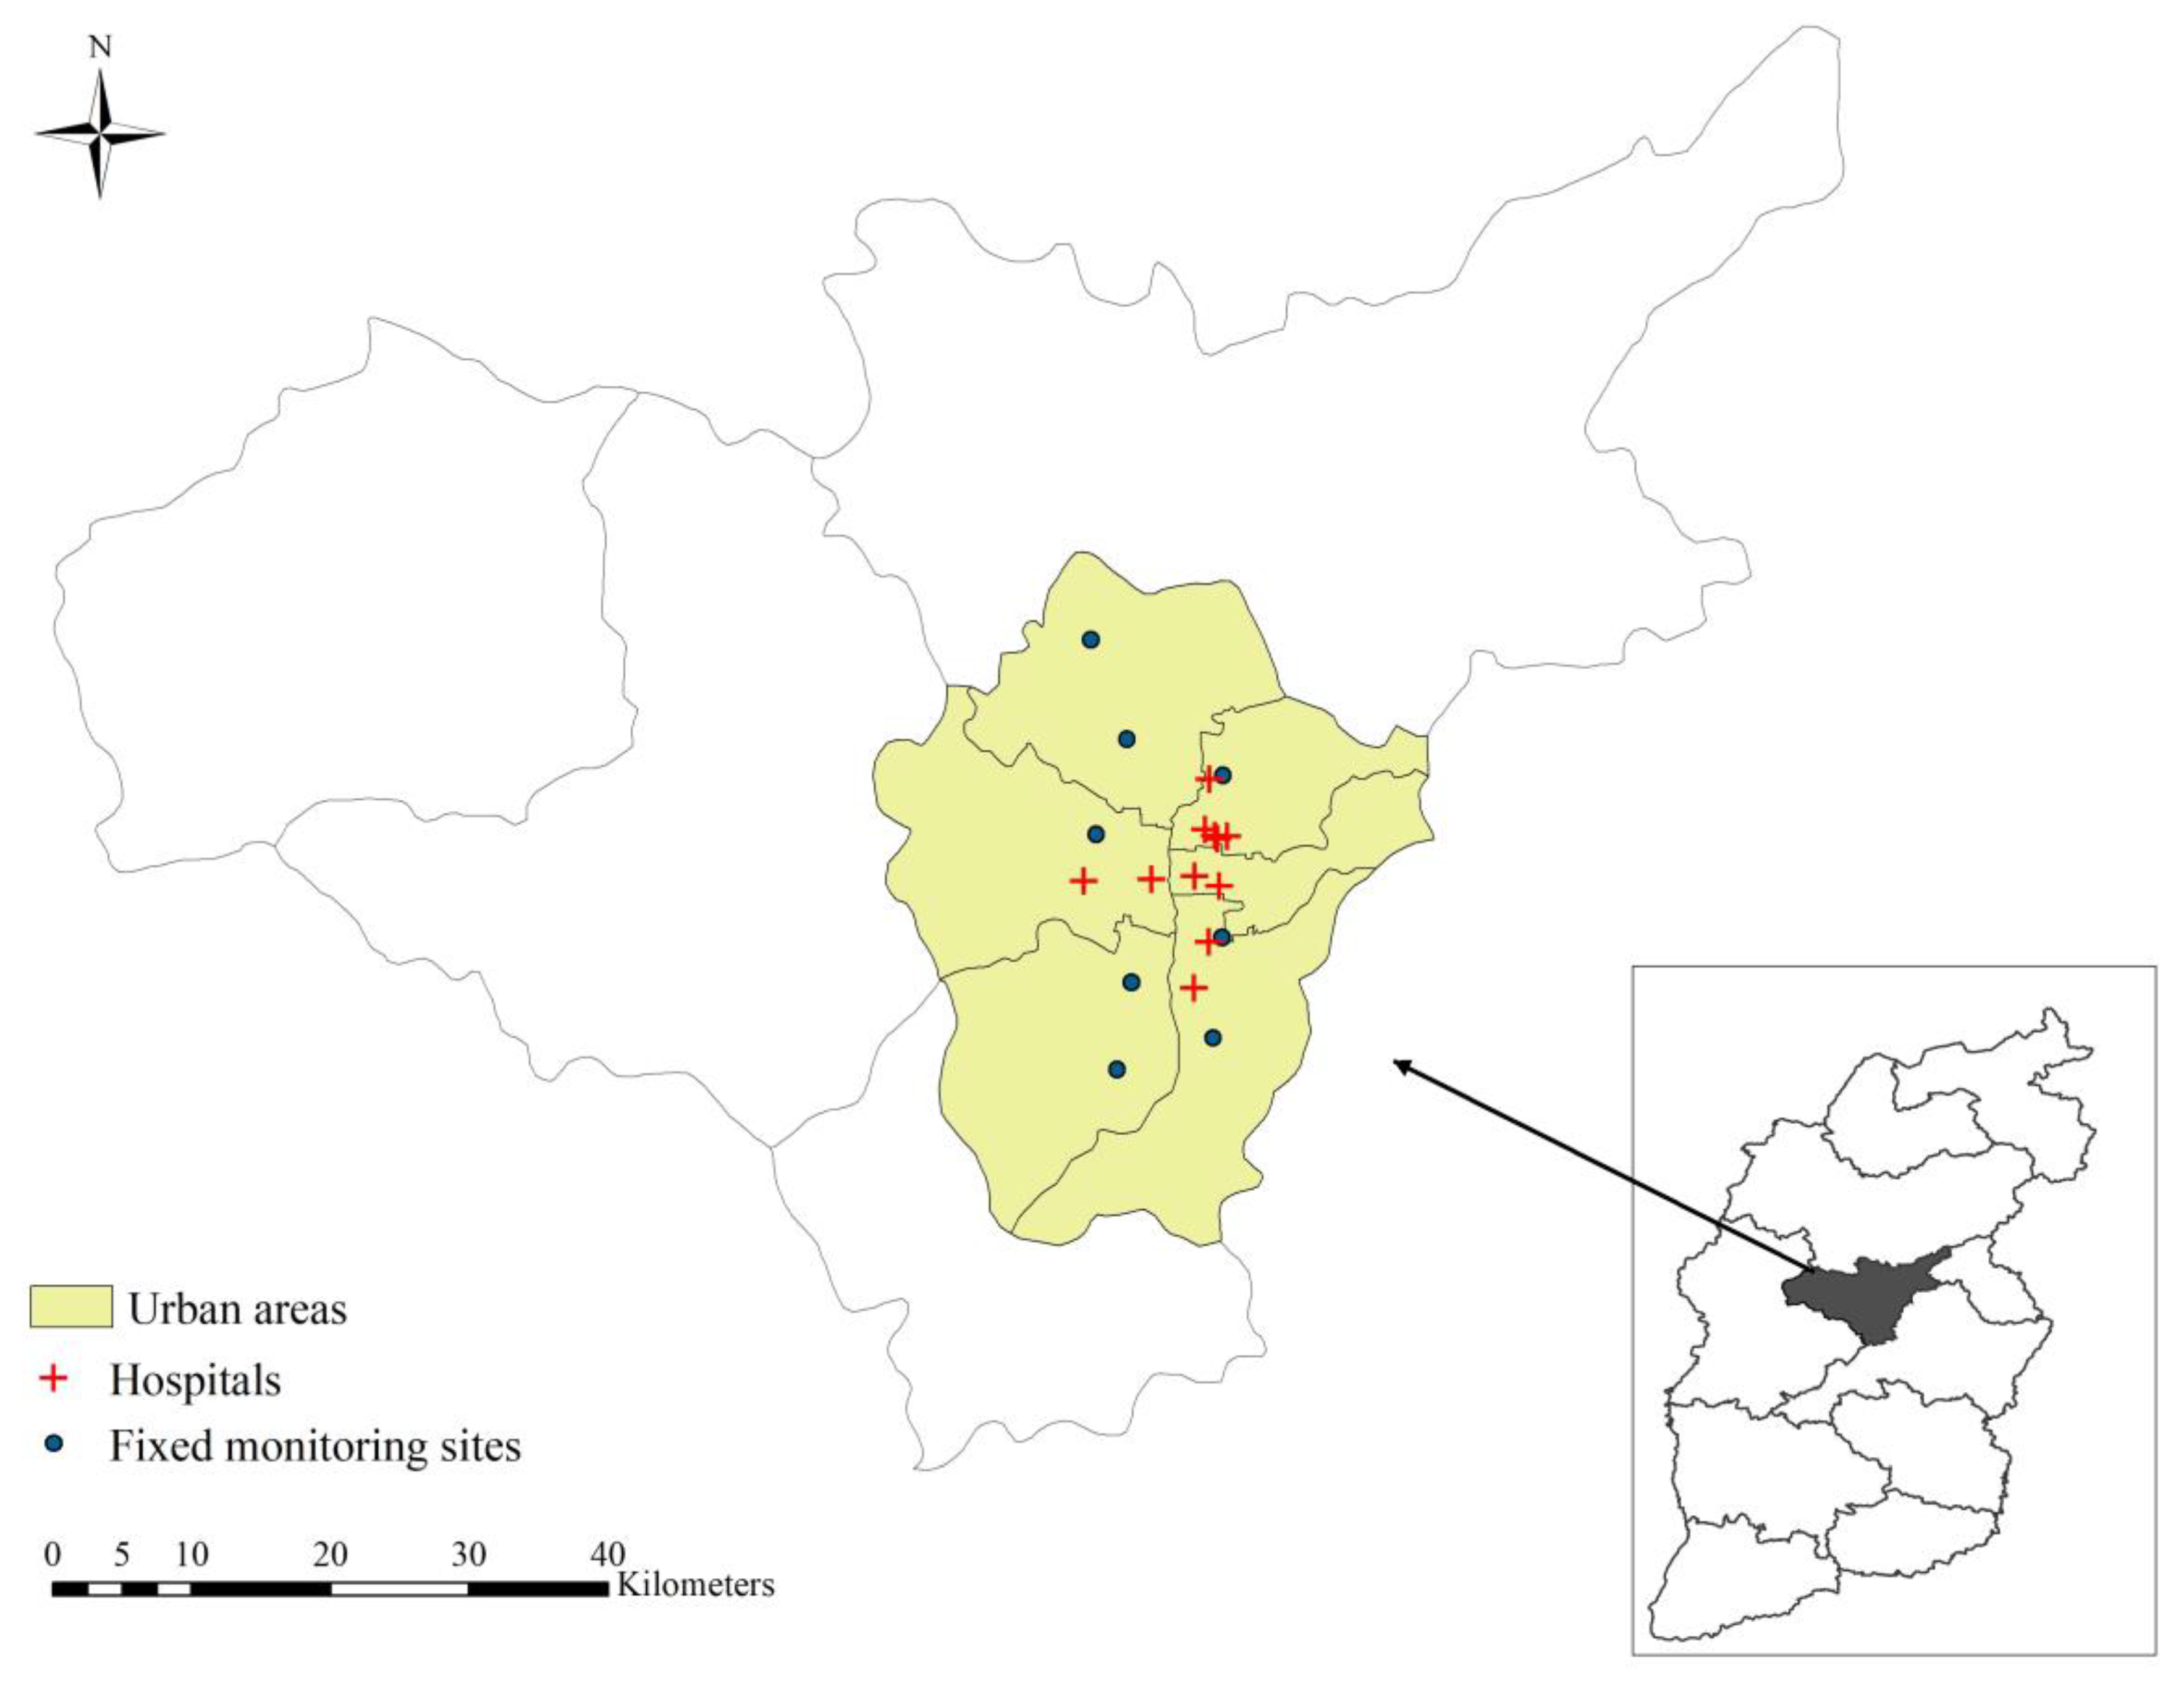
2.1. Study Area
2.2. Air Pollution and Meteorology Data
2.3. Hospitalization of Respiratory Disease
2.4. Data Analysis
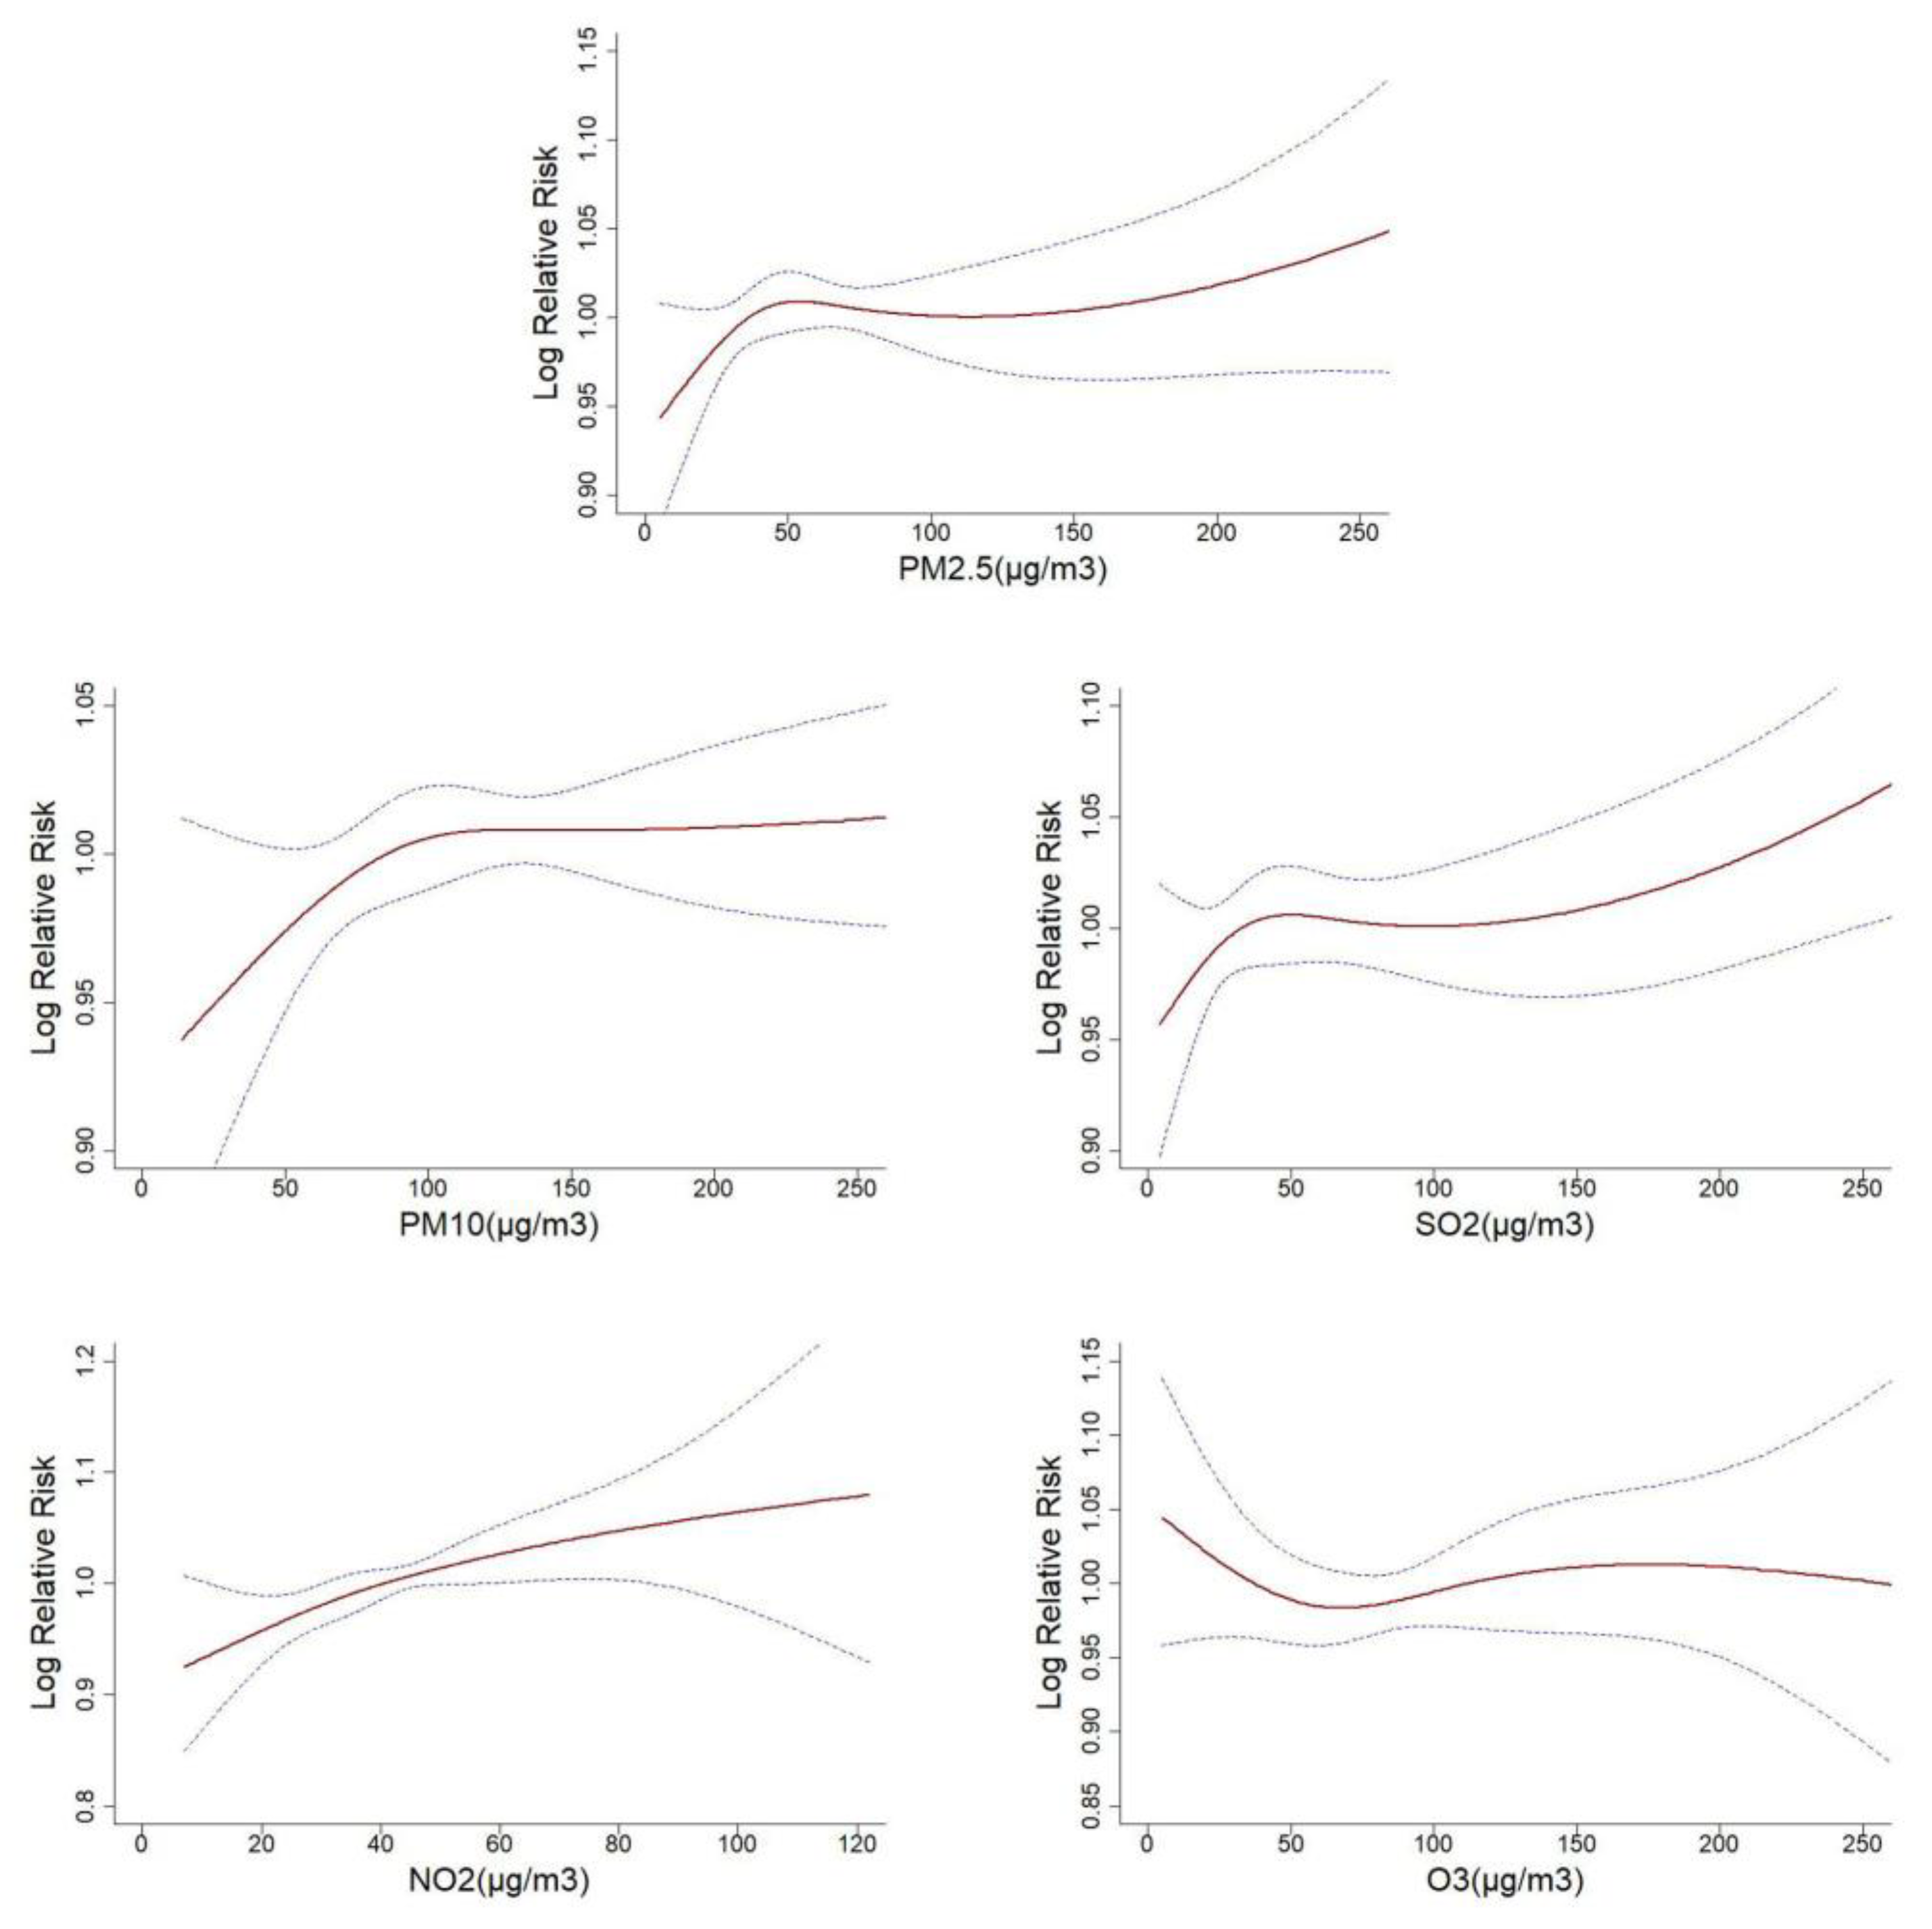
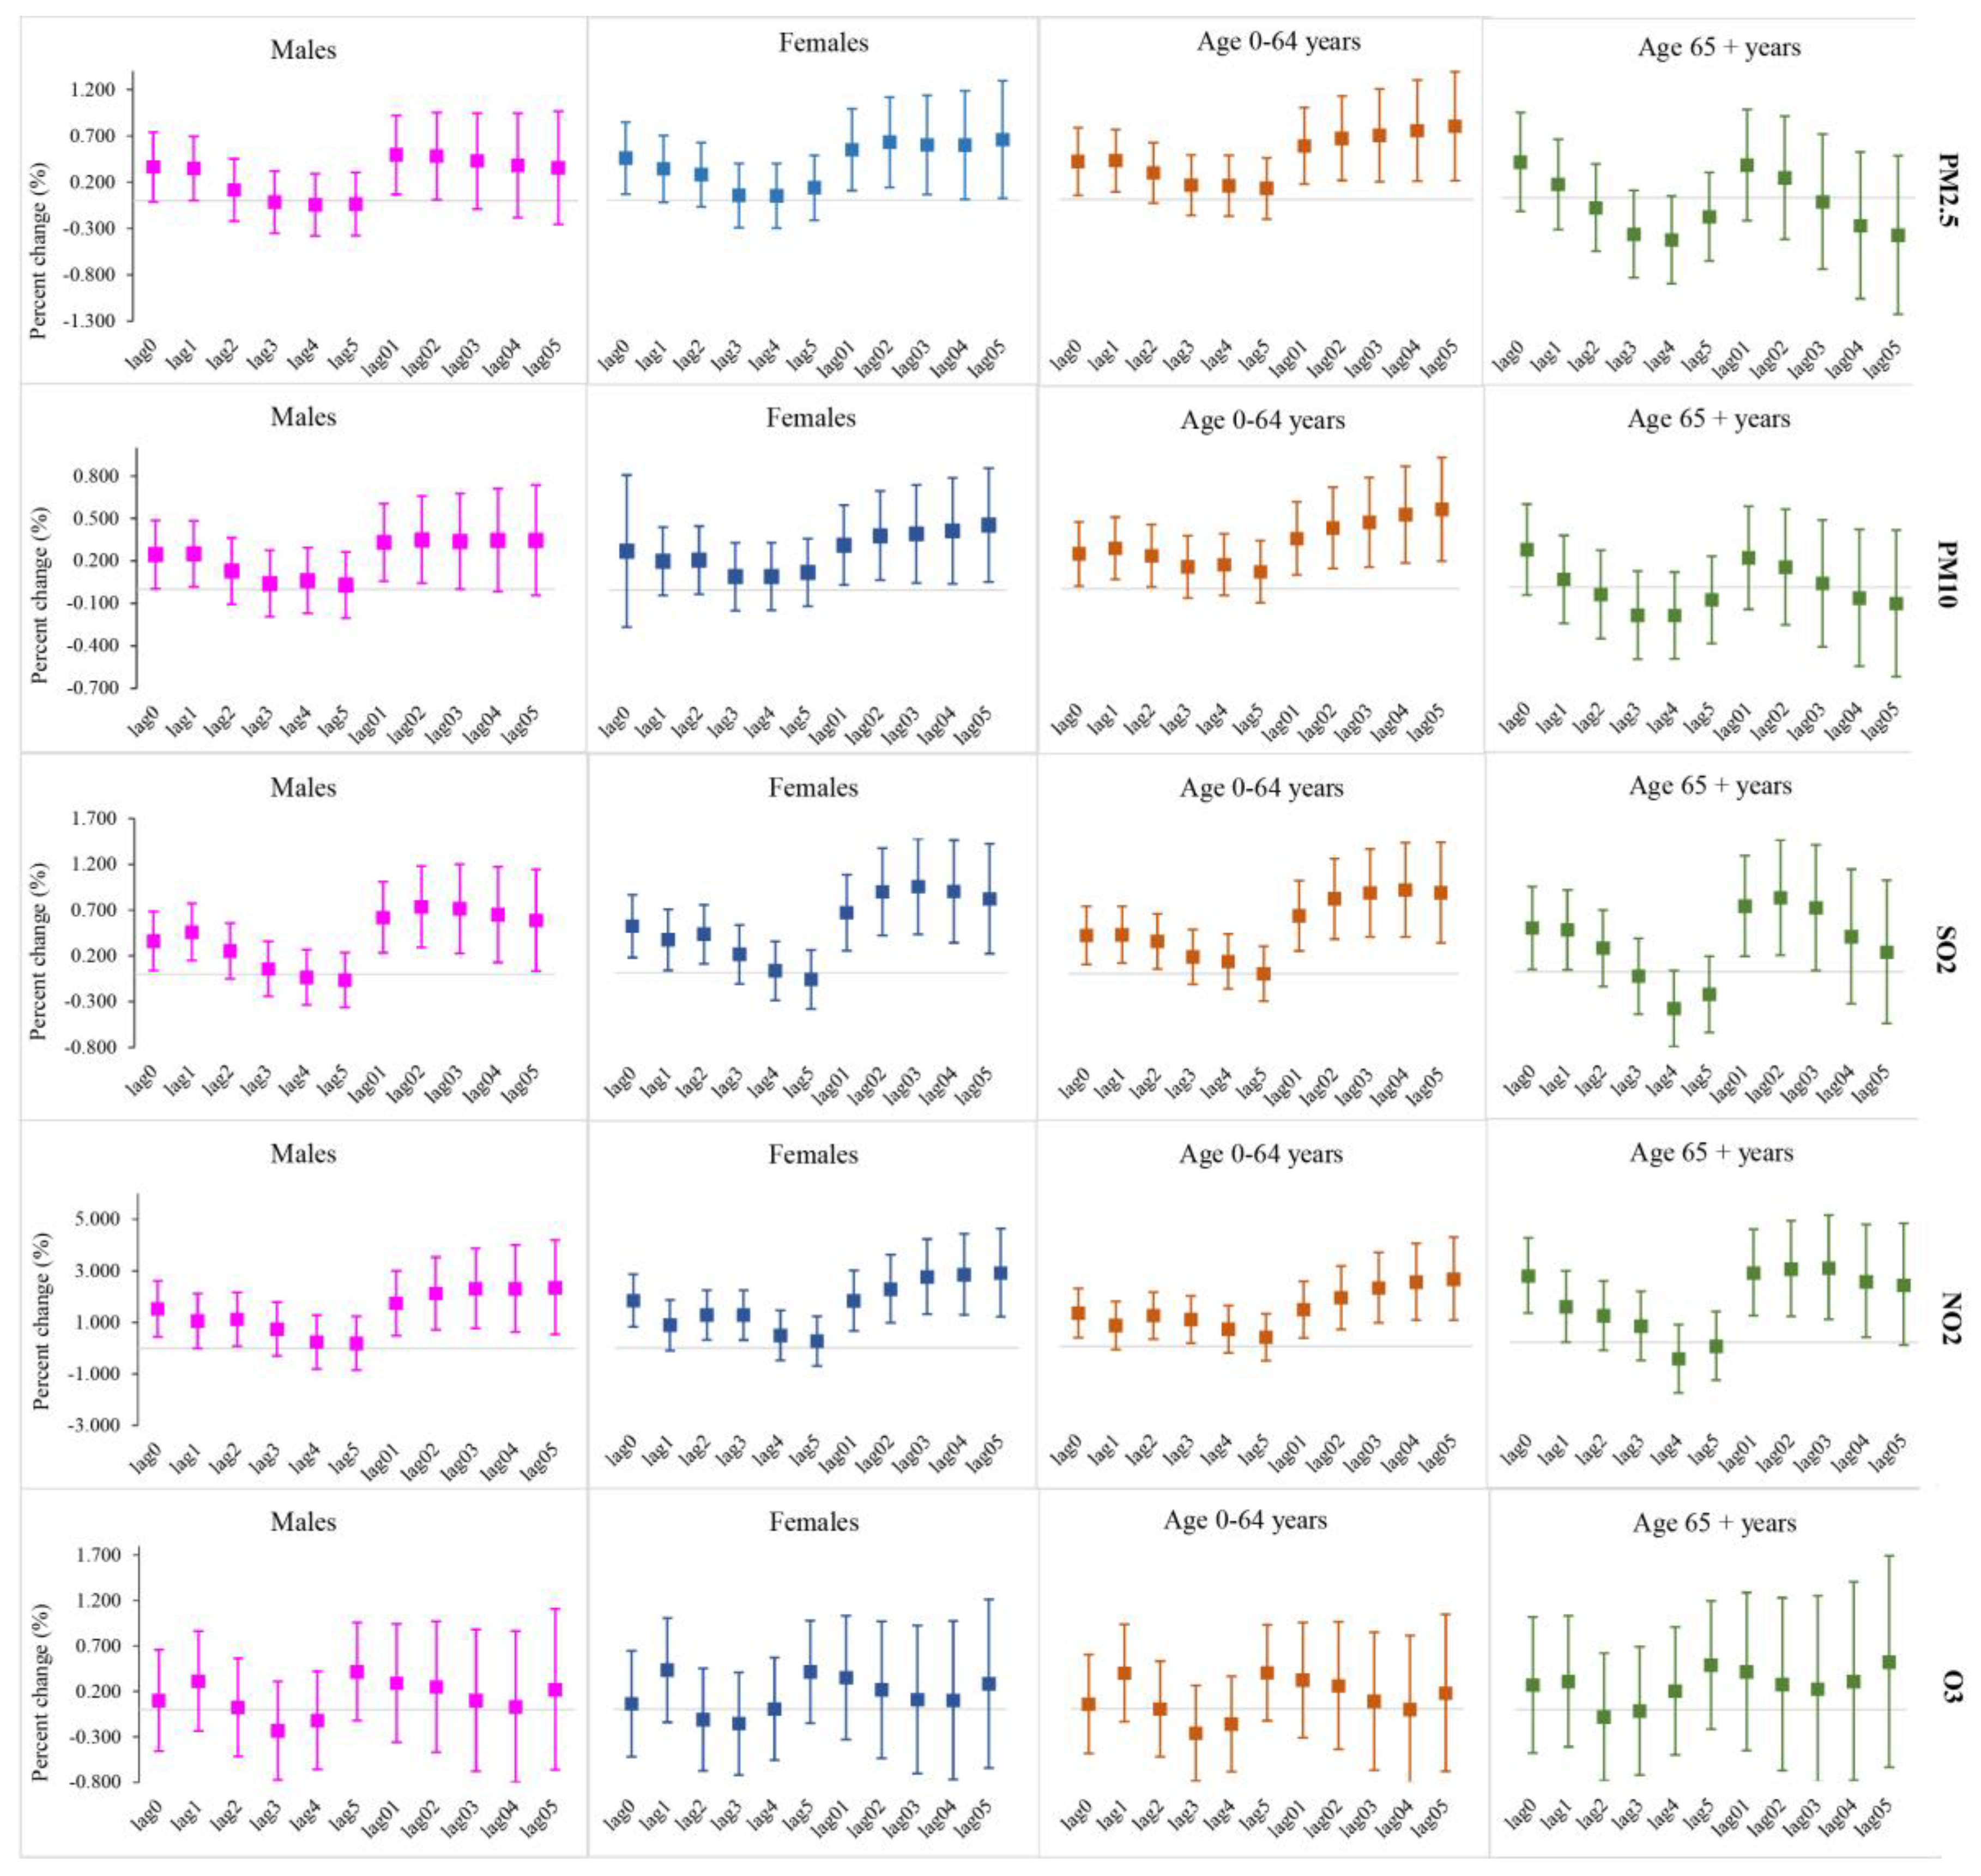
3. Results
4. Discussion
5. Conclusions
Supplementary Materials
Author Contributions
Funding
Acknowledgments
Conflicts of Interest
References
- Naghavi, M.; Abajobir, A.A.; Abbafati, C.; Abbas, K.M.; Abd-Allah, F.; Abera, S.F.; Aboyans, V.; Adetokunboh, O.; Afshin, A.; Agrawal, A.; et al. Global, regional, and national age-sex specific mortality for 264 causes of death, 1980–2016: A systematic analysis for the Global Burden of Disease Study 2016. Lancet 2017, 390, 1151–1210. [Google Scholar] [CrossRef]
- Hay, S.I.; Abajobir, A.A.; Abate, K.H.; Abbafati, C.; Abbas, K.M.; Abd-Allah, F.; Abdulkader, R.S.; Abdulle, A.M.; Abebo, T.A.; Abera, SF.; et al. Global, regional, and national disability-adjusted life-years (DALYs) for 333 diseases and injuries and healthy life expectancy (HALE) for 195 countries and territories, 1990–2016: A systematic analysis for the Global Burden of Disease Study 2016. Lancet 2017, 390, 1260–1344. [Google Scholar] [CrossRef]
- Gakidou, E.; Afshin, A.; Abajobir, A.A.; Abate, K.H.; Abbafati, C.; Abbas, K.M.; Abd-Allah, F.; Abdulle, A.M.; Abera, S.F.; Aboyans, V.; et al. Global, regional, and national comparative risk assessment of 84 behavioural, environmental and occupational, and metabolic risks or clusters of risks, 1990–2016: A systematic analysis for the Global Burden of Disease Study 2016. Lancet 2017, 390, 1345–1422. [Google Scholar] [CrossRef]
- Liu, H.; Tian, Y.; Xiang, X.; Sun, K.; Juan, J.; Song, J.; Cao, Y.; Xu, B.; Hu, Y. Air Pollution and Hospitalization for Acute Myocardial Infarction in China. Am. J. Cardiol. 2017, 120, 753–758. [Google Scholar] [CrossRef] [PubMed]
- Ren, M.; Li, N.; Wang, Z.; Liu, Y.; Chen, X.; Chu, Y.; Li, X.; Zhu, Z.; Tian, L.; Xiang, H. The short-term effects of air pollutants on respiratory disease mortality in Wuhan, China: Comparison of time-series and case-crossover analyses. Sci. Rep. 2017, 7, 40482. [Google Scholar] [CrossRef] [PubMed]
- Zhang, Y.; Peng, M.; Yu, C.; Zhang, L. Burden of mortality and years of life lost due to ambient PM10 pollution in Wuhan, China. Environ. Pollut. 2017, 230, 1073–1080. [Google Scholar] [CrossRef] [PubMed]
- Tian, Y.; Xiang, X.; Juan, J.; Sun, K.; Song, J.; Cao, Y.; Hu, Y. Fine particulate air pollution and hospital visits for asthma in Beijing, China. Environ. Pollut. 2017, 230, 227–233. [Google Scholar] [CrossRef] [PubMed]
- Wang, T.; Li, G.X.; Sun, J.; Buys, N.; Liu, H.M.; Liu, M.F.; Ni, M.; Li, B.W.; Liang, X.F.; Pan, X. Association between ambient particulate matter and daily cause-specific mortality in Tanggu, Tianjin Binhai New Area, China. Int. J. Environ. Health Res. 2013, 23, 205–214. [Google Scholar] [CrossRef] [PubMed]
- Tao, Y.; Mi, S.; Zhou, S.; Wang, S.; Xie, X. Air pollution and hospital admissions for respiratory diseases in Lanzhou, China. Environ. Pollut. 2014, 185, 196–201. [Google Scholar] [CrossRef] [PubMed]
- Chen, R.; Peng, R.D.; Meng, X.; Zhou, Z.; Chen, B.; Kan, H. Seasonal variation in the acute effect of particulate air pollution on mortality in the China Air Pollution and Health Effects Study (CAPES). Sci. Total Environ. 2013, 450–451, 259–265. [Google Scholar] [CrossRef] [PubMed]
- Tang, D.; Wang, C.; Nie, J.; Chen, R.; Niu, Q.; Kan, H.; Chen, B.; Perera, F. Health benefits of improving air quality in Taiyuan, China. Environ. Int. 2014, 73, 235–242. [Google Scholar] [CrossRef] [PubMed]
- Cao, L.; Geng, H.; Yao, C.; Zhao, L.; Duan, P.; Xuan, Y.; Li, H. Investigation of chemical compositions of atmospheric fine particles during a wintertime haze episode in Taiyuan City. China Environ. Sci. 2014, 4, 837–843. [Google Scholar]
- Han, F.; Cao, J.; Peng, L.; Bai, H.; Hu, D.; Mu, L.; Liu, X. Characteristics of hopanoid hydrocarbons in ambient PM10 and motor vehicle emissions and coal ash in Taiyuan, China. Environ. Geochem. Health 2015, 37, 813–829. [Google Scholar] [CrossRef] [PubMed]
- China National Environmental Monitoring Centre. Air Quality Report in the First Half of 2017. Available online: http://www.cnemc.cn/kqzlzkbgyb2092938.jhtml (accessed on 3 July 2017).
- Xiong, Q.; Zhao, W.; Gong, Z.; Zhao, W.; Tang, T. Fine Particulate Matter Pollution and Hospital Admissions for Respiratory Diseases in Beijing, China. Int. J. Environ. Res. Public Health 2015, 12, 11880–11892. [Google Scholar] [CrossRef] [PubMed] [Green Version]
- Rodopoulou, S.; Samoli, E.; Chalbot, M.G.; Kavouras, I.G. Air pollution and cardiovascular and respiratory emergency visits in Central Arkansas: A time-series analysis. Sci. Total Environ. 2015, 536, 872–879. [Google Scholar] [CrossRef] [PubMed] [Green Version]
- Burnett, R.T.; Smith-Doiron, M.; Stieb, D.; Cakmak, S.; Brook, J.R. Effects of particulate and gaseous air pollution on cardiorespiratory hospitalizations. Arch. Environ. Health 1999, 54, 130–139. [Google Scholar] [CrossRef] [PubMed]
- Zhu, J.; Zhang, X.; Zhang, X.; Dong, M.; Wu, J.; Dong, Y.; Chen, R.; Ding, X.; Huang, C.; Zhang, Q.; et al. The burden of ambient air pollution on years of life lost in Wuxi, China, 2012–2015: A time-series study using a distributed lag non-linear model. Environ. Pollut. 2017, 224, 689–697. [Google Scholar] [CrossRef] [PubMed]
- Ma, Y.; Zhang, H.; Zhao, Y.; Zhou, J.; Yang, S.; Zheng, X.; Wang, S. Short-term effects of air pollution on daily hospital admissions for cardiovascular diseases in western China. Environ. Sci. Pollut. Res. 2017, 24, 14071–14079. [Google Scholar] [CrossRef] [PubMed]
- Ma, Y.; Zhao, Y.; Yang, S.; Zhou, J.; Xin, J.; Wang, S.; Yang, D. Short-term effects of ambient air pollution on emergency room admissions due to cardiovascular causes in Beijing, China. Environ. Pollut. 2017, 230, 974–980. [Google Scholar] [CrossRef] [PubMed]
- Liu, P.; Wang, X.; Fan, J.; Xiao, W.; Wang, Y. Effects of Air Pollution on Hospital Emergency Room Visits for Respiratory Diseases: Urban-Suburban Differences in Eastern China. Int. J. Environ. Res. Public Health 2016, 13, 341. [Google Scholar] [CrossRef] [PubMed]
- Phung, D.; Thai, P.K.; Guo, Y.; Morawska, L.; Rutherford, S.; Chu, C. Ambient temperature and risk of cardiovascular hospitalization: An updated systematic review and meta-analysis. Sci. Total Environ. 2016, 550, 1084–1102. [Google Scholar] [CrossRef] [PubMed]
- Ma, W.; Chen, R.; Kan, H. Temperature-related mortality in 17 large Chinese cities: How heat and cold affect mortality in China. Environ. Res. 2014, 134, 127–133. [Google Scholar] [CrossRef] [PubMed]
- Pun, V.C.; Tian, L.; Yu, I.T.; Kioumourtzoglou, M.A.; Qiu, H. Differential distributed lag patterns of source-specific particulate matter on respiratory emergency hospitalizations. Environ. Sci. Technol. 2015, 49, 3830–3838. [Google Scholar] [CrossRef] [PubMed]
- Li, M.H.; Fan, L.C.; Mao, B.; Yang, J.W.; Choi, A.; Cao, W.J.; Xu, J.F. Short-term Exposure to Ambient Fine Particulate Matter Increases Hospitalizations and Mortality in COPD: A Systematic Review and Meta-analysis. Chest 2016, 149, 447–458. [Google Scholar] [CrossRef] [PubMed]
- Ouyang, F.; Liu, S.; Mao, J.; Zheng, Q.; Ma, T.; Hu, M. Relationship between air pollution and the number of pneumonia hospitalization in a children’s hospital in Changsha. Zhong Nan Da Xue Xue Bao Yi Xue Ban 2017, 42, 1417–1424. [Google Scholar] [PubMed]
- Burte, E.; Nadif, R.; Jacquemin, B. Susceptibility Factors Relevant for the Association Between Long-Term Air Pollution Exposure and Incident Asthma. Curr. Environ. Health Rep. 2016, 3, 23–39. [Google Scholar] [CrossRef] [PubMed] [Green Version]
- Zhu, R.; Chen, Y.; Wu, S.; Deng, F.; Liu, Y.; Yao, W. The relationship between particulate matter (PM10) and hospitalizations and mortality of chronic obstructive pulmonary disease: A meta-analysis. COPD 2013, 10, 307–315. [Google Scholar] [CrossRef] [PubMed]
- Li, Y.R.; Gibson, J.M. Health and air quality benefits of policies to reduce coal-fired power plant emissions: A case study in North Carolina. Environ. Sci. Technol. 2014, 48, 10019–10027. [Google Scholar] [CrossRef] [PubMed]
- Zhang, Z.; Wang, J.; Chen, L.; Chen, X.; Sun, G.; Zhong, N.; Kan, H.; Lu, W. Impact of haze and air pollution-related hazards on hospital admissions in Guangzhou, China. Environ. Sci. Pollut. Res. 2014, 21, 4236–4244. [Google Scholar] [CrossRef] [PubMed]
- Dong, G.H.; Zhang, P.; Sun, B.; Zhang, L.; Chen, X.; Ma, N.; Yu, F.; Guo, H.; Huang, H.; Lee, Y.L.; et al. Long-term exposure to ambient air pollution and respiratory disease mortality in Shenyang, China: A 12-year population-based retrospective cohort study. Respiration 2012, 84, 360–368. [Google Scholar] [CrossRef] [PubMed]
- Ghozikali, M.G.; Mosaferi, M.; Safari, G.H.; Jaafari, J. Effect of exposure to O3, NO2, and SO2 on chronic obstructive pulmonary disease hospitalizations in Tabriz, Iran. Environ. Sci. Pollut. Res. 2015, 22, 2817–2823. [Google Scholar] [CrossRef] [PubMed]
- Zhang, C.; Ding, R.; Xiao, C.; Xu, Y.; Cheng, H.; Zhu, F.; Lei, R.; Di, D.; Zhao, Q.; Cao, J. Association between air pollution and cardiovascular mortality in Hefei, China: A time-series analysis. Environ. Pollut. 2017, 229, 790–797. [Google Scholar] [CrossRef] [PubMed]
- Oiamo, T.H.; Luginaah, I.N. Extricating sex and gender in air pollution research: A community-based study on cardinal symptoms of exposure. Int. J. Environ. Res. Public Health 2013, 10, 3801–3817. [Google Scholar] [CrossRef] [PubMed]
- van Gemert, F.; Chavannes, N.; Kirenga, B.; Jones, R.; Williams, S.; Tsiligianni, I.; Vonk, J.; Kocks, J.; de Jong, C.; van der Molen, T. Socio-economic factors, gender and smoking as determinants of COPD in a low-income country of sub-Saharan Africa: FRESH AIR Uganda. NPJ Prim. Care Respir. Med. 2016, 26, 16050. [Google Scholar] [CrossRef] [PubMed]
- Guarnieri, M.; Balmes, J.R. Outdoor air pollution and asthma. Lancet 2014, 383, 1581–1592. [Google Scholar] [CrossRef] [Green Version]


| Factors | Mean ± SD | Min | P25 | Median | P75 | Max |
|---|---|---|---|---|---|---|
| Meteorological factors | ||||||
| Temperature (°C) | 11.39 ± 10.13 | −8.06 | 1.02 | 12.53 | 21.07 | 27.54 |
| Relative humidity (%) | 57.70 ± 17.53 | 14 | 43 | 59 | 72 | 96 |
| Air pollutants | ||||||
| PM2.5 (μg/m3) | 65.71 ± 48.80 | 5.10 | 34.25 | 53.05 | 80.65 | 377.00 |
| PM10 (μg/m3) | 124.2 ± 68.37 | 13.70 | 75.93 | 113.80 | 151.00 | 561.00 |
| SO2 (μg/m3) | 69.34 ± 68.27 | 4.00 | 21.00 | 42.40 | 93.75 | 428.80 |
| NO2 (μg/m3) | 43.41 ± 17.32 | 7.00 | 32.00 | 41.35 | 52.68 | 122.00 |
| O3 (μg/m3) | 89.26 ± 53.47 | 5.00 | 47.00 | 79.50 | 124.75 | 275.00 |
| Respiratory disease | ||||||
| All | 116.39 ± 47.36 | 20 | 79 | 115 | 148 | 255 |
| Male | 71.36 ± 29.53 | 12 | 49 | 71 | 91 | 171 |
| Female | 45.03 ± 19.04 | 6 | 30 | 44 | 57 | 109 |
| 0–64 years | 85.18 ± 33.03 | 16 | 61 | 83 | 106 | 182 |
| 65+ years | 31.21 ± 16.70 | 1 | 16 | 32 | 42 | 98 |
| Pneumonia | 41.87 ± 20.28 | 4 | 27 | 38 | 53 | 111 |
| COPD | 19.38 ± 10.48 | 1 | 11 | 19 | 26 | 62 |
| Factors | PM2.5 | PM10 | SO2 | NO2 | O3 | RHU | TEM |
|---|---|---|---|---|---|---|---|
| PM2.5 | 1 | ||||||
| PM10 | 0.898 *** | 1 | |||||
| SO2 | 0.656 *** | 0.583 *** | 1 | ||||
| NO2 | 0.620 *** | 0.645 *** | 0.496 *** | 1 | |||
| O3 | −0.253 *** | −0.132 *** | −0.611 *** | −0.073 * | 1 | ||
| RHU | 0.197 *** | 0.028 | −0.180 *** | 0.161 *** | −0.002 | 1 | |
| TEM | −0.327 *** | −0.243 *** | −0.755 *** | −0.114 *** | 0.780 *** | 0.361 *** | 1 |
| Lag Days | PM2.5 | PM10 | SO2 | NO2 | O3 |
|---|---|---|---|---|---|
| lag0 | 0.397(0.045,0.751) * | 0.257(0.031,0.484) * | 0.407(0.106,0.708) ** | 1.682(0.664,2.711) ** | 0.088(−0.438,0.618) |
| lag1 | 0.342(0.017,0.668) * | 0.232(0.012,0.452) * | 0.413(0.121,0.706) ** | 1.018(0.020,2.026) * | 0.359(−0.160,0.880) |
| lag2 | 0.176(−0.139,0.491) | 0.160(−0.060,0.381) | 0.309(0.026,0.593) * | 1.228(0.249,2.217) * | −0.028(−0.538,0.485) |
| lag3 | 0.008(−0.307,0.325) | 0.061(−0.160,0.282) | 0.107(−0.175,0.389) | 0.994(0.014,1.984) * | −0.203(−0.713,0.310) |
| lag4 | −0.010(−0.326,0.307) | 0.074(−0.144,0.292) | −0.016(−0.298,0.267) | 0.344(−0.633,1.331) | −0.071(−0.580,0.441) |
| lag5 | 0.029(−0.289,0.348) | 0.065(−0.154,0.284) | −0.069(−0.352,0.214) | 0.219(−0.757,1.204) | 0.415(−0.095,0.929) |
| lag01 | 0.512(0.113,0.912) * | 0.326(0.068,0.584) * | 0.617(0.254,0.981) *** | 1.825(0.649,3.016) ** | 0.315(−0.300,0.934) |
| lag02 | 0.534(0.092,0.977) * | 0.363(0.075,0.652) * | 0.771(0.354,1.189) *** | 2.255(0.939,3.589) *** | 0.240(−0.440,0.924) |
| lag03 | 0.489(0.004,0.977) * | 0.360(0.043,0.678) * | 0.777(0.320,1.237) *** | 2.574(1.128,4.041) *** | 0.105(−0.629,0.846) |
| lag04 | 0.459(−0.070,0.991) | 0.373(0.031,0.717) * | 0.715(0.223,1.209) ** | 2.612(1.039,4.209) ** | 0.062(−0.724,0.853) |
| lag05 | 0.465(−0.107,1.040) | 0.389(0.021,0.758) * | 0.645(0.119,1.173) * | 2.666(0.961,4.399) ** | 0.248(−0.589,1.092) |
| Variable | PM2.5 | PM10 | SO2 | NO2 | O3 |
|---|---|---|---|---|---|
| Adjusted for PM2.5 | - | 0.136(−0.401,0.676) | 0.762(0.116,1.413) * | 2.188(0.182,4.233) * | 0.409(−0.101,0.921) |
| Adjusted for PM10 | 0.414(−0.233,1.065) | - | 0.718(0.183,1.256) ** | 2.613(0.345,4.931) * | 0.381(−0.130,0.895) |
| Adjusted for SO2 | 0.020(−0.599,0.642) | 0.091(−0.336,0.520) | - | 1.552(−0.462,3.608) | 0.434(−0.075,0.944) |
| Adjusted for NO2 | 0.229(−0.292,0.752) | 0.017(−0.471,0.508) | 0.541(−0.007,1.091) | - | 0.363(−0.146,0.875) |
| Adjusted for O3 | 0.530(0.089,0.973) * | 0.371(0.002,0.740) * | 0.785(0.327,1.244) *** | 2.583(0.877,4.319) ** | - |
| Adjusted for other 4 pollutants | −0.021(−0.799,0.764) | −0.119(−0.733,0.498) | 0.618(−0.065,1.305) | 1.713(−0.674,4.157) | 0.406(−0.104,0.919) |
| Disease | PM2.5 | PM10 | SO2 | NO2 | O3 |
|---|---|---|---|---|---|
| Pneumonia | |||||
| lag0 | 0.541(0.187,0.897) ** | 0.393(0.160,0.626) *** | 0.400(0.102,0.699) ** | 1.452(0.403,2.512) ** | 0.073(−0.524,0.673) |
| lag1 | 0.442(0.116,0.769) ** | 0.332(0.107,0.558) ** | 0.438(0.149,0.729) ** | 0.929(−0.096,1.966) | 0.267(−0.321,0.859) |
| lag2 | 0.352(0.037,0.668) * | 0.326(0.102,0.550) ** | 0.372(0.091,0.655) ** | 1.211(0.203,2.229) * | −0.04(−0.620,0.543) |
| lag3 | 0.259(−0.056,0.576) | 0.268(0.044,0.493) * | 0.248(−0.033,0.530) | 1.279(0.266,2.303) * | −0.209(−0.789,0.375) |
| lag4 | 0.215(−0.102,0.532) | 0.290(0.067,0.514) * | 0.215(−0.066,0.496) | 1.013(0.000,2.037) | −0.247(−0.824,0.334) |
| lag5 | 0.068(−0.251,0.389) | 0.150(−0.075,0.376) | 0.010(−0.272,0.292) | 0.326(−0.680,1.343) | 0.220(−0.359,0.803) |
| lag01 | 0.685(0.283,1.089) *** | 0.485(0.221,0.751) *** | 0.634(0.273,0.996) *** | 1.615(0.404,2.840) ** | 0.240(−0.461,0.945) |
| lag02 | 0.797(0.352,1.244) *** | 0.594(0.298,0.891) *** | 0.835(0.420,1.251) *** | 2.073(0.717,3.447) ** | 0.173(−0.603,0.956) |
| lag03 | 0.884(0.393,1.377) *** | 0.682(0.356,1.008) *** | 0.939(0.480,1.401) *** | 2.580(1.084,4.098) *** | 0.045(−0.797,0.894) |
| lag04 | 0.968(0.432,1.507) *** | 0.788(0.435,1.143) *** | 1.017(0.520,1.516) *** | 2.987(1.351,4.649) *** | −0.083(−0.985,0.828) |
| lag05 | 0.990(0.407,1.576) *** | 0.834(0.453,1.216) *** | 0.984(0.450,1.521) *** | 3.113(1.332,4.926) *** | 0.023(−0.940,0.996) |
| COPD | |||||
| lag0 | 0.547(0.038,1.058) * | 0.366(0.042,0.691) * | 0.616(0.186,1.047) ** | 2.807(1.302,4.334) *** | 0.367(−0.400,1.140) |
| lag1 | 0.249(−0.217,0.718) | 0.132(−0.183,0.449) | 0.382(−0.034,0.800) | 1.267(−0.172,2.726) | 1.080(0.326,1.839) ** |
| lag2 | −0.001(−0.451,0.451) | 0.001(−0.316,0.319) | 0.161(−0.240,0.564) | 1.004(−0.399,2.426) | 0.442(−0.297,1.188) |
| lag3 | −0.039(−0.489,0.412) | −0.023(−0.339,0.294) | 0.246(−0.148,0.642) | 1.614(0.203,3.045) * | 0.017(−0.725,0.765) |
| lag4 | −0.330(−0.783,0.125) | −0.220(−0.533,0.095) | −0.203(−0.601,0.197) | −0.179(−1.572,1.233) | −0.164(−0.902,0.580) |
| lag5 | −0.110(−0.566,0.348) | −0.045(−0.359,0.271) | −0.078(−0.476,0.321) | 0.256(−1.142,1.673) | 0.417(−0.325,1.164) |
| lag01 | 0.537(−0.037,1.115) | 0.328(−0.042,0.698) | 0.764(0.247,1.285) ** | 2.745(1.022,4.498) ** | 1.073(0.164,1.990) * |
| lag02 | 0.437(−0.197,1.076) | 0.274(−0.140,0.690) | 0.796(0.209,1.386) ** | 2.846(0.935,4.794) ** | 1.124(0.128,2.130) * |
| lag03 | 0.373(−0.323,1.075) | 0.235(−0.220,0.692) | 0.883(0.248,1.522) ** | 3.438(1.341,5.578) ** | 0.973(−0.096,2.054) |
| lag04 | 0.169(−0.589,0.933) | 0.111(−0.381,0.605) | 0.714(0.038,1.394) * | 3.117(0.848,5.436) ** | 0.812(−0.329,1.967) |
| lag05 | 0.105(−0.713,0.931) | 0.085(−0.442,0.615) | 0.653(−0.064,1.375) | 3.173(0.720,5.687) * | 0.961(−0.251,2.188) |
© 2018 by the authors. Licensee MDPI, Basel, Switzerland. This article is an open access article distributed under the terms and conditions of the Creative Commons Attribution (CC BY) license (http://creativecommons.org/licenses/by/4.0/).
Share and Cite
Luo, L.; Zhang, Y.; Jiang, J.; Luan, H.; Yu, C.; Nan, P.; Luo, B.; You, M. Short-Term Effects of Ambient Air Pollution on Hospitalization for Respiratory Disease in Taiyuan, China: A Time-Series Analysis. Int. J. Environ. Res. Public Health 2018, 15, 2160. https://doi.org/10.3390/ijerph15102160
Luo L, Zhang Y, Jiang J, Luan H, Yu C, Nan P, Luo B, You M. Short-Term Effects of Ambient Air Pollution on Hospitalization for Respiratory Disease in Taiyuan, China: A Time-Series Analysis. International Journal of Environmental Research and Public Health. 2018; 15(10):2160. https://doi.org/10.3390/ijerph15102160
Chicago/Turabian StyleLuo, Lisha, Yunquan Zhang, Junfeng Jiang, Hanghang Luan, Chuanhua Yu, Peihong Nan, Bin Luo, and Mao You. 2018. "Short-Term Effects of Ambient Air Pollution on Hospitalization for Respiratory Disease in Taiyuan, China: A Time-Series Analysis" International Journal of Environmental Research and Public Health 15, no. 10: 2160. https://doi.org/10.3390/ijerph15102160
APA StyleLuo, L., Zhang, Y., Jiang, J., Luan, H., Yu, C., Nan, P., Luo, B., & You, M. (2018). Short-Term Effects of Ambient Air Pollution on Hospitalization for Respiratory Disease in Taiyuan, China: A Time-Series Analysis. International Journal of Environmental Research and Public Health, 15(10), 2160. https://doi.org/10.3390/ijerph15102160