Comparing U.S. Injury Death Estimates from GBD 2015 and CDC WONDER


Abstract
:1. Introduction
2. Materials and Methods
2.1. Ethical Issues
2.2. Data Sources
2.3. Data Analysis
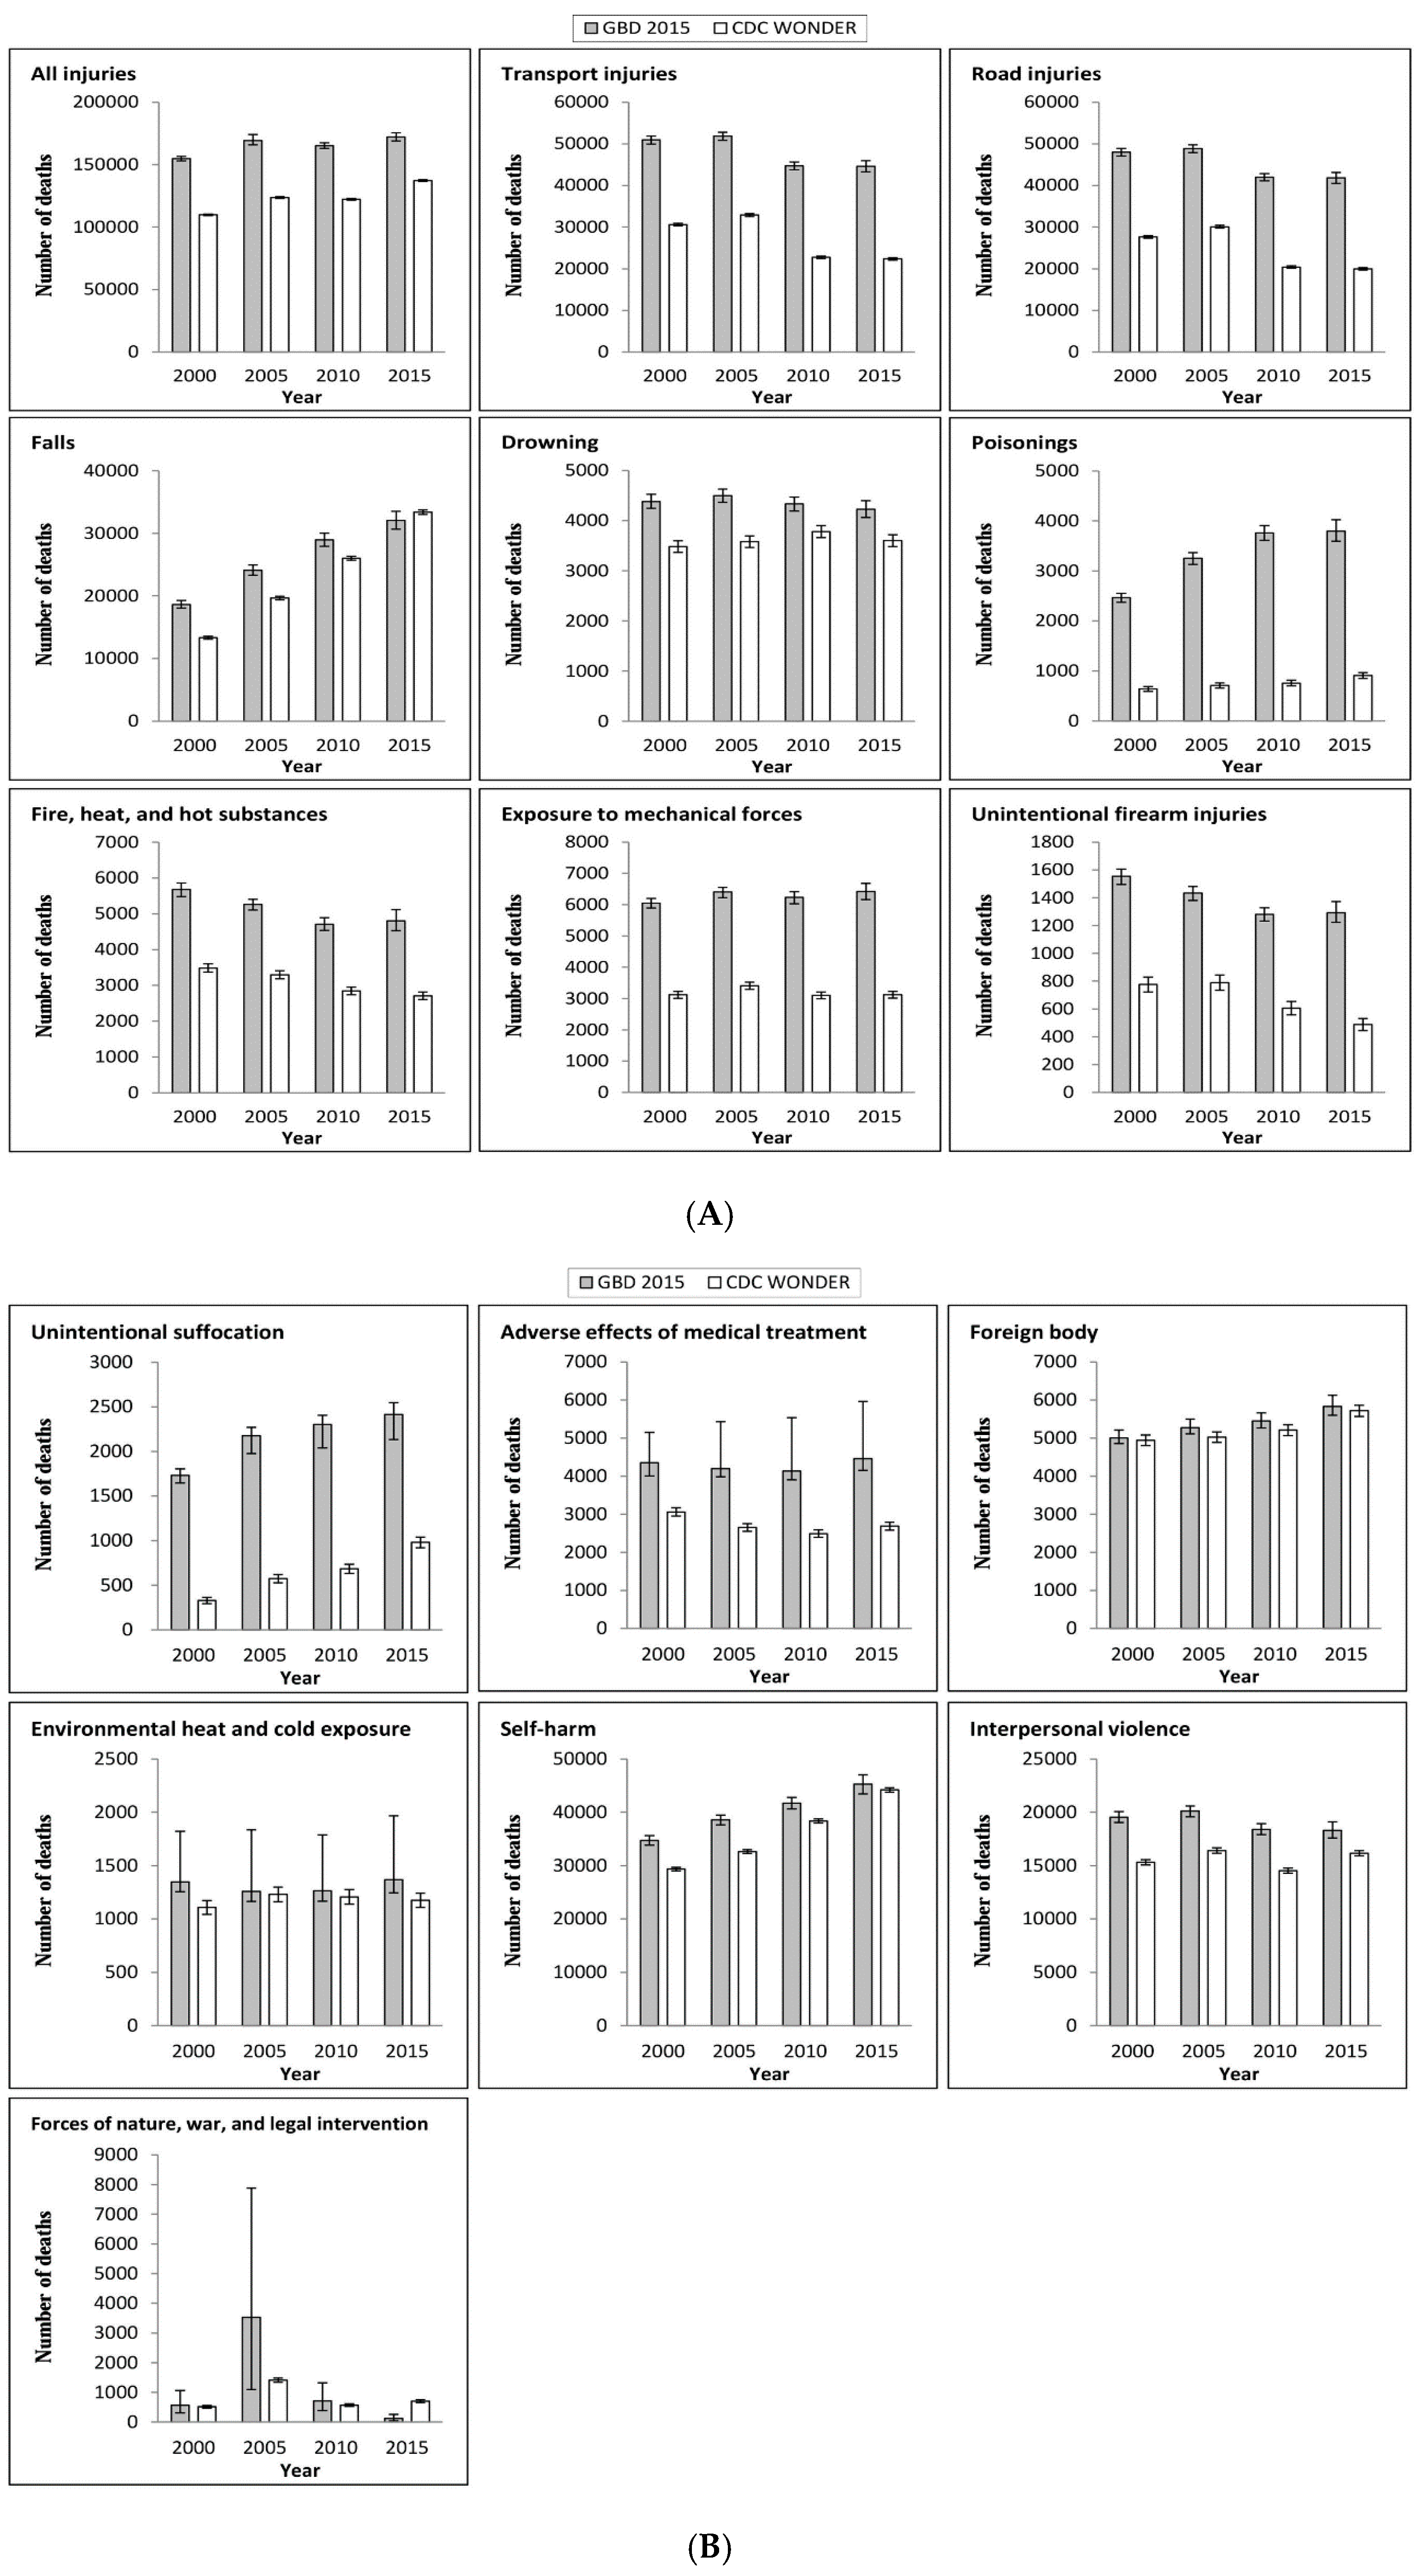
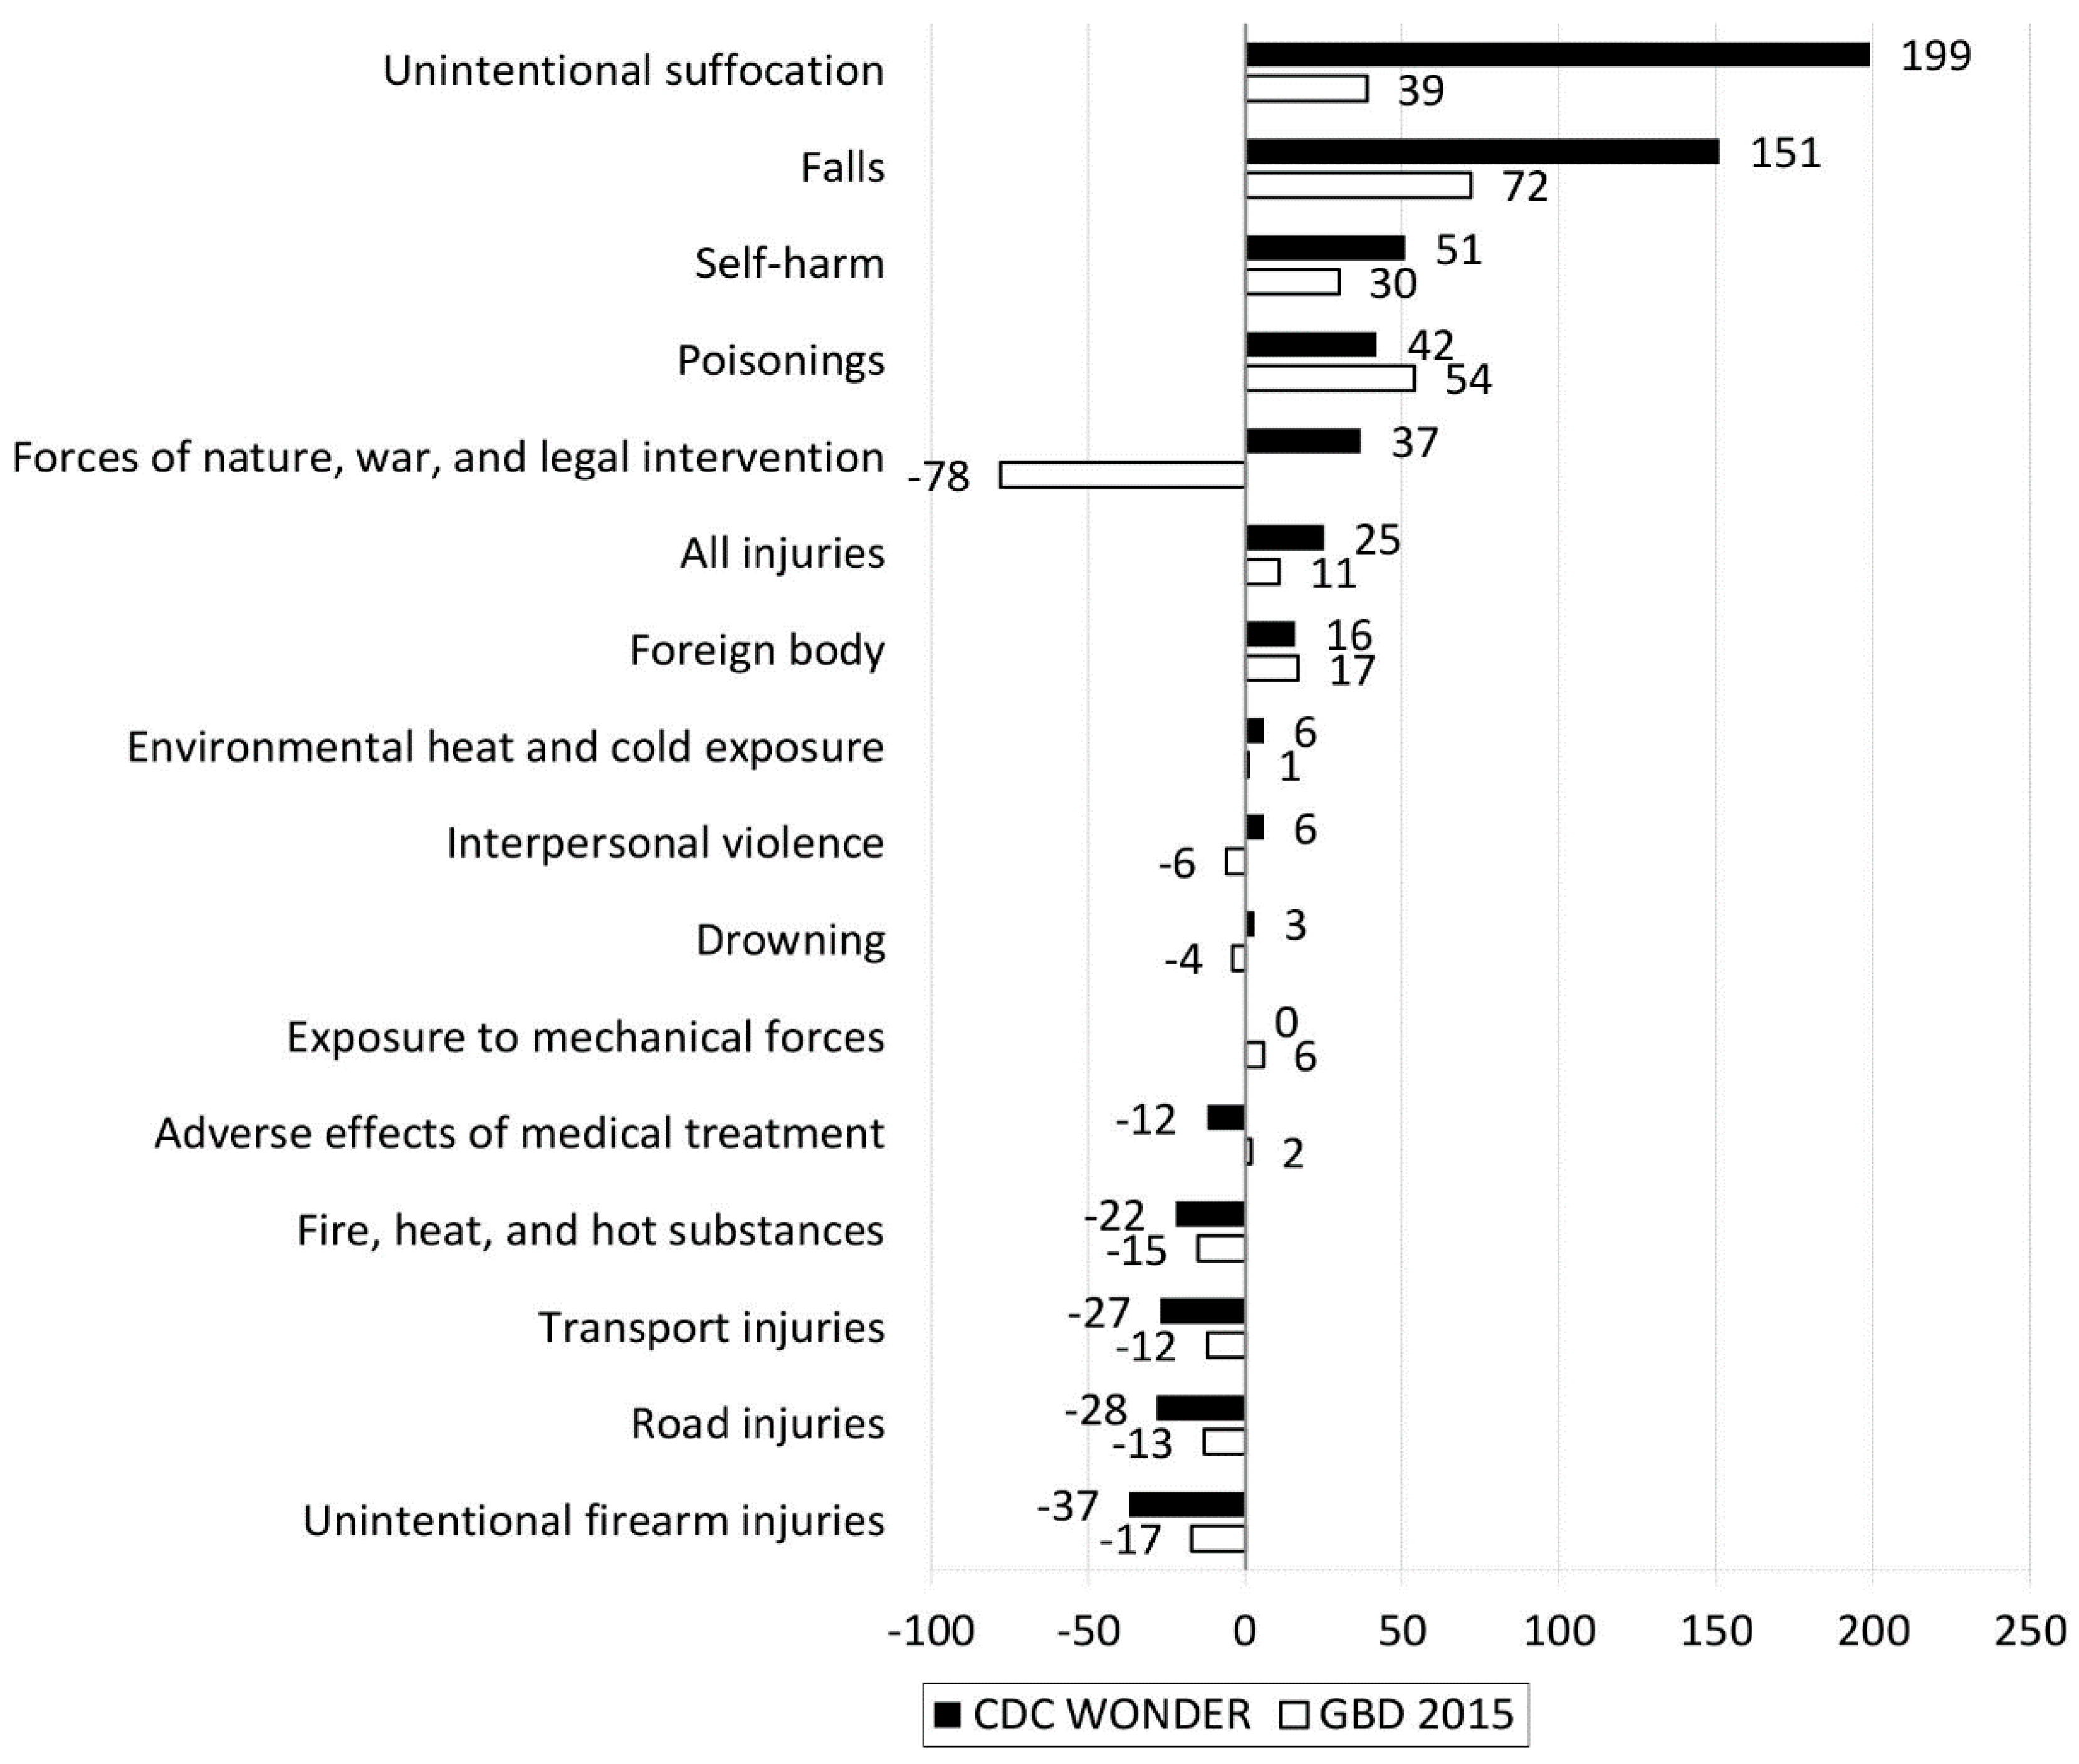
3. Results
4. Discussion
5. Implications and Limitations
6. Conclusions
Author Contributions
Conflicts of Interest
References
- Institute for Health Metrics and Evaluation, University of Washington. GBD Compare Viz Hub. Available online: https://vizhub.healthdata.org/gbd-compare/?utm_source=IHME+Updates&utm_campaign=36e612ff01-Weekly_Email_Sept_17_2015&utm_medium=email&utm_term=0_1790fa6746-36e612ff01-422225677 (accessed on 1 March 2017).
- Dwyer-Lindgren, L.; Bertozzi-Villa, A.; Stubbs, R.W.; Morozoff, C.; Kutz, M.J.; Huynh, C.; Barber, R.M.; Shackelford, K.A.; Mackenbach, J.P.; van Lenthe, F.J.; et al. U.S. county-level trends in mortality rates for major causes of death, 1980–2014. JAMA 2016, 316, 2385–2401. [Google Scholar] [CrossRef] [PubMed]
- GBD 2015 Mortality and Causes of Death Collaborators. Global, regional, and national life expectancy, all-cause mortality, and cause-specific mortality for 249 causes of death, 1980–2015: A systematic analysis for the Global Burden of Disease Study 2015. Lancet 2016, 388, 1459–1544. [Google Scholar]
- GBD 2015 SDG Collaborators. Measuring the health-related Sustainable Development Goals in 188 countries: A baseline analysis from the Global Burden of Disease Study 2015. Lancet 2016, 388, 1813–1850. [Google Scholar]
- Naghavi, M.; Makela, S.; Foreman, K.; O’Brien, J.; Pourmalek, F.; Lozano, R. Algorithms for enhancing public health utility of national causes-of-death data. Popul. Health Metr. 2010, 8, 9. [Google Scholar] [CrossRef] [PubMed]
- United States Department of Health and Human Services (U.S. DHHS); Centers for Disease Control and Prevention (CDC); National Center for Health Statistics (NCHS). Multiple Cause of Death on CDC WONDER Online Database. Available online: http://wonder.cdc.gov/mcd.html (accessed on 1 March 2017).
- U.S. DEPARTMENT OF HEALTH AND HUMAN SERVICES. Technical Appendix from Vital Statistics of United States: 1999 Mortality. Available online: https://wonder.cdc.gov/wonder/help/CMF/TechnicalAppendix1999.pdf (accessed on 1 March 2017).
- Chiang, C.L. Standard Error of the Age-Adjusted Death Rate; Vital Statistics-Special Reports; National Center for Health Statistics, Public Health Service: Washington, DC, USA, 1961; Volume 47.
- Jian, Y.; Messer, L.C.; Jagai, J.S.; Rappazzo, K.M.; Gray, C.L.; Grabich, S.C.; Lobdell, D.T. Associations between Environmental Quality and Mortality in the Contiguous United States, 2000–2005. Environ. Health Perspect. 2017, 125, 355–362. [Google Scholar] [CrossRef] [PubMed]
- Albertus, P.; Morgenstern, H.; Robinson, B.; Saran, R. Risk of ESRD in the United States. Am. J. Kidney Dis. 2016, 68, 862–872. [Google Scholar] [CrossRef] [PubMed]
- Epstein, L.; Dantes, R.; Magill, S.; Fiore, A. Varying Estimates of Sepsis Mortality Using Death Certificates and Administrative Codes—United States, 1999–2014. MMWR Morb. Mortal. Wkly. Rep. 2016, 65, 342–345. [Google Scholar] [CrossRef] [PubMed]
- Kim, N.; Mickelson, J.B.; Brenner, B.E.; Haws, C.A.; Yurgelun-Todd, D.A.; Renshaw, P.F. Altitude, gun ownership, rural areas, and suicide. Am. J. Psychiatry 2011, 168, 49–54. [Google Scholar] [CrossRef] [PubMed]
- Lee, Y.R.; Kim, Y.A.; Park, S.Y.; Oh, C.M.; Kim, Y.E.; Oh, I.H. Application of a Modified Garbage Code Algorithm to Estimate Cause-Specific Mortality and Years of Life Lost in Korea. J. Korean Med. Sci. 2016, 31 (Suppl. S2), S121–S128. [Google Scholar] [CrossRef] [PubMed]
- Wan, X.; Yang, G.H. Is the Mortality Trend of Ischemic Heart Disease by the GBD2013 Study in China Real? Biomed. Environ. Sci. 2017, 30, 204–209. [Google Scholar] [PubMed]
- Hu, G.; Mamady, K. Impact of changes in specificity of data recording on cause-specific injury mortality in the United States, 1999–2010. BMC Public Health 2014, 14, 1010. [Google Scholar] [CrossRef] [PubMed]


| Injury Cause | ICD10 Code |
|---|---|
| All Injuries | V00-V86.99, V87.2-V87.3, V88.2-V88.3, V90-V98.8, W00-W46.2, W49-W62.9, W64-W70.9, W73-W75.9, W77-W81.9, W83-W94.9, W97.9, W99-X06.9, X08-X39.9, X46-X47, X47.1-X47.8, X48-X48.9, X50-X54.9, X57-X58.9, X60-Y08.9, Y35-Y84.9, Y87.0-Y87.1, Y88-Y88.3, Y89.0-Y89.1 |
| Transport injuries | V00-V86.99, V87.2-V87.3, V88.2-V88.3, V90-V98.8 |
| Road injuries | V01-V04.99, V06-V80.929, V82-V82.9, V87.2-V87.3 |
| Falls | W00-W19.9 |
| Drowning | W65-W70.9, W73-W74.9 |
| Fire, heat, and hot substances | X00-X06.9, X08-X19.9 |
| Poisonings | X46-X47, X47.1-X47.8, X48-X48.9 |
| Exposure to mechanical forces | W20-W38.9, W40-W43.9, W45.0-W45.2, W46-W46.2, W49-W52, W75-W75.9 |
| Unintentional firearm injuries | W32-W34.9 |
| Unintentional suffocation | W75-W75.9 |
| Adverse effects of medical treatment | Y38.9-Y84.9, Y88-Y88.3 |
| Animal contact | W52.0-W62.9, W64-W64.9, X20-X29.9 |
| Foreign body | W44-W45, W45.3-W45.9, W78-W80.9, W83-W84.9 |
| Environmental heat and cold exposure | W88-W94.9, W97.9, W99-W99.9, X30-X32.9, X39-X39.9 |
| Self-harm | X60-X84.9, Y87.0 |
| Interpersonal violence | X85-Y08.9, Y87.1 |
| Forces of nature, war, and legal intervention | X33-X38.9, Y35-Y38.893, Y89.0-Y89.1 |
| Cause | Difference in Deaths | Percent Difference in Deaths (%) | ||||||
|---|---|---|---|---|---|---|---|---|
| 2000 | 2005 | 2010 | 2015 | 2000 | 2005 | 2010 | 2015 | |
| All injuries | 44,897 | 45,534 | 42,965 | 34,877 | 41 | 37 | 35 | 25 |
| Transport injuries | 20,335 | 18,949 | 21,955 | 22,248 | 66 | 58 | 96 | 99 |
| Road injuries | 20,306 | 18,742 | 21,561 | 21,809 | 73 | 62 | 106 | 109 |
| Falls | 5297 | 4421 | 2930 | −1304 | 40 | 22 | 11 | −4 |
| Drowning | 900 | 917 | 553 | 624 | 26 | 26 | 15 | 17 |
| Fire, heat, and hot substances | 2190 | 1960 | 1867 | 2091 | 63 | 59 | 66 | 77 |
| Poisonings | 1827 | 2543 | 3000 | 2885 | 286 | 358 | 395 | 318 |
| Exposure to mechanical forces | 2929 | 3002 | 3137 | 3302 | 94 | 88 | 101 | 106 |
| Unintentional firearm injuries | 778 | 645 | 675 | 803 | 100 | 82 | 111 | 164 |
| Unintentional suffocation | 1404 | 1603 | 1618 | 1434 | 429 | 280 | 237 | 146 |
| Adverse effects of medical treatment | 1298 | 1547 | 1647 | 1773 | 42 | 58 | 66 | 66 |
| Foreign body | 60 | 250 | 241 | 117 | 1 | 5 | 5 | 2 |
| Environmental heat and cold exposure | 240 | 29 | 57 | 194 | 22 | 2 | 5 | 16 |
| Self-harm | 5357 | 5939 | 3342 | 1081 | 18 | 18 | 9 | 2 |
| Interpersonal violence | 4241 | 3697 | 3876 | 2141 | 28 | 23 | 27 | 13 |
| Forces of nature, war, and legal intervention | 51 | 2113 | 142 | −581 | 10 | 150 | 25 | −82 |
© 2018 by the authors. Licensee MDPI, Basel, Switzerland. This article is an open access article distributed under the terms and conditions of the Creative Commons Attribution (CC BY) license (http://creativecommons.org/licenses/by/4.0/).
Share and Cite
Wu, Y.; Cheng, X.; Ning, P.; Cheng, P.; Schwebel, D.C.; Hu, G. Comparing U.S. Injury Death Estimates from GBD 2015 and CDC WONDER. Int. J. Environ. Res. Public Health 2018, 15, 87. https://doi.org/10.3390/ijerph15010087
Wu Y, Cheng X, Ning P, Cheng P, Schwebel DC, Hu G. Comparing U.S. Injury Death Estimates from GBD 2015 and CDC WONDER. International Journal of Environmental Research and Public Health. 2018; 15(1):87. https://doi.org/10.3390/ijerph15010087
Chicago/Turabian StyleWu, Yue, Xunjie Cheng, Peishan Ning, Peixia Cheng, David C. Schwebel, and Guoqing Hu. 2018. "Comparing U.S. Injury Death Estimates from GBD 2015 and CDC WONDER" International Journal of Environmental Research and Public Health 15, no. 1: 87. https://doi.org/10.3390/ijerph15010087
APA StyleWu, Y., Cheng, X., Ning, P., Cheng, P., Schwebel, D. C., & Hu, G. (2018). Comparing U.S. Injury Death Estimates from GBD 2015 and CDC WONDER. International Journal of Environmental Research and Public Health, 15(1), 87. https://doi.org/10.3390/ijerph15010087