The Indirect Efficacy Comparison of DNA Methylation in Sputum for Early Screening and Auxiliary Detection of Lung Cancer: A Meta-Analysis

Abstract
:1. Introduction
2. Materials and Methods
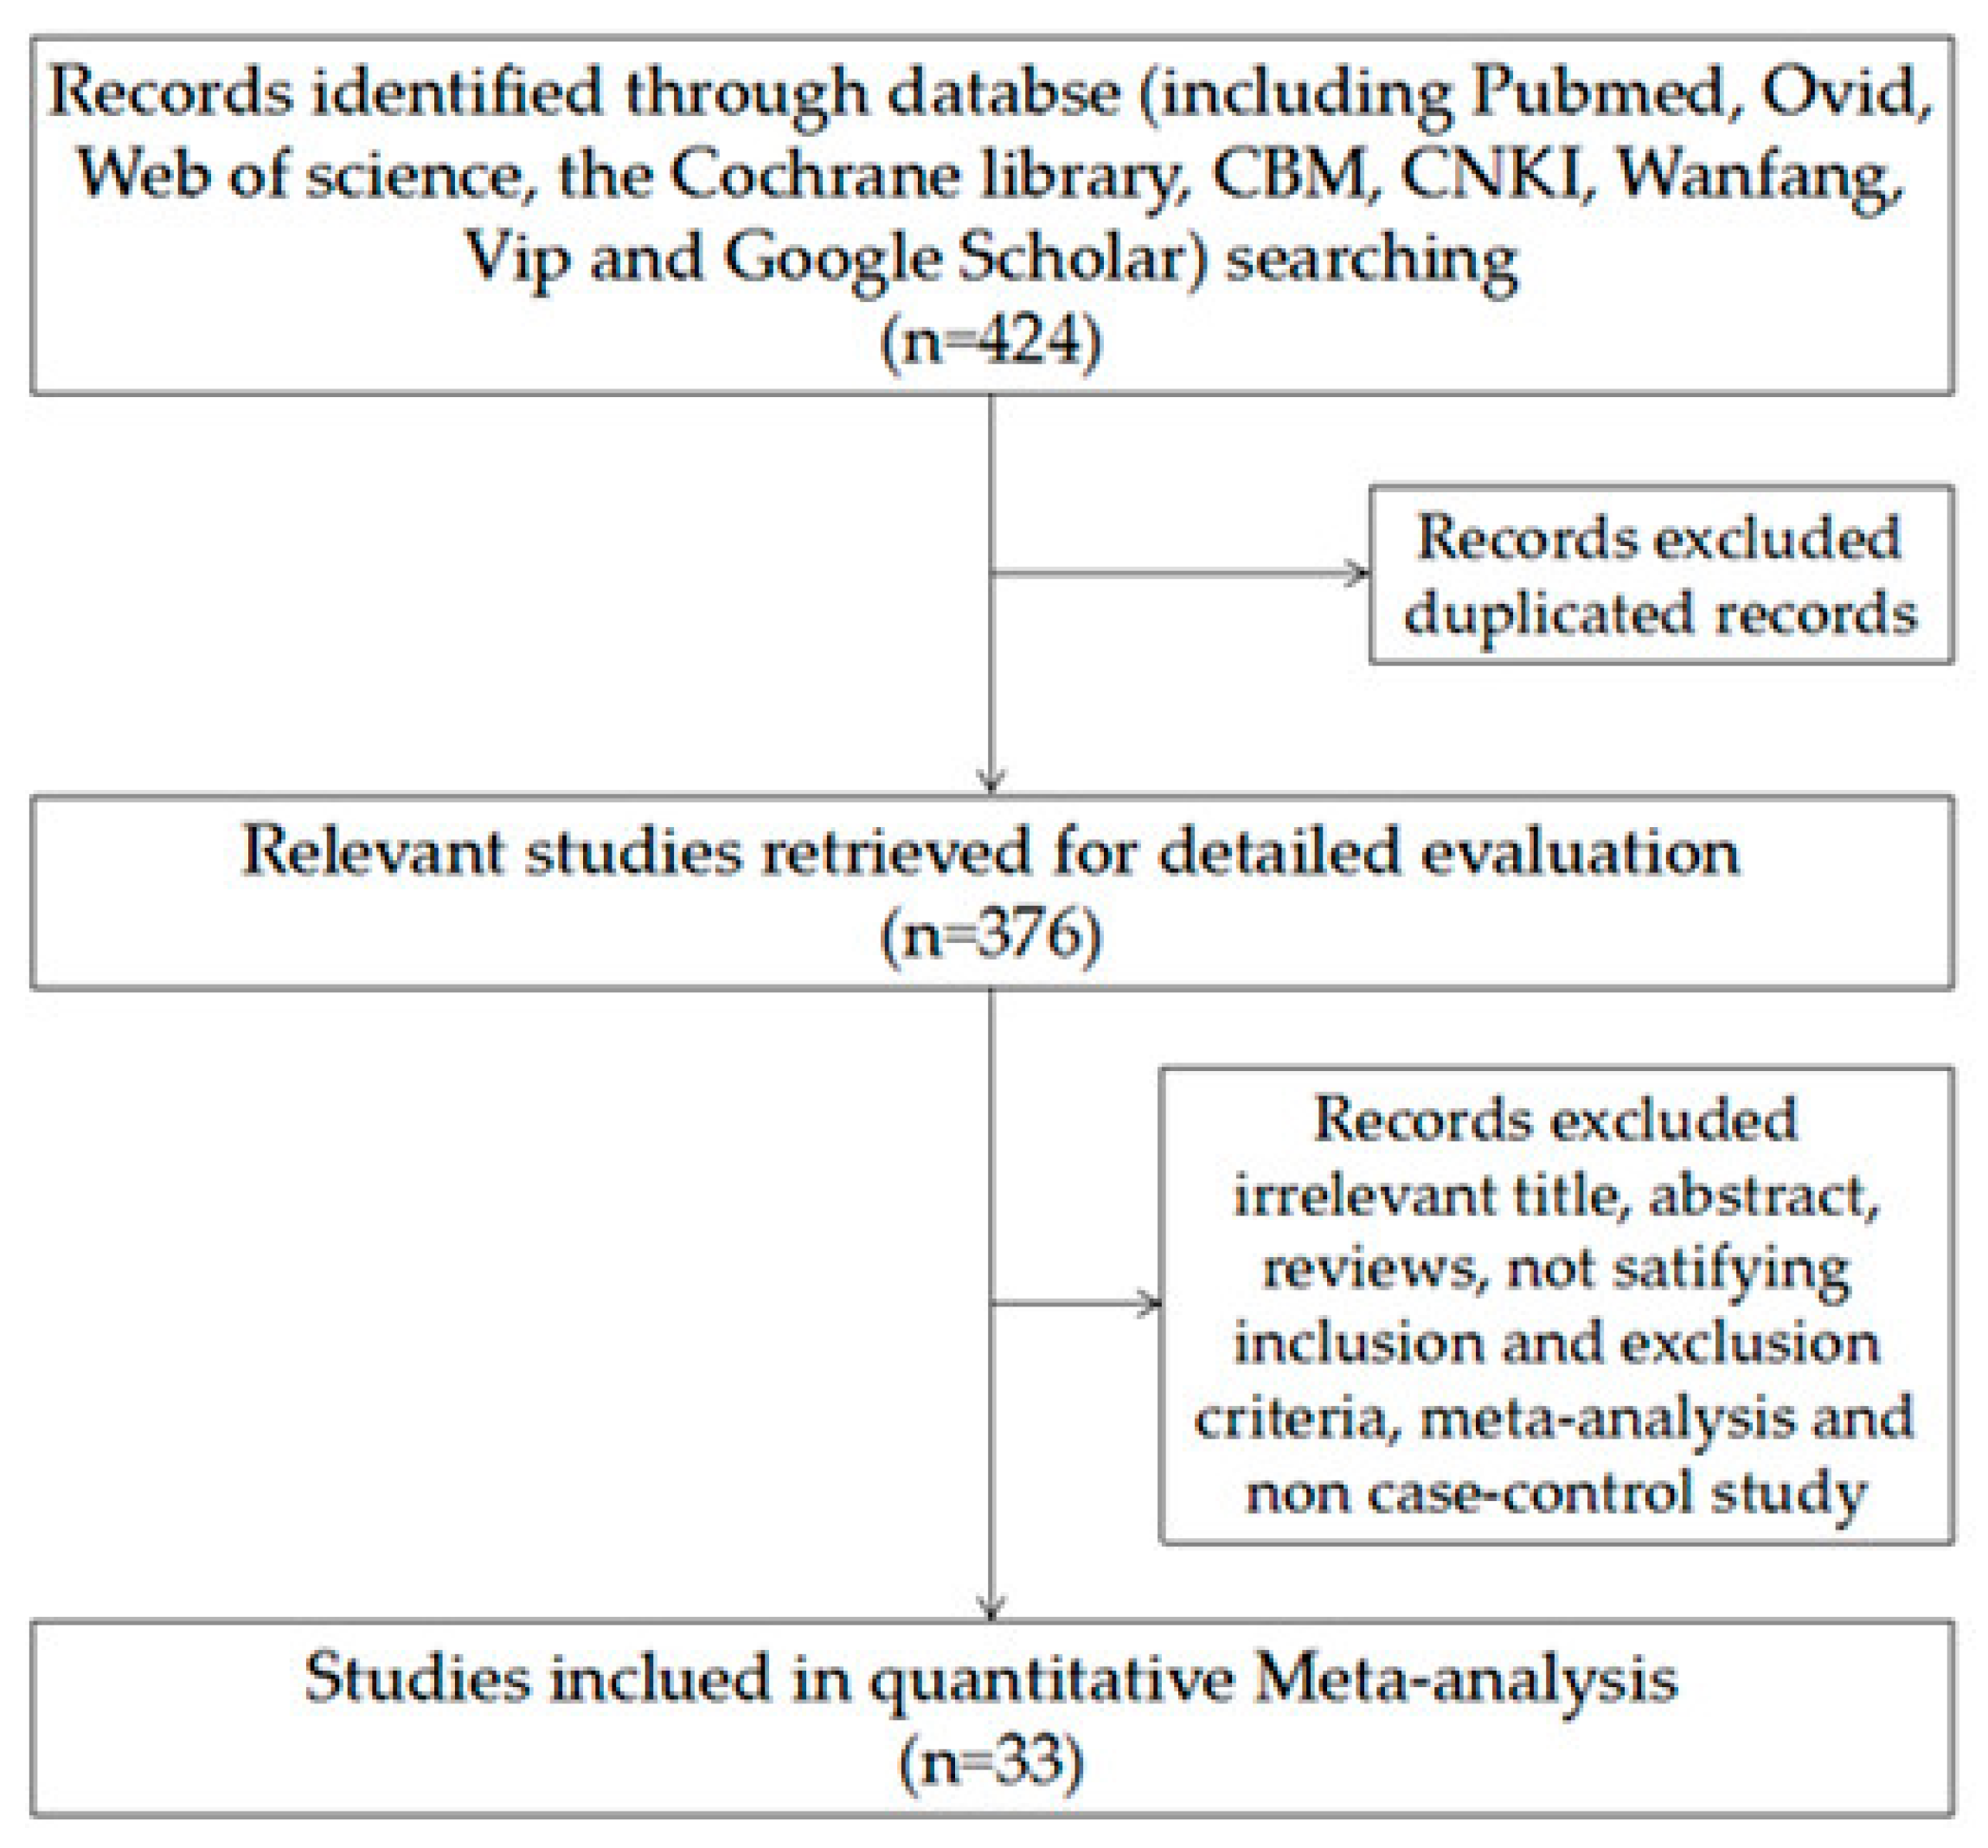
2.1. Search Strategy
2.2. Inclusion Criteria and Exclusion Criteria
2.3. Data Extraction and Quality Assessment
2.4. Statistical Analysis
3. Results
3.1. Subsection
3.1.1. Study Characteristics and Quality of Included Studies
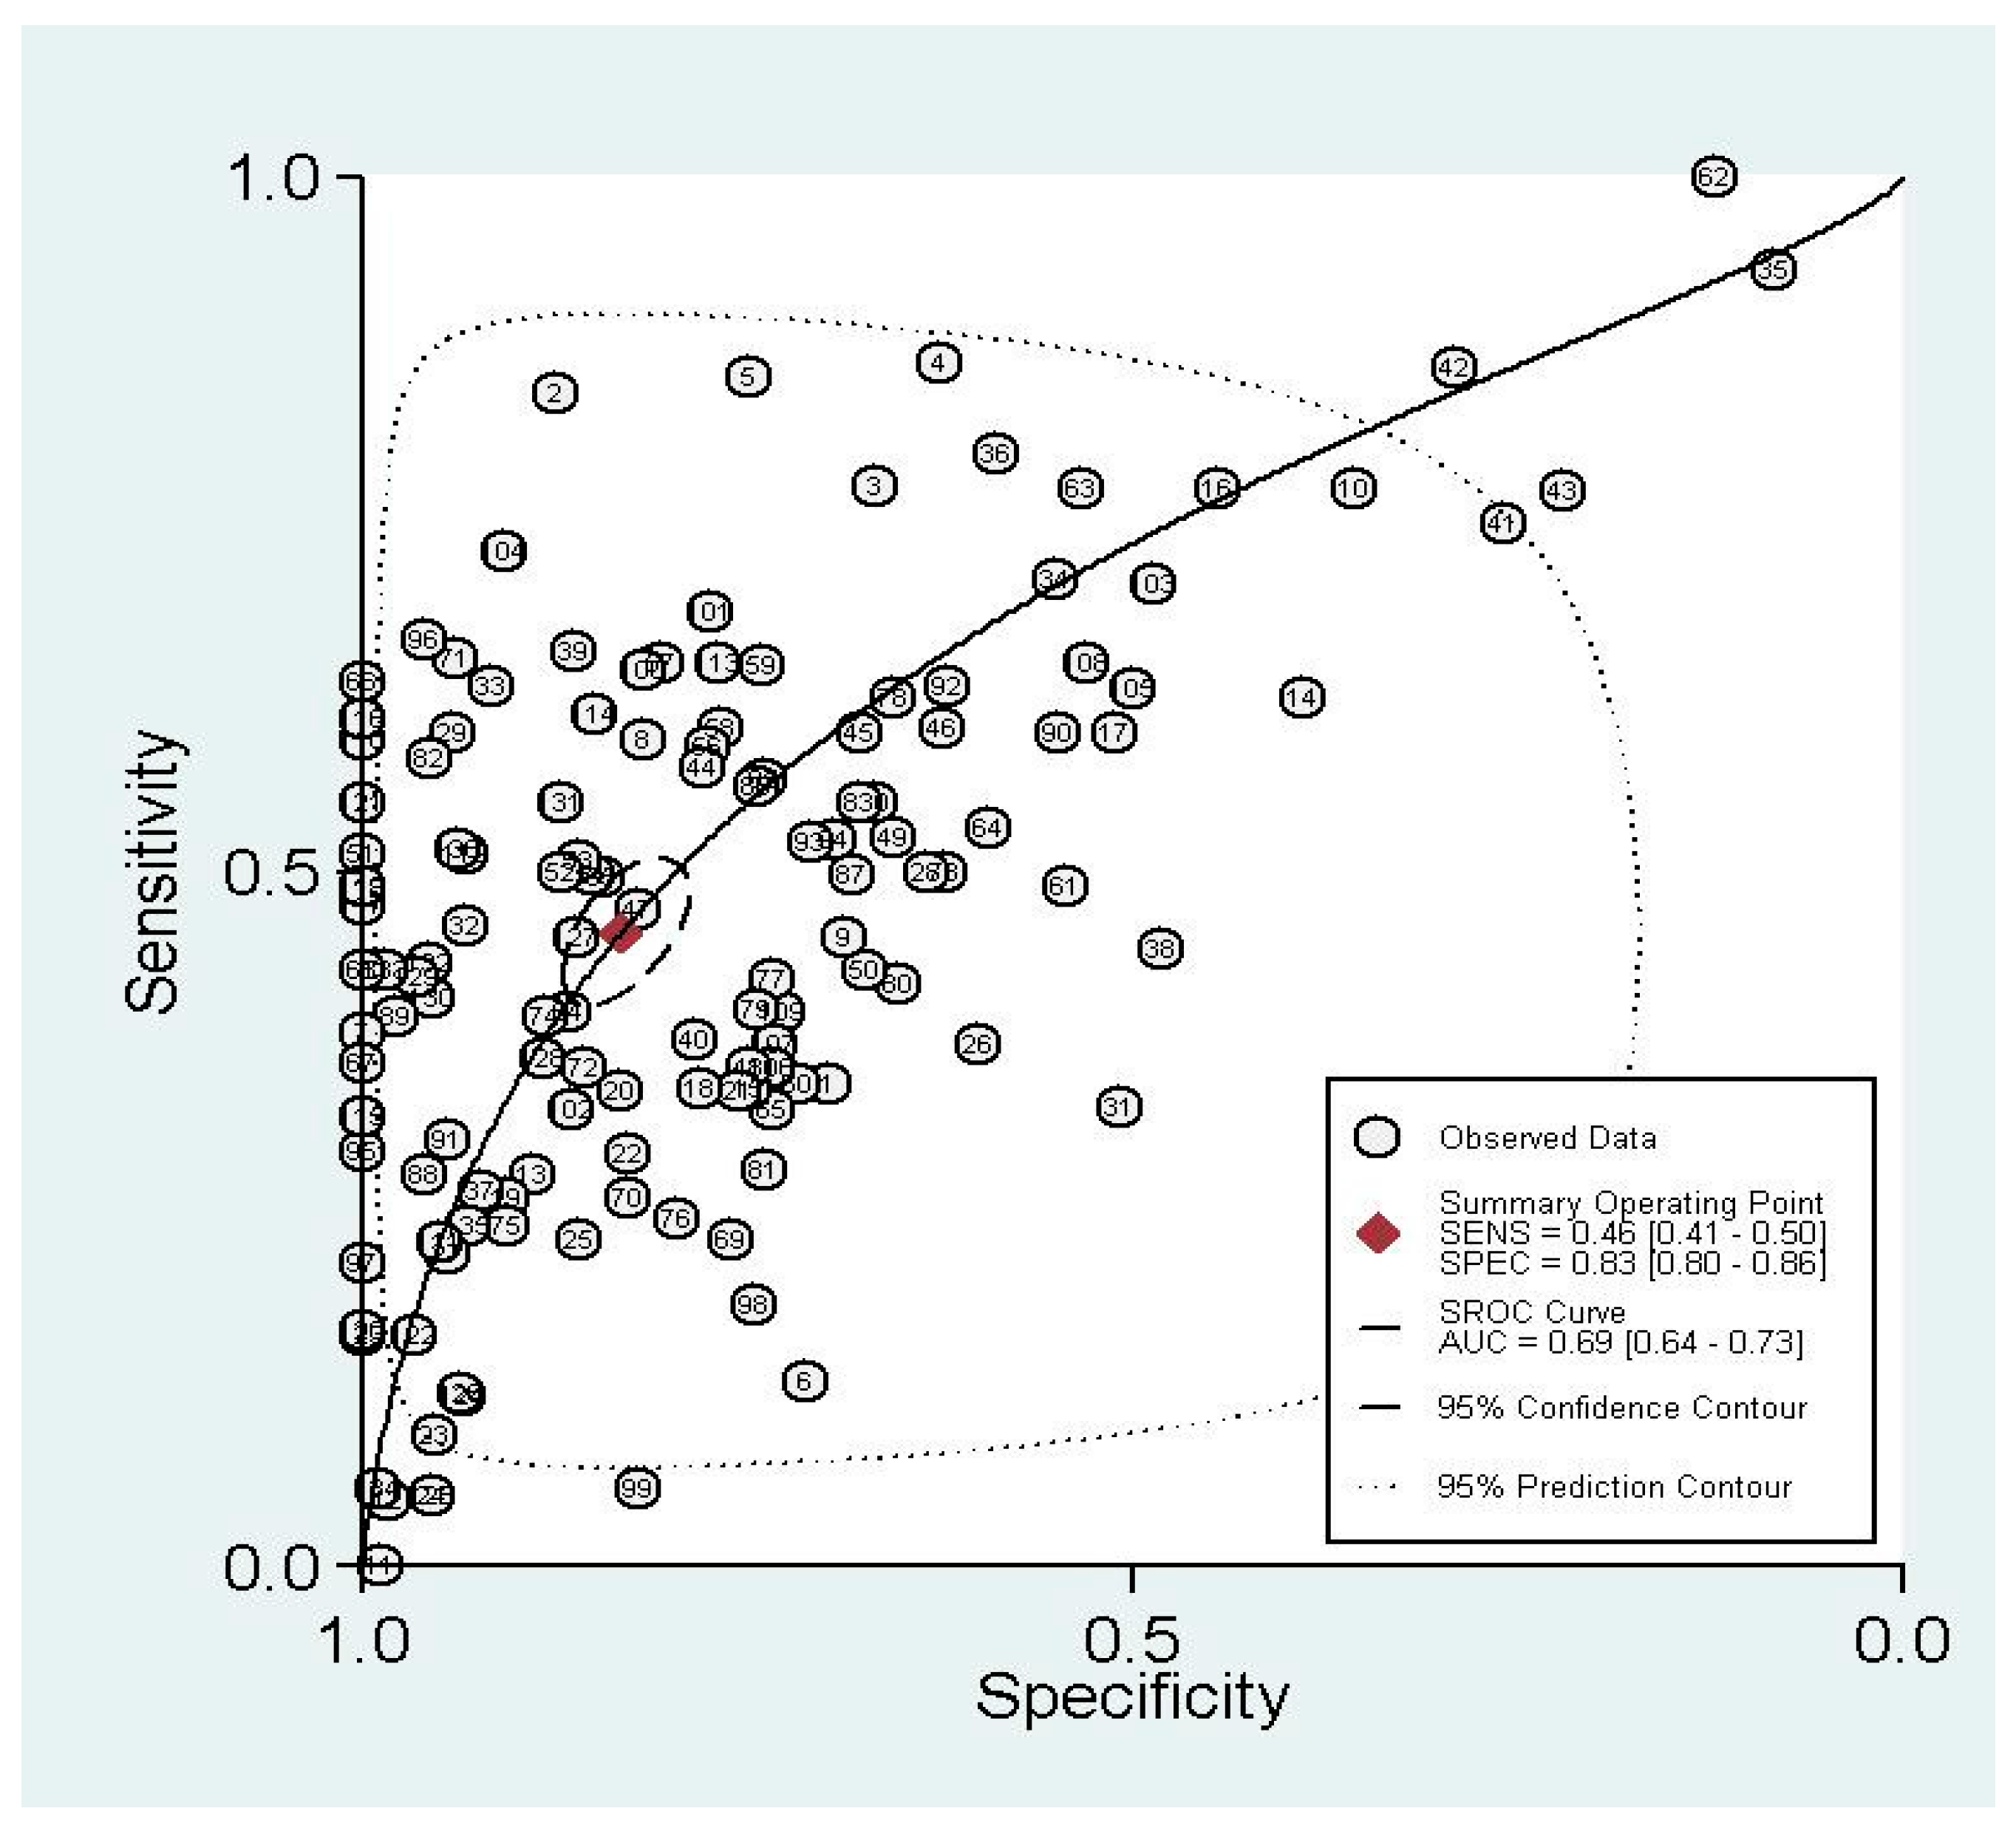
3.1.2. Summary Performance of Diagnostic Estimates
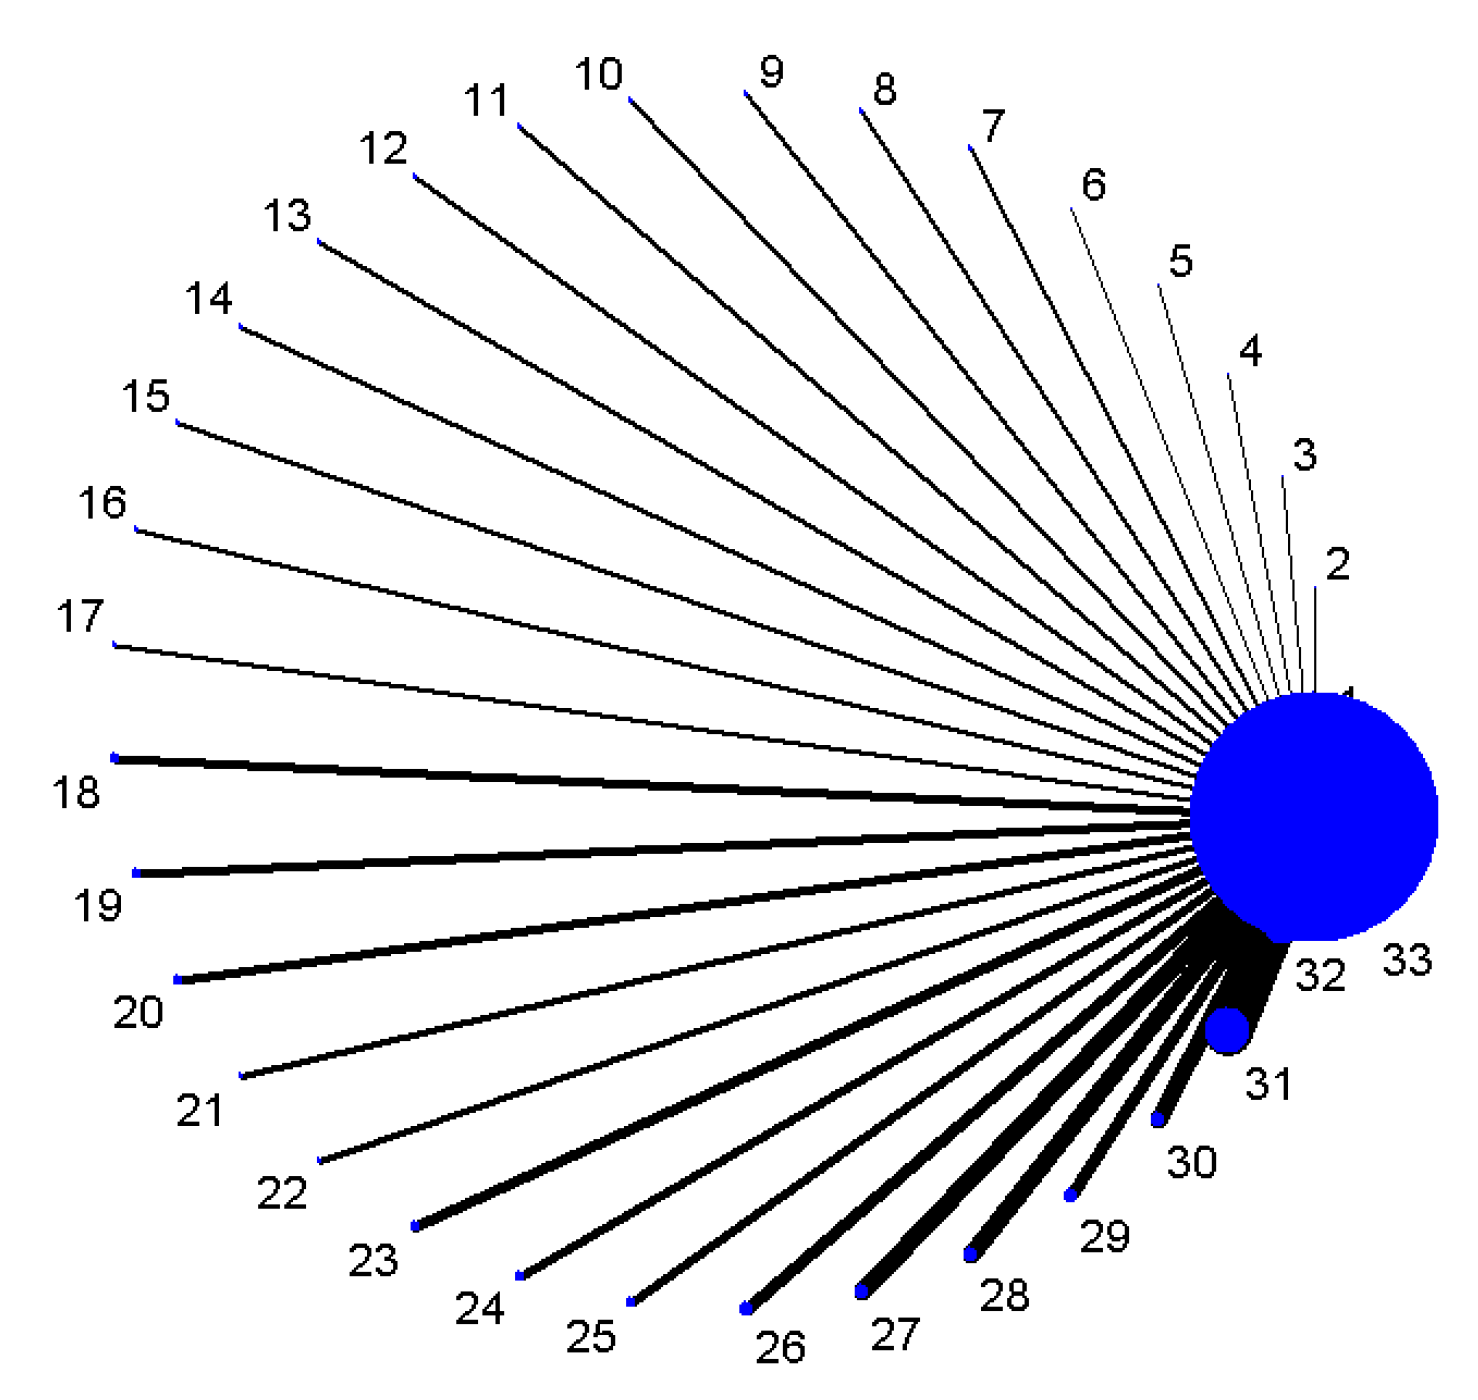
3.1.3. Indirect Comparisons of Diagnostic Analysis
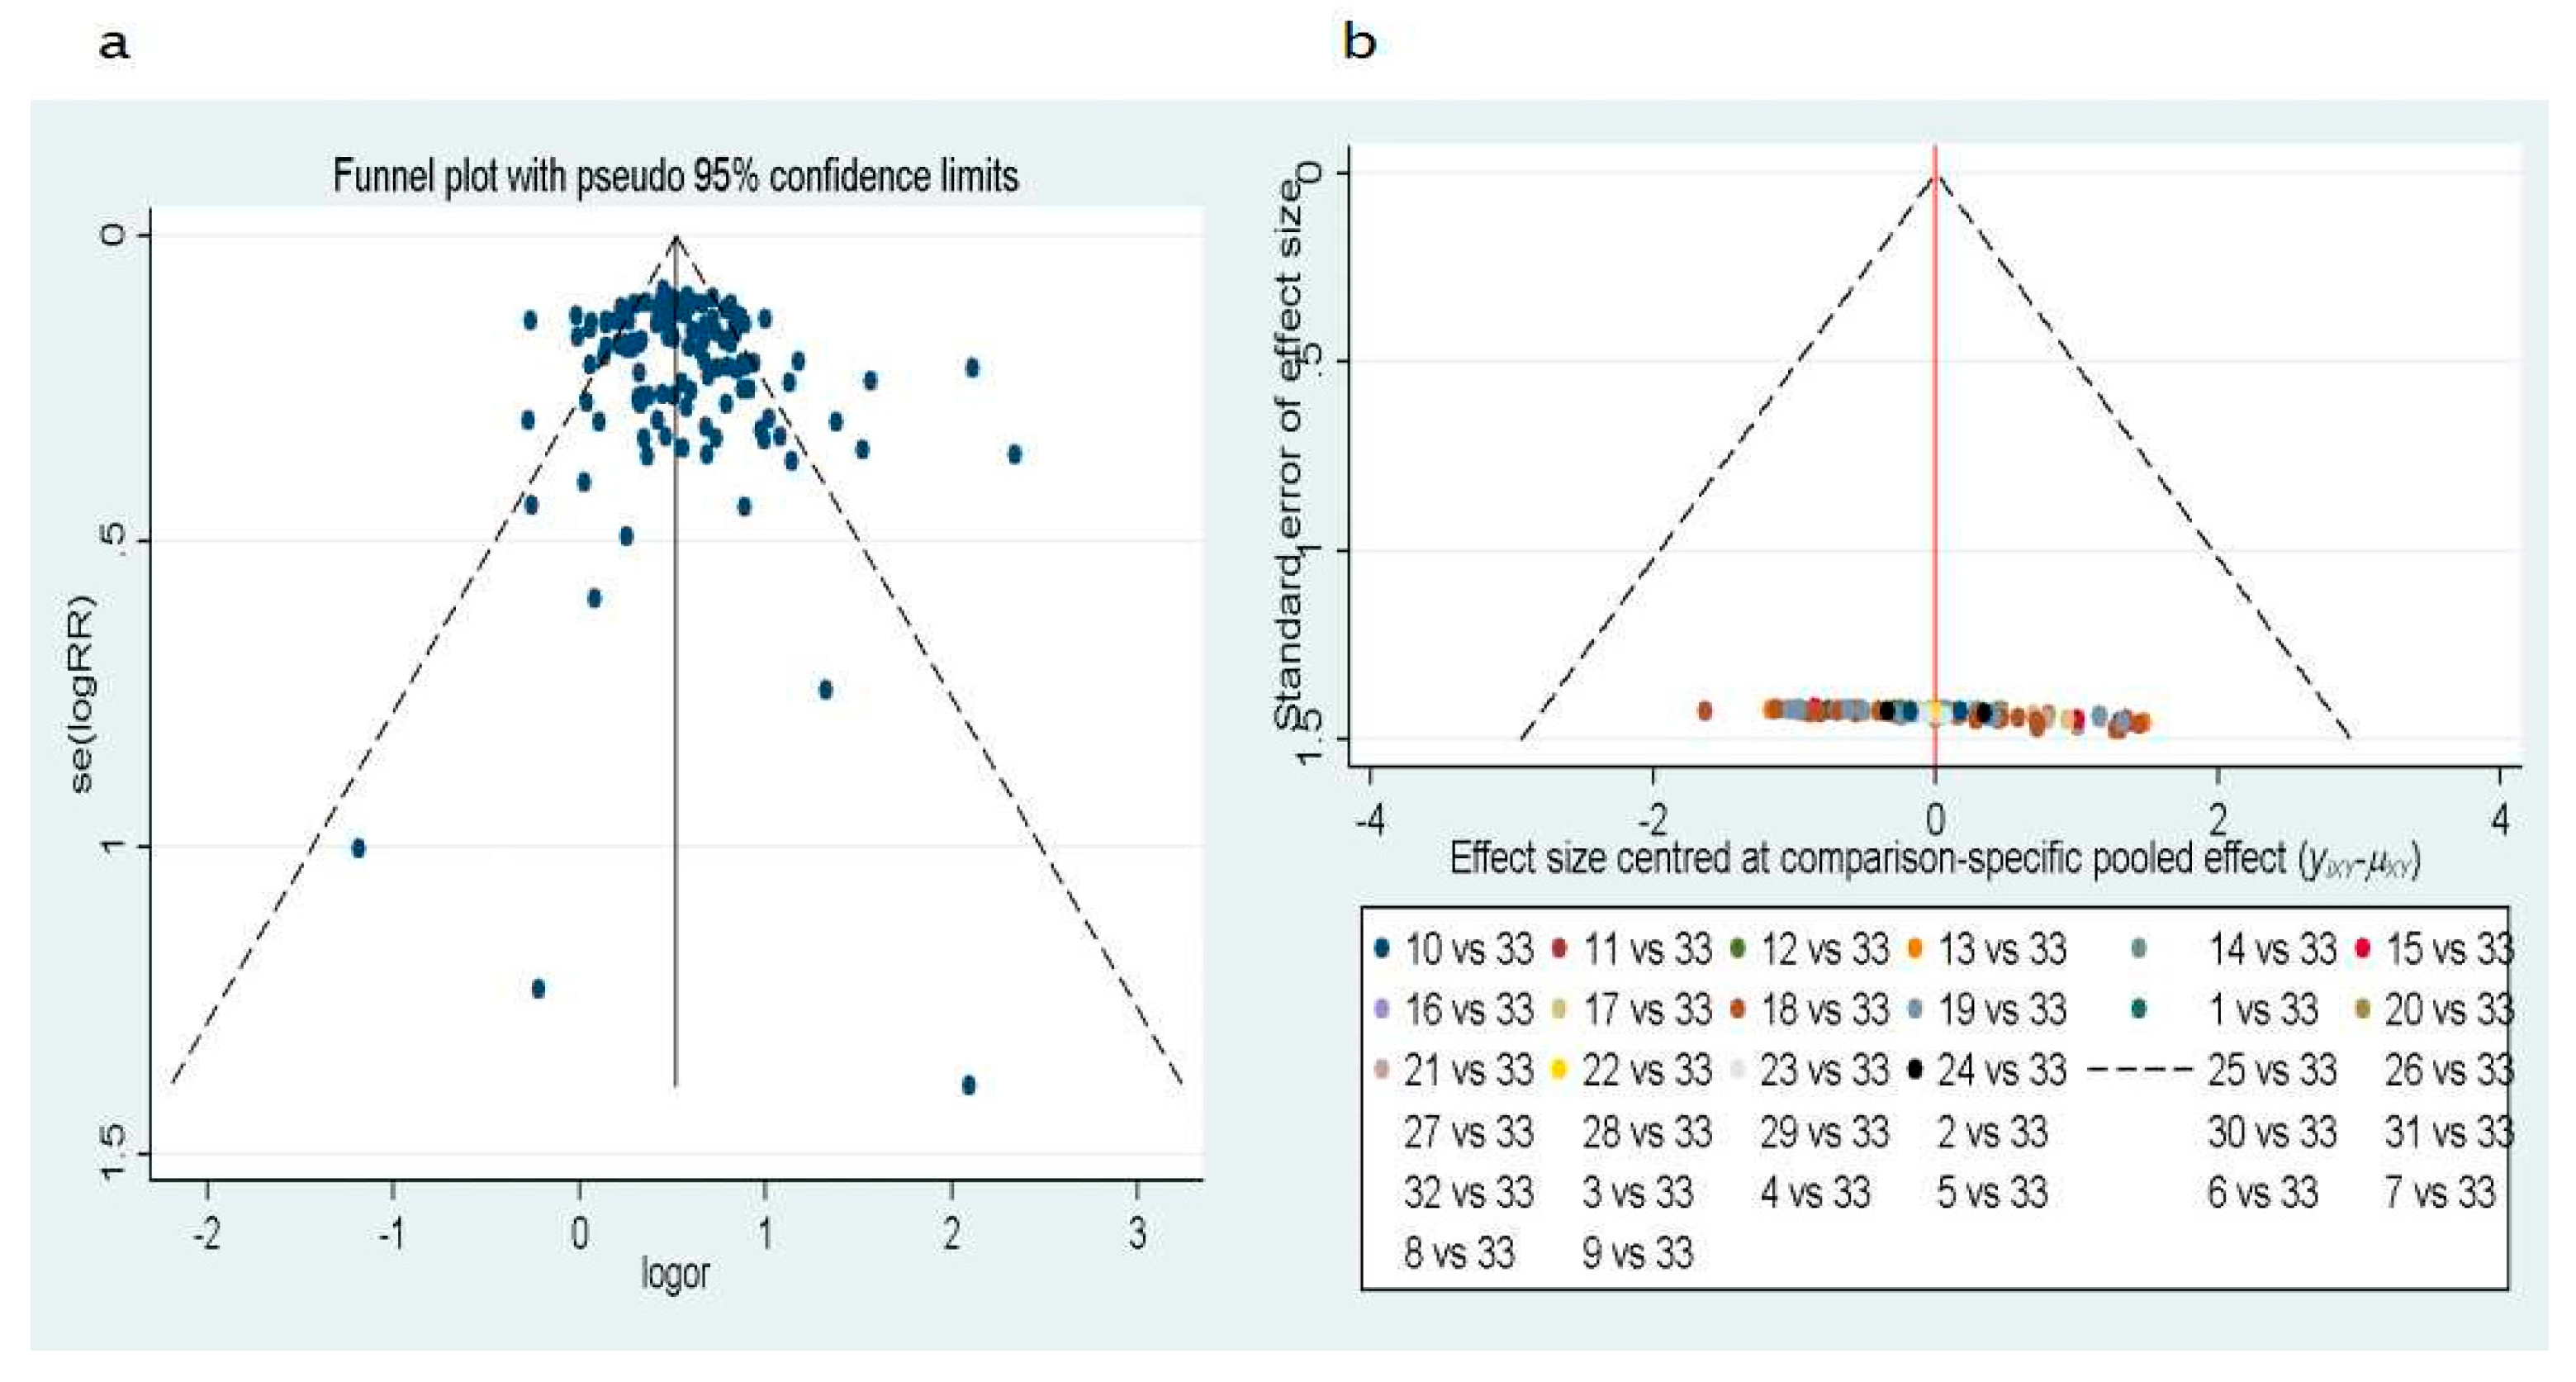
3.1.4. Test of Heterogeneity and Meta-Regression
4. Discussion
5. Conclusions
Supplementary Materials
Acknowledgments
Author Contributions
Conflicts of Interest
References
- Chen, W.; Zheng, R.; Baade, P.D.; Zhang, S.; Zeng, H.; Bray, F.; Jemal, A.; Yu, X.Q.; He, J. Cancer statistics in China, 2015. Cancer J. Clin. 2016, 66, 115. [Google Scholar] [CrossRef] [PubMed]
- Sun, X.; Tong, L.P.; Wang, Y.T.; Wu, Y.X.; Sheng, H.S.; Lu, L.J.; Wang, W. Can global variation of nasopharynx cancer be retrieved from the combined analyses of IARC Cancer Information (CIN) databases? PLoS ONE 2011, 6, e22039. [Google Scholar] [CrossRef] [PubMed]
- Teng, A.M.; Atkinson, J.; Disney, G.; Wilson, N.; Blakely, T. Changing socioeconomic inequalities in cancer incidence and mortality: Cohort study with 54 million person-years follow-up 1981–2011. Int. J. Cancer 2016, 140, 1306–1316. [Google Scholar] [CrossRef] [PubMed]
- Ghasemi, M.; Nabipour, I.; Omrani, A.; Alipour, Z.; Assadi, M. Precision medicine and molecular imaging: New targeted approaches toward cancer therapeutic and diagnosis. Am. J. Nucl. Med. Mol. Imaging 2016, 6, 310–327. [Google Scholar] [PubMed]
- Hsu, H.-S.; Chen, T.P.; Wen, C.K.; Hung, C.H.; Chen, C.Y.; Chen, J.T.; Wang, Y.C. Multiple genetic and epigenetic biomarkers for lung cancer detection in cytologically negative sputum and a nested case–control study for risk assessment. J. Pathol. 2007, 213, 412–419. [Google Scholar] [CrossRef] [PubMed]
- Dietel, M. Molecular Pathology: A Requirement for Precision Medicine in Cancer. Oncol. Res. Treat. 2016, 39, 804–810. [Google Scholar] [CrossRef] [PubMed]
- Dong, N.; Shi, L.; Wang, D.C.; Chen, C.; Wang, X. Role of epigenetics in lung cancer heterogeneity and clinical implication. Semin. Cell Dev. Biol. 2016, 64, 18–25. [Google Scholar] [CrossRef] [PubMed]
- Yan, R.; Chi, L.; Zheng, X.; Sun, R.; You, J.; Ye, X. A meta-analysis of serum p16 gene promoter methylation for diagnosis of nonsmall cell lung cancer. Indian J. Cancer 2015, 52 (Suppl. S2), e116. [Google Scholar]
- Huang, Y.Z.; Wu, W.; Wu, K.; Xu, X.N.; Tang, W.R. Association of RASSF1A Promoter Methylation with Lung Cancer Risk: A Meta-analysis. Asian Pac. J. Cancer Prev. 2014, 15, 10325–10328. [Google Scholar] [CrossRef] [PubMed]
- Guo, S.; Tan, L.; Pu, W.; Wu, J.; Xu, K.; Wu, J.; Li, Q.; Ma, Y.; Xu, J.; Jin, L. Quantitative assessment of the diagnostic role of APC promoter methylation in non-small cell lung cancer. Clin. Epigenet. 2014, 6, 5. [Google Scholar] [CrossRef] [PubMed]
- Chen, C.; Hua, H.; Han, C.; Cheng, Y.; Cheng, Y.; Wang, Z.; Bao, J. Prognosis value of MGMT promoter methylation for patients with lung cancer: A meta-analysis. Int. J. Clin. Exp. Pathol. 2015, 8, 11560–11564. [Google Scholar] [PubMed]
- Li, F.F.; Yang, Y.; Wang, X.L.; Hong, Y.Y.; Wang, N.F.; Chen, Z.D. Promoter methylation of DAPK gene may contribute to the pathogenesis of nonsmall cell lung cancer: A meta-analysis. Tumor Biol. 2014, 35, 6011–6020. [Google Scholar] [CrossRef] [PubMed]
- Song, X.; Shi, K.; Zhou, S.J.; Yu, D.P.; Liu, Z.; Han, Y. Clinicopathological significance and a potential drugtarget of RARβ in non-small-cell lung carcinoma: A meta-analysis and a systematic review. Drug Des. Dev. Ther. 2016, 10, 1345–1354. [Google Scholar]
- Guzmán, L.; Depix, M.S.; Salinas, A.M.; Roldán, R.; Aguayo, F.; Silva, A.; Vinet, R. Analysis of aberrant methylation on promoter sequences of tumor suppressor genes and total DNA in sputum samples: A promising tool for early detection of COPD and lung cancer in smokers. Diagn. Pathol. 2012, 7, 87. [Google Scholar] [CrossRef] [PubMed]
- Fariashesson, E.; Erikson, J.; Atkins, A.; Shen, P.; Davis, R.W.; Scharfe, C.; Pourmand, N. Semi-Automated Library Preparation for High-Throughput DNA Sequencing Platforms. Biomed. Res. Int. 2010, 2010, 617469. [Google Scholar]
- Herman, J.G.; Graff, J.R.; Myöhänen, S.; Nelkin, B.D.; Baylin, S.B. Methylation-specific PCR: A novel PCR assay for methylation status of CpG islands. Proc. Natl. Acad. Sci. USA 1996, 93, 9821–9826. [Google Scholar] [CrossRef] [PubMed]
- Cipriani, A.; Higgins, J.P.; Geddes, J.R.; Salanti, G. Conceptual and technical challenges in network meta-analysis. Ann. Intern. Med. 2013, 159, 130–137. [Google Scholar] [CrossRef] [PubMed]
- Mills, E.J.; Ioannidis, J.P.; Thorlund, K.; Schünemann, H.J.; Puhan, M.A.; Guyatt, G.H. How to use an article reporting a multiple treatment comparison meta-analysis. JAMA 2012, 308, 1246–1253. [Google Scholar] [CrossRef] [PubMed]
- Knobloch, K.; Yoon, U.; Vogt, P.M. Preferred reporting items for systematic reviews and meta-analyses (PRISMA) statement and publication bias. J. Cranio-Maxillo Fac. Surg. 2010, 39, 91–92. [Google Scholar] [CrossRef] [PubMed]
- Whiting, P.; Rutjes, A.W.; Dinnes, J.; Reitsma, J.; Bossuyt, P.M.; Kleijnen, J. Development and validation of methods for assessing the quality of diagnostic accuracy studies. Health Technol. Assess. 2004, 8, 1–234. [Google Scholar] [CrossRef]
- Bossuyt, P.M.; Reitsma, J.B.; Bruns, D.E.; Gatsonis, C.A.; Glasziou, P.P.; Irwig, L.M.; Lijmer, J.G.; Moher, D.; Rennie, D.; de Vet, H.C. Toward complete and accurate reporting of studies of diagnostic accuracy. The STARD initiative. Am. J. Clin. Pathol. 2003, 119, 18–22. [Google Scholar] [CrossRef] [PubMed]
- Devillé, W.L.; Buntinx, F.; Bouter, L.M.; Montori, V.M.; de Vet, H.C.; van der Windt, D.A.; Bezemer, P.D. Conducting systematic reviews of diagnostic studies: Didactic guidelines. BMC Med. Res. Methodol. 2002, 2, 9. [Google Scholar] [CrossRef]
- Kim, K.W.; Lee, J.; Sang, H.C.; Huh, J.; Park, S.H. Systematic Review and Meta-Analysis of Studies Evaluating Diagnostic Test Accuracy: A Practical Review for Clinical Researchers—Part I. General Guidance and Tips. Korean J. Radiol. 2015, 16, 1175–1187. [Google Scholar] [CrossRef] [PubMed]
- Dinnes, J.; Deeks, J.; Kirby, J.; Roderick, P. A methodological review of how heterogeneity has been examined in systematic reviews of diagnostic test accuracy. Health Technol. Assess. 2005, 9, 1–113. [Google Scholar] [CrossRef] [PubMed]
- Zamora, J.; Abraira, V.; Muriel, A.; Khan, K.; Coomarasamy, A. Meta-DiSc: A software for meta-analysis of test accuracy data. BMC Med. Res. Methodol. 2006, 6, 31. [Google Scholar] [CrossRef] [PubMed]
- Deeks, J.J.; Macaskill, P.; Irwig, L. The performance of tests of publication bias and other sample size effects in systematic reviews of diagnostic test accuracy was assessed. J. Clin. Epidemiol. 2005, 58, 882–893. [Google Scholar] [CrossRef] [PubMed]
- Song, F.; Clark, A.C.; Bachmann, M.O.; Maas, J. Simulation evaluation of statistical properties of methods for indirect and mixed treatment comparisons. BMC Med. Res. Methodol. 2012, 12, 138. [Google Scholar] [CrossRef] [PubMed]
- Lin, Q.; Chen, L.; Tang, Y.; Jing, W. The promoter hypermethylation of DAPK gene and p16 gene in sera from Chinese non-small cell lung cancer patients. Chin.-Ger. J. Clin. Oncol. 2006, 5, 184–188. [Google Scholar] [CrossRef]
- Liu, Y.; Lan, Q.; Shen, M.; Mumford, J.; Keohavong, P. Aberrant gene promoter methylation in sputum from individuals exposed to smoky coal emissions. Anticancer Res. 2008, 28, 2061–2066. [Google Scholar] [PubMed]
- Georgiou, E.; Valeri, R.; Tzimagiorgis, G.; Anzel, J.; Krikelis, D.; Tsilikas, C.; Sarikos, G.; Destouni, C.; Dimitriadou, A.; Kouidou, S. Aberrant p16 promoter methylation among Greek lung cancer patients and smokers: Correlation with smoking. Eur. J. Cancer Prev. 2007, 16, 396–402. [Google Scholar] [CrossRef] [PubMed]
- Sato, K.C.T.; Yukio, M.M.D.; Masakatsu, F.C.T.; Yujian, S.M.D.; Daye, W.M.D.; Ryota, T.M.D.; Yuko, M.M.D.; Iijima, T.; Noguchi, M. Anthracotic index and DNA methylation status of sputum contents can be used for identifying the population at risk of lung carcinoma. Cancer Cytopathol. 2004, 102, 348–354. [Google Scholar]
- Olaussen, K.A.; Soria, J.C.; Park, Y.W.; Kim, H.J.; Kim, S.H.; Ro, J.Y.; André, F.; Jang, S.J. Assessing abnormal gene promoter methylation in paraffin-embedded sputum from patients with NSCLC. Eur. J. Cancer 2005, 41, 2112–2119. [Google Scholar] [CrossRef] [PubMed]
- Ma, V.D.D.; Prinsen, C.F.; Hol, B.E.; Bolijn, A.S.; Jeunink, M.A.; Dekhuijzen, P.N.; Thunnissen, F.B. Can free DNA be detected in sputum of lung cancer patients? Lung Cancer 2008, 61, 385–390. [Google Scholar]
- Hubers, A.J.; Brinkman, P.; Boksem, R.J.; Rhodius, R.J.; Witte, B.I.; Zwinderman, A.H.; Heideman, D.A.M.; Duin, S.; Koning, R.; Steenbergen, R.D.M. Combined sputum hypermethylation and eNose analysis for lung cancer diagnosis. J. Clin. Pathol. 2014, 67, 707–711. [Google Scholar] [CrossRef] [PubMed]
- Leng, S.; Do, K.; Yingling, C.M.; Picchi, M.A.; Wolf, H.J.; Kennedy, T.C.; Feser, W.J.; Baron, A.E.; Franklin, W.A.; Brock, M.V. Defining a Gene Promoter Methylation Signature in Sputum for Lung Cancer Risk Assessment. Clin. Cancer Res. 2012, 18, 3387–3395. [Google Scholar] [CrossRef] [PubMed]
- Hwang, S.H.; Kim, K.U.; Kim, J.E.; Kim, H.H.; Lee, M.K.; Lee, C.H.; Lee, S.Y.; Oh, T.; An, S. Detection of HOXA9 gene methylation in tumor tissues and induced sputum samples from primary lung cancer patients. Clin. Chem. Lab. Med. 2011, 49, 699–704. [Google Scholar] [CrossRef] [PubMed]
- Hulbert, A.; Jusue-Torres, I.; Stark, A.; Chen, C.; Rodgers, K.; Lee, B.; Griffin, C.; Yang, A.; Huang, P.; Wrangle, J. Early Detection of Lung Cancer Using DNA Promoter Hypermethylation in Plasma and Sputum. Clin. Cancer Res. 2016. [Google Scholar] [CrossRef] [PubMed]
- Kang, C.Y.; Wang, D.D.; Tang, S.P.; Xiao, H. Effect of promoter hypermethylation of FHIT, P16, MGMT, RASSF1A and APC genes in sputum specimens on diagnosis of lung cancer. Chin. J. Clin. Exp. Pathol. 2011, 27, 869–873. [Google Scholar]
- Belinsky, S.A.; Klinge, D.M.; Dekker, J.D.; Smith, M.W.; Bocklage, T.J.; Gilliland, F.D.; Crowell, R.E.; Karp, D.D.; Stidley, C.A.; Picchi, M.A. Gene promoter methylation in plasma and sputum increases with lung cancer risk. Clin. Cancer Res. 2005, 11, 6505–6511. [Google Scholar] [CrossRef] [PubMed]
- Yun, S.; Fang, H.B.; Feng, J. Integrating DNA methylation and microRNA biomarkers in sputum for lung cancer detection. Clin. Epigenet. 2016, 8, 109. [Google Scholar]
- Destro, A.; Bianchi, P.; Alloisio, M.; Laghi, L.; Di, G.S.; Malesci, A.; Cariboni, U.; Gribaudi, G.; Bulfamante, G.; Marchetti, A. K-ras and p16(INK4A)alterations in sputum of NSCLC patients and in heavy asymptomatic chronic smokers. Lung Cancer 2004, 44, 23–32. [Google Scholar] [CrossRef] [PubMed]
- Shin, K.C.; Lee, K.H.; Lee, C.H.; Shin, I.H.; Suh, H.S.; Jeon, C.H. MAGE A1–A6 RT-PCR and MAGE A3 and p16 methylation analysis in induced sputum from patients with lung cancer and non-malignant lung diseases. Oncol. Rep. 2012, 27, 911–916. [Google Scholar] [PubMed]
- Hubers, A.J.; Ma, V.D.D.; Prinsen, C.F.; Witte, B.I.; Wang, Y.; Shivapurkar, N.; Stastny, V.; Bolijn, A.S.; Hol, B.E.; Feng, Z. Methylation analysis in spontaneous sputum for lung cancer diagnosis. Lung Cancer 2014, 84, 127–133. [Google Scholar] [CrossRef] [PubMed]
- Cirincione, R.; Lintas, C.; Conte, D.; Mariani, L.; Roz, L.; Vignola, A.M.; Pastorino, U.; Sozzi, G. Methylation profile in tumor and sputum samples of lung cancer patients detected by spiral computed tomography: A nested case–control study. Int. J. Cancer 2006, 118, 1248. [Google Scholar] [PubMed]
- Wang, Y.C.; Hsu, H.S.; Chen, T.P.; Chen, J.T. Molecular Diagnostic Markers for Lung Cancer in Sputum and Plasma. Ann. N. Y. Acad. Sci. 2006, 1075, 179–184. [Google Scholar] [CrossRef] [PubMed]
- Hubers, A.J.; Heideman, D.A.; Herder, G.J.; Burgers, S.A.; Sterk, P.J.; Kunst, P.W.; Smit, H.J.; Postmus, P.E.; Witte, B.I.; Duin, S. Prolonged sampling of spontaneous sputum improves sensitivity of hypermethylation analysis for lung cancer. J. Clin. Pathol. 2012, 65, 541–545. [Google Scholar] [CrossRef] [PubMed]
- Belinsky, S.A.; Liechty, K.C.; Gentry, F.D.; Wolf, H.J.; Rogers, J.; Vu, K.; Haney, J.; Kennedy, T.C.; Hirsch, F.R.; Miller, Y. Promoter hypermethylation of multiple genes in sputum precedes lung cancer incidence in a high-risk cohort. Cancer Res. 2006, 66, 3338. [Google Scholar] [CrossRef] [PubMed]
- Zhang, W.; Sun, Y.; Lu, G. The diagnostic value of determination of p16 methylation of sputum exfoliated cells for peripheral lung cancer. China J. Mod. Med. 2004, 7, 46–49. [Google Scholar]
- Peng, Z.; Shan, C.; Wang, H. Value of promoter methylation of RASSF1A, p16, and DAPK genes in induced sputum in diagnosing lung cancers. J. Cent. South Univ. Med. Sci. 2010, 35, 247–253. [Google Scholar]
- Wu, X.M.; Chen, Y.; Shao, Y.; Zhou, X.L.; Tang, W.R. Association between cigarette smoking and RASSF1A gene promoter hypermethylation in lung cancer patients: A meta- analysis. Asian Pac. J. Cancer Prev. 2014, 15, 8451–8454. [Google Scholar] [CrossRef] [PubMed]
- Hu, Z.J.; Liu, D.Y.; Hu, H.B.; Chen, Y.P.; Chen, J.P.; Tan, H.C.; Zhou, J.G.; Liu, H.L.; Zhong, Y. Clinical significance at diagnosis of lung cancer by detecting aberrant p16 promoter methylation in suspicious lung cancer patients. Chin. J. Pract. Intern. Med. 2009, 72, 302–308. [Google Scholar]
- Zhuo-Jun, H.U.; Hong-Bo, H.U.; Liu, D.Y.; Chen, Y.P. Clinical significance of detection of p16 gene methylation in early diagnosis of lung cancer. Chin. J. Pathophysiol. 2009, 25, 1941–1945. [Google Scholar]
- Guo, X.J. Diagnostic value of combinative detection of hypermethylation of p16 gene and cytokeratin 19 fragment and CA15-3 antigen for non-small cell lung cancer patients. Clin. Focus 2008, 23, 1067–1070. [Google Scholar]
- Ming, L.; Liu, J.; Bing, L.; Zhai, F.; Wang, A.; Yuanqiu, X. Diagnostic value of hypermethylation of p16 and MGMT genes in sputum specimens for lung cancer. Tumor 2006, 26, 1020–1023. [Google Scholar]
- Sun, N.; Zhang, L.; Liu, Y.Y.; Zheng, S.Y.; Zhao, X. Methylation of P16 and RASSF1A Genes in Sputum Samples Associated with Peripheral Non-Small Cell Lung Cancer. Prog. Mod. Biomed. 2012, 13, 045. [Google Scholar]
- Pan, J.; Fan, H.J.; Jiang, Y.; Dan, M.A.; Wang, J.; Xia, C. P16~(INK4a) gene methylation in sputum, blood and bronchoscopic biopsies and lung cancer. J. Clin. Pulm. Med. 2013, 6, 058. [Google Scholar]
- Wang, X.; Cao, A.; Peng, M.; Chunfeng, H.U.; Liu, D.; Gu, T.; Liu, H. The value of chest CT scan and tumor markers detection in sputum for early diagnosis of peripheral lung cancer. Chin. J. Lung Cancer 2004, 7, 58–63. [Google Scholar]
- Hubers, A.J.; Heideman, D.A.M.; Burgers, S.A.; Herder, G.J.M.; Sterk, P.J.; Rhodius, R.J.; Smit, H.J.; Krouwels, F.; Welling, A.; Witte, B.I. DNA hypermethylation analysis in sputum for the diagnosis of lung cancer: Training validation set approach. Br. J. Cancer 2015, 112, 1105–1113. [Google Scholar] [CrossRef] [PubMed]
- Sinčić, N.; Herceg, Z. DNA methylation and cancer: Ghosts and angels above the genes. Curr. Opin. Oncol. 2011, 23, 69–76. [Google Scholar]
- Wang, X.; Ling, L.; Su, H.; Cheng, J.; Jin, L. Aberrant methylation of genes in sputum samples as diagnostic biomarkers for non-small cell lung cancer: A meta-analysis. Asian Pac. J. Cancer Prev. 2014, 15, 4467–4474. [Google Scholar] [CrossRef] [PubMed]
- Shiga, T.; Wajima, Z.; Inoue, T.; Sakamoto, A. Predicting difficult intubation in apparently normal patients: A meta-analysis of bedside screening test performance. Anesthesiology 2005, 103, 429–437. [Google Scholar] [CrossRef] [PubMed]
- Jiang, Y.; Cui, L.; Chen, W.D.; Shen, S.H.; Ding, L.D. The prognostic role of RASSF1A promoter methylation in breast cancer: A meta-analysis of published data. PLoS ONE 2012, 7, e36780. [Google Scholar] [CrossRef] [PubMed]
- Shou, F.; Feng, X.; Gang, L.; Zhao, Z.; Ying, M.; Yang, F.; Wang, H.; Guo, H. RASSF1A promoter methylation is associated with increased risk of thyroid cancer: A meta-analysis. Oncotargets Ther. 2017, 10, 247–257. [Google Scholar] [CrossRef] [PubMed]
- Si, J.G.; Su, Y.Y.; Han, Y.H.; Chen, R.H. Role of RASSF1A promoter methylation in the pathogenesis of ovarian cancer: A meta-analysis. Genet. Test. Mol. Biomark. 2014, 18, 394–402. [Google Scholar] [CrossRef] [PubMed]
- Wang, H.L.; Zhang, Y.; Liu, P.; Zhou, P.Y. Aberrant promoter methylation of RASSF1A gene may be correlated with colorectal carcinogenesis: A meta-analysis. Mol. Biol. Rep. 2014, 41, 3991–3999. [Google Scholar] [CrossRef] [PubMed]
- Qi, D.; Li, J.; Jiang, M.; Liu, C.; Hu, Y.; Li, M.X.; Su, J.L.; Que, B.; Ji, W.D. The relationship between promoter methylation of p16 gene and bladder cancer risk: A meta-analysis. Int. J. Clin. Exp. Med. 2015, 8, 20701–20711. [Google Scholar] [PubMed]
- Feng, W.; Han, Z.; Zhu, R.; Liu, P.; Liu, S. Association of p16 gene methylation with prostate cancer risk: A meta-analysis. J. BUON 2015, 20, 1074–1080. [Google Scholar] [PubMed]
- Wang, W.; Li, T.; Wang, X.L.; Yuan, W.X.; Cheng, Y.Y.; Zhang, H.Y.; Xu, E.Q.; Zhang, Y.M.; Shi, S.; Ma, D.L.; et al. FAM19A4 is a novel cytokine ligand of formyl peptide receptor 1 (FPR1) and is able to promote the migration and phagocytosis of macrophages. Cell. Mol. Immunol. 2015, 12, 615–624. [Google Scholar] [CrossRef] [PubMed]
- Yan, W.; Xu, N.; Han, X.; Zhou, X.M.; He, B. The clinicopathological significance of FHIT hypermethylation in non-small cell lung cancer, a meta-analysis and literature review. Sci. Rep. 2016, 6, 19303. [Google Scholar] [CrossRef] [PubMed]
- Fong, K.M.; Biesterveld, E.J.; Virmani, A.; Wistuba, I.; Sekido, Y.; Bader, S.A.; Ahmadian, M.; Rassool, F.V.; Zimmerman, P.V.; Giaccone, G.; et al. FHIT and FRA3B 3p14.2 allele loss are common in lung cancer and preneoplastic bronchial lesions and are associated with cancer-related FHIT cDNA splicing aberrations. Cancer Res. 1997, 57, 2256–2267. [Google Scholar] [PubMed]
- Gu, C.M.; Lu, J.C.; Cui, T.P.; Lu, C.; Shi, H.; Xu, W.M.; Yuan, X.L.; Yang, X.B.; Huang, Y.X.; Lu, M.X. Association between MGMT Promoter Methylation and Non-Small Cell Lung Cancer: A Meta-Analysis. PLoS ONE 2013, 8, e72633. [Google Scholar] [CrossRef] [PubMed]
- Atakpo, P.; Vassar, M. Publication bias in dermatology systematic reviews and meta-analyses. J. Dermatol. Sci. 2016, 82, 69–74. [Google Scholar] [CrossRef] [PubMed]
- Lorenc, T.; Felix, L.; Petticrew, M.; Melendez-Torres, G.J.; Thomas, J.; Thomas, S.; O’Mara-Eves, A.; Richardson, M. Meta-analysis, complexity, and heterogeneity: A qualitative interview study of researchers’ methodological values and practices. Syst. Rev. 2016, 5, 192. [Google Scholar] [CrossRef] [PubMed]
- He, A.; Song, D.; Zhang, L.; Li, C. Unveiling the relative efficacy, safety and tolerability of prophylactic medications for migraine: Pairwise and network-meta analysis. J. Headache Pain 2017, 18, 26. [Google Scholar] [CrossRef] [PubMed]
- Lee, G.; Oh, S.W.; Hwang, S.S.; Yoon, J.W.; Kang, S.; Joh, H.K. Comparative effectiveness of oral antidiabetic drugs in preventing cardiovascular mortality and morbidity: A network meta-analysis. PLoS ONE 2017, 12, e0177646. [Google Scholar] [CrossRef] [PubMed]
- Jupiter, D.C. Made to Measure: Designs Tailored to Your Study Needs. J. Foot Ankle Surg. 2015, 54, 1001–1002. [Google Scholar] [CrossRef] [PubMed]
- Setia, M.S. Methodology Series Module 2: Case-control Studies. Indian J. Dermatol. 2016, 61, 146–151. [Google Scholar] [CrossRef] [PubMed]

| Study/Year | Country | Cases/Controls | Biomarkers | STARD | QUADAS |
|---|---|---|---|---|---|
| Destro/2004 [41] | Italy | 24/100 | p16 | 21 | 12 |
| Zhang/2004 [48] | China | 44/20 | p16 | 18 | 8 |
| Wang/2004 [57] | China | 34/21 | p16 | 17 | 7 |
| Konno/2004 [31] | Japan | 78/94 | p16, APC, RARβ | 20 | 11 |
| Belinsky/2005 [39] | USA | 53/118 | p16, MGMT, RASSF1A, DAP, H-cadherin, PAX5 | 20 | 9 |
| Olaussen/2005 [32] | France | 20/17 | HOXA9, p16, MAGE | 17 | 8 |
| Cirincione/2006 [44] | Italy | 18/112 | RARβ, p16, RASSF1A | 15 | 7 |
| Wang/2006 [45] | China | 79/22 | FHIT, p16, RARβ | 20 | 10 |
| Liu/2006 [54] | China | 77/30 | MGMT | 18 | 8 |
| Belinsky/2006 [47] | USA | 98/92 | p16, PAX5, MGMT, DAPK, GATA, RASSF1ASFRP1, HLHPBETA3, IGFBP3HCAD, LAMC2 | 20 | 10 |
| Georgiou/2007 [30] | Greece | 80/40 | p16 | 16 | 9 |
| Hsu/2007 [5] | China | 82/37 | p16, RARβ | 16 | 7 |
| Liu/2008 [29] | China | 58/107 | p16 | 18 | 10 |
| Guo/2008 [53] | China | 100/50 | p16 | 16 | 7 |
| Van der Drift/2008 [33] | Netherlands | 28/68 | RASSF1A | 19 | 11 |
| Hu/2009 [51] | China | 42/25 | p16 | 16 | 9 |
| Ye/2010 [49] | China | 30/27 | RASSF1A | 16 | 7 |
| Zhang/2010 [49] | China | 82/25 | RASSF1A, p16, DAPK | 18 | 8 |
| Hwang/2011 [36] | Korea | 76/109 | HOXA | 20 | 9 |
| Song/2011 [28] | China | 42/9 | p16, MGMT | 17 | 8 |
| Zhang/2011 [52] | China | 41/15 | p16 | 17 | 9 |
| Hang/2011 [38] | China | 47/24 | FHIT | 20 | 8 |
| Sun/2012 [55] | China | 120/120 | p16, RASSF1A | 19 | 7 |
| Hubers/2012 [46] | The Netherlands | 53/47 | RASSF1A, APC, CYGB | 18 | 10 |
| Guzmán/2012 [14] | Chile | 26/33 | p16, CDH1, MGMT | 18 | 11 |
| Shin/2012 [42] | Korea | 65/30 | MAGE, p16 | 17 | 9 |
| Leng/2012 [35] | USA | 64/64 | p16, MGMT, DAPK, PAX5, GATA, Dal-1, PCDH20, Jph3, Kifla, SULF2, RASSFlA, GATA, Dab2, Dcr2, RASSF2, TCF2l | 20 | 11 |
| Leng/2012 [35] | USA | 40/90 | p16, MGMT, DAPK, PAX5, GATA, Dal-1, PCDH20, Jph3, Kifla, SULF2, CXCL, RASSFlA, Dab2, Dcr2, RASSF2, TCF2l | 20 | 11 |
| Pan/2013 [56] | China | 20/13 | p16 | 19 | 8 |
| Hubers/2014 [34] | The Netherlands | 20/31 | RASSF1A, APC, CYGB, 3OST, PRDM14, FAM19A4, PHACTR3 | 19 | 8 |
| Hubers/2014 [43] | The Netherlands | 98/90 | RASSF1A, APC, CYGB | 20 | 10 |
| Hubers/2014 [43] | The Netherlands | 60/445 | RASSF1A, APC, CYGB | 20 | 10 |
| Hubers/2015 [58] | The Netherlands | 73/86 | RASSF1A, APC, CYGB, 3OST2, PRDM14, FAM19A4, PHACTR3 | 21 | 11 |
| Hubers/2015 [58] | The Netherlands | 159/154 | RASSF1A, APC, CYGB, 3OST2, PRDM14, FAM19A4, PHACTR3 | 21 | 11 |
| Su/2016 [40] | China | 117/174 | RASSF1A, 3OST2, PRDM14 | 18 | 7 |
| Hulbert/2016 [37] | USA | 90/24 | SOX17, TAC1, CDO1, HOXA, ZFP42 | 16 | 9 |
| Genes | Study-Case/Control | SEN (95% CI) | SPE (95% CI) | PLR (95% CI) | NLR (95% CI) | DOR (95% CI) |
|---|---|---|---|---|---|---|
| CDH1 | 1–26/33 | 0.35 (0.17–0.56) | 0.70 (0.51–0.84) | 1.14 (0.55–2.39) | 0.94 (0.66–1.00) | 1.22 (0.41–3.65) |
| SOX17 | 1–90/24 | 0.84 (0.75–0.91 | 0.88 (0.68–0.97) | 6.76 (2.34–19.54) | 0.18 (0.11–0.29) | 38.00 (9.98–144.73) |
| CDO1 | 1–90/24 | 0.78 (0.68–0.86) | 0.67 (0.45–0.84) | 2.32 (1.31–4.15) | 0.33 (0.21–0.54) | 7.00 (2.62–18.72) |
| ZFP42 | 1–90/24 | 0.87 (0.78–0.93) | 0.63 (0.41–0.81) | 2.31 (1.37–3.90) | 0.21 (0.12–0.39) | 10.83 (3.88–30.22 |
| TAC1 | 1–90/24 | 0.86 (0.77–0.92) | 0.75 (0.53–0.90) | 3.42 (1.70–6.88) | 0.19 (0.11–0.33) | 17.77 (5.94–53.12) |
| H-cadherin | 1–53/118 | 0.50 (0.23–0.77) | 0.57 (0.46–0.68) | 1.18 (0.66–2.11) | 0.87 (0.50–1.00) | 1.35 (0.43–4.22) |
| FHIT | 2–126/46 | 0.52 (0.43–0.61) | 0.91 (0.79–0.98) | 5.93 (2.29–15.36) | 0.53 (0.43–0.65) | 11.19 (3.79–33.06) |
| PCDH20 | 2–104/154 | 0.58 (0.48–0.67) | 0.49 (0.41–0.58) | 1.14 (0.91–1.43) | 0.86 (0.65–1.00) | 1.33 (0.80–2.19) |
| Dab2 | 2–104/154 | 0.03 (0.01–0.08) | 0.99 (0.95–1.00) | 2.22 (0.38–13.06) | 0.98 (0.95–1.00) | 2.26 (0.37–13.75) |
| Dcr2 | 2–104/154 | 0.41 (0.32–0.51) | 0.60 (0.52–0.68) | 1.03 (0.76–1.38) | 0.98 (0.80–1.00) | 1.05 (0.63–1.73) |
| SULF2 | 2–104/154 | 0.51 (0.41–0.61) | 0.57 (0.49–0.65) | 1.19 (0.91–1.55) | 0.86 (0.68–1.00) | 1.39 (0.84–2.28) |
| Kifla | 2–104/154 | 0.44 (0.34–0.54 | 0.62 (0.54–0.70 | 1.17 (0.87–1.58) | 0.89 (0.72–1.00) | 1.31 (0.79–2.18) |
| Dal-1 | 2–104/154 | 0.30 (0.21–0.39 | 0.86 (0.80–0.91 | 2.17 (1.32–3.55) | 0.82 (0.71–0.94) | 2.65 (1.42–4.94) |
| Jph3 | 2–104/154 | 0.31 (0.23–0.41 | 0.79 (0.721–0.85 | 1.47 (0.97–2.22) | 0.87 (0.75–1.00) | 1.68 (0.96–2.95) |
| RASSF2 | 2–104/154 | 0.08 (0.03–0.15) | 0.95 (0.91–0.98) | 1.69 (0.63–4.52) | 0.97 (0.91–1.00) | 1.75 (0.61–4.98) |
| TCF2l | 2–104/154 | 0.29 (0.20–0.39) | 0.71 (0.63–0.78) | 0.99 (0.67–1.46) | 1.01 (0.86–1.00) | 0.98 (0.57–1.70) |
| CXCL | 2–80/180 | 0.36 (0.26–0.48 | 0.79 (0.72–0.85 | 1.72 (1.15–2.58) | 0.81 (0.67–0.97) | 2.12 (1.19–23.79) |
| MAGE | 4–202/118 | 0.45 (0.34–0.55 | 0.82 (0.56–0.94 | 2.44 (0.75–7.96 | 0.68 (0.47–0.99 | 3.60 (0.76–16.98 |
| HOXA | 4–276/174 | 0.79 (0.63–0.89) | 0.50 (0.16–0.84) | 1.56 (0.80–3.07) | 0.43 (0.28–0.66) | 3.63 (1.28–10.26) |
| RARβ | 4–257/223 | 0.44 (0.29–0.60) | 0.79 (0.58–0.91) | 2.09 (0.93–4.70) | 0.71 (0.52–0.98) | 2.93 (0.99–8.69) |
| FAM19A4 | 3–252/271 | 0.80 (0.74–0.85 | 0.25 (0.20–0.30) | 1.06 (0.97–1.16) | 0.82 (0.59–1.00) | 1.29 (0.86–1.96) |
| PHACTR3 | 3–252/271 | 0.60 (0.53–0.66 | 0.68 (0.62–0.73) | 1.85 (1.52–2.27) | 0.60 (0.50–0.71) | 3.11 (2.17–4.45) |
| DAPK | 5–337/389 | 0.45 (0.40–0.51) | 0.79 (0.64–0.89) | 2.16 (1.13–4.14) | 0.69 (0.58–0.86) | 3.12 (1.32–7.36) |
| 3OST2 | 4–369/445 | 0.50 (0.45–0.55) | 0.85 (0.82–0.88) | 3.36 (2.63–4.30) | 0.59 (0.53–0.66) | 5.71 (4.10–7.96) |
| PRDM14 | 4–369/445 | 0.62 (0.57–0.67) | 0.76 (0.72–0.80) | 2.63 (2.19–3.17) | 0.50 (0.43–0.57) | 5.30 (3.91–7.17) |
| GATA | 6–404/492 | 0.66 (0.31–0.90) | 0.53 (0.33–0.71) | 1.40 (1.16–1.69) | 0.64 (0.34–1.21) | 2.20 (1.01–4.83) |
| MGMT | 8–447/460 | 0.42 (0.32–0.52) | 0.91 (0.77–0.97) | 4.78 (1.47–15.55) | 0.64 (0.50–0.81) | 7.48 (1.87–29.91) |
| PAX5 | 8–510/728 | 0.37 (0.29–0.45) | 0.78 (0.70–0.84) | 1.65 (1.28–2.12) | 0.81 (0.74–0.90) | 2.02 (1.45–2.83) |
| CYGB | 6–453/853 | 0.51 (0.45–0.57) | 0.79 (0.69–0.88) | 2.39 (1.61–3.56) | 0.62 (0.54–0.72) | 3.83 (2.28–6.44) |
| APC | 8–588/928 | 0.43 (0.34–0.53) | 0.87 (0.71–0.95) | 3.30 (1.67–6.51) | 0.65 (0.59–0.72) | 5.06 (2.55–10.04) |
| p16 | 24–1357/1249 | 0.48 (0.40–0.56) | 0.90 (0.82–0.95) | 4.71 (2.53–8.78) | 0.58 (0.50–0.68) | 8.11 (3.94–16.70) |
| RASSF1A | 17–1160/1767 | 0.28 (0.20–0.38) | 0.95 (0.93–0.97) | 5.61 (3.73–8.43) | 0.76 (0.67–0.85) | 7.40 (4.54–12.06) |
| Summary | 33–2238/2563 | 0.46 (0.41–0.50) | 0.83 (0.80–0.86) | 2.72 (2.32–3.22) | 0.64 (0.60–0.68) | 4.28 (3.50–5.20) |
| Analysis | SEN (95% CI) | SPE (95% CI) | PLR (95% CI) | NLR (95% CI) | DOR (95% CI) |
|---|---|---|---|---|---|
| Ethnicity | |||||
| Asian | 0.46 (0.44–0.48) | 0.84 (0.93–0.86) | 4.04 (2.91–5.62) | 0.61 (0.55–0.66) | 6.50 (4.73–8.92) |
| Others | 0.47 (0.46–0.48) | 0.75 (0.74–0.75) | 1.88 (1.68–2.10) | 0.72 (0.68–0.77) | 2.92 (2.46–3.47) |
| Sample size | |||||
| 0–100 | 0.48 (0.46–0.51) | 0.85 (0.83–0.88) | 4.13 (2.80–6.08) | 0.59 (0.54–0.65) | 7.80 (5.22–11.65) |
| 101–200 | 0.45 (0.44–0.46) | 0.75 (0.74–0.76) | 1.78 (1.58–2.00) | 0.73 (0.69–0.78) | 2.75 (2.29–3.31) |
| 201– | 0.51 (0.48–0.53) | 0.76 (0.74–0.77) | 2.52 (1.85–3.44) | 0.65 (0.59–0.73) | 3.94 (2.68–5.42) |
© 2017 by the authors. Licensee MDPI, Basel, Switzerland. This article is an open access article distributed under the terms and conditions of the Creative Commons Attribution (CC BY) license (http://creativecommons.org/licenses/by/4.0/).
Share and Cite
Liu, D.; Peng, H.; Sun, Q.; Zhao, Z.; Yu, X.; Ge, S.; Wang, H.; Fang, H.; Gao, Q.; Liu, J.; et al. The Indirect Efficacy Comparison of DNA Methylation in Sputum for Early Screening and Auxiliary Detection of Lung Cancer: A Meta-Analysis. Int. J. Environ. Res. Public Health 2017, 14, 679. https://doi.org/10.3390/ijerph14070679
Liu D, Peng H, Sun Q, Zhao Z, Yu X, Ge S, Wang H, Fang H, Gao Q, Liu J, et al. The Indirect Efficacy Comparison of DNA Methylation in Sputum for Early Screening and Auxiliary Detection of Lung Cancer: A Meta-Analysis. International Journal of Environmental Research and Public Health. 2017; 14(7):679. https://doi.org/10.3390/ijerph14070679
Chicago/Turabian StyleLiu, Di, Hongli Peng, Qi Sun, Zhongyao Zhao, Xinwei Yu, Siqi Ge, Hao Wang, Honghong Fang, Qing Gao, Jiaonan Liu, and et al. 2017. "The Indirect Efficacy Comparison of DNA Methylation in Sputum for Early Screening and Auxiliary Detection of Lung Cancer: A Meta-Analysis" International Journal of Environmental Research and Public Health 14, no. 7: 679. https://doi.org/10.3390/ijerph14070679