The Fate of Pollutants in Porous Asphalt Pavements, Laboratory Experiments to Investigate Their Potential to Impact Environmental Health

Abstract
:1. Introduction
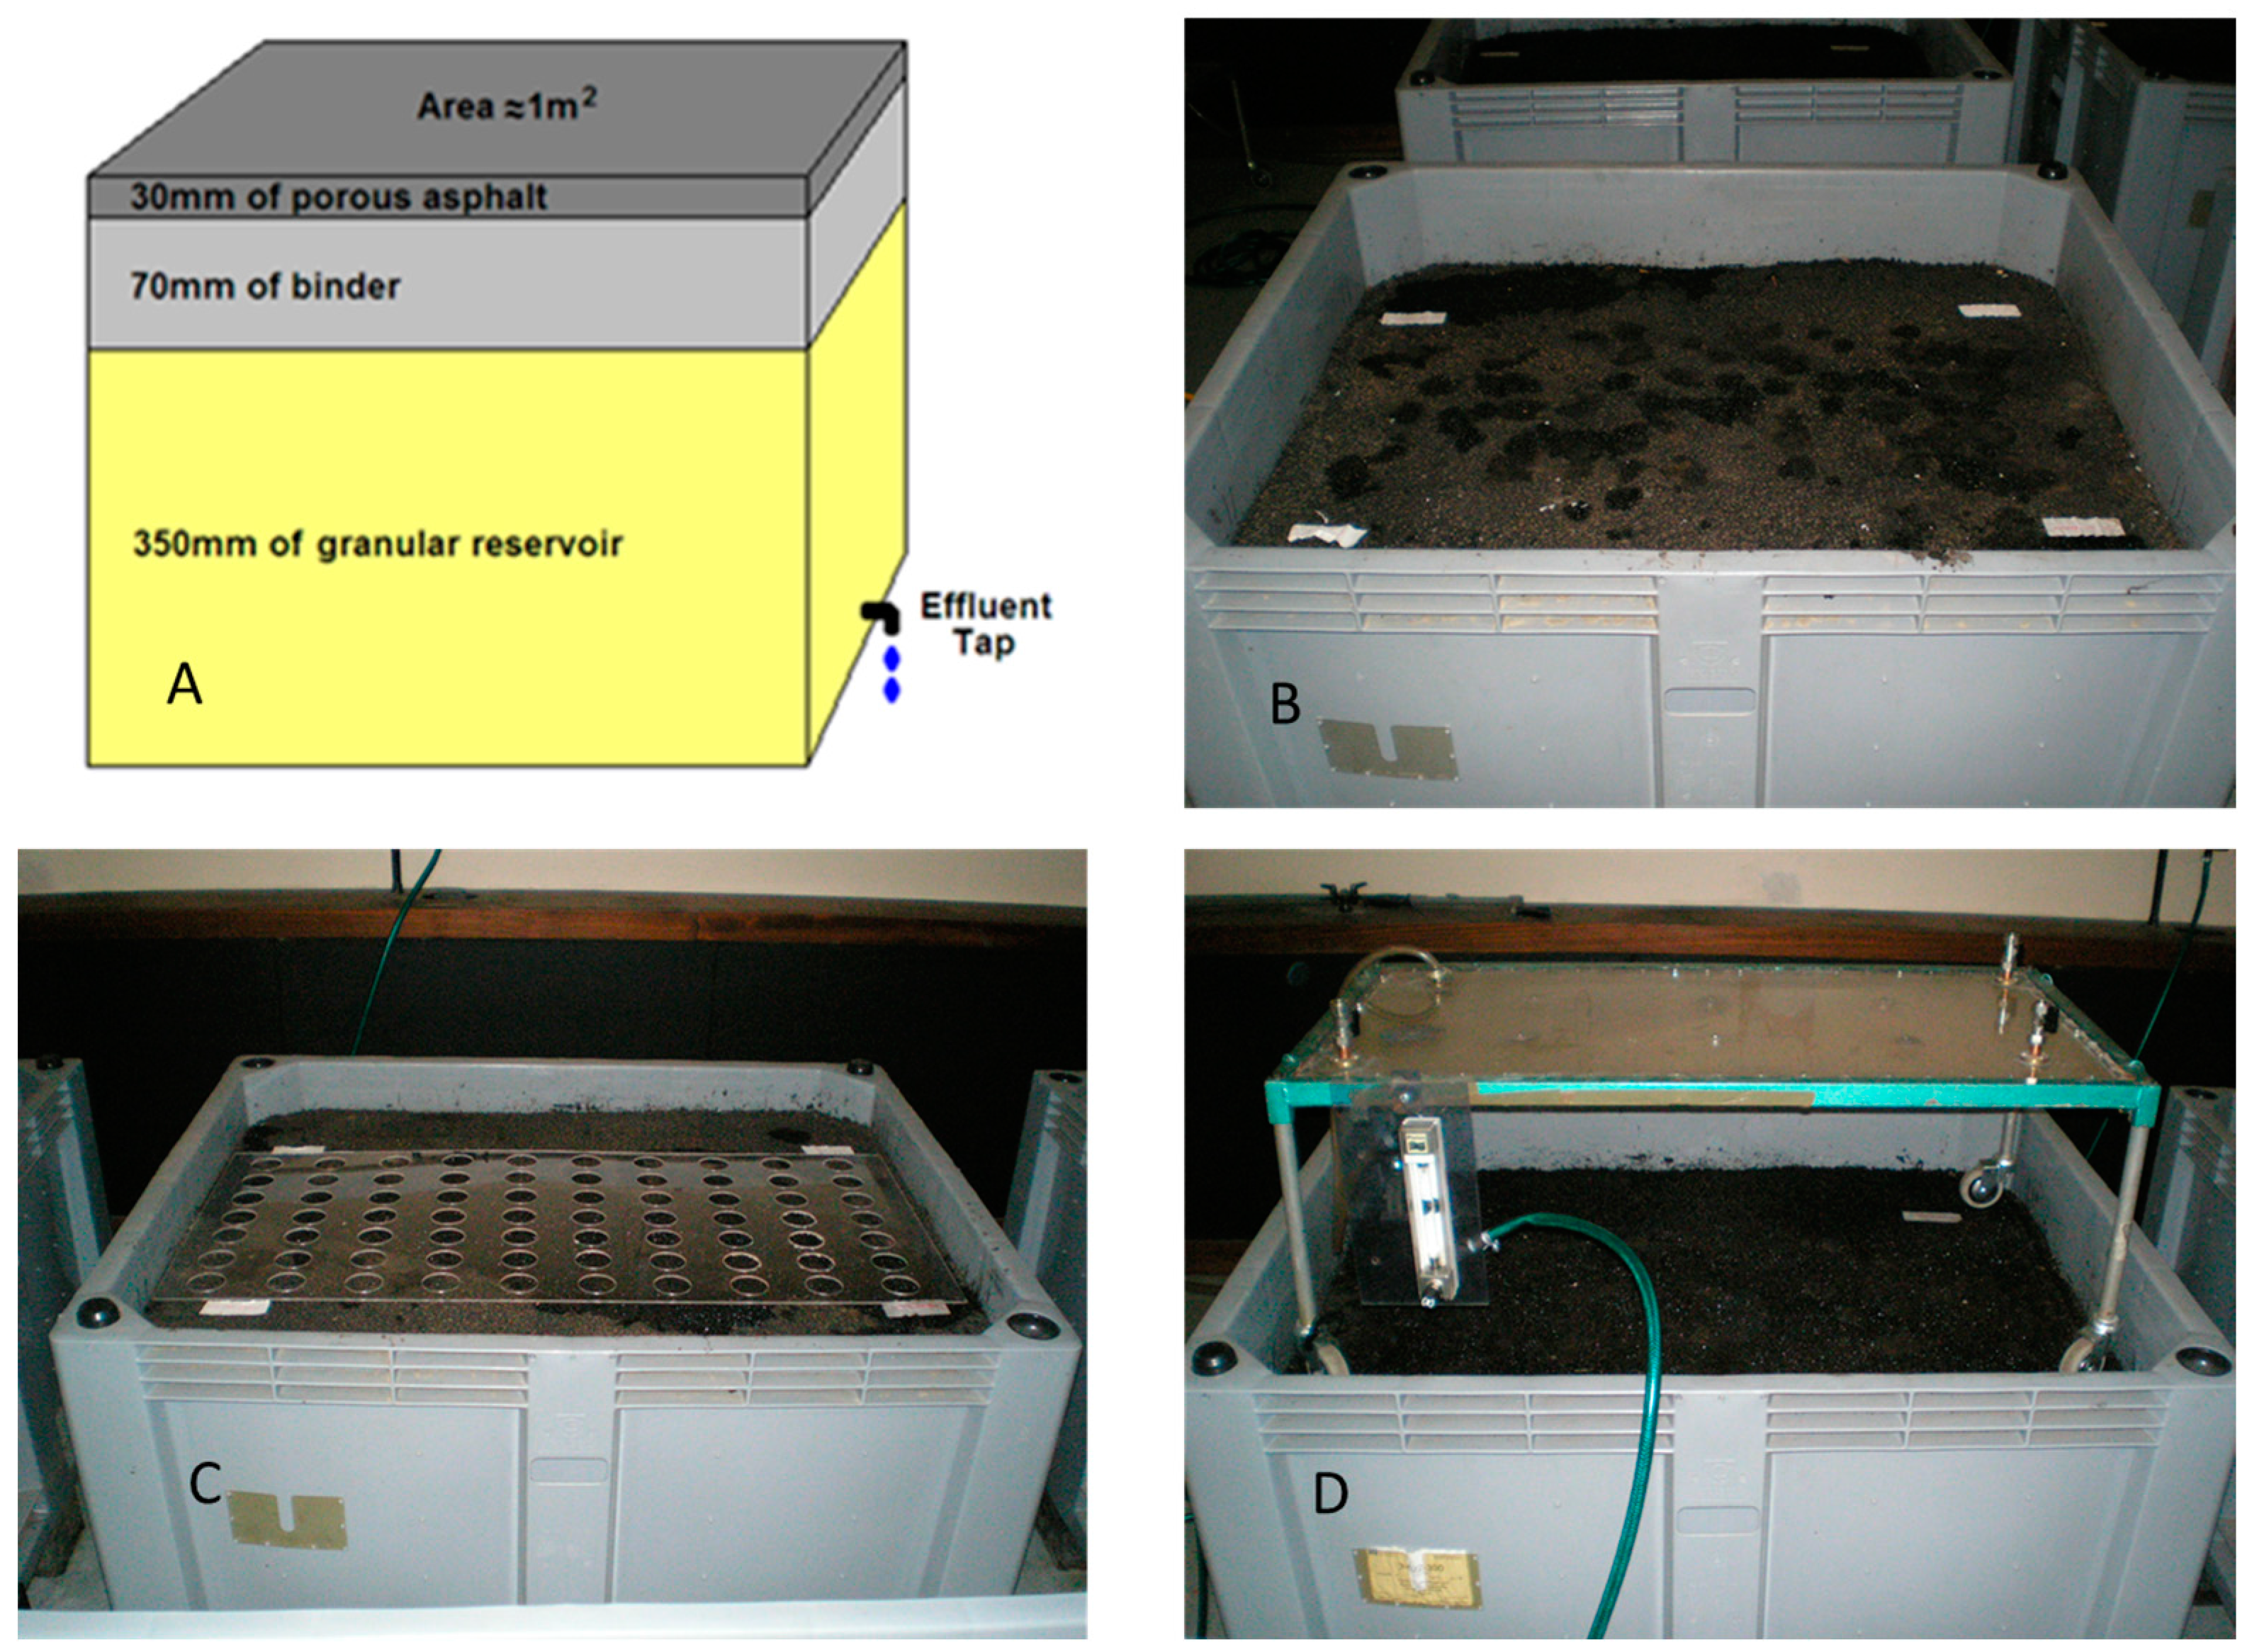
2. Materials and Methods
2.1. Monthly Monitoring to Assess Pollutant Treatment
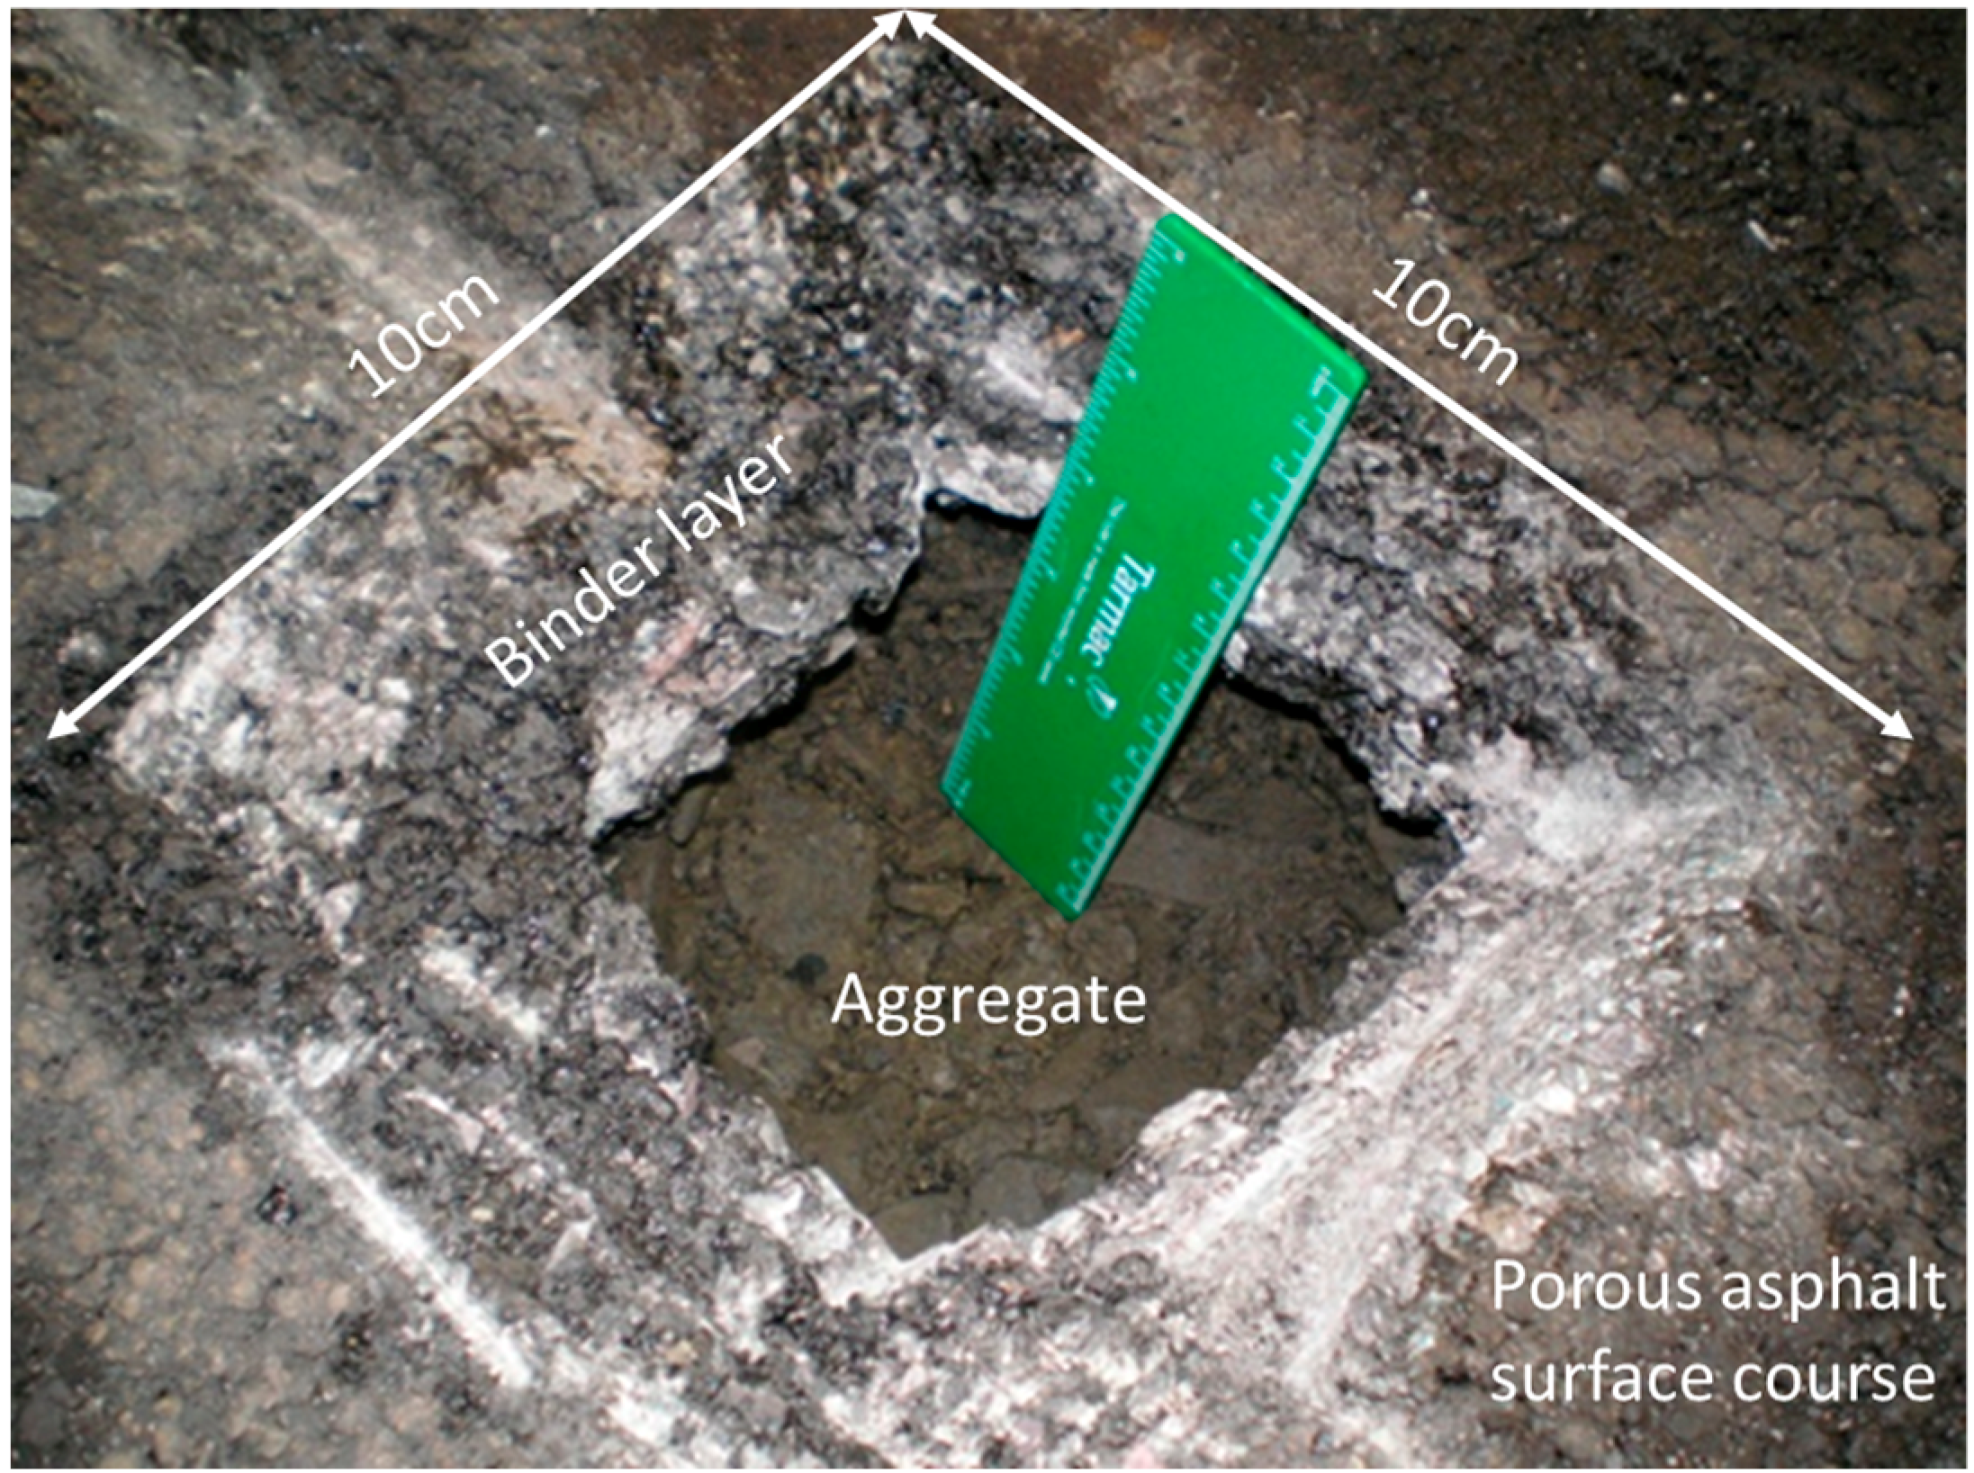
2.2. Coring Exercise Methodology
2.3. Analytical Methodology
3. Results and Discussion
3.1. Heavy Metals in RS and Oil
3.2. Long Term Monitoring of Effluent Quality
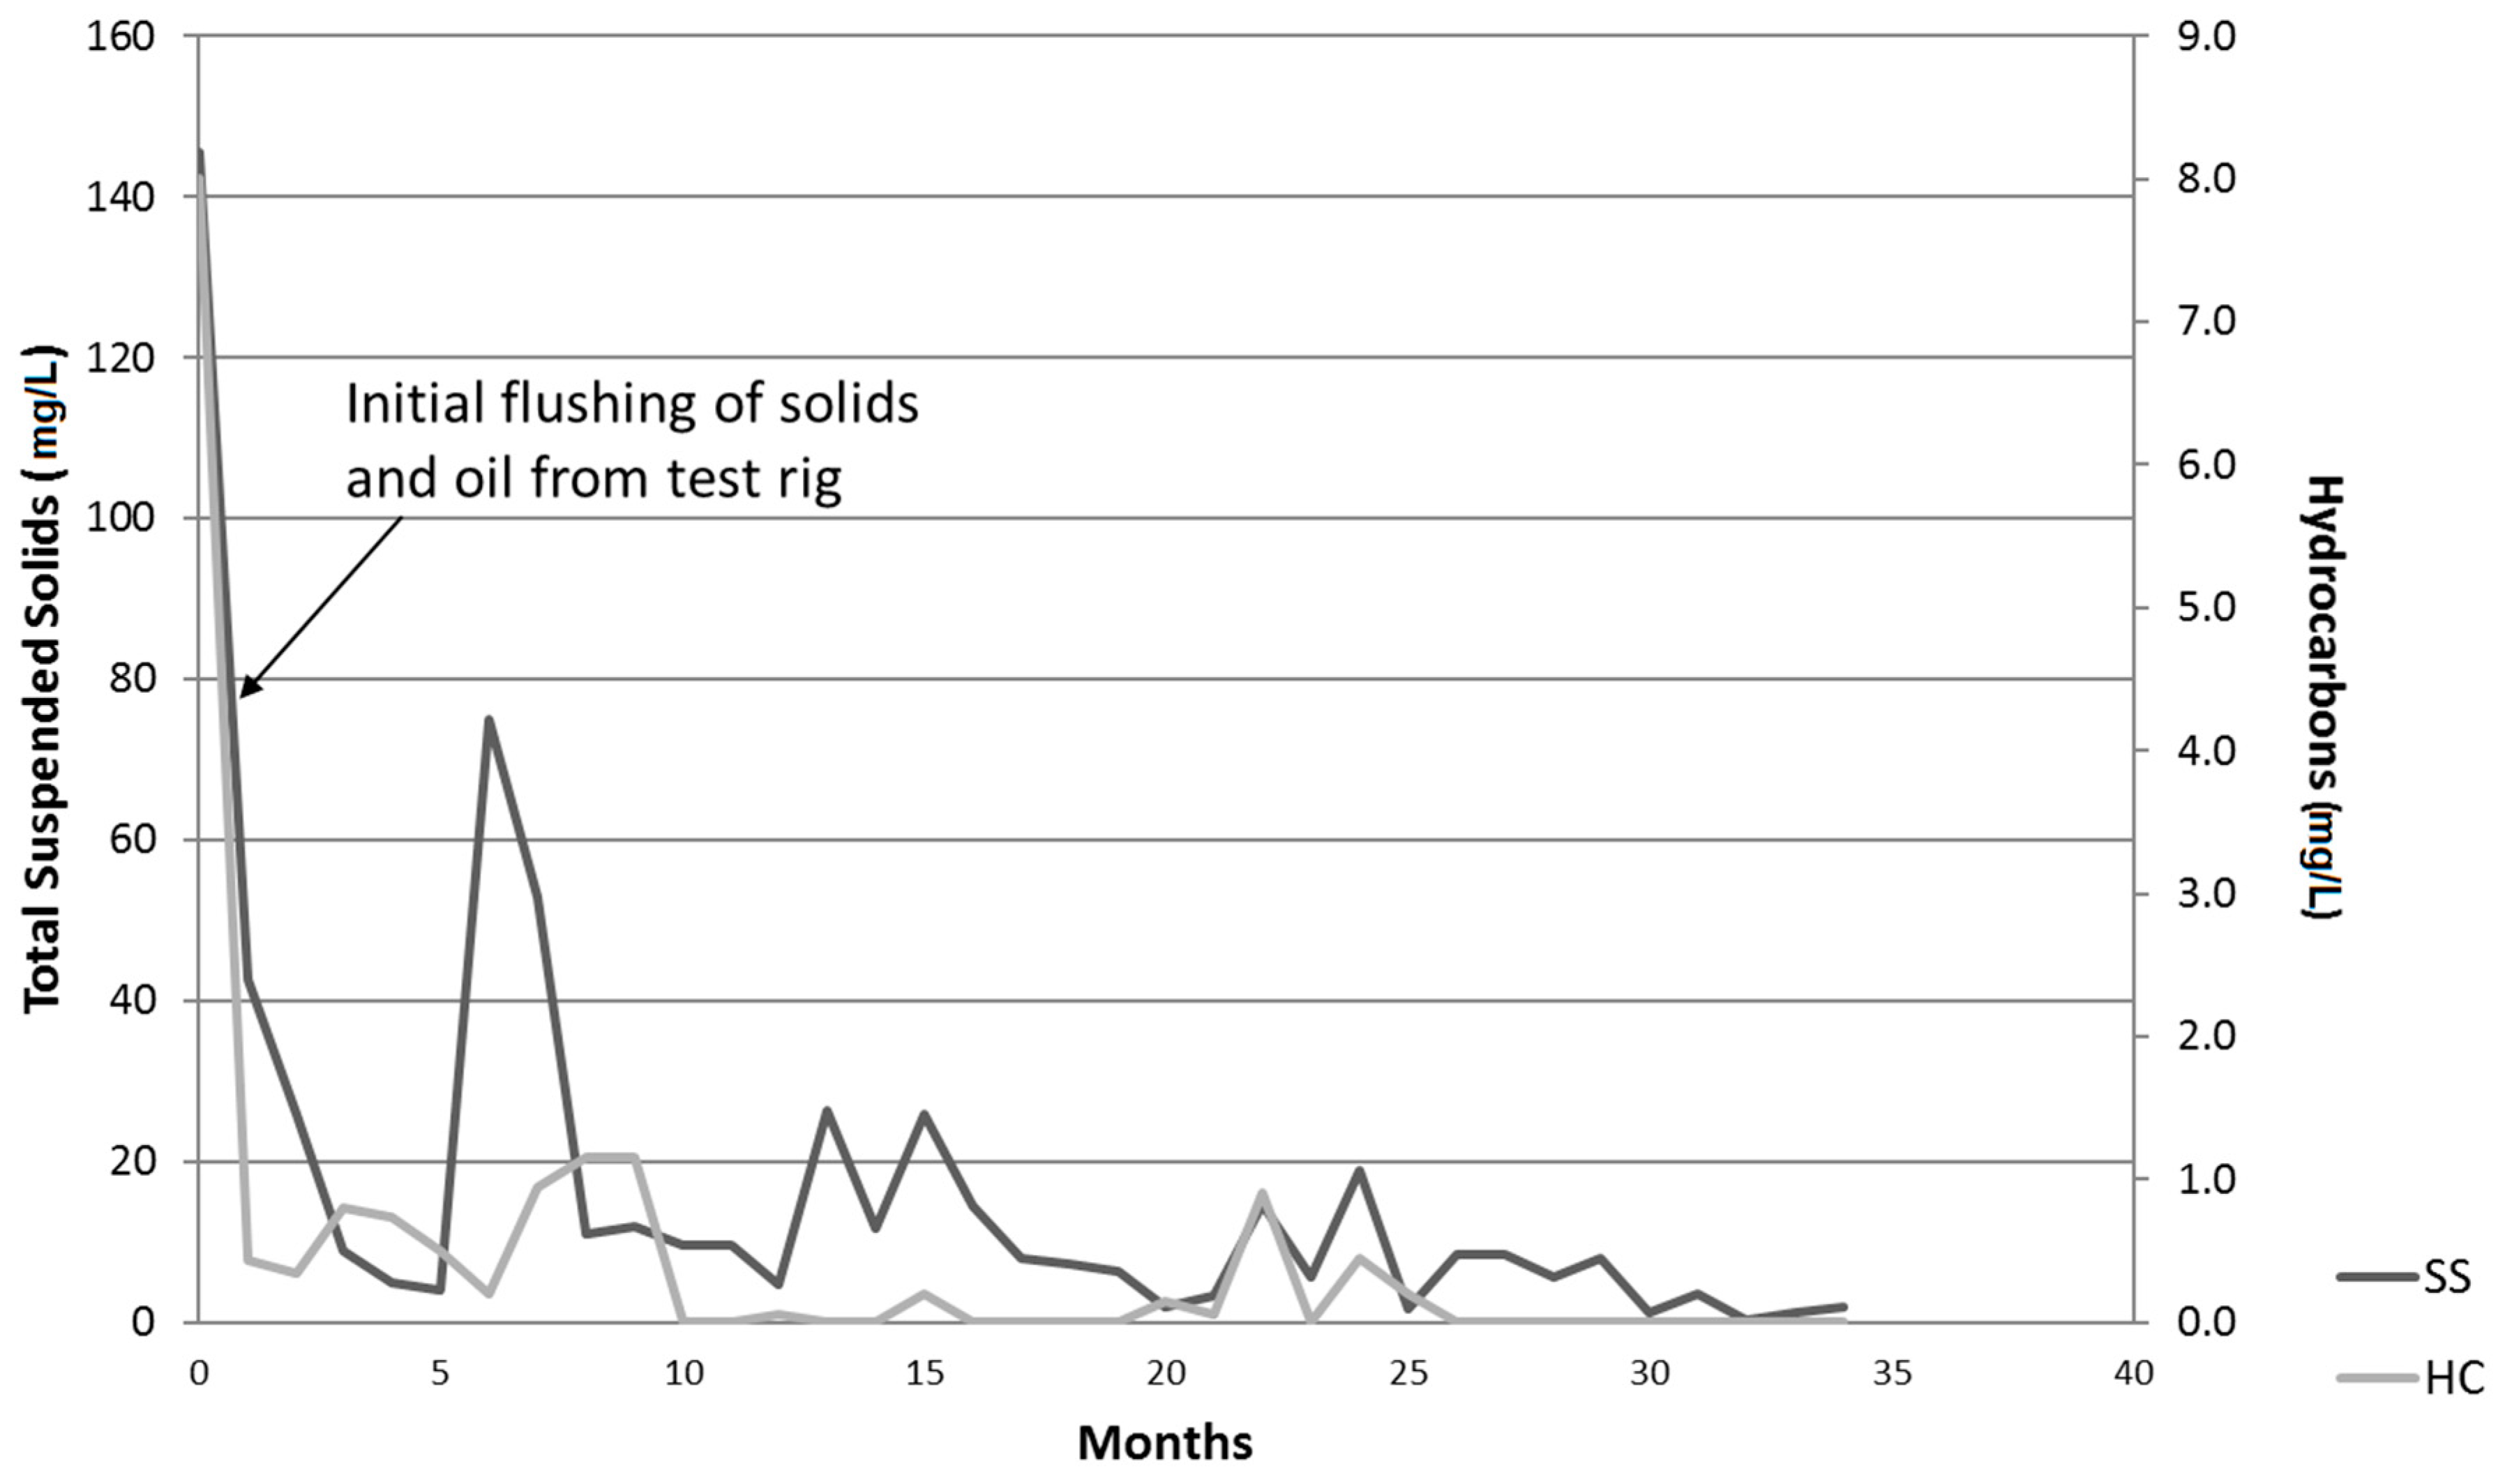
3.2.1. Oil and Grease Determination
3.2.2. Total Suspended Solids
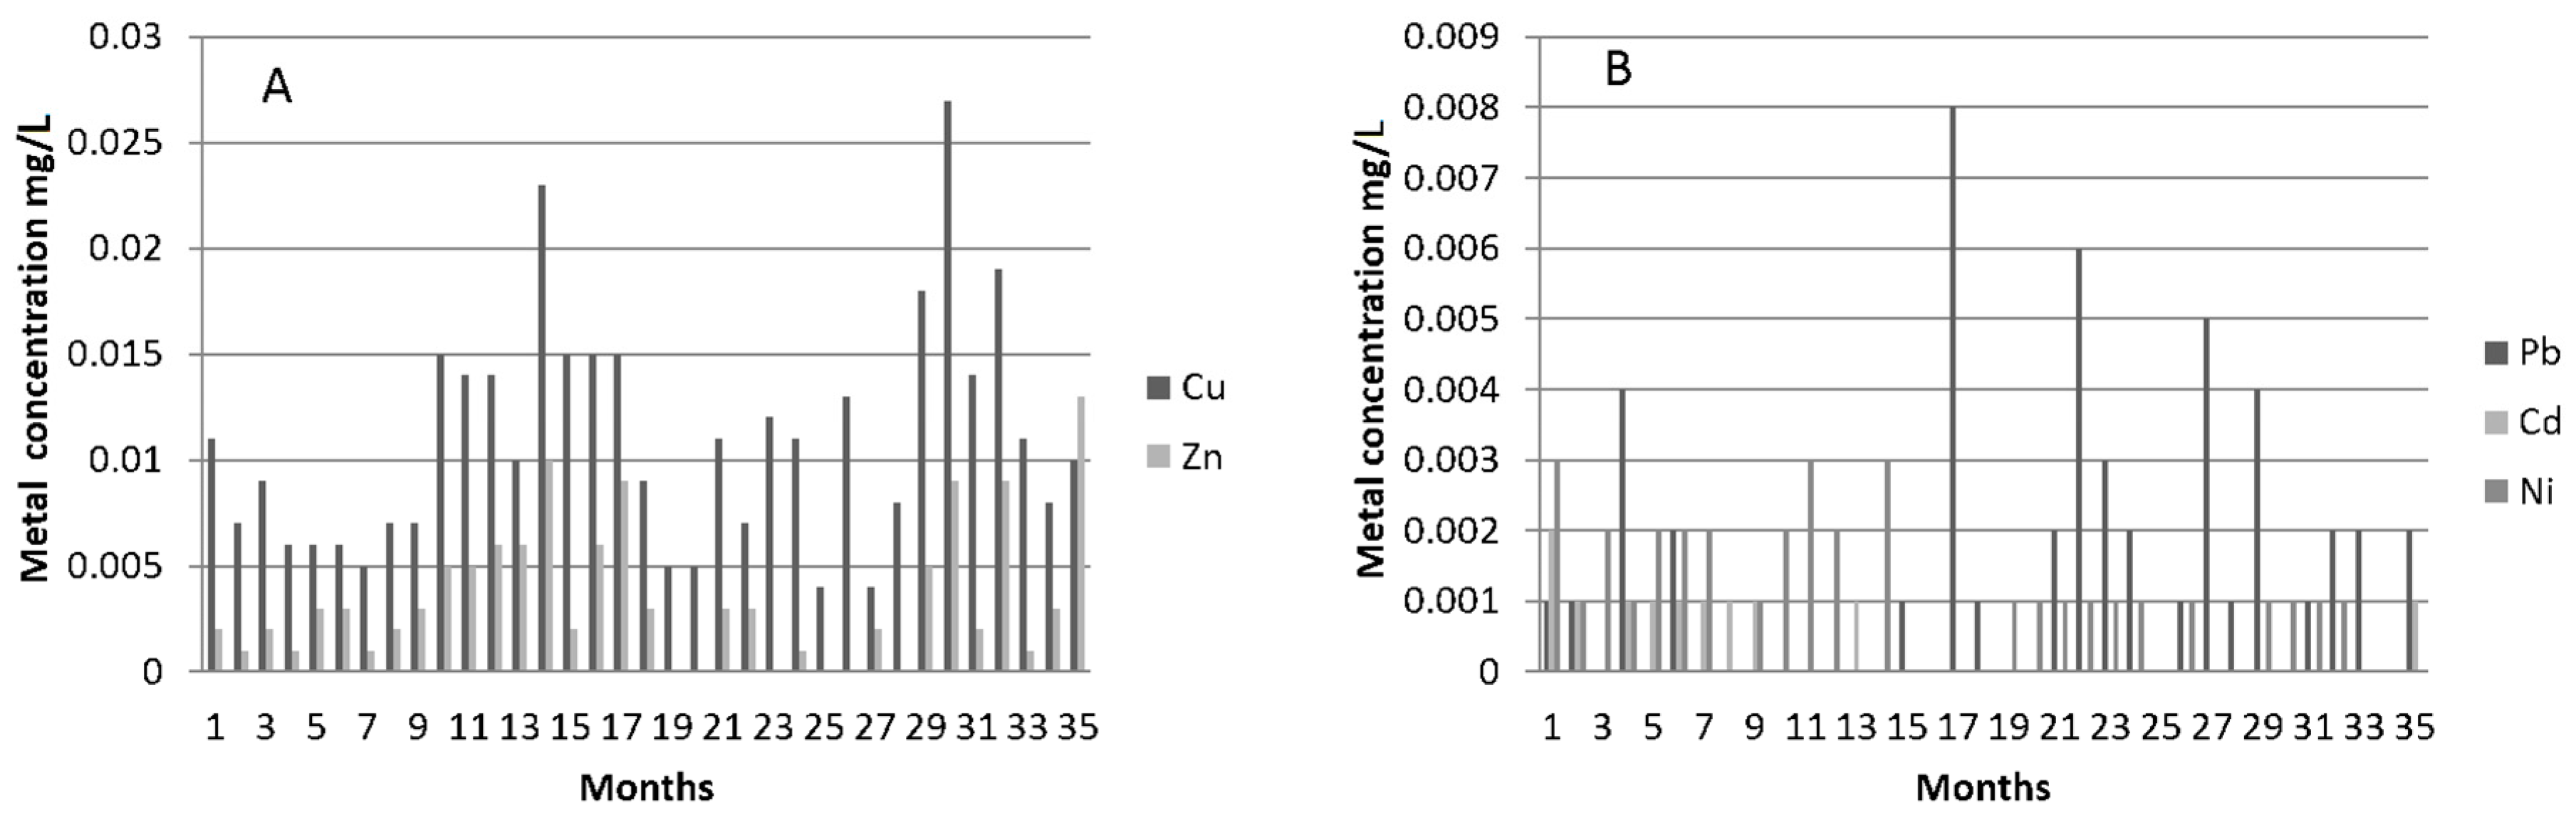
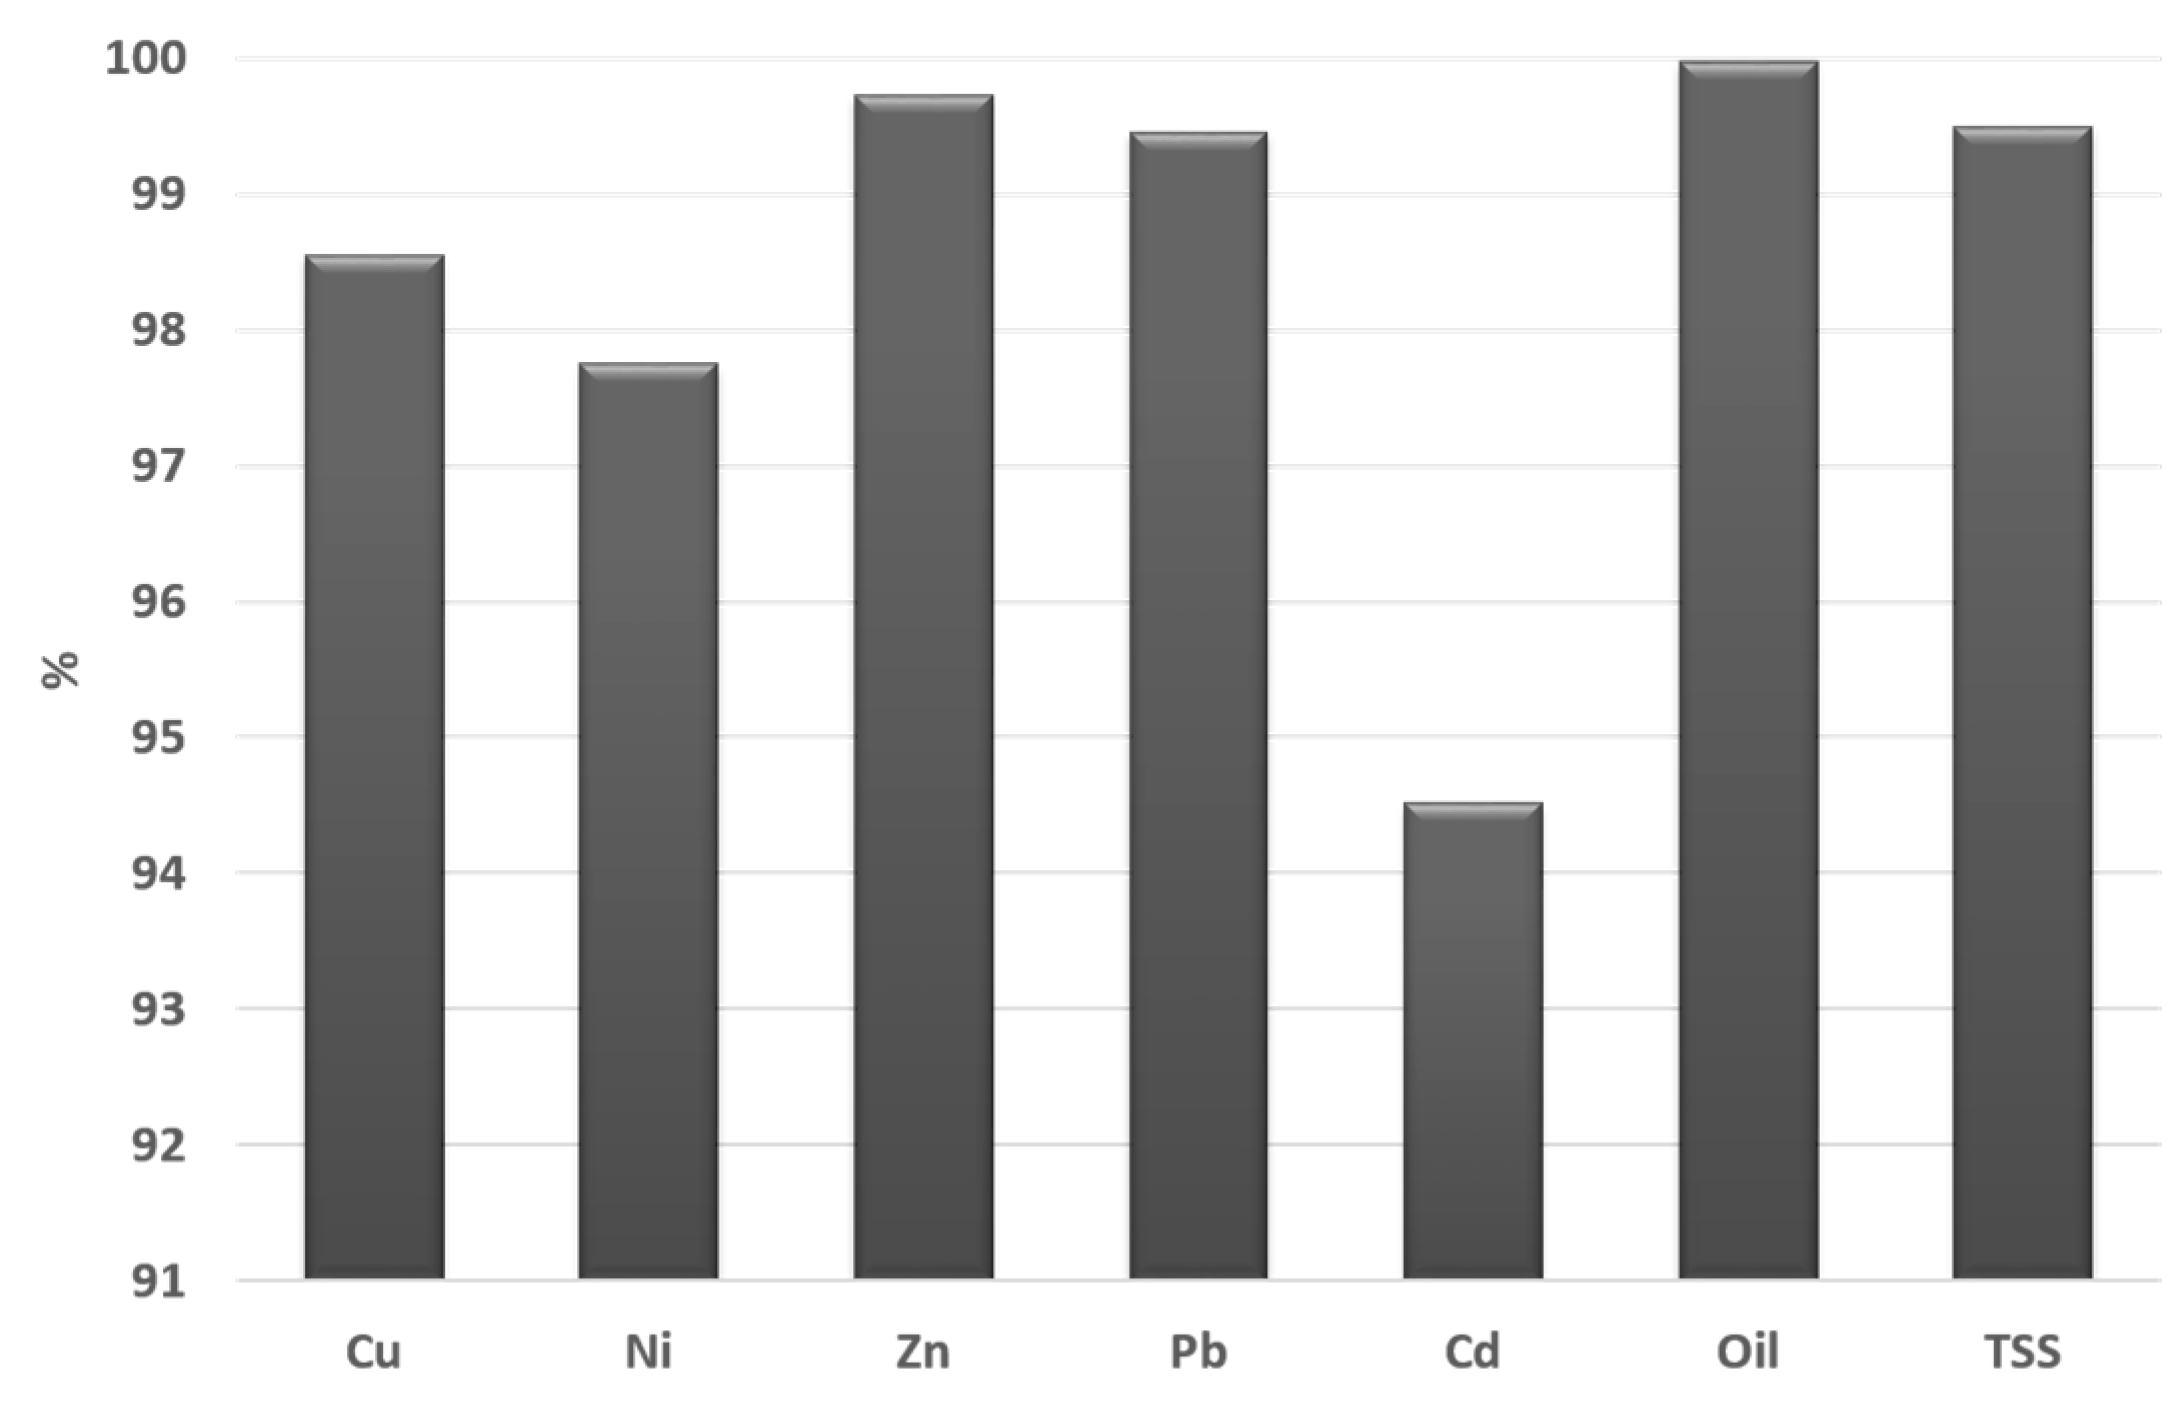
3.2.3. Metals in the Artificial Rainwater and Effluents
3.3. Coring Exercise-Analysis
3.3.1. Oil Analysis
3.3.2. Microbiology
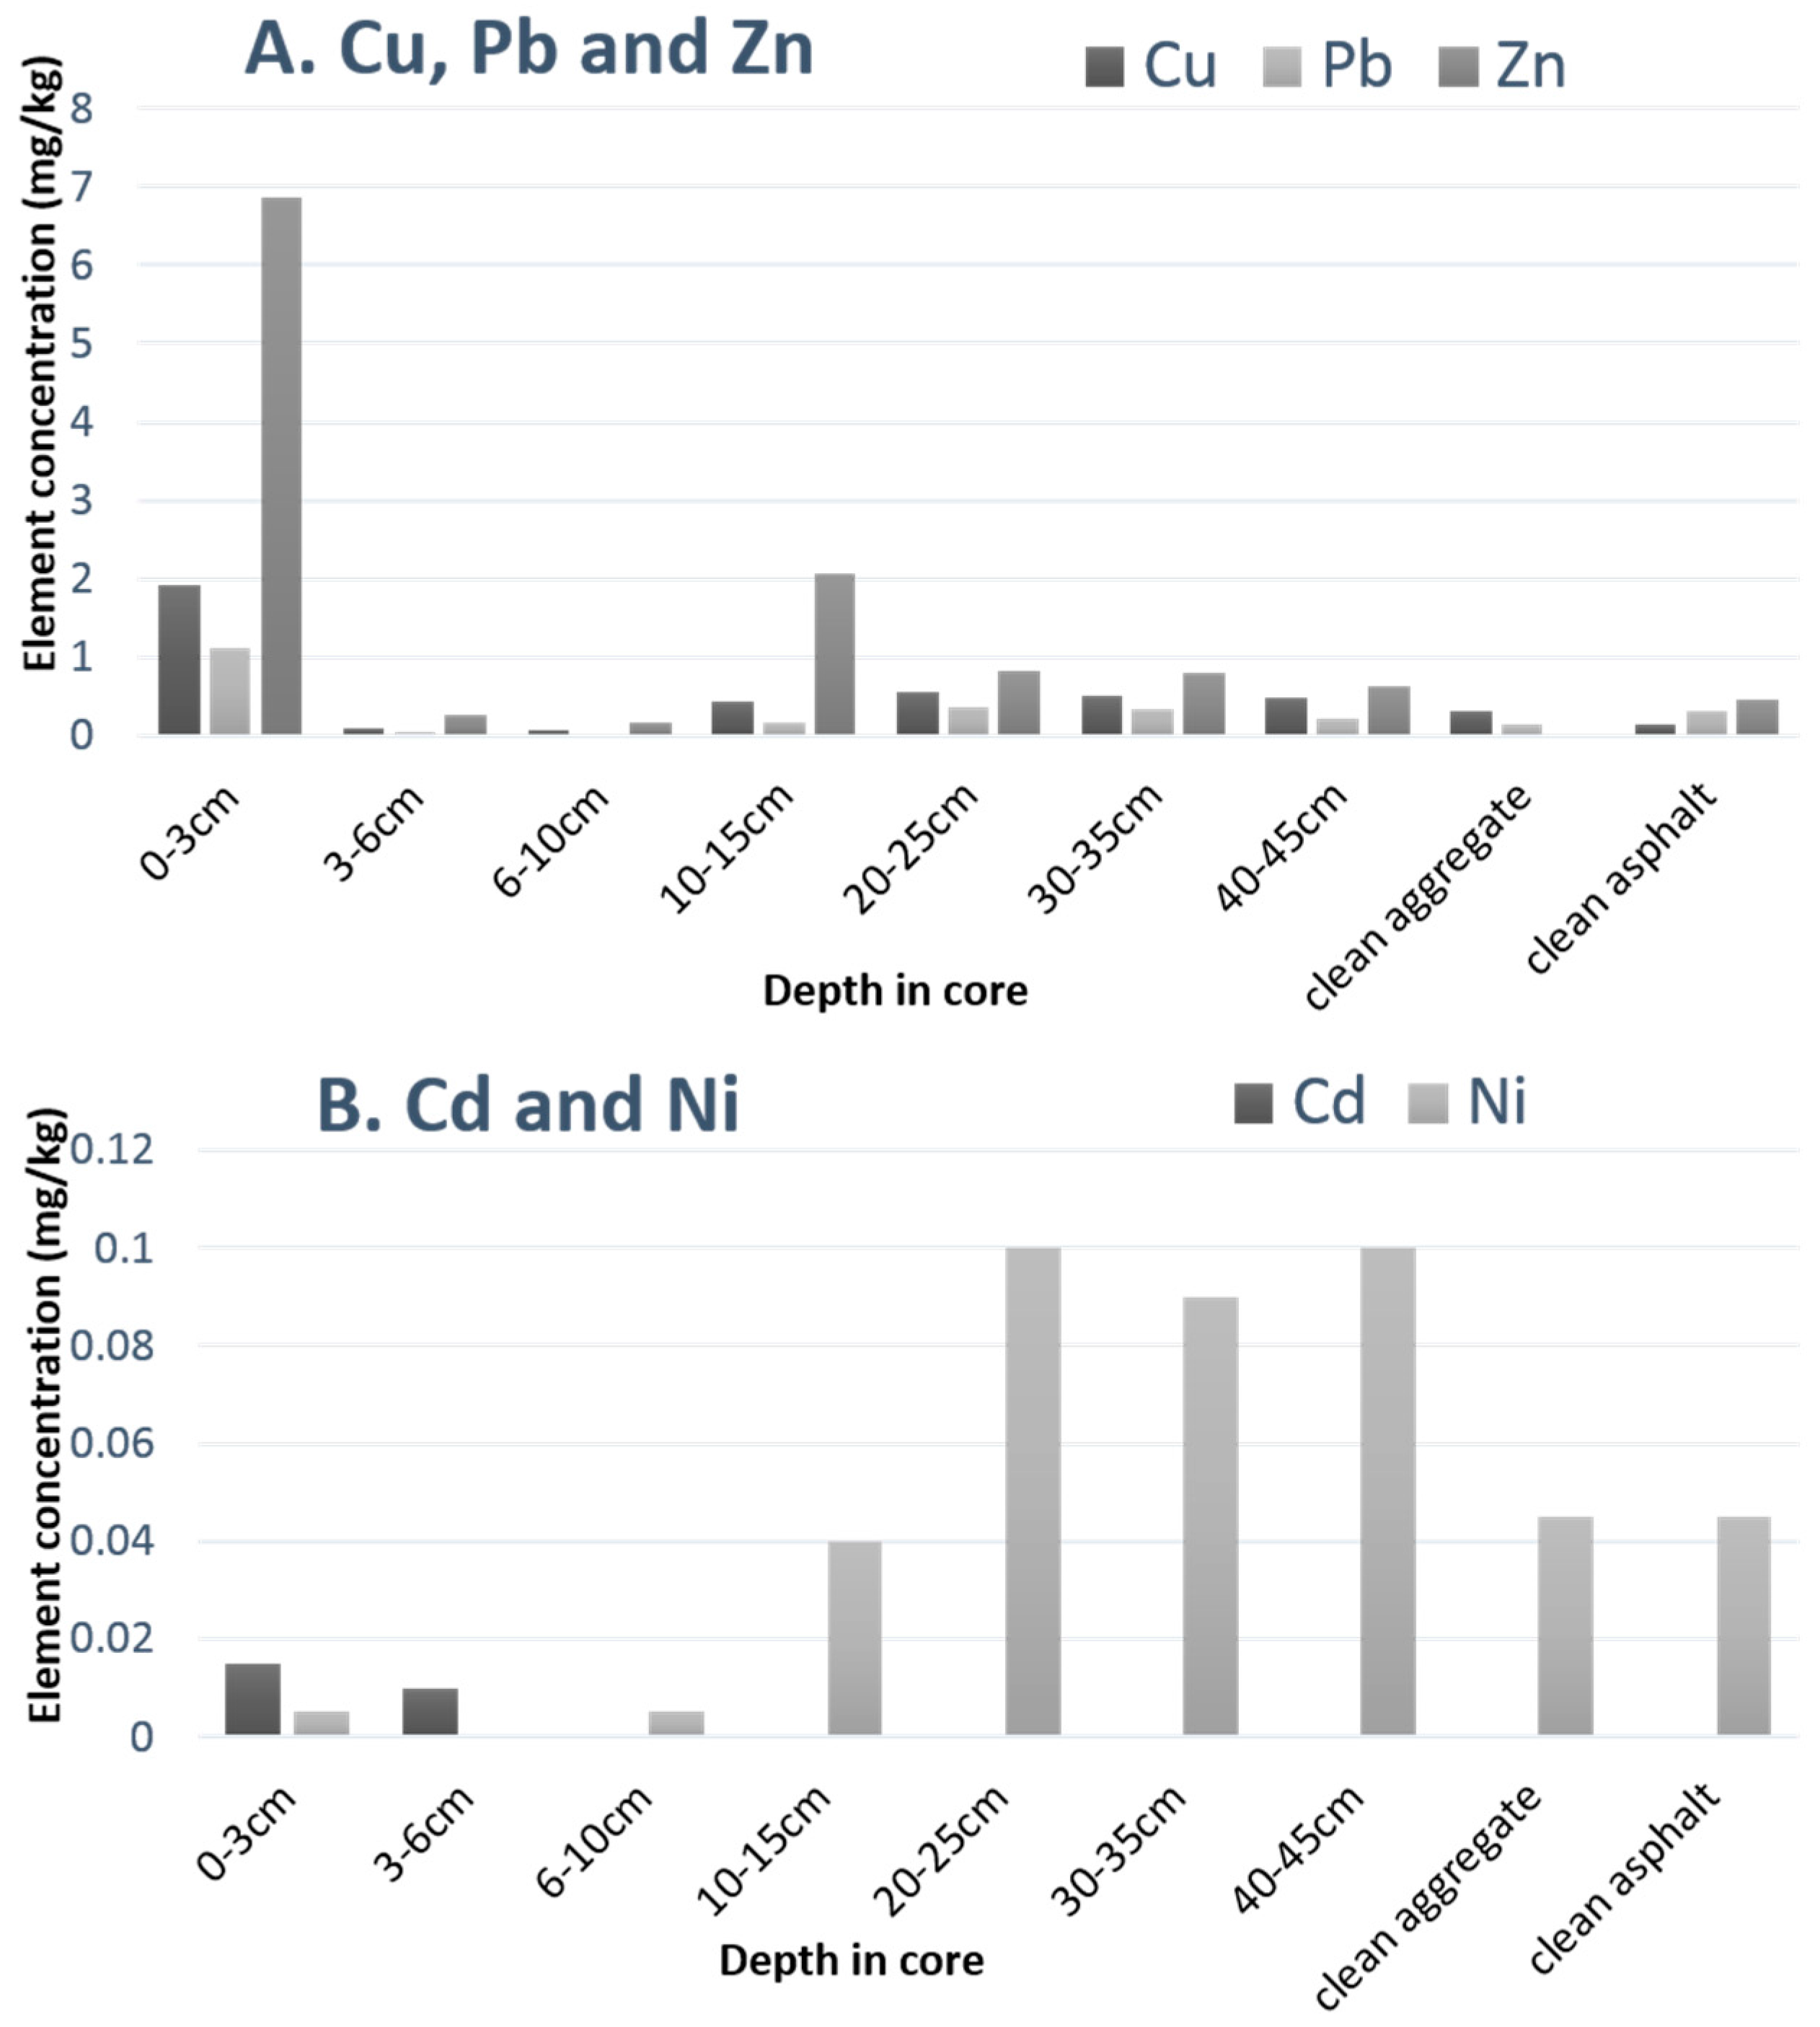
3.3.3. Heavy Metals
4. Potential for Impacts on Environmental Health
4.1. Potential Environmental Impacts
4.2. Maintenance, Refurbishment, Disposal and Particulate Resuspension
5. Conclusions
Acknowledgments
Author Contributions
Conflicts of Interest
References
- Charlesworth, S.M.; Harker, E.; Rickard, S. Sustainable drainage systems (SUDS): A soft option for hard drainage questions? Geography 2003, 88, 99–107. [Google Scholar]
- Scholz, M.; Grabowiecki, P. Review of permeable pavement systems. Build. Environ. 2007, 42, 3830–3836. [Google Scholar] [CrossRef]
- Newman, A.P.; Pratt, C.J.; Coupe, S.J.; Cresswell, N. Oil bio-degradation in permeable pavements by microbial communities. Water Sci. Technol. 2002, 45, 51–56. [Google Scholar] [PubMed]
- Bean, E.Z.; Hunt, W.F.; Bidelspach, D.A. Study on the Surface Infiltration Rate of Permeable Pavements. In Proceedings of the American Society of Civil Engineers and EWRI 2004 World Water and Environmental Resources Congress, Salt Lake City, UT, USA, 27 June–1 July 2004. [Google Scholar]
- Elvick, R.; Hoye, A.; Vaa, T.; Sorenson, M. The Handbook of Road Safety Measures, 2nd ed.; Emerald Group Publishing Ltd.: Bingley, UK, 2009; p. 1140. [Google Scholar]
- Pratt, C.J.; Newman, A.P.; Bond, P.C. Mineral oil bio-degradation within a permeable pavement: Long term observations. Water Sci. Technol. 1999, 39, 103–109. [Google Scholar] [CrossRef]
- Pratt, C.J.; Mantle, J.D.G.; Schofield, P.A. Urban stormwater reduction and quality improvement through the use of permeable pavements. Water Sci. Technol. 1989, 21, 769–778. [Google Scholar]
- Yong, C.F.; Deletic, A.; Fletcher, T.D.; Grace, M.R. The clogging behaviour and treatment efficiency of a range of porous pavements. In Proceedings of the 11th International Conference on Urban Drainage, Edinburgh, Scotland, UK, 31 August–5 September 2008. [Google Scholar]
- Charlesworth, S.M.; Lashford, C.; Mbanaso, F. A Review of Current Knowledge: Hard Stainable Infrastructure. Available online: http://www.fwr.org/environw/hardsuds.pdf (accessed on 19 June 2017).
- Scholz, M.; Charlesworth, S.; Coupe, S. Drainage benefits of porous, permeable and pervious paving. In Water Resources in the Built Environment: Management Issues and Solutions; Booth, C., Charlesworth, S.M., Eds.; Wiley Blackwell: Hoboken, NJ, USA, 2014. [Google Scholar]
- Xavier, J.B.; Picioreanu, C.; Rani, S.A.; van Loosdrecht, M.C.M.; Stewart, P.S. Biofilm control strategies based on enzymatic disruption of the extracellular polymeric substance matrix—A modeling study. J. Microbiol. 2005, 151, 3817–3832. [Google Scholar] [CrossRef] [PubMed]
- Flemming, H.C.; Wingender, J. The biofilm matrix. Nat. Rev. Microbiol. 2010, 8, 623–633. [Google Scholar] [CrossRef] [PubMed]
- Beveridge, T.J.; Makin, S.A.; Kadurugamuwa, J.L.; Li, Z. Interactions between biofilms and the environment. FEMS Microbiol. Rev. 1997, 20, 291–303. [Google Scholar] [CrossRef] [PubMed]
- Flemming, H.-C.; Leis, A. Sorption properties of biofilms. In Encyclopedia of Environmental Microbiology; Bitton, G., Ed.; Wiley-Interscience: New York, NY, USA, 2002; Volume 5, pp. 2958–2967. [Google Scholar]
- Späth, R.; Flemming, H.C.; Wuertz, S. Sorption properties of biofilms. Water Sci. Technol. 1998, 37, 207–210. [Google Scholar] [CrossRef]
- Ellis, J.B.; Chatfield, P.R. Diffuse urban oil pollution in the UK. Urban Water J. 2006, 3, 165–173. [Google Scholar] [CrossRef]
- Pitt, R.; Williamson, D.; Voorhees, J.; Clark, S. Review of historical street dust and dirt accumulation and washoff. In Effective Modeling of Urban Water Systems, Monograph 13; James, W., Irvine, K.N., McBean, E.A., Pitt, R.D., Eds.; CHI: Guelph, ON, Canada, 2004. [Google Scholar]
- Wilson, S.; Newman, A.P.; Puehmeier, T.; Shuttleworth, A. Performance of an oil interceptor incorporated in to a pervious pavement. Eng. Sustain. 2003, 156, 51–58. [Google Scholar] [CrossRef]
- Mbanaso, F.U.; Charlesworth, S.M.; Coupe, S.J.; Nnadi, E.O.; Ifelebuegu, A.O. Potential microbial toxicity and non-target impact of different concentrations of glyphosate-containing herbicide in a model pervious paving system. Chemosphere 2014, 100, 34–41. [Google Scholar] [CrossRef] [PubMed]
- Macklin, M. Metal pollution of soils and sediments: A geographic perspective. In Managing the Human Impacts on the Natural Environment: Patterns and Processes; Newson, M., Ed.; Belhaven Press: London, UK, 1992; pp. 172–195. [Google Scholar]
- ICRCL 59/83 Guidance on the Assessment and Redevelopment of Contaminated Land. Available online: http://www.eugris.info/displayresource.aspx?r=3621 (accessed on 19 June 2017).
- Report CLR7: Assessment of Risks to Human Health from Land Contamination: An Overview of the Development of Guideline Values and Related Research. Available online: http://www.eugris.info/displayresource.aspx?r=3747 (accessed on 19 June 2017).
- Ure, A.M. Single extraction schemes for soil analysis and related applications. Sci. Total Environ. 1996, 178, 3–10. [Google Scholar] [CrossRef]
- Madrid, L.; Dıaz-Barrientos, E.; Madrid, F. Distribution of heavy metal contents of urban soils in parks of Seville. Chemosphere 2002, 49, 1301–1308. [Google Scholar] [CrossRef]
- Charlesworth, S.M.; Everett, M.; McCarthy, R.; Ordóñez, A.; De Miguel, E. A comparative study of heavy metal concentration and distribution in deposited street dusts in a large and a small urban area: Birmingham and Coventry, West Midlands, UK. Environ. Int. 2003, 29, 563–573. [Google Scholar] [CrossRef]
- WHO. Guidelines for Drinking-Water Quality. Available online: http://whqlibdoc.who.int/publications/2011/9789241548151_eng.pdf?ua=1 (accessed on 2 April 2017).
- Barrett, M.E.; Shaw, C.B. Benefits of porous asphalt overlay on storm water quality. Transp. Res. Rec. 2007, 2025, 127–134. [Google Scholar] [CrossRef]
- Legret, M.; Colandini, V.; le Marc, C. Effects of porous pavement with reservoir structure on the quality of runoff water and soil. Sci. Total Environ. 1996, 189–190, 335–340. [Google Scholar] [CrossRef]
- Shackel, B. The design, construction and evaluation of permeable pavements in Australia. In Proceedings of the 24th ARRB Conference, Melbourne, Australia, 12–15 October 2010. [Google Scholar]
- Heal, K.V.; McLean, N.; D’Arcy, B.J. SUDs and sustainability. In Proceedings of the 26th Meeting of the Standing Conference on Stormwater Source Control, Dunfermline, Scotland, UK, 7 September 2004; pp. 47–56. [Google Scholar]
- Shirke, N.A.; Shuler, S. Cleaning porous pavements using a reverse flush process. J. Transp. Eng. 2009. [Google Scholar] [CrossRef]
- Gerrits, C.; James, W. Restoration of infiltration capacity of permeable pavers. In Proceedings of the Global Solutions for Urban Drainage: The Ninth International Conference on Urban Drainage (9ICUD), Portland, OR, USA, 8–13 September 2002; Eric, W.S., Wayne, C.H., Eds.; American Society of Civil Engineers: Reston, VA, USA, 2002. [Google Scholar]
- Dietz, M.E. Low impact development practices: A review of current research and recommendations for future directions. Water Air Soil Pollut. 2007, 186, 351–363. [Google Scholar] [CrossRef]
- Berger, J.; Denby, B. A generalised model for traffic induced road dust emissions. Model description and evaluation. Atmos. Environ. 2011, 45, 3692–3703. [Google Scholar] [CrossRef]
- Nicholson, K.W.; Branson, J.R.; Giess, P.; Cannell, R.J. The effects of vehicle activity on particle resuspension. J. Aerosol Sci. 1989, 20, 1425–1428. [Google Scholar] [CrossRef]
- Council Decision 2003/33/EC of 19 December 2002 Establishing Criteria and Procedures for the Acceptance of Waste at Landfills Pursuant to Article 16 of and Annex II to Directive 1991/31/EC. Available online: http://eur-lex.europa.eu/LexUriServ/LexUriServ.do?uri=OJ:L:2003:011:0027:0049:EN:PDF (accessed on 19 June 2017).
- EA (Environment Agency). Waste Acceptance at Landfills; Environment Agency: Bristol, UK, 2010.


| Cd | Cu | Ni | Pb | Zn | |
|---|---|---|---|---|---|
| A | |||||
| RS (n = 24) (mg/kg) | 1.1 | 223 | 24.9 | 152 | 366 |
| Soil background (mg/kg) [20] | 0.62 | 25.8 | 33.7 | 29.2 | 59.8 |
| CLEA SGVs (mg/kg) [22] | 30 | Nd | 75 | 450 | Nd |
| Trigger (mg/kg) [21] | 3 | 130 | 70 | 500 | 300 |
| Unused oil (n = 2) (mg/L) | 1.7 | 2.0 | 0.46 | 0.43 | 300 |
| B | |||||
| RS Soluble (mg/kg) | 0.06 | 1.97 | 0.16 | 0.19 | 1.69 |
| EDTA extractable RS (mg/kg) | 0.34 | 45 | 0.67 | 66.5 | 128 |
| Rain (tap feed) (mg/L) | 0.001 | 0.277 | 0.002 | 0.01 | 0.105 |
| Mean rig effluent (mg/L) | 0.0003 | 0.011 | 0.001 | 0.0014 | 0.0035 |
| WHO (mg/L) [26] | 0.003 | 2.0 | 0.070 | 0.010 | 3.0 * |
| Rig Samples | Depth (cm) | pH | Oil (mg/L) | Microbiology (CFU/g) | Sediment (g/kg) |
|---|---|---|---|---|---|
| Surface Course | 0–3 | 7.1 | 13 | 1.6 × 10⁵ | 2.0 * |
| Upper Binder | 3–6 | 7.6 | 2.6 | 1.0 × 10³ | 0.8 |
| Lower Binder | 6–10 | 7.5 | 1.5 | 1.6 × 10³ | 1.3 |
| Upper Aggregate | 10–15 | 8.9 | ns | 7.2 × 10³ | 38 |
| Middle Aggregate | 20–25 | 9.1 | ns | 2.0 × 10⁵ | 52 |
| Lower Aggregate | 30–35 | 9.1 | ns | 7.0 × 10⁵ | 48 |
| Base | 40–45 | 8.9 | ns | 2.1 × 10⁷ | 32 |
| Metal | RS | Core |
|---|---|---|
| Cu | 45 | 2 |
| Pb | 66.5 | 1 |
| Zn | 128 | 7 |
| Cd | 0.34 | 0.015 |
| Ni | 0.67 | 0.1 |
© 2017 by the authors. Licensee MDPI, Basel, Switzerland. This article is an open access article distributed under the terms and conditions of the Creative Commons Attribution (CC BY) license (http://creativecommons.org/licenses/by/4.0/).
Share and Cite
Charlesworth, S.M.; Beddow, J.; Nnadi, E.O. The Fate of Pollutants in Porous Asphalt Pavements, Laboratory Experiments to Investigate Their Potential to Impact Environmental Health. Int. J. Environ. Res. Public Health 2017, 14, 666. https://doi.org/10.3390/ijerph14060666
Charlesworth SM, Beddow J, Nnadi EO. The Fate of Pollutants in Porous Asphalt Pavements, Laboratory Experiments to Investigate Their Potential to Impact Environmental Health. International Journal of Environmental Research and Public Health. 2017; 14(6):666. https://doi.org/10.3390/ijerph14060666
Chicago/Turabian StyleCharlesworth, Susanne M., Jamie Beddow, and Ernest O. Nnadi. 2017. "The Fate of Pollutants in Porous Asphalt Pavements, Laboratory Experiments to Investigate Their Potential to Impact Environmental Health" International Journal of Environmental Research and Public Health 14, no. 6: 666. https://doi.org/10.3390/ijerph14060666