
Validity of Research-Grade Actigraphy Unit for Measuring Exercise Intensity

1
Department of Landscape Architecture, National Chin-Yi University of Technology, 57 Sec. 2, Zhongshan Rd., Taichung City 41170, Taiwan
2
Department of Landscape Architecture, National Chiayi University, 300 Syuefu Rd., Chiayi City 60004, Taiwan
*
Author to whom correspondence should be addressed.
Int. J. Environ. Res. Public Health 2017, 14(5), 511; https://doi.org/10.3390/ijerph14050511
Submission received: 15 December 2016
/
Revised: 14 April 2017
/
Accepted: 1 May 2017
/
Published: 10 May 2017
(This article belongs to the Special Issue The Impacts of Physical Activity on Chronic Disease Prevention and Population Health)
Abstract
:This study was conducted in a free-living setting to investigate the measurement validity of a research-based actigraph for strolling and jogging, and to provide a reference for actual practice and research. Because inadequate physical activity (PA) or sedentary lifestyle has become the fourth leading risk factor for mortality worldwide, many countries have been vigorously promoting the concept of “active living”, and the public has been investing greater effort into intensifying their PA. Although research-grade actigraphs have been widely applied to evaluate PA in routine environments, the measurement results may not accurately reflect the wearers’ PA. Unlike most relevant research, which is conducted in well-controlled laboratory environments, the present study was implemented in the field to examine the sensitivity and convergent validity of the MicroMini Motionlogger® Actigraph during strolling and jogging. The following results were revealed: (1) Although the exercise movement speed while jogging was significantly faster than that while strolling, the actigraph readings showed no significant difference between strolling and jogging; (2) The actigraph readings were (significantly or nonsignificantly) negatively correlated with metabolic heat and nonsignificantly correlated with movement speeds. Hence, the actigraph validity for measuring PA intensity while strolling and jogging remains debatable.
1. Introduction
The concept of “active living” is promoted in many countries to improve public health, as modern lifestyles are becoming increasingly sedentary with advances in society and technology [1,2,3]. During the past 50 years, the energy spent in daily activities by adults between 20 and 60 years of age in Europe and North America has dropped by 500 kcal [4]. In addition, according to a 2010 “Sport City Survey” conducted in Taiwan, up to 72.2% of people did not exercise regularly, which was higher than the 63.3% reported in the United Kingdom, 61.4% in Malaysia, 60.2% in Japan, 43.2% in the United States, and 32.5% in France [5]. According to statistics from the World Health Organization, approximately 60–85% of adults worldwide lead a sedentary lifestyle, and roughly 67% of children lack exercise. Moreover, physical inactivity or a sedentary lifestyle has become the fourth largest cause of death worldwide, and approximately 6% of annual mortality was found to be related to physical inactivity; more than two million deaths per year are attributable to a sedentary lifestyle [6]. In Taiwan, a recent study asserted that the intensity of physical activity (PA) was positively correlated with physical and mental health [7]. Consequently, active living has become an emerging trend with a philosophy based on exercise as a way of life and the recommendation of integrating PA into daily life.
With the growing interest in active living, a convenient method for facilitating objective and accurate gauging of PA has been much sought after. Although portable activity trackers may be useful for monitoring users’ physical behavior, the accuracy of these devices is arguable, and they could cause errors in the evaluation of daily exercise or in clinical judgment [8]. Presently, many people, including professional athletes, use wearable devices, mostly consumer-grade activity trackers, to record and appraise their PA. Among these devices, actigraphs are recognized as a method for the prolonged monitoring of PA, and they can objectively quantify frequency, intensity, and duration for assessment. Additionally, the output can also be cross-referenced with other activities that the wearer engages in [9,10,11,12,13]. Actigraphs, which are intended to be research-grade accelerometers, have been in use since the 1970s [14] and have been widely used in biomedical science [15], although their applications in sleep studies are considerably more prominent. Actigraphs generally have favorable reliability [16,17,18,19]. If an actigraph is consistently worn in the same place by the same user, it can achieve a reliability of 0.90–0.99 [20]; however, high reliability does not necessarily indicate an equally high validity. Reliability refers to the consistency of measures, whereas validity refers to the ability of measurements to approximate the actual state [21]. Recent studies have indicated that consumer-grade activity monitors may incorrectly quantify activity intensity [22]. In addition, consumer-level monitors may show only moderate convergent validity compared to research-grade devices, which are regarded as possessing acceptable accuracy for the measurement of PA and sleep time [23,24]. As the price of research-grade activity trackers decreases, more clinical professionals and the general public are using such units to monitor users’ daily exercise and light activity. Hence, this study was motivated by the need to examine the sensitivity and convergent validity of research-grade actigraph units. When a measure is highly correlated with other tests that are believed to measure the same construct, convergent evidence for validity is obtained. This type of evidence (for convergent validity) indicates that measures of the same construct converge [25].
One of the special features of the present study was the routine environment in which the experiment was performed: under daily living conditions instead of in a laboratory. This was intended to increase ecological validity. A systematic review of validity tests for activity trackers showed that only 3 out of 21 studies were conducted in the field [22]. In addition, in this study, the intensity of strolling and jogging, two of the most common PAs for leisure or exercise in Taiwan [26], was freely selected to closely reflect the lifestyles of the general public. In particular, most prior studies tended to recruit a limited number of participants because of the complexity of operating procedures under laboratory conditions [22]. However, in the present study, a relatively large number of subjects were recruited to improve the experimental validity.
2. Literature Review
2.1. Actigraphy Devices
Actigraphy devices, or actigraphs, are usually worn on users’ nondominant arm or waist to gather movement data numerous times per second with built-in accelerometer or sensor units. These devices are sufficiently sensitive to measure the resultant force of body movements down to 0.01 g [27] and convert two- or three-dimensional movement data into analog waveform signals in minute-long epochs. Actigraphs can continuously measure and store movement data for up to one week [10]. Specialized computer software is then required to process the data and deduce the wearers’ active and static, awake and dormant, and acrophase patterns [16,17,18,19]. Before the activation of the device, a data acquisition mode, which cannot be changed during operation, must be selected. Two modes are available, namely the zero crossing mode (ZCM) and the proportional integrating measure mode (PIM). The ZCM measures the wearer’s movement frequency, which is represented by the number of times the voltage fluctuations of the analog signals exceed a predetermined threshold value. For example, when a swing-riding child starts swinging from a certain height, the ZCM will start counting the number of times the swing passes its equilibrium position (threshold), and continue counting until the swing slows down to a standstill. By contrast, the PIM records the fluctuation of analog signals when they exceed predetermined threshold values, using its own units (PIM counts). The absolute value or state of the waveform areas represents the intensity or extent of activity, ranging from 0 (i.e., a completely static body) to 32,000 (i.e., the body exercising at the highest intensity). For example, when two hammer-wielding individuals are subjected to a test of mechanical forces under identical conditions, the PIM will detect the variations in the strengths or forces they use. Therefore, the PIM concerns the measurement of intensity, instead of number of the times the activity exceeds a threshold value or a change in the activity pattern. Furthermore, the PIM can be categorized into low-PIM and high-PIM. Generally, low-PIM is ideal for monitoring premature infants or individuals with exercise-related disadvantages, whereas high-PIM is ideal for general users or individuals with hyperactivity disorder, because its specialized filters can amplify waveform signals for an improved comparison of activity intensity [28,29].
Actigraphs have been widely used in clinical medicine, particularly for monitoring the activities of patients, and they have had somewhat favorable results. Although actigraphs are recognized as effective data-gathering tools [30], their validity may be limited [31]. Recent studies have indicated that although the validity for step counting of consumer-grade activity trackers is acceptable [32], they may have lower validity for energy expenditure (EE) and sleep compared with other criterion measures [22]. Low accuracy in activity tracking might mislead and jeopardize professional clinical judgments, because these trackers are widely used as a reference for improving public health [8]. Research-based actigraphs are conventionally and widely used in medical evaluations of sleep and rest, such as the studies of circadian rest-activity cycles by Brown et al. [33] and wake-sleep conditions by Cole et al. [34] and Matsumoto et al. [35]. In addition, by studying 20 patients in intensive care units, Grap et al. [36] discovered that the readings of wrist actigraphs were significantly and positively correlated with the observed activity frequency, blood pressure, and mean arterial pressure of the patients. Rapport et al. [29] measured the activity intensity of 23 young boys by using low-PIM, and they found that actigraphs could assist in diagnosing attention deficit hyperactivity disorder. Moreover, Grap et al. [27] used actigraphs to assess the performances of 30 participants in a simulation of critically ill patients in calm, disturbed, and agitated states, which were also observed and recorded by accompanying nurses; the results revealed that both the activity records collected by observing nurses and the actigraphs in PIM mode could effectively distinguish the three states. Nevertheless, research-grade activity monitors may also have limited accuracy. A study that adapted direct calorimetry (e.g., room calorimeters) for criterion measurement revealed that even research-grade actigraphs, such as the ActiGraph GT3X, may not have ideal validity for EE [37]. Moreover, Abel et al. [38] recruited 20 participants who walked and ran for 10 min on treadmills at speeds of 54, 80, 107, 134, 161, and 188 m/min and found that EE was incorrectly measured by the ActiGraph GT1M at most walking and running speeds. Gusmer et al. [39] also demonstrated that the ActiGraph GT1M had poor-to-average agreement in the EE measurements of 21 participants who participated in two 30-min sessions of slow and brisk walking on treadmills. In addition, Bai et al. [31] indicated that the ActiGraph GT3X+ showed only 0.73 correlation with Oxycon Mobile (version 5.0) when testing EE during activities such as aerobic exercise, resistance exercise, and self-selected sedentary activity.
2.2. Metabolic Heat (MH)
Metabolism involves the chemical reactions that transform consumed food into heat energy to sustain body functions. More specifically, the cells in the human body require certain types of chemical reactions to maintain a body temperature of 37 °C (98.6 °F). The amount of energy generated through “exercise activity thermogenesis” can be estimated from the metabolic rate and surface area of the human body. Therefore, the metabolic rate of a unit of body surface area varies with the intensity of activity the body engages in [40]. In both human physiology and medical science, body surface area (BSA) can be calculated using various formulas that differ only slightly with one another. The earliest such equation, proposed by DuBois et al. [41], is as follows:
where W denotes body weight (kg) and H denotes height (cm). Although this formula is not suitable for infants, it is still the most widely used among researchers. Given that its error rate is lower than 5% when applied to varied ethnicities (e.g., Caucasian, Chinese, Indian, and Japanese) and body types [42], this formula was adopted in the present study for BSA calculation. Furthermore, MH was calculated as the product of BSA (m2) and metabolic rate (W/m2); metabolic rates are listed in Table 1 [40] and may be an alternative method for indirectly assessing the MH generated by strolling and jogging in the field. Estimating the MH through this approach is relatively inexpensive and easy to operate under free-living conditions.
BSA (m2) = 0.007184 × (W0.4125 × H0.725)
Various techniques may also be adopted to indirectly evaluate metabolism. Traditionally, indirect calorimetry calculates metabolic rate by measuring oxygen consumption and carbon dioxide production to estimate heat production (HP), For example, for respirometry-based calorimetry gas collection and measurement equipment must generally be deployed around the subject under laboratory conditions, which makes the research process inconvenient. The doubly labeled water method, which is expensive but convenient, is another indirect method for estimating body metabolism using stable isotopes of hydrogen and oxygen [43]. By contrast, direct calorimetry quantifies temperature fluctuations in the HP of subjects through direct observation, generally by using a controlled chamber with subjects inside. Although direct calorimetry is the gold standard method for the accurate measurement of MH, its use is limited by high cost and inconvenience [44]. In general, most MH estimation methods conducted in laboratories, either through direct or indirect calorimetry, may not facilitate the research process because the operational procedure and mobility of the equipment are relatively limited. Although direct or indirect calorimetry testing under laboratory conditions might result in favorable internal validity, the ecological validity may be limited. Internal validity refers to whether the experimental treatments make a difference in the specific experimental instance, whereas ecological validity refers to samples of settings and participants that reflect the ecology of the treatments’ application [45].
The literature review on human body EE by Passmore et al. [46] proposed the following findings: walking speed was positively and linearly correlated with EE when the speed was 3–6.5 km/h; at 4.8 km/h, metabolism rate was independent of age, sex, or race; and at speeds greater than 7 km/h, EE grew exponentially with the increase in walking speed. When the ascending slopes featured gradients of 0%, 5%, 15%, and 25%, EE grew exponentially with the increase in gradient and walking speed; compared with walking on level ground, descending slopes consumed relatively less energy, whereas steep slopes consumed more energy. In addition, when running speed was 7–12 km/h, EE varied greatly. Another study used indirect calorimetry on 20 treadmill users engaged in walking (at 53.6, 80.4, and 107.2 m/min) and running (at 134.0, 160.8, 187.6, and 214.4 m/min) sessions that lasted 10 min at each speed with 2-min resting intervals, and found that the participants consumed significantly more energy as the treadmill speed was increased [47]. Recently, an indirect calorimetry study of 22 participants engaged in 5-min static-to-light activities in a laboratory found that, except for lying and sitting still and lying and standing still, all other activities consumed significantly different amounts of energy [48].
3. Methodology
3.1. Research Design
A major limitation of recent studies on the validity testing of actigraphs was that most evaluations of the intensity of daily PAs have been conducted in laboratories, whereas actigraphs are usually applied in free-living environments [8,22]. Because of the favorable ecological validity of field experiments [45], in the present study, a randomized controlled trial was conducted that assigned participants with different experimental treatments in actual environments. The experimental treatments comprised strolling and jogging sessions, which are the most popular exercises in Taiwan and worldwide [49]. The participants were asked to stroll or jog continuously for 15 min at their chosen speed back and forth along two 400 m, east-west parallel, level, and paved roads on the campus of National Chin-Yi University of Technology in central Taiwan (Figure 1). The participants were only permitted to break for safety reasons. The field experiment lasted for from October 2013 to February 2014, and all sessions took place between 8 am and 5 pm.
3.2. Instruments and Data Collection
BSA was calculated according to the formula of DuBois et al. [41] using participant data (e.g., height and body weight) obtained from a questionnaire. In addition to height and body weight, the questionnaire also inquired about background information such as health, physical fitness, sex, age, college attended, and year at school. The MicroMini Motionlogger® Actigraph (Ambulatory Monitoring, Inc., New York, NY, USA), which has been applied in areas including sleep research, was used in this study. The actigraph was worn on the participants’ nondominant arm for objectively gauging and recording their activity intensities [9]. Because the participants were all ordinary college students, high-PIM was chosen as the most suitable measurement model. Moreover, movement speed was calculated by dividing movement distance with movement time. Each participant’s movement distance was measured by a research assistant, who closely followed the participant, by using the global positioning system (GPS) feature of the Nike+ mobile application (Nike, Inc., Beaverton, OR, USA). The Nike+ mobile application is popular among joggers and has an accuracy of ±5 m [50]. Although the real-time specific movement speeds of the participants and the research assistant may not have been exactly identical, their average movement speeds during the 15-min session were close. Furthermore, to determine the MH of each participant, corresponding metabolic rates were obtained from Table 1 [40] according to participants’ strolling or jogging speeds, which were then multiplied with BSAs.
3.3. Participants
Unlike most previous validity tests, which have involved a small number of participants [22], a relatively large number of participants were involved in this study. A total of 120 Han Chinese college students were recruited from National Chin-Yi University of Technology for this research. All participants provided informed consent. To ensure the participants’ safety, they were interviewed about their histories of physical injuries, asthma [51], and allergies to sunlight, air, or plants. Moreover, they were required to answer and pass the Physical Activity Readiness Questionnaire (PAR-Q) [52] before being included in the experiment. The PAR-Q, containing seven questions, is designed to assess the fitness of those aged 15–69 years who intend to take up exercise or intensify their PA. The PAR-Q was adopted to determine whether the prospective participants were in a sufficiently physically fit condition to safely participate in the experiment. All prospective participants passed the PAR-Q.
4. Results
4.1. Descriptive Statistics of Sample Distribution
After the exclusion of invalid participants who did not complete the experiment, 116 participants remained (52 males, 64 females). Among them, 29 participants strolled and 29 jogged on Road 1, and 32 strolled and 26 jogged on Road 2. The average age of these valid participants was 20.85 years (SD = 1.14). Their average weight, height, and BMI (body mass index) were 58.14 kg (SD = 10.93), 165.55 cm (SD = 8.57), and 21.14 kg/m2 (SD = 3.11), respectively. Table 2 lists additional background details. The results of statistical analyses showed no significant differences by sex (χ2 = 1.625, p = 0.654); college attended (χ2 = 9.555, p = 0.145); academic year (χ2 = 6.556, p = 0.885); age, height, and weight (Box’s M = 29.399, F = 1.553, p = 0.063; Pillai’s Trace ≤ 0.041, F(3,110) ≤ 1.563, p ≥ 0.202, ≤ 0.041); or BMI (F(1,112) = 3.728, p = 0.056, = 0.032) with respect to exercise groups and exercise roads.
4.2. Analyses of Variance
Because the participants were permitted to stroll or jog at their chosen speed, descriptive statistics of these speeds, which were measured using the GPS tracking distances divided by the 15-min exercise duration, are presented first in Table 3.
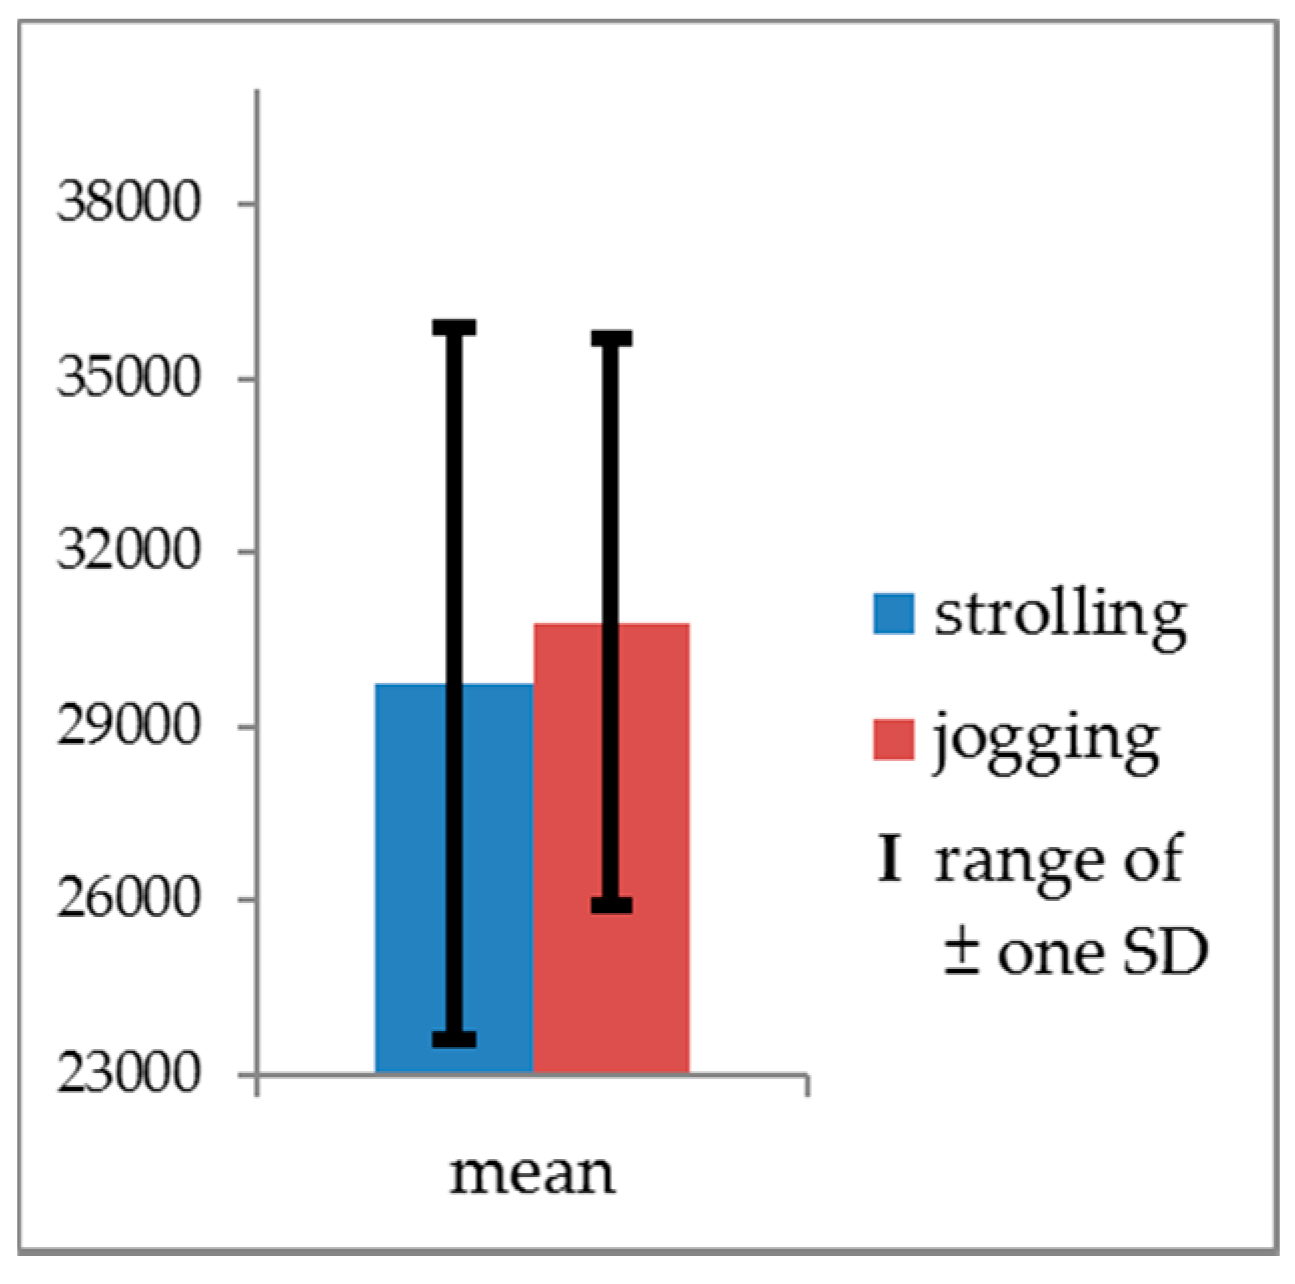
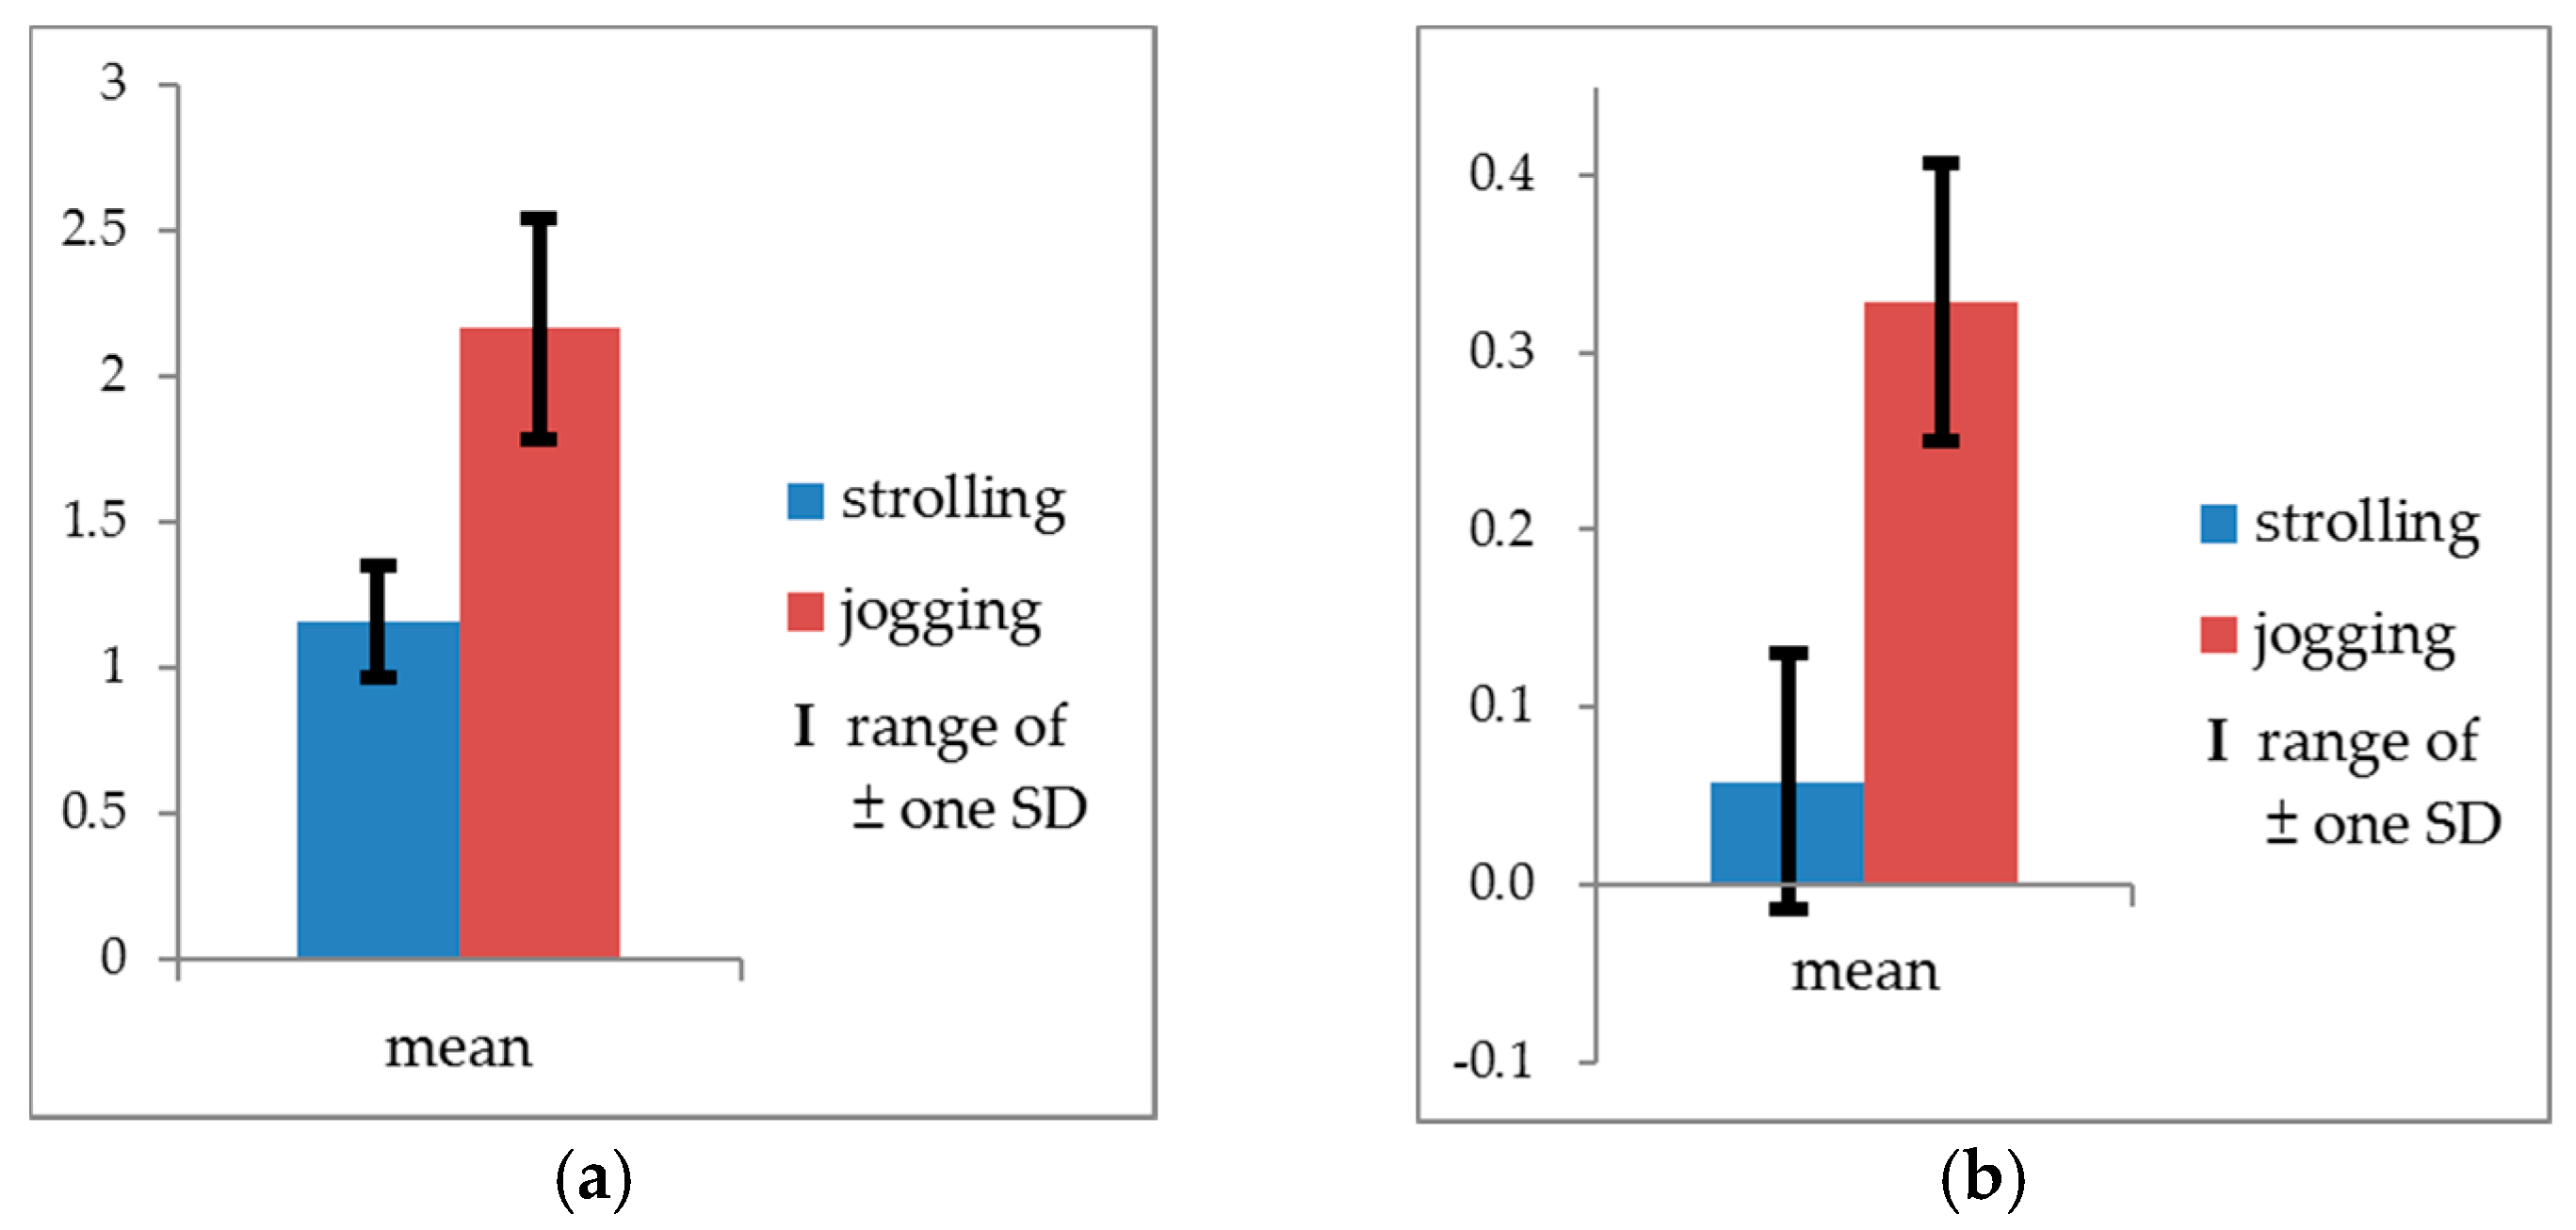
Additionally, to verify the effectiveness and sensitivity of the measurements in distinguishing the exercise intensity of strolling and jogging, one-way multivariate analysis of variance (MANOVA) was employed to identify differences between the actigraph readings and the movement speeds. Because the movement speeds in this experiment violated the assumption of homogeneity of variance, and the raw data values were all >0, the raw data underwent logarithmic transformation before being examined. The transformed data structure was not found to violate the assumption of homogeneity of variance required for MANOVA (Box’s M = 3.666, F = 1.199, p = 0.309). Given the unequal sample sizes in the strolling and jogging groups, Pillai’s Trace (V) was used in the overall test. The result was significant (Pillai’s Trace = 0.771, F = 190.257, p < 0.001). Subsequently, one-way analysis of variance (ANOVA) was used for the follow-up test. Because there were two dependent variables, a correction was necessary for the significance level of ANOVAs (α = 0.05/2 = 0.025) to avoid family-wise errors (FWE) or cumulative Type I errors [53]. According to the tests, strolling and jogging exhibited no significant difference in actigraph records, but they achieved significant difference in movement speeds (F(1,114) = 376.635, p < 0.001) with a high effect size ( = 0.768) [54]. The jogging speeds were significantly greater than those of strolling (Table 4, Figure 2 and Figure 3). Consequently, the manipulation of this experiment was deemed valid.
4.3. Correlation Analysis
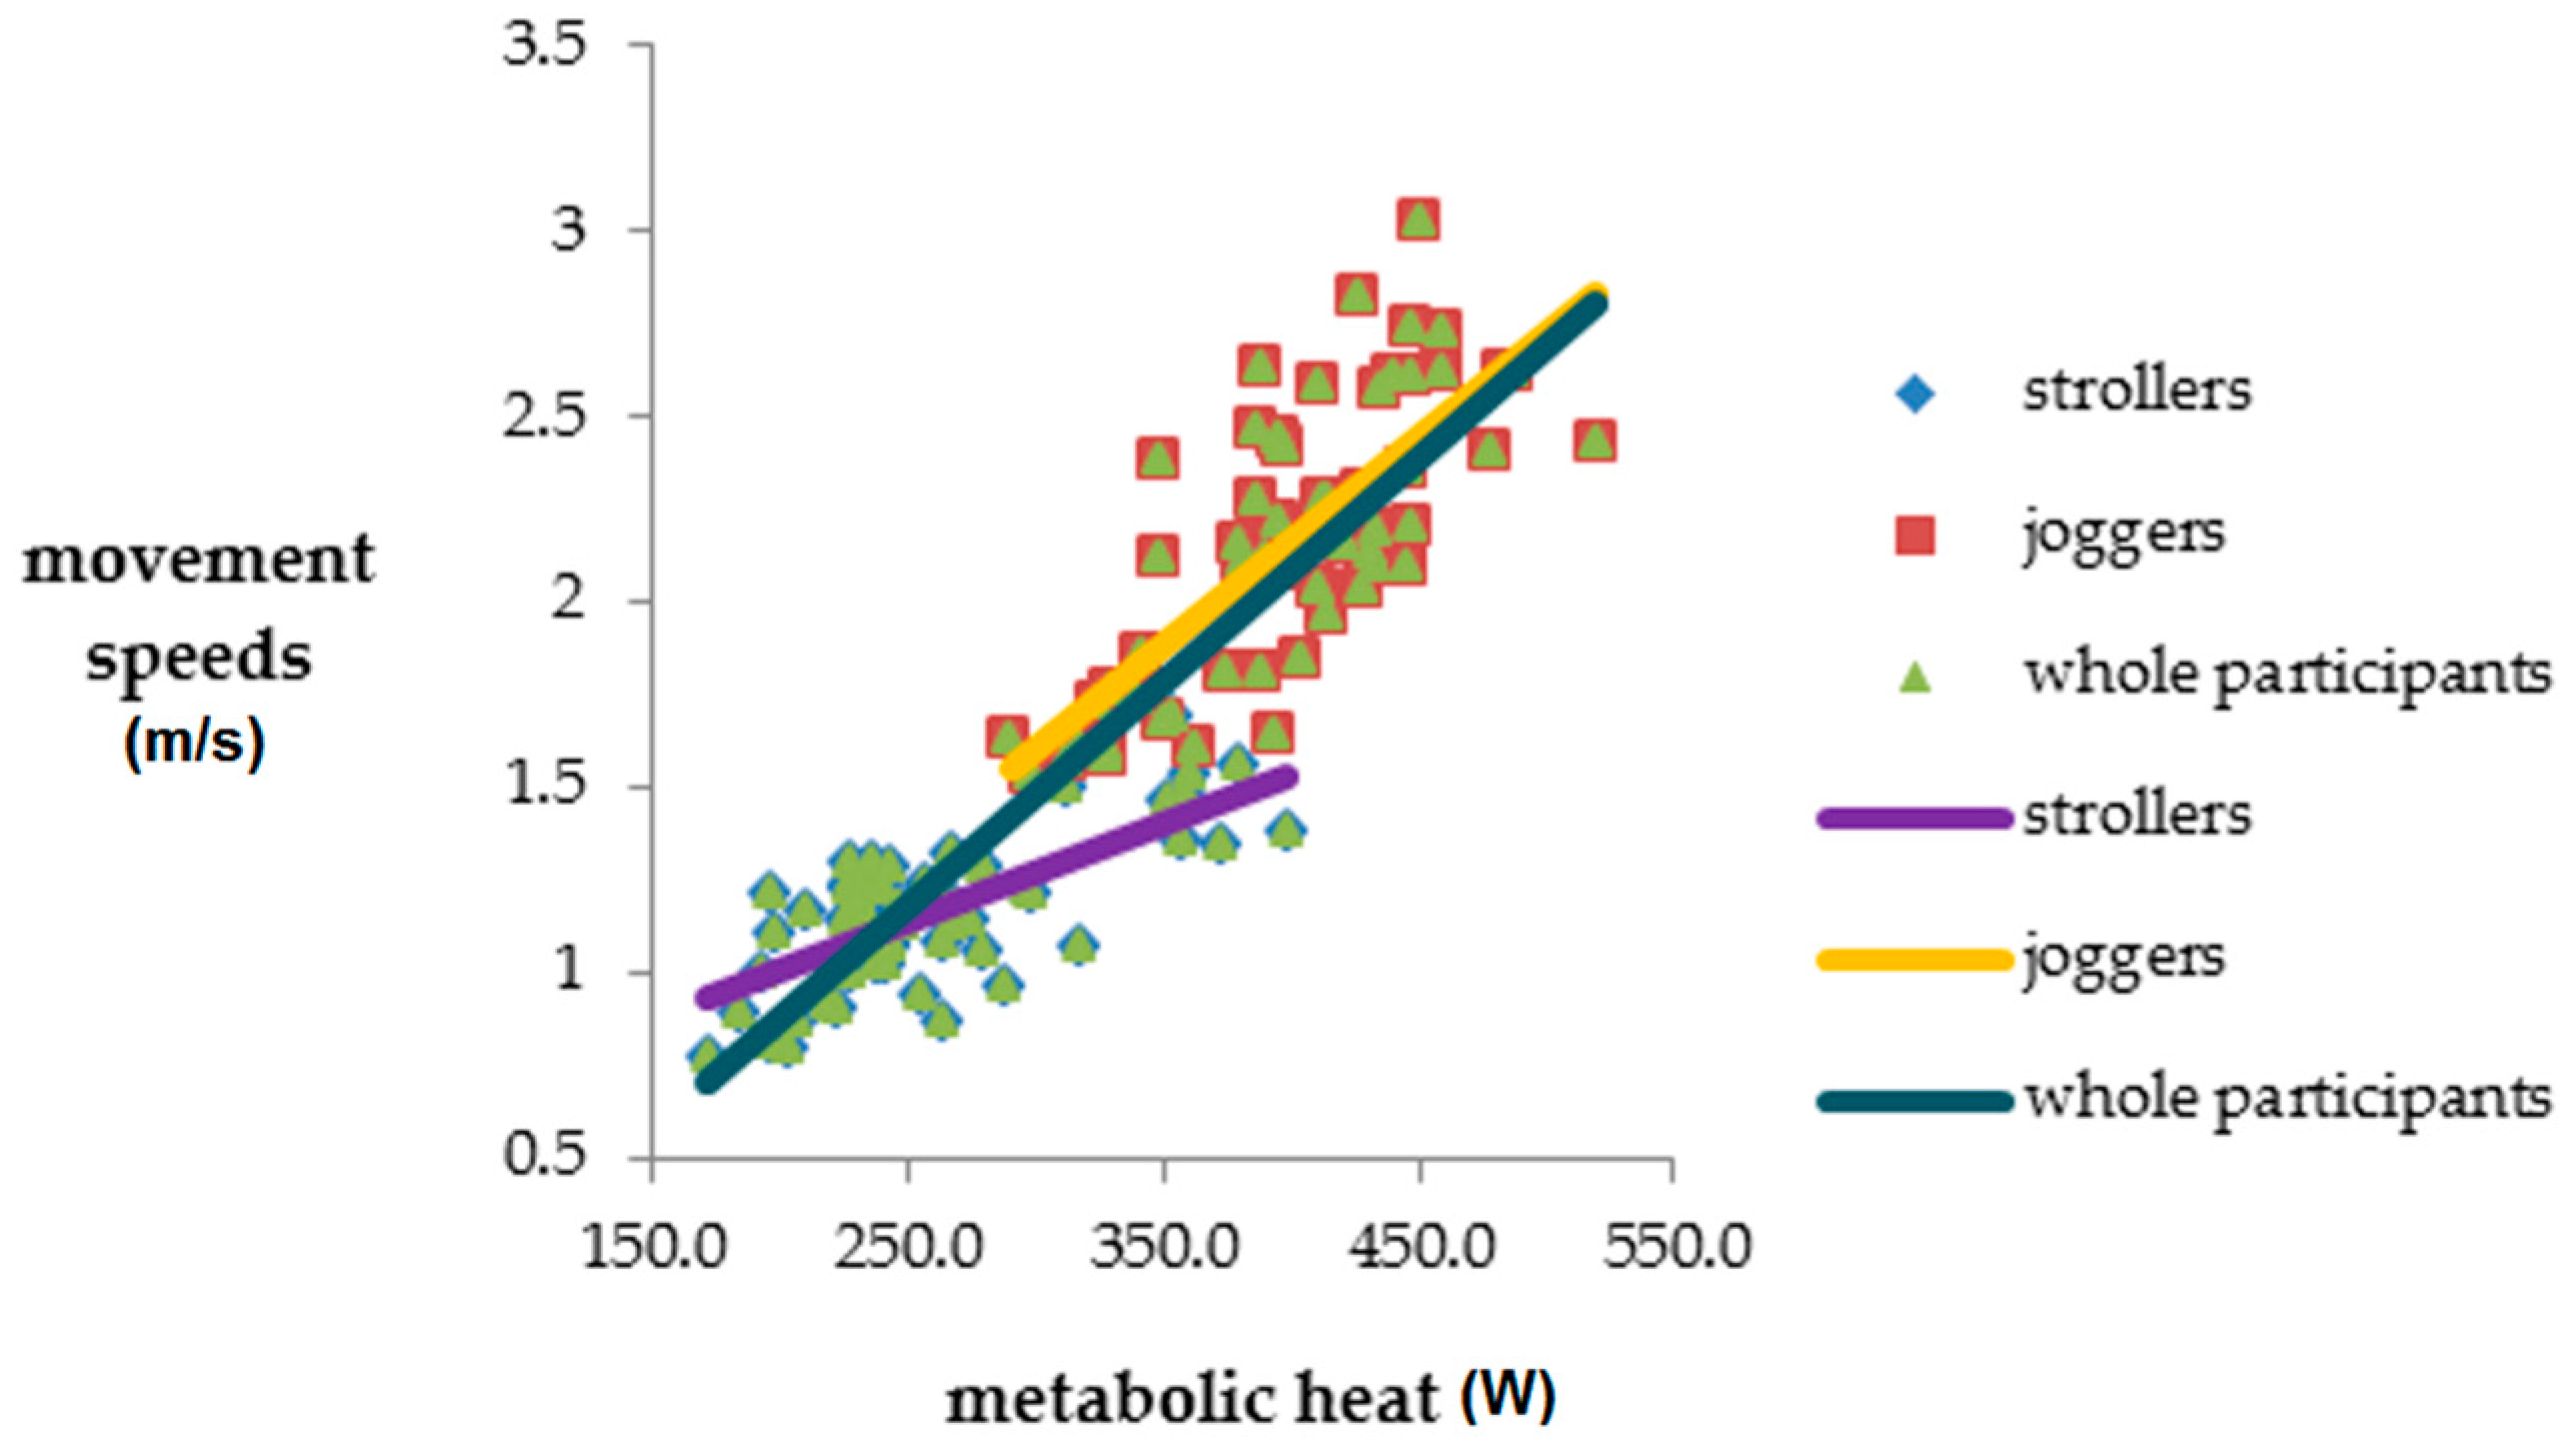
Table 5 shows the correlation analysis results for the strollers, the joggers, and all participants with respect to actigraph readings, movement speeds, and MH. The results indicated that the correlations between movement speeds and actigraph readings were nonsignificant (all p > 0.05) for the strollers, the joggers, and all participants. Moreover, actigraph readings were found to be negatively correlated with MH among the strollers, the joggers, and all participants; however, this correlation reached significance only with the strollers (p = 0.015). Meanwhile, movement speeds and MH exhibited a highly positive correlation (all p < 0.001), for the strollers, the joggers, and all participants (Figure 4).
5. Discussion
The field experiment on the validity of actigraphs to gauge the activity intensities of strolling and jogging revealed the following findings: (1) the jogging speeds determined by the participants were significantly higher than the participant-determined strolling speeds, with a high effect size; (2) the actigraph readings exhibited no significant difference between strolling and jogging, which was considered a sign of low sensitivity; (3) movement speeds and actigraph readings had a weak and nonsignificant correlation for strollers, joggers, and all participants, which indicated low convergent validity; (4) the actigraph readings exhibited negative correlations (either significant or nonsignificant) with MH, which again indicated low convergent validity; (5) movement speeds were significantly and positively correlated with MH for strollers, joggers, and particularly for all participants; and (6) given the negative correlations between movement speeds and actigraph readings and the negative correlation between MH and actigraph readings for strolling, actigraphs appeared to be particularly inappropriate for measuring low-intensity activities, which is in agreement with the findings of similar studies [38,39].
The strong positive correlations between movement speeds and MH were not surprising, because the metabolic rates that were used to calculate MH rose with movement speed [40]. Because MH accounts for not only metabolic rates related to movement speeds but also individuals’ heights and weights (i.e., BSAs), it may provide additional information and different perspectives on activity intensities other than movement speeds. This is illustrated by the different correlations between MH and movement speeds among strollers, joggers, and all participants. If MH and movement speeds were equivalent, they would have had a perfect correlation coefficient of 1. In addition to movement speeds and MH, future investigations regarding the validity of actigraph are suggested to introduce other criteria that are (1) not correlated with movement speeds and (2) present continuous and precise values, unlike the metabolic rates in Table 1, which are simply representative values for speed intervals. Furthermore, direct or indirect calorimetry devices are ideal for laboratory settings but are relatively infeasible for application in free-living environments. The activity intensities of the participants can also be measured using other approaches that are more suitable for field studies. For example, physiologic monitors can gauge heart rate, which is correlated with activity intensity, and blood pressure [55,56]. In addition, the EE of bodily movements can be estimated using metabolic equivalent task (MET) minutes [57]; the EE is calculated as the minutes engaged in an activity multiplied by the specific numbers of MET minutes required for that specific activity. Moreover, measuring activity intensity is not necessarily limited to EE. The Intelligent Device for Energy Expenditure and Activity (MiniSun LLC, Fresno, CA, USA) can measure not only EE but also limb movements, limb positions, change of positions, and gaits [58], which may provide deeper insights into PA.
This field experiment adopted a between-subjects design with a randomized controlled trial. Statistical analyses revealed no significant differences between the backgrounds of the participant groups. Given that all participants were Han Chinese, the possible bias due to phenotypical traits between groups was limited. Nevertheless, the results may not be generalizable to other ethnic groups. Alternatively, this study could have adopted a within-subjects design to account for the variability in the groups assigned to strolling and jogging. For such a design, all participants would have needed to both stroll and jog. Even with breaks between strolling and jogging, results without confounding effects between these two PAs would not have been guaranteed. Because PA is related to physical fitness [59], a PA conducted later may be influenced by a PA conducted earlier in the day, particularly among the general population, whose physical fitness may be lower than that of athletes [38].
The fact that participants’ heights and weights were self-reported rather than measured was a shortcoming of this study. The negative but nonsignificant correlations between actigraph readings and MH may have been because the self-reported heights and weights were inaccurate, which resulted in incorrectly estimated MH, or because the actigraph was inappropriate for measuring the EE.
The implementation of the experiment could also be improved in future studies. The participants were required to wear the actigraph on their nondominant arm in the present study, which might not swing at a significantly different amplitude or speed during strolling and jogging. Therefore, future investigators are suggested to place the device both on the participants’ wrists and ankles to further verify its validity [27]. Furthermore, the GPS device was carried by the assistants in the present study. This practice may be replaced with the participants wearing a GPS device on their wrist [55] that is supported by geographic information system software. This is expected to improve the accuracy of measurement for movement across undulating terrain, because this technology can provide accurate and prolonged monitoring of three-dimensional positioning and movement duration. This will further improve the measurement of EE, which varies with terrain [46]. These issues warrant further investigation.
6. Conclusions
Research-grade actigraphy is conventionally regarded as an effective method for assisting the medical evaluations of subjects’ PA [30]. However, in the present field experiment, the MicroMini Motionlogger® Actigraph was found to be insufficiently sensitive to distinguishing the PA intensities of strolling and jogging, despite the difference in movement speeds. Further studies are needed to examine whether actigraphy is an appropriate measurement method for the activity intensities of specific exercises, particularly in combination with other criterion measures. Because sedentary lifestyles have become the world’s fourth leading cause of death, PA is a matter of public health and well-being; consumer- and research-grade devices for the convenient and objective measurement of activity intensity are instrumental to the promotion of active living.
Acknowledgments
This study was part of a research project funded by the National Science Council (Grant number: NSC 102-2410-H-167-008, 2013). We are grateful to the faculty and students of the National Chin-Yi University of Technology involved in this study.
Author Contributions
Ke-Tsung Han designed and conducted the experiments; Ke-Tsung Han and Po-Ching Wang wrote the paper.
Conflicts of Interest
The authors declare no conflicts of interest.
References
- Barton, J.; Hine, R.; Pretty, J. The health benefits of walking in green spaces of high natural and heritage value. J. Integr. Environ. Sci. 2009, 6, 261–278. [Google Scholar] [CrossRef]
- Pretty, J.; Peacock, J.; Sellengs, M.; Griffen, M. The mental and physical health outcomes of green exercise. Int. J. Environ. Health Res. 2005, 15, 319–337. [Google Scholar] [CrossRef] [PubMed]
- Hallman, D.M.; Sato, T.; Kristiansen, J.; Gupta, N.; Skotte, J.; Holtermann, A. Prolonged sitting is associated with attenuated heart rate variability during sleep in blue-collar workers. Int. J. Environ. Res. Public Health 2015, 12, 14811–14827. [Google Scholar] [CrossRef] [PubMed]
- DCMS. Game Plan: A Strategy for Delivering Government’s Sport and Physical Activity Objectives; Department of Culture, Media and Sport and Cabinet Office: London, UK, 2002.
- Sports Affair Council, Executive Yuan. Sport City Survey; Sports Affair Council, Executive Yuan: Taipei, Taiwan, 2010.
- World Health Organization. The World Health Report 2002-Reducing Risks, Promoting Healthy Life; World Health Organization: Geneva, Switzerland, 2011; p. 61. [Google Scholar]
- Lai, C.T.; Su, C.H. The differences of physical and mental health on male collegiate students at the different levels of active life. J. Phys. Educ. Sport Sci. 2009, 9, 43–50. [Google Scholar]
- Walker, R.K.; Hickey, A.M.; Freedson, P.S. Advantages and limitations of wearable activity trackers: Considerations for patients and clinicians. Clin. J. Oncol. Nurs. 2016, 20, 606–610. [Google Scholar] [CrossRef] [PubMed]
- Calkins, M.; Szmerekovsky, J.G.; Biddle, S. Effect of increased time spent outdoors on individuals with dementia residing in nursing homes. J. Hous. Elder. 2007, 21, 211–228. [Google Scholar] [CrossRef]
- Rapport, M.D.; Kofler, M.J.; Himmerich, C. Activity measurement. In Clinician’s Handbook of Child Behavioral Assessment; Hersen, M., Ed.; Elsevier Academic Press: New York, NY, USA, 2006; pp. 125–157. [Google Scholar]
- Diouf, A.; Thiam, M.; Idohou-Dossou, N.; Diongue, O.; Mégné, N.; Diallo, K.; Sembène, P.M.; Wade, S. Physical activity level and sedentary behaviors among public school children in Dakar (Senegal) measured by PAQ-C and accelerometer: Preliminary results. Int. J. Environ. Res. Public Health 2016, 13, 998. [Google Scholar] [CrossRef] [PubMed]
- Lee, K.Y.; Lee, P.H.; Macfarlane, D. Associations between moderate-to-vigorous physical activity and neighbourhood recreational facilities: The features of the facilities matter. Int. J. Environ. Res. Public Health 2014, 11, 12594–12610. [Google Scholar] [CrossRef] [PubMed]
- Wang, J.J.; Baranowski, T.; Lau, P.W.C.; Chen, T.A.; Zhang, S.G. Psychological correlates of self-reported and objectively measured physical activity among Chinese children—Sychological correlates of PA. Int. J. Environ. Res. Public Health 2016, 13, 1006. [Google Scholar] [CrossRef] [PubMed]
- Sadeh, A.; Hauri, P.J.; Kripke, D.F.; Lavie, P. An American sleep disorders association review: The role of actigraphy in the evaluation of sleep disorders. Sleep 1995, 18, 288–302. [Google Scholar] [CrossRef] [PubMed]
- Tryon, W.W. Actigraphy Measurement in Psychology and Medicine; Plenum Press: New York, NY, USA, 1991. [Google Scholar]
- Ancoli-Israel, S.; Cole, R.; Alessi, C.; Chambers, M.; Moorcroft, W.; Pollak, C. The role of actigraphy in the study of sleep and circadian rhythms. Sleep 2003, 26, 342–392. [Google Scholar] [CrossRef] [PubMed]
- Stone, K.L.; Ancoli-Israel, S. Actigraphy. In Principles and Practice of Sleep Medicine; Kryger, M., Roth, T., Dement, W., Eds.; Elsevier: New York, NY, USA, 2011; pp. 1668–1675. [Google Scholar]
- Sadeh, A. Actigraphy. In Clinical Neurophysiology of Sleep Disorders Handbook of Clinical Neurophysiology; Guilleminault, C., Ed.; Elsevier: New York, NY, USA, 2005; pp. 67–72. [Google Scholar]
- Sadeh, A. The role and validity of actigraphy in sleep medicine: An update. Sleep Med. Rev. 2011, 15, 259–267. [Google Scholar] [CrossRef] [PubMed]
- Tryon, W.W. Human activity: A review of quantitative findings. In Behavioral Assessment in Behavioral Medicine; Tryon, W.W., Ed.; Springer: New York, NY, USA, 1985; pp. 257–299. [Google Scholar]
- Cook, T.D.; Campbell, D.T. Quasi-Experimentation: Design & Analysis issues for Field Settings; Houghton Mifflin: Boston, MA, USA, 1979. [Google Scholar]
- Evenson, K.R.; Goto, M.M.; Furberg, R.D. Systematic review of the validity and reliability of consumer-wearable activity trackers. Int. J. Behav. Nutr. Phys. Act. 2015, 12, 159. [Google Scholar] [CrossRef] [PubMed]
- Cuberek, R.; Ansari, W.E.; Frömel, K.; Skalik, K.; Sigmund, E.A. Comparison of two motion sensors for the assessment of free-living physical activity of adolescents. Int. J. Environ. Res. Public Health 2010, 7, 1558–1576. [Google Scholar] [CrossRef] [PubMed]
- Ferguson, T.; Rowlands, A.V.; Olds, T.; Maher, C. The validity of consumer-level, activity monitors in healthy adults worn in free-living conditions: A cross-sectional study. Int. J. Behav. Nutr. Phys. Act. 2015, 12, 42. [Google Scholar]
- Kaplan, R.M.; Saccuzzo, D.P. Psychological Testing: Principles, Applications, and Issues; Brooks/Cole Publishing: Pacific Grove, CA, USA, 1989. [Google Scholar]
- Sports Administration, Ministry of Education. The 102 Year Sports Statistics of the Republic of China; Sports Administration, Ministry of Education: Taipei, Taiwan, 2013.
- Grap, M.J.; Hamilton, V.A.; McNallen, A.; Ketchum, J.M.; Best, A.M.; Arief, N.Y.I.; Wetzel, P.A. Actigraphy: Analyzing patient movement. Heart Lung 2011, 40, 52–59. [Google Scholar] [CrossRef] [PubMed]
- Hersen, M. Clinician’s Handbook of Child Behavioral Assessment; Elsevier Academic Press: New York, NY, USA, 2005. [Google Scholar]
- Rapport, M.D.; Bolden, J.; Kofler, M.J.; Sarver, D.E.; Raiker, J.S.; Alderson, R.M. Hyperactivity in boys with attention-deficit/hyperactivity disorder (ADHD): A ubiquitous core symptom or manifestation of working memory deficits? J. Abnorm. Child Psychol. 2009, 37, 521–534. [Google Scholar] [CrossRef] [PubMed]
- De Souza, L.; Benedito-Silva, A.A.; Pires, M.L.; Poyares, D.; Tufik, S.; Calil, H.M. Further validation of actigraphy for sleep studies. Sleep 2003, 26, 81–85. [Google Scholar] [CrossRef] [PubMed]
- Bai, Y.; Welk, G.J.; Nam, Y.H.; Lee, J.A.; Lee, J.M.; Kim, Y.; Meier, N.F.; Dixon, P.M. Comparison of consumer and research monitors under semistructured settings. Med. Sci. Sports Exerc. 2016, 48, 151–158. [Google Scholar] [CrossRef] [PubMed]
- Kooiman, T.J.M.; Dontje, M.L.; Sprenger, S.R.; Krijnen, W.P.; van der Schans, C.P.; de Groot, M. Reliability and validity of ten consumer activity trackers. Sports Sci. Med. Rehabil. 2015, 7, 24. [Google Scholar] [CrossRef] [PubMed]
- Brown, A.C.; Smolensky, M.H.; D’Alonzo, G.E.; Redman, D.P. Actigraphy: A means of assessing circadian patterns in human activity. Chronobiol. Int. 1990, 7, 125–133. [Google Scholar] [CrossRef] [PubMed]
- Cole, R.J.; Kripke, D.F.; Gruen, W.; Mullaney, D.J.; Gillin, J.C. Automatic sleep/wake identification from wrist activity. Sleep 1992, 15, 461–469. [Google Scholar] [CrossRef] [PubMed]
- Matsumoto, M.; Miyagishi, T.; Sack, R.L.; Hughes, R.J.; Blood, M.L.; Lewy, A.J. Evaluation of the Actillume wrist actigraphy monitor in the detection of sleeping and waking. Psychiatry Clin. Neurosci. 1998, 52, 160–161. [Google Scholar] [CrossRef] [PubMed]
- Grap, M.J.; Borchers, C.T.; Munro, C.L.; Elswick, R.K., Jr.; Sessler, C.N. Actigraphy in the critically ill: Correlation with activity, agitation, and sedation. Am. J. Crit. Care 2005, 14, 52–60. [Google Scholar] [PubMed]
- Janssen, X.; Cliff, D.P.; Reilly, J.J.; Hinkley, T.; Jones, R.A.; Batterham, M.; Ekelund, U.; Brage, S.; Okely, A.D. Predictive validity and classification accuracy of ActiGraph energy expenditure equations and cut-points in young children. PLoS ONE 2013, 8, e79124. [Google Scholar] [CrossRef] [PubMed]
- Abel, M.G.; Hannon, J.C.; Sell, K.; Lillie, T.; Conlin, G.; Anderson, D. Validation of the Kenz Lifecorder EX and ActiGraph GT1M accelerometers for walking and running in adults. Appl. Physiol. Nutr. Metab. 2008, 33, 1155–1164. [Google Scholar] [CrossRef] [PubMed]
- Gusmer, R.J.; Bosch, T.A.; Watkins, A.N.; Ostrem, J.D.; Dengel, D.R. Comparison of FitBit® Ultra to ActiGraph™ GT1M for assessment of physical activity in young adults during treadmill walking. J. Open Sports Med. 2014, 8, 11–15. [Google Scholar] [CrossRef]
- Kreider, J.F.; Curtiss, P.S.; Rabl, A. Heating and Cooling of Buildings: Design for Efficiency, revised 2nd ed.; CRC Press: Boca Raton, FL, USA, 2009. [Google Scholar]
- DuBois, D.; DuBois, E.F. A formula to estimate the approximate surface area if height and weight be known. Arch. Intern. Med. 1916, 17, 863–871. [Google Scholar] [CrossRef]
- Lin, C.H. Establishment of a Database and Calculation Formula for Human Body Surface Areas, Hsinchu. Ph.D. Thesis, Department of Industrial Engineering and Engineering Management, National Tsing Hua University, Hsinchu, Taiwan, 2010. [Google Scholar]
- Buchowski, M.S. Doubly labeled water is a validated and verified reference standard in nutrition research. J. Nutr. 2014, 144, 573–574. [Google Scholar] [CrossRef] [PubMed]
- Kaiyala, K.J.; Ramsay, D.S. Direct animal calorimetry, the underused gold standard for quantifying the fire of life. Comp. Biochem. Physiol. A Mol. Integr. Physiol. 2011, 158, 252–264. [Google Scholar] [CrossRef] [PubMed]
- Shadish, W.R.; Cook, T.D.; Campbell, D.T. Experimental and Quasi-Experimental Designs for Generalized Causal Inference; Houghton Mifflin: Boston, MA, USA, 2002. [Google Scholar]
- Passmore, R.; Durnin, J.V.G.A. Human energy expenditure. Physiol. Rev. 1955, 35, 801–840. [Google Scholar] [PubMed]
- Torres, N. Accuracy of the RT3, BioTrainer-Pro, and SensWear Armband to Measure Energy Cost of Treadmill Walking and Running. Unpublished Master’s Thesis, The University of Texas at El Paso, El Paso, TX, USA, 2003. [Google Scholar]
- Reece, J.D. Reduce Your Sit and be More Fit: An Examination of Sedentary Behavior. Unpublished Ph.D. Thesis, Middle Tennessee State University, Murfreesboro, TN, USA, 2013. [Google Scholar]
- Bowler, D.E.; Buyung-Ali, L.M.; Knight, T.M.; Pullin, A.S. A systematic review of evidence for the added benefits to health of exposure to natural environments. BMC Public Health 2010, 10, 456. [Google Scholar] [CrossRef] [PubMed]
- Xia, H. Quora. Available online: https://www.quora.com/How-accurate-is-the-Nike+-iPhone-app-in-measuring-distance (accessed on 7 March 2017).
- Johansson, M.; Hartig, T.; Staats, H. Psychological benefits of walking: Moderation by company and outdoor environment. Appl. Psychol. Health Well Being 2011, 3, 261–280. [Google Scholar] [CrossRef]
- Canadian Society for Exercise Physiology. The Physical Activity Readiness Questionnaire, PAR-Q; Canadian Society for Exercise Physiology: Ottawa, ON, CA, 2002. [Google Scholar]
- Wu, M.L.; Chang, Y.R. SPSS and Statistical Analysis Application; Wunan Press: Taipei, Taiwan, 2011. [Google Scholar]
- Huck, S.W. Reading Statistics and Research; Pearson Education, Inc.: Boston, MA, USA, 2012. [Google Scholar]
- Fjortoft, I.; Kristofersen, B.; Sageie, J. Children in schoolyards: Tracking movement patterns and physical activity in schoolyards using global positioning system and heart rate monitoring. Landsc. Urban Plan. 2009, 93, 210–217. [Google Scholar] [CrossRef]
- Tang, J.W.; Brown, R.D. The effect of viewing a landscape on physiological health of elderly women. J. Hous. Elder. 2005, 19, 187–202. [Google Scholar] [CrossRef]
- Bushman, B.A. How can I use METS to quantify the amount of aerobic exercise? ACSMS Health Fit. J. 2012, 16, 5–7. [Google Scholar] [CrossRef]
- Zhang, K.; Pi-Sunyer, F.X.; Boozer, C.N. Improving energy expenditure estimation for physical activity. Med. Sci. Sports Exerc. 2004, 36, 883–889. [Google Scholar] [CrossRef] [PubMed]
- Bouchard, C.; Shephard, R.J. Physical activity, fitness, and health: The model and key concepts. In Physical Activity, Fitness, and Health-International Proceedings and Consensus Statement; Bouchard, C., Shephard, R.J., Stephens, T., Eds.; Human Kinetics Publishers: Champaign, IL, USA, 1994; pp. 77–88. [Google Scholar]
Figure 1.
Experimental environment.
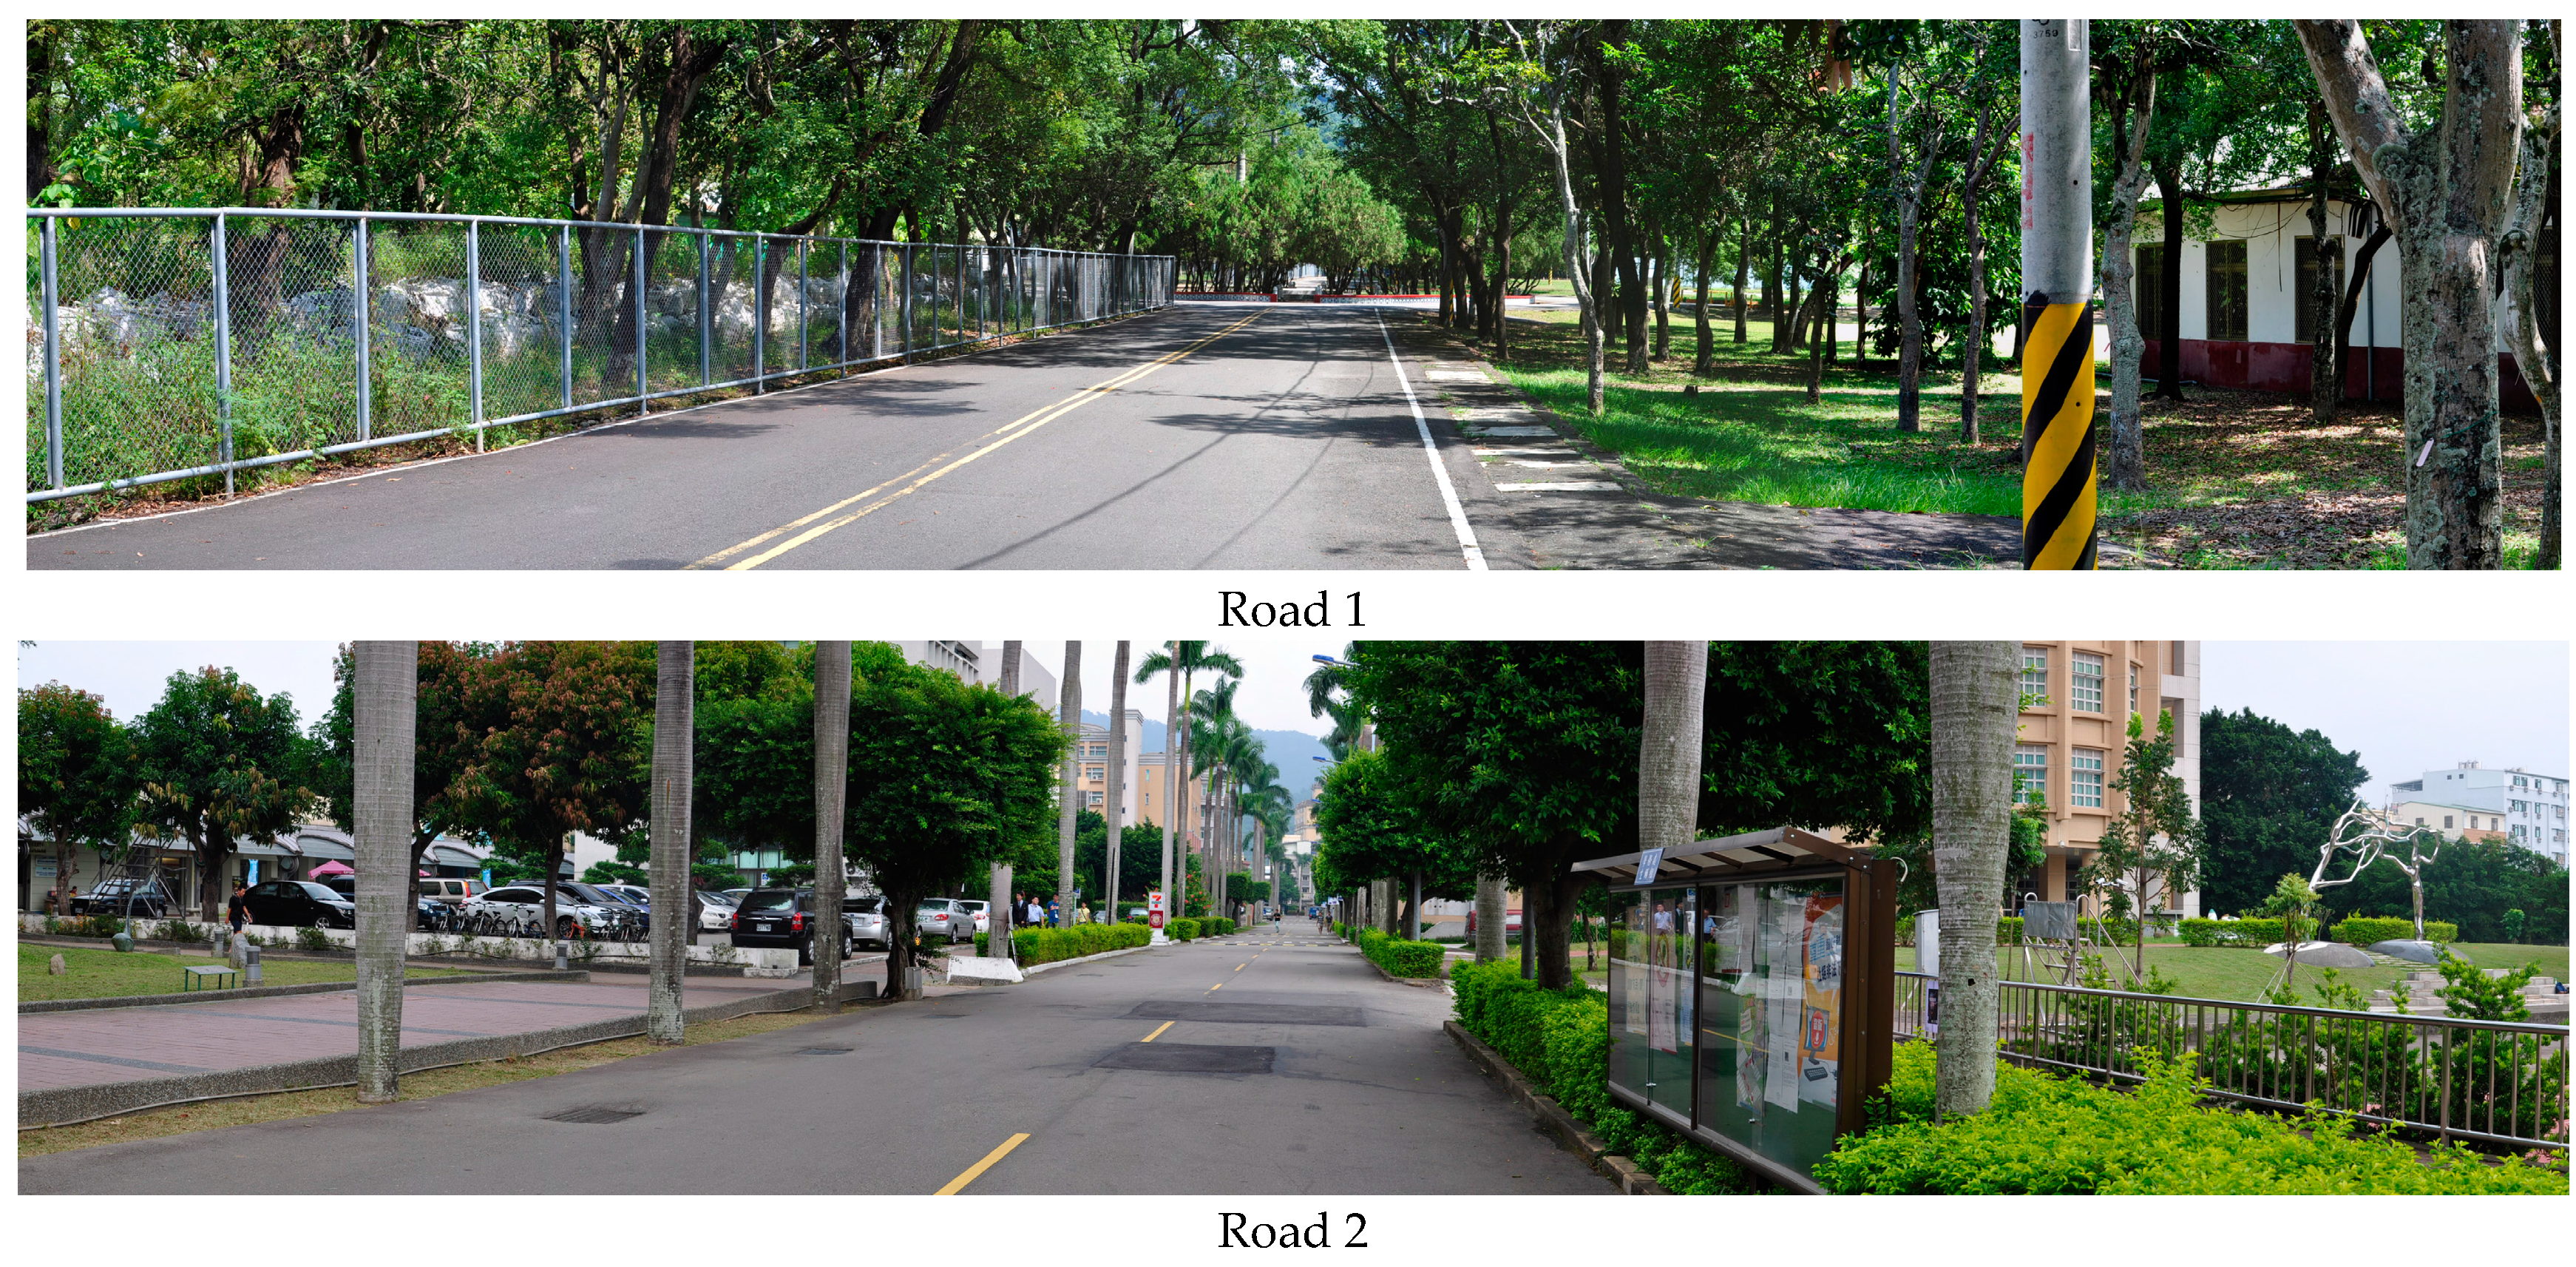
Figure 2.
Means and SDs of actigraph readings (PIM counts).
Figure 3.
Means and SDs of movement speeds (m/s). (a) Raw data; (b) Logarithmic transformations.
Figure 4.
Correlations between metabolic heat (MH) and movement speeds among strollers, joggers, and all participants.
Figure 4.
Correlations between metabolic heat (MH) and movement speeds among strollers, joggers, and all participants.

Table 1.
Metabolic rates.
| Movement Speed (m/s) | Metabolic Rate (W/m2) | Note |
|---|---|---|
| 0.89 | 115 | 115 W/m2 for <0.89 m/s |
| 1.34 | 150 | 150 W/m2 for 0.90–1.34 m/s |
| 1.79 | 220 | 220 W/m2 for 1.35–1.79 m/s |
| 1.80 | 255 | 255 W/m2 for >1.80 m/s |
Source: Kreider et al. [40].
Table 2.
Descriptive statistics of participants.
| Background | Classification | Number of Participants (n = 116) | Percentage (%) |
|---|---|---|---|
| Sex | Male | 52 | 44.8 |
| Female | 64 | 55.2 | |
| Age | 18–20 years | 45 | 38.8 |
| 21–24 years | 70 | 60.3 | |
| 25–30 years | 1 | 0.9 | |
| >31 years | 0 | 0 | |
| Height | 141–150 cm | 6 | 5.2 |
| 151–160 cm | 29 | 24.9 | |
| 161–170 cm | 48 | 42.3 | |
| 171–180 cm | 27 | 23.2 | |
| >181 cm | 5 | 4.4 | |
| Weight | 40–50 kg | 26 | 22.4 |
| 51–60 kg | 56 | 48.1 | |
| 61–70 kg | 24 | 20.7 | |
| 71–80 kg | 7 | 6.1 | |
| 81–90 kg | 2 | 1.8 | |
| >91 kg | 1 | 0.9 | |
| College | Engineering | 0 | 0 |
| Management | 5 | 4.3 | |
| Electrical engineering & computer science | 27 | 23.3 | |
| Humanities and creativity | 84 | 72.4 | |
| Year | Freshman | 17 | 14.6 |
| Sophomore | 43 | 37.1 | |
| Junior | 50 | 43.1 | |
| Senior | 5 | 4.3 | |
| Graduate | 1 | 0.9 |
Table 3.
Descriptive statistics of movement speeds.
| Exercise Type | Number of Participants | Minimum (m/s) | Maximum (m/s) | Mean (m/s) | Standard Deviation (m/s) | Skewness | Kurtosis |
|---|---|---|---|---|---|---|---|
| Strolling | 61 | 0.77 | 1.69 | 1.16 | 0.19 | 0.29 | 0.46 |
| Jogging | 55 | 1.54 | 3.03 | 2.17 | 0.38 | 0.04 | −0.85 |
Table 4.
Statistical results for jogging and strolling.
| Dependent Variable | MANOVA (Overall Test) | ANOVA (Follow-Up Tests) | |||||
|---|---|---|---|---|---|---|---|
| F | p | Pillai’s Trace (V) | F | p | Partial Eta Squared () | Post-Hoc Tests | |
| Actigraph readings | 190.257 *** | <0.001 | 0.771 | 0.995 | 0.321 | 0.009 | N/A |
| Movement speeds | 376.635 *** | <0.001 | 0.768 | Jogging > Strolling | |||
Notes: Independent variable = Exercise type; FWE = 0.025 (Bonferroni approach); *** denotes p < 0.001.
Table 5.
Results of correlation analysis with Pearson’s correlation coefficient.
| Variable | Actigraph Readings | Movement Speeds | ||||
|---|---|---|---|---|---|---|
| Strollers | Joggers | Whole | Strollers | Joggers | Whole | |
| (n = 61) | (n = 55) | (n = 116) | (n = 61) | (n = 55) | (n = 116) | |
| Movement speeds | −0.179 | 0.002 | 0.047 | N/A | N/A | N/A |
| (p = 0.167) | (p = 0.990) | (p = 0.614) | ||||
| MH | −0.310 * | −0.009 | −0.032 | 0.714 *** | 0.748 *** | 0.905 *** |
| (p = 0.015) | (p = 0.950) | (p = 0.733) | (p = 0.000) | (p = 0.000) | (p = 0.000) | |
Notes: two-tailed tests, where * denotes p < 0.05 and *** denotes p < 0.001.
© 2017 by the authors. Licensee MDPI, Basel, Switzerland. This article is an open access article distributed under the terms and conditions of the Creative Commons Attribution (CC BY) license (http://creativecommons.org/licenses/by/4.0/).
Share and Cite
MDPI and ACS Style
Han, K.-T.; Wang, P.-C. Validity of Research-Grade Actigraphy Unit for Measuring Exercise Intensity. Int. J. Environ. Res. Public Health 2017, 14, 511. https://doi.org/10.3390/ijerph14050511
AMA Style
Han K-T, Wang P-C. Validity of Research-Grade Actigraphy Unit for Measuring Exercise Intensity. International Journal of Environmental Research and Public Health. 2017; 14(5):511. https://doi.org/10.3390/ijerph14050511
Chicago/Turabian StyleHan, Ke-Tsung, and Po-Ching Wang. 2017. "Validity of Research-Grade Actigraphy Unit for Measuring Exercise Intensity" International Journal of Environmental Research and Public Health 14, no. 5: 511. https://doi.org/10.3390/ijerph14050511
Note that from the first issue of 2016, this journal uses article numbers instead of page numbers. See further details here.