1. Introduction and Background
Worldwide, airborne particulate matter (PM) in outdoor ambient air has received increased attention due to its associations with cardiovascular and respiratory morbidity and mortality. The Global Burden of Disease Study ranked PM as the ninth leading risk factor for respiratory and cardiovascular diseases and various cancers [
1]. Additionally, in the same year PM was ranked fifth on the list of top causes of all-cause mortality [
2]. Globally approximately 3.2 million premature deaths are attributed to exposure to PM annually [
3]. Particulate matter of aerodynamic diameter less than 2.5 microns (PM
2.5) and less than 10 microns (PM
10) are of public importance because they are respirable in size leading to pulmonary diseases. Both long term (reductions in lung functions) and short term (cough, wheeze, phlegm and shortness of breath) respiratory effects due to exposure to PM have been reported globally [
4,
5,
6,
7,
8,
9,
10]. The most commonly reported respiratory symptoms include cough, wheeze, dyspnea, sneezing and phlegm [
11,
12,
13,
14]. Additionally, lung function measured as forced expiratory volume in one second (FEV1), forced vital capacity (FVC), ratio of forced expiratory volume in one second and forced vital capacity (ratio of FEV1/FVC), peak expiratory flow rate (PEFR) and peak expiratory flow (PEF) has also been shown to be reduced [
10,
12,
15,
16].
Even though thresholds have been identified, the adverse effect of exposure to PM concentrations below these thresholds has been observed. The World Health Organization (WHO) recommends exposure levels not exceeding 10 µg/m
3 annually and 25 µg/m
3 in 24-h mean (not exceeding for more than 3 days a year) for PM
2.5; and 20 µg/m
3 annually and 50 µg/m
3 in 24-h mean for PM
10 [
17]. Notwithstanding the WHO recommendations, countries have established different cut-off levels as safe exposure [
18]. The decision for these levels is determined mainly by economic considerations [
19]. Developed countries have more stringent standards and advanced strategies to reduce air pollution with PM than developing countries [
18]. For instance, the U.S. Environmental Protection Agency (EPA) air quality standard is set at 12 µg/m
3 annual and 35 µg/m
3 in 24-h concentration for PM
2.5, and 150 µg/m
3 in 24-h not to be exceeded more than once per year on average over a 3-year period for PM
10. Emerging economies like China and India are beginning to build their environmental management systems and have set their standards as follows; 70 µg/m
3 annual and 150 µg/m
3 for 24-h for PM
10, and 75 µg/m
3 in 24-h mean concentration for PM
2.5 for urban areas [
20]. Among countries in the southern African region only South Africa has set exposure level standards; for PM
10 of 60 µg/m
3 annual and 180 µg/m
3 maximum in 24-h concentration [
17]. Zambia, like several other countries that have not promulgated their own standards due to local constraints and capabilities, uses WHO air quality guidelines.
The cement industry is a major contributor to total global PM emissions [
19,
21]. Within a cement factory, considerable amounts of PM as dust is generated at almost every stage of the manufacturing process; from quarrying of the raw material to the packing [
22]. The PM result as fugitive dust within and in surrounding areas of cement plants. Cement dust derived PM levels above the minimum acceptable values have been reported in both the factory plant and communities residing near the cement plants. For instance, Tiwari et al. reported high levels of PM in a community located about 1.5 km from a cement factory that exceeded the WHO recommendations [
23]. In a related study [
24] in Nigeria, the total atmospheric dust was reported at an average concentration of 650 μg/m
3, more than 600 μg/m
3 higher than the recommended safe limit of 25 μg/m
3 set by the Federal Environmental Protection Agency (FEPA). Similarly, other cement plant locations have found evidence of total PM concentration ranging from 196.19 μg/m
3 to 423.83 μg/m
3, which is above the 24-h average WHO guideline value of 120 μg/m
3 for total PM concentration [
22]. In a related study [
25], one community lying within a radius of 1.2 km of a cement factory experienced PM
10 concentrations higher than the recommended 24-h mean on more than the recommended maximum 35 days annually. Several other studies [
8,
26,
27], that assessed air quality in similar communities, have demonstrated comparable findings.
Currently, most evidence in literature regarding the effect of the emissions from cement production is from studies conducted within the factory plants and involved mostly workers. Understanding the effects of exposure to cement dust on human respiratory health for communities residing near cement factories is imperative, as it would allow for interventions that would balance between cement production and protection of human health. This is possible only when knowledge about the extent of the air pollution and its adverse health effects is measured precisely. The objective of this study, using a prospective panel study, was to investigate the seasonal variations in concentrations of PM (PM2.5 and PM10) and effects on respiratory health in a community around a cement factory, in Chilanga, Zambia.
3. Results
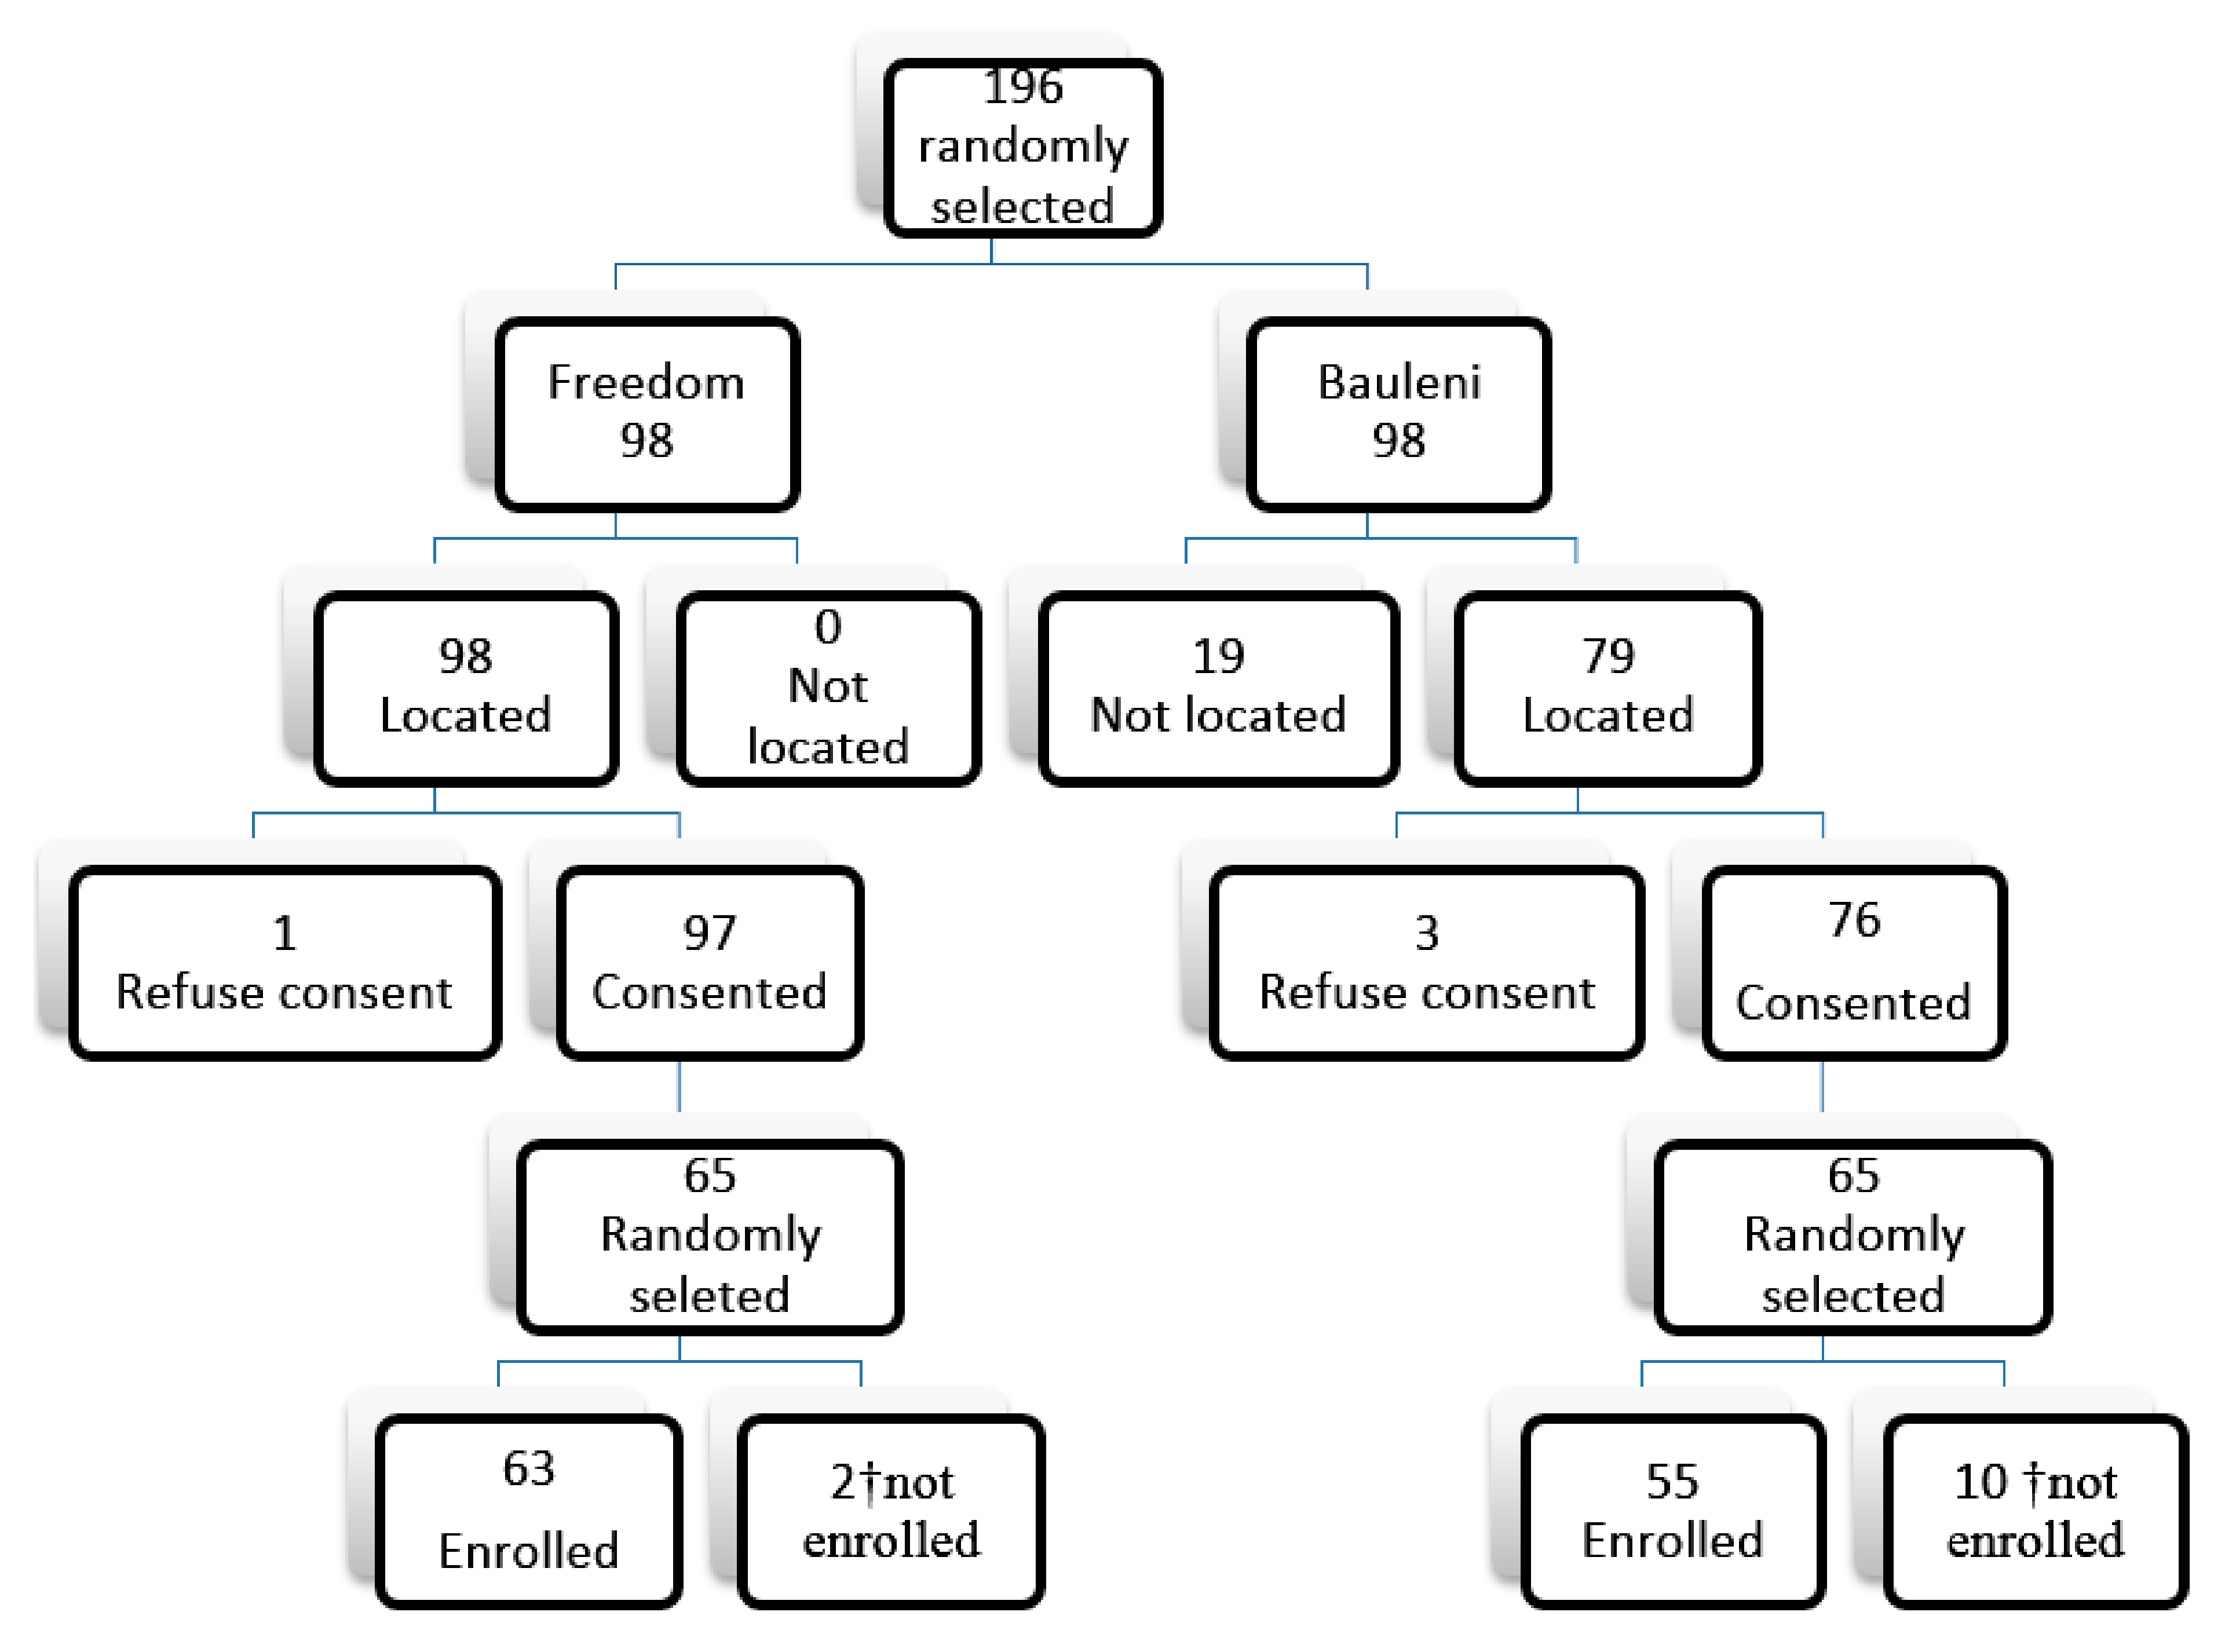
Table 1 provides a description of the cohort study population. We recruited 116 participants; 63 and 53 from Freedom and Bauleni communities respectively with 4753 person-days data points. An 87.1% completion rate was achieved. Loss to follow-up was mostly due to relocation of study participants from the respective study sites. On average 52 participants from both communities completed the daily symptom diary symptom for each season. The average age for participants was 30 and 40 years from the exposed and control group respectively. There was no statistically significant difference in age, weight, smoking status, employment status of the study participants, source of energy used for cooking and lighting between the two communities (
p value > 0.05). Very low proportion of participants reported being current smokers; 4.8% and 5.5% for Freedom and Bauleni, respectively. Electricity was the most commonly used source of energy for lighting and cooking in both communities. Generally, the prevalence of all the respiratory symptoms were higher in the exposed than control community and the difference was statistically significant (
p value < 0.05).
Table 2 gives a summary of 24-h PM concentrations (PM
2.5 and PM
10) in the ambient and meteorological parameters across the seasons from cold dry through to wet season by location. The PM
2.5 concentrations were higher in the exposed compared to control community. Further seasonal variations were observed in both communities; the highest concentrations were recorded in the hot dry season compared to the other two seasons. For the exposed community, the seasonal 24-h mean concentrations (in μg/m
3) ranged from 2.39 in warm rainy to 24.93 in hot dry season whereas the 24-h mean concentrations for the control community were significantly lower ranging from 1.9 μg/m
3 in warm rainy season to 6.89 μg/m
3 in hot season. The 24-h mean concentrations for PM
10 for both communities tended to follow the same pattern as that of PM
2.5. In the exposed community, concentrations ranged from 7.03 μg/m
3 in warm rainy to 68.28 μg/m
3 in hot season and from 2.26 μg/m
3 warm rain to 8.82 μg/m
3 hot dry season. There was no statistically significant difference in meteorological characteristics (temperature and humidity) between the exposed and control sites during the study period (
p value = 0.557 and 0.658, respectively).
Cough and nose irritation were the commonly reported symptoms. Additionally, the incidence rates of the symptoms were higher in Freedom compared to the control (
Table 3). Furthermore, incidence rate of the symptoms showed variation from season to season within each community. However, the variation was wider in the exposed compared to the control (e.g., the incidence rate of cough ranged was 12.4% and 15.9% in Bauleni while 10.4% and 75.1% in Freedom for the warm rainy and hot dry seasons respectively). Similar observations were made of the other symptoms. To be noted also is that the lowest incidence rate for each of the symptoms regardless of community was observed in the warm rainy season and highest in the hot dry season. The transitional probabilities, i.e., the chance of a participant reporting a particular symptom during follow-up given they did not report having the symptom at the beginning, were several folds higher in Freedom compared to the control. For instance, the chance of reporting nose irritation and cough was 10 and 4 times higher respectively in Freedom compared to the Bauleni.
The percentage of the predicted values of the lung function indices of participants is presented in
Table 4. Overall, the mean percentage of the predicted FEV1 and FVC was lower in the exposed compared to the control by 6% and 4% respectively. The indices showed seasonal variations in both communities; lowest in the hot dry season and highest in the cold dry (89.67 vs. 94.0 for FEV1; and 91.13 vs. 94.61 for FVC). Besides, being lower for Freedom, the percentage of the predicted lung function showed also minimal variation compared to the control community. The FEV1 ranged from 89.7–91.6 for Freedom and 96.5–99.4 for Bauleni while FVC ranged from 91.1–94.2 for Freedom and 94.6–100.0 for Bauleni. The spirometric airflow limitation (FEV1/FVC ratio) was lower for the exposed group compared to the control (0.82 vs. 0.84). A FEV1/FVC ratio of less than 80%, which is the accepted cut threshold, was observed in 32.1% of the exposed participants and 11.5% in the control.
Generally, PM
2.5 was a significant predictor for occurrence of the respiratory symptoms expect for wheeze; a 1 µg/m
3 increase in PM
2.5 increased the odds of cough, phlegm and nose irritation by about 2% controlling for season, smoking status and asthma (
Table 5). However, it had an opposite effect on the odds of wheeze (
p value < 0.05). Overall, an increase in PM
10 concentration reduced the odds of all the symptoms, but was only statistically significant for phlegm and nose irritation. Daily assessment of PM
10 showed a statistically significant effect for phlegm and nose irritation 3–5 days after exposure (lag 3 and 5); phlegm lag 5 [OR = 1.00 (0.06–1.00)]; and nose irritation lag 3 [OR = 1.00 (1.00–1.10)] and [OR = 1.00 (0.06–1.01)].
Table 6 shows results from single-pollutant models. Although not statistically significant, a 10 µg/m
3 increase of delayed exposure in PM
2.5 was found to decrease FEV1 by 72.0 mL and 157 mL in the exposed and control respectively. There was an 82 mL decrease in FVC for a 10 µg/m
3 increase in PM
2.5, however this was not statistically significant. A lag effect, although not statistically significant, was seen in the exposure to PM
10; for a 10 µg/m
3 increase in PM
10 FEV1 decreased ranging from 60 mL to 154 mL with the highest decline observed three days after exposure (lag 3). Similarly, FVC showed a decline ranging from 60 mL to 262 mL on day 5 (lag 5), PM
10 marginally statistically reduced FVC by 262 mL in the exposed community.
4. Discussion
In this study, the ambient air of the exposed community had higher concentrations of PM2.5 and PM10. Furthermore, there was significant association between PM and incidence of respiratory symptoms and lung function for residents; and all symptoms studied were several folds higher compared to the control community. FEV1 and FVC were observed to be lower in residents living near the cement factory compared to those in the control community while the spirometric airflow limitation (FEV1/FVC ratio) was also lower for the exposed group compared to the control.
The 24-h averages of PM
10 and PM
2.5 levels were above the minimum recommended by WHO; on 21 days of the 42 days’ follow-up period PM levels were as high as 5 times the recommended levels. Although our study showed high PM levels, ranging from 3.6 to 168 μg/m
3 and 0.4 to 54 μg/m
3 for PM
10 and PM
2.5 respectively, similar studies have demonstrated much higher levels of PM in communities residing near cement factories. For instance, Kabir [
24] reported an average concentration of 500 μg/m
3 and 650 μg/m
3 in two communities; Abdul et al. [
22] found concentration levels ranging from 196.19 μg/m
3 to 423.83 μg/m
3 (particle size 0 to <150 μg) and Marcon et al. [
25] reported average of 1208 μg/m
3 of PM
10 24-h mean concentration over a period of 9 months. Furthermore, PM
10 concentrations showed strong seasonal trends; the hot dry season had the highest (68.2 μg/m
3) compared to cold (35.4 μg/m
3) and rainy seasons (6.05 μg/m
3). These findings are consistent with other studies [
8,
23] and may be attributed to changes in wind velocity, temperature, relative humidity, and precipitation magnitude and frequency [
33]. Another factor could be that on certain days more PM emissions could have been released from the plant. Even slight variations in the emissions control could greatly impact the community-level PM concentrations on some days, as there are no other industrial activities nearby.
Evidence in literature shows that excessive exposure to PM, either acute or chronic effects (in a 24-h period or prolonged period), is associated with increased respiratory symptoms such as cough, phlegm, acute and chronic bronchitis, nasal irritation and reduced lung indices [
14,
15,
34,
35,
36]. In this study, concentrations of PM were higher in the exposed community compared to control in all seasons. In this study, concentrations of PM were higher in the exposed community compared to control in all seasons, and PM
2.5 in the exposed community accounted for a larger proportion of the PM
10 that was measured, compared to control. Toxicological and epidemiological studies [
37,
38] suggest that PM
2.5, since they are smaller and more likely to penetrate deeper into the lungs and blood streams unfiltered, could lead to respiratory and cardiovascular diseases. Our finding is cause for concern as participants from the exposed community are at risk of suffering from not only respiratory ill effects but also potential cardiovascular effects not investigated in this study.
Cough was the most reported respiratory symptom in both communities, although the incidence was higher in the exposed community than the control. Additionally, the chance that individuals without a cough transitioning to reporting a cough over time was three times higher in the exposed community compared to the control. Cough is the most basic response to airway irritation; nearly any type of irritation would induce cough compared to other symptoms. These findings are similar to other reports [
8,
25,
39,
40] and have also been demonstrated by epidemiological research in occupational settings [
13,
14,
41]. Another symptom that was commonly reported in both communities was nasal irritation. In this study, PM
2.5 and PM
10 were significant determinants of both cough and phlegm controlling for area of residence.
There was lower performance on lung indices (FEV1 and FVC), reduced percentage of the predicted values for FEV1 and FVC, among the exposed community compared to the control; at baseline and subsequent seasons. Additionally, the mean lung indices for participants from the exposed community showed wider variations, compared to the control. Although the setting are different from other studies, our results are consistent with findings from studies in occupational settings [
14,
42]. This may be explained due to pre-existing effects of PM on the participants as most of the participants had lived in the area before the commencement of the study. The wider variation on the lung indices could further be explained by the variability of individual response to the atmospheric irritant. The individual response in-turn is dependent on factors such as the extent of lung damage already sustained, physiological adaptation and genetic make-up, and levels of exposure [
43]. The reduction in the lung indices in this population may be suggestive of early obstructive lung disease such as chronic asthma, that participants may be suffering from but may not be aware of; literature shows that such diseases are either poorly diagnosed or under reported in most developing countries [
44,
45,
46].
In this study, we found associations between PM and respiratory symptoms and lung indices. Assessment of PM and respiratory symptoms revealed that PM
2.5 increased the odds of cough, phlegm production and nose irritation by 2.4%, 1.8% and 0.8% respectively. However, PM
2.5 had a protective effect on wheeze. PM
10 increased the odds of reporting phlegm production and nose irritation but the effect was delayed up to 3–5 days. Lung indices were lowered with increasing concentration of PM. Similar findings have been reported from other studies [
26,
47] on the association of ambient air pollution and respiratory ill health and also high levels of particulate matter in residents near industrial plants [
23,
25,
48]. Both respiratory symptoms and reduced lung functions have been consistently associated with exposure to PM; duration and frequency of exposure tend to be determining factors [
36,
39,
40,
49,
50]. Exposure to PM has been repeatedly associated with decreased FEV1 in human studies [
32,
42,
51]. A single or short-time exposure to cement dust may not cause serious harm but exposure to cement dust of sufficient duration may cause serious irreversible health conditions [
36]. Several other studies have reported associations between PM
10 and acute effects such as increased daily mortality and increased rates of hospital admissions for exacerbation of respiratory disease [
52,
53]. Nkhama et al. reported that respiratory illnesses recorded at the only public health facility serving the exposed area was above the national prevalence rates of 136/1000 in 2013 [
28].
The higher sensitivity of respiratory symptoms, compared to lung function, has been found in studies assessing effects of air pollution on respiratory health. Two possible mechanisms have been postulated; a biological effect of chronic exposure to low levels of air pollution without physiological changes or an increased perception of symptoms by people living near exposed areas [
54]. The knowledge of levels of air pollution in Freedom compound are quite high; there has been wide media publication about the possible air pollution from the cement factory. Therefore, there is a possibility that residents from this community could have exaggerated the reported effects. However, it is also possible that PM from cement dust acts more acutely on lung function but the changes may be more transient than the occurrence of symptoms or may be more transient than the occurrence of symptoms present in vulnerable subjects.
In this study, there were no significant differences in major confounding variables such as demographic, length of stay in either exposed or control community, age, type of fuel used for cooking or lighting and gender.
The demographic and social characteristic of the two communities, save for gender, were comparable. The proportion of female participants was much higher in Freedom than Bauleni. At the time of enrolment, a high proportion of potential participants in Bauleni had relocated from the community. Most of the relocated were male therefore skewing the distribution of the sampling frame towards female gender. This may not be unexpected as literature shows that mobile populations tend to be males aged 16–29 [
55]. Gender in this study thus was a potential confounder that needed controlling for in multivariable analyses.
Although this study adds to the evidence of associations of ambient air pollution with lung function in adults at very low levels, our findings should be interpreted with caution. Precise measurements require direct measurements of the pollutant that includes personal air monitoring and biological markers, however, in this study; only fixed community–level monitoring was performed to measure PM. This may not have captured fully the spatial and temporal heterogeneity of an individual’s personal exposure due to a combination of personal behaviors and micro-environmental sources. As a result, individual exposure estimates derived from ambient monitoring data may be subject to measurement error. It is also possible that pollutants, other than PM, could be responsible for the observed adverse health outcomes. Moreover, chemical characterization to ascertain the source apportionment was not conducted, making it impossible to conclude with certainty that the difference observed was due to cement dust. Therefore, future studies should comprise a component of chemical characterization in order to increase the certainty of the real cause. Understanding of the chemical constituents and sources of PM
2.5 are warranted for designing effective emission control policies [
54,
56,
57]. Further, non-participation of some subjects during follow up may bias observed associations or limit generalizability. However, several other elements of the study design strengthen our results. For instance, the daily repeated measures of both exposure and symptom outcomes across multiple seasons and the use of multivariable models allowed for adjustment of within-subject and between subject correlation and also accounted for temporal trends and other potential confounders. Additionally, the policy relevancy of our findings is strengthened by observation that even individuals who are seemingly healthy could be vulnerable to relatively low levels of PM exposure. Further, communities in the windward and downstream may be affected by PM. Future research should include conducting a study that would measure PM in the communities downstream and windward, including assessing chemical characterization in order to quantify sources of PM.


 ,
, 
