1. Introduction
Emerging micropollutants (EMPs) are ubiquitous in aquatic environments and are a matter of growing concern worldwide [
1,
2,
3,
4,
5,
6,
7,
8,
9,
10]. The EMPs comprise of a wide range of natural and synthetic organic compounds, which include pharmaceuticals and personal care products (PPCPs), detergents, steroid hormones, industrial chemicals, pesticides, and many other contaminants of emerging concern [
2,
3,
5,
7,
9]. Compared to other contaminants of anthropogenic origin, the EMPs have largely been outside the scope of monitoring and regulation worldwide, and there is paucity of data on their levels, occurrence, and fate in water [
1,
2,
4,
6,
8,
9,
10,
11,
12,
13,
14,
15,
16,
17,
18,
19,
20]. Nevertheless, the ubiquity occurrence of EMPs has been increasingly identified in both surface and ground water sources as a result of influx of effluents from wastewater treatment plants (WWTPs), on-site wastewater disposal systems, runoff from roadways wash off, agriculture fields, recreational activities, atmospheric deposition, animal feeding operations, leaking sewer lines, and landfill and septic tank leachate [
8,
10,
21,
22,
23,
24,
25,
26,
27,
28,
29].
The majority of the existing WWTPs are not particularly constructed with the intention to remove EMPs from wastewater streams [
10,
30,
31,
32]. Consequently, the EMPs pass through WWTPs owing to their hydrophilicity, partial degradation, persistency, and the continuous introduction into the drinking water value chains of the hydrological cycle coupled with lack of well-established precautionary measures and monitoring actions [
10,
30,
31,
32]. Once the EMPs find their way into ground and surface water environments, they may re-enter the biosphere where they pose a threat to plant and animal life in addition to posing challenges to the potable water treatment facilities [
10,
33]. Despite their occurrence at low concentrations (i.e., from pg/L to μg/L) in water environments, the EMPs are associated with several ecotoxicological effects, such as chemo-sensitization, endocrine disruption, disruption of the production of platelets, red and white blood cells, short and long term toxicity, antibiotic resistance of microorganisms, and insomnia among others [
1,
3,
4,
6,
8,
9,
10,
11,
12,
13,
14,
15,
16,
17,
18,
19]. Severe ecotoxicological effects of EMPs have been reported to be as a result of the interactions of EMPs with human and/or aquatic life usually after long-term exposure to the EMPs [
13,
15,
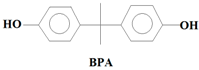
34]. Among these EMPs, Bisphenol A (BPA) (C
15H
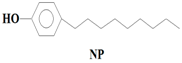
16O), 4-Nonylphenol (NP) (C
15H
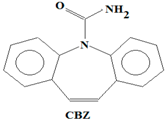
24O), carbamazepine (CBZ) (C
15H
12N
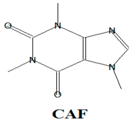
2O), caffeine (CAF) (C
8H
10N
4O
2), galaxolide (HHCB) (C
18H
26O), and tonalide (AHTN) (C
18H
26O), present significant research interests due to their extensive use in several products, their ecotoxicological effects, as well as their physicochemical properties which allow their persistent presence in water [
7,
8,
11,
13,
15,
16] (
Table 1). While BPA and NP are endocrine disrupting compounds, HHCB and AHTN are chemo-sensitizers (they have the potential to interfere with transportation of proteins (P-glycoprotein) and inhibition of cellular defence mechanisms), CBZ has the potential to disrupt the production of red blood cells, white blood cells, and platelets, and CAF has the potential to disrupt sleep (insomnia) (
Table 1).
According to Musolff et al. [
8], an understanding of spatial and temporal variations in concentration heterogeneities of EMPs is one of the most important aspects in the study of EMPs. Nevertheless, the levels and occurrence of EMPs in the environment are largely ill understood in many parts of the world [
20]. Generally, surface waters and wastewaters have been assumed to contain diverse and higher levels of EMPs compared to groundwater [
20]. Lapwrorth et al. [
20] noted that this assumption and the resulting paucity of data on occurrence of EMPs in water might simply be a function of limitations in capacity of several analytical methods and equipment, as well as the limited number of research studies rather than actual levels and occurrence of EMPs in water. With the advent of novel and highly sensitive analytical equipment capable of detecting chemical constituents at very low levels in complex sample matrices, the detection of EMPs is now possible, and has thus attracted the attention of researchers worldwide [
1,
3,
4,
6,
8,
9,
10]. Traditionally, mass spectrometry (MS) or selective detectors coupled with gas or liquid chromatography had to be used for the identification of EMPs. However, one of the problems associated with these analytical techniques in the identification of these organic compounds, including EMPs, has been the co-elution of several compounds and their inability to quantify the compounds below traditionally reported limits of detection [
35]. Another limitation of these traditional techniques is the additional time required and material needed for analysis when repeating the analysis on another column with different polarity [
35].
The LECO Pegasus
® 4D comprehensive two-dimensional gas chromatography coupled to high resolution time-of-flight mass spectrometry (GC × GC-HRTOFMS) is a recently developed robust state-of-the-art analytical technique that offers a solution to the co-elution problem with minimal time and material requirements for analysis [
36]. The GC × GC-HRTOFMS (two-dimensional gas chromatography coupled to high resolution time-of-flight mass spectrometry) has proven to be one of the most powerful analytical techniques for the analysis of environmental samples and plays a significant role in the determination of organic compounds, including EMPs, in environmental samples [
36,
37,
38,
39]. According to LECO Corporation (St. Joseph, MI, USA) [
36], the GC × GC-HRTOFMS system utilises four dimensions of separation and resolution, namely: (1) chromatographic resolution in first dimension; (2) chromatographic resolution in second dimension; (3) exceptional mass accuracy of 1 ppm as well as amplified mass resolution; and (4) high resolution deconvolution
® (HRD
®) available in the ChromaTOF-HRT
® software package (LECO Corporation, St. Joseph, MI, USA) which is used to operate the GC × GC-HRTOFMS system. The ChromaTOF-HRT
® software package coupled with increased peak capacity of the GC × GC at least two times greater than any other product on the market allows environmental samples to be handled in such a way that compound identification and quantification are not compromised. In addition, the GC × GC-HRTOFMS produces data with much improved separation capacity, signal-to-noise (S/N) ratio, chemical selectivity, and sensitivity [
36,
37,
39,
40,
41,
42].
In principle, the method consists of two GC systems equipped with columns of different polarity connected by an interface with an integrated cryogenic trap [
35,
36]. The cryogenic trap repeatedly condenses compounds eluting from the primary column and releases them periodically as short pulses to the secondary column [
35]. Parameters like duration and frequency of both condensation and injection pulses are variable and allow precise tuning of the instrument according to the requirements of the analysis. Since GC × GC produces very narrow peaks (down to 50 ms, depending on the frequency of cryogenic modulation) a HRTOFMS detector capable of mass resolutions of up to 50,000 with a high acquisition rate (up to 200 spectra/s) is utilised [
36]. The HRTOFMS system utilises a chemical ionisation source (HR-CI) which further enhances the system accuracy as well as high resolution on pseudo-molecular ions, which substantiates the conventional electron ionisation source (HR-EI) which provides the comprehensive characterisation of unknown compounds [
36].
Despite the enhanced detectability and reliability of the GC × GC-HRTOFMS in the identification and quantification of EMPs in complex environmental samples owing to the two retention times and well-ordered bands of compound groups in the GC × GC system [
36,
43], there has been very little, if any, focus on the monitoring and determination of EMPs in groundwater and surface water sources used by thousands of people for their domestic needs in Gauteng, Mpumalanga, and North West provinces. However, these water sources are also at risk of contamination by a variety of contaminants including EMPs. As of yet, no lasting solutions have been proposed to address the problems associated with EMP contamination in many parts of the world, including Gauteng, Mpumalanga, and North West provinces in South Africa.
Due to the aforementioned widespread use, occurrence, distribution, fate, and effects of EMPs, sensitive and selective multi-residue analytical methods and techniques are required that will allow detection in environmental samples. The objectives of this study were therefore to: (1) determine the levels and occurrence of the analytes (i.e., BPA, CAF, CBZ, HHCB, NP, and AHTN) in the solid phase extraction (SPE) extracts using comprehensive GC × GC-HRTOFMS in water samples from Gauteng, Mpumalanga, and North West provinces, South Africa; (2) determine the limit of detection (LOD) and limit of quantification (LOQ) for BPA, NP, CAF, HHCB, AHTN, and CBZ by using comprehensive GC × GC-HRTOFMS; and (3) determine the temporal and spatial variations in the occurrence of the analytes during the study period.
2. Materials and Methods
2.1. Materials and Preparation of Reagents
The chemicals, BPA standard, NP standard, CAF standard, HHCB standard, AHTN standard, CBZ standard, methanol LC-MS CHROMASOLV®, and dichloromethane LC-MS CHROMASOLV®, hydrochloric acid (HCl), sodium hydroxide (NaOH), and standard pH buffers (for pH 4 and 7) were obtained from Sigma-Aldrich, Johannesburg, South Africa. All chemicals were used without further purification.
2.2. Study Area and Water Sample Collection
2.2.1. Study Area
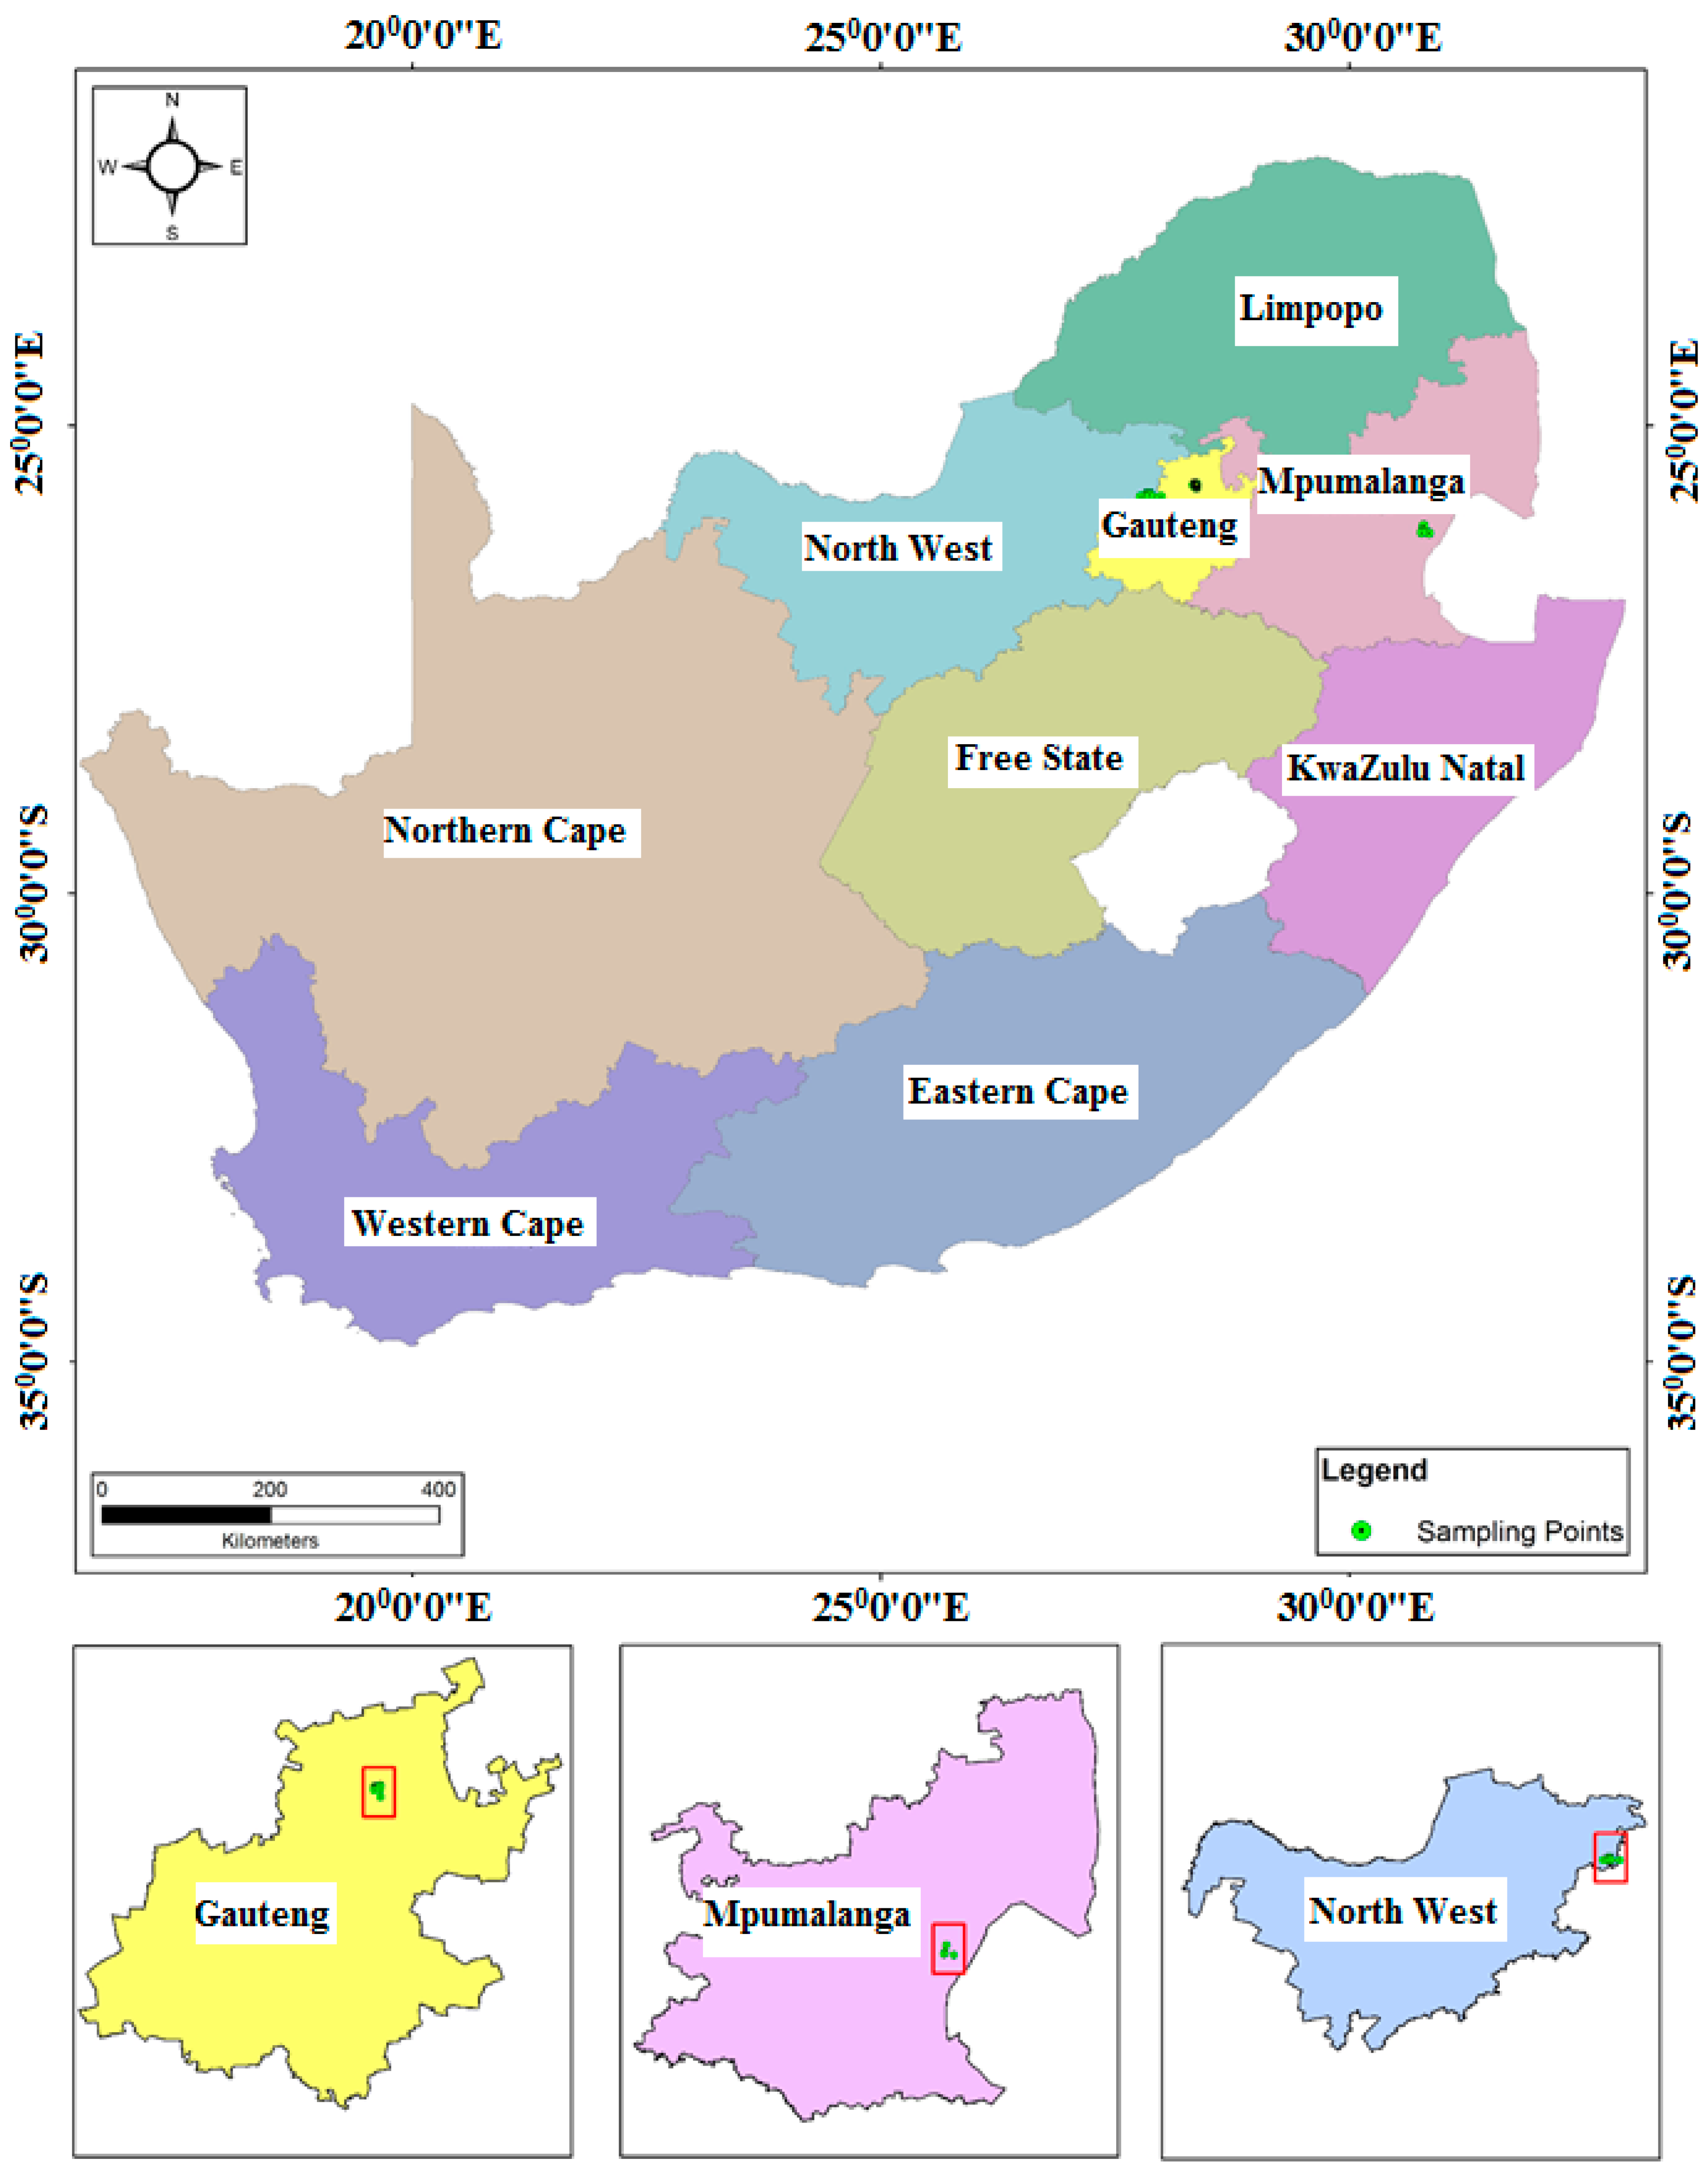
The areas selected for study were Mpumalanga, Gauteng, and North West provinces in South Africa (
Figure 1). Gauteng is the smallest province in South Africa, which covers an area of 18,178 square kilometres. Gauteng province is bordered by the North West, Limpopo, Free State, and Mpumalanga provinces. It is the most populated province with a total population of 12,272,263 [
44]. Mpumalanga province is located to the eastern part of South Africa and is surrounded by Swaziland and Mozambique on the eastern side, and Gauteng province on the western side (
Figure 1). Mpumalanga province covers an area of 79,487 square kilometres [
44]. Mpumalanga province has a total population of 4,039,939 [
44]. The North West province is located at the central part of South Africa and bordered by the Northern Cape on the southwestern side, the Free State to the southern part, Gauteng to the eastern side, and Limpopo to the northeastern side, with Botswana on its northern border (
Figure 1). North West province has a total surface area of 116,231 square kilometres [
44]. North West has a total population of 3,509,953 [
44]. The increase in population in all the three provinces has resulted in increased water consumption, which aggravates pressure on South Africa’s existing water resources. In addition, Mpumalanga and North West provinces are faced with acute water resource constraints because they are largely arid provinces. Furthermore, based on both the Blue Drop Report of 2012 and the Green Drop Report of 2012, the majority of water supply sources in North West and Mpumalanga provinces were not fit for human consumption [
45,
46].
2.2.2. Water Sample Collection and Onsite Water Sample Analyses
In this study, water samples were collected once every two months between June 2014 and April 2016. A total of 44 quasi-randomly selected locations within drinking water and wastewater sources in Mpumalanga, Gauteng, and North West provinces were utilized. Sampling sites were selected taking into account the variations in physiography and anthropogenic activities around the selected sites in each of the three provinces. In Mpumalanga province, groundwater and surface water samples were collected from school boreholes, shallow wells, the Eerstehoek water treatment plant (WTP), effluent from the Eerstehoek wastewater treatment plant (WWTP), and rivers located in the low-income areas situated in the Chief Albert Luthuli municipality in Mpumalanga, close to the Oshoek border between Swaziland and South Africa (
Figure 1). In Gauteng and North West provinces, water samples were collected from rivers, Roodeplat and Hartbeespoort dams, and the Schoemansville water treatment plant. For analysis of EMPs (BPA, NP, CAF, HHCB, AHTN, and CBZ) the sample bottles were rinsed twice with water from a particular sampling site before obtaining the final sample. Grab water samples were collected using 1 L glass bottles in triplicate using standard sampling procedures. The water samples were analyzed for levels of pH, electrical, conductivity (EC), and total dissolved solids (TDS) in the field immediately after sampling, using a Hanna Instrument (Woonsocket, RI, USA) model HI-9828 multi-meter. Deionized water was used to rinse the electrode of the meter prior to determination of the levels of TDS, EC, temperature, and pH of any successive sample to avoid inter-sample contamination.
2.3. Preparation of Standard Solutions, Sample Preparation, and Solid Phase Extraction of Emerging Micropollutants
2.3.1. Preparation of Standard Solutions
The 1000 mg/L stock solutions for BPA, NP, HHCB, AHTN, and CBZ were prepared by weighing 1 mg of each into a vial (1.5 mL) and dissolving the sample in methanol (LC-MS CHROMASOLV® grade) (1 mL) under vortex and ultrasonication for 10 min. In addition, 1000 mg/L stock solutions for CAF were prepared by weighing 1 mg of CAF into 1.5 mL vial followed by dissolving the sample in dichloromethane (LC-MS CHROMASOLV® grade) (1 mL) under vortex and ultrasonication for 10 min. The stock solutions were stored in a refrigerator at a temperature of below 4 °C. From each of the stock solutions, 100 µL was pipetted and placed into one 1.5 mL vial and made up to the 1.0 mL mark with methanol (LC-MS CHROMASOLV® grade) to prepare a 100 mg/L mixed standard solution from which all working standards of different concentrations (10, 20, 30, 40, and 50 parts per million (ppm)) were prepared for the preparation of the calibration curve.
2.3.2. Sample Preparation and Solid Phase Extraction of Emerging Micropollutants
The water samples were kept in cooler boxes under ice and transported to the laboratory where they were filtered using a 1.2 μm GF/C Whatman filter paper to remove suspended matter prior to autotrace solid phase extraction (SPE) treatment and stored in a refrigerator below 4 °C until analysis. Solid phase extraction was used to extract, clean, and enrich/pre-concentrate the analytes in water samples using Dionex autotrace 280 by Thermo Scientific. The autotrace-SPE system was optimized with regard to initial analyte dose, sample pH, and sample volume. The EmporeTM Styrene Divinyl Benzene (SDB-RPS) autotrace-SPE disks were conditioned with methanol and deionised water. One hundred millilitres of water samples containing the target analytes were loaded onto the autotrace SPE and eluted through the SPE disks followed by washing with 5 mL of deionised water. The SPE disks were then subjected to vacuum drying in order to remove excess water before eluting the compounds with methanol (5 mL). The extracted solution was evaporated to dryness using nitrogen gas before reconstituting with methanol (1 mL) for GC × GC-HRTOFMS analysis [
47].
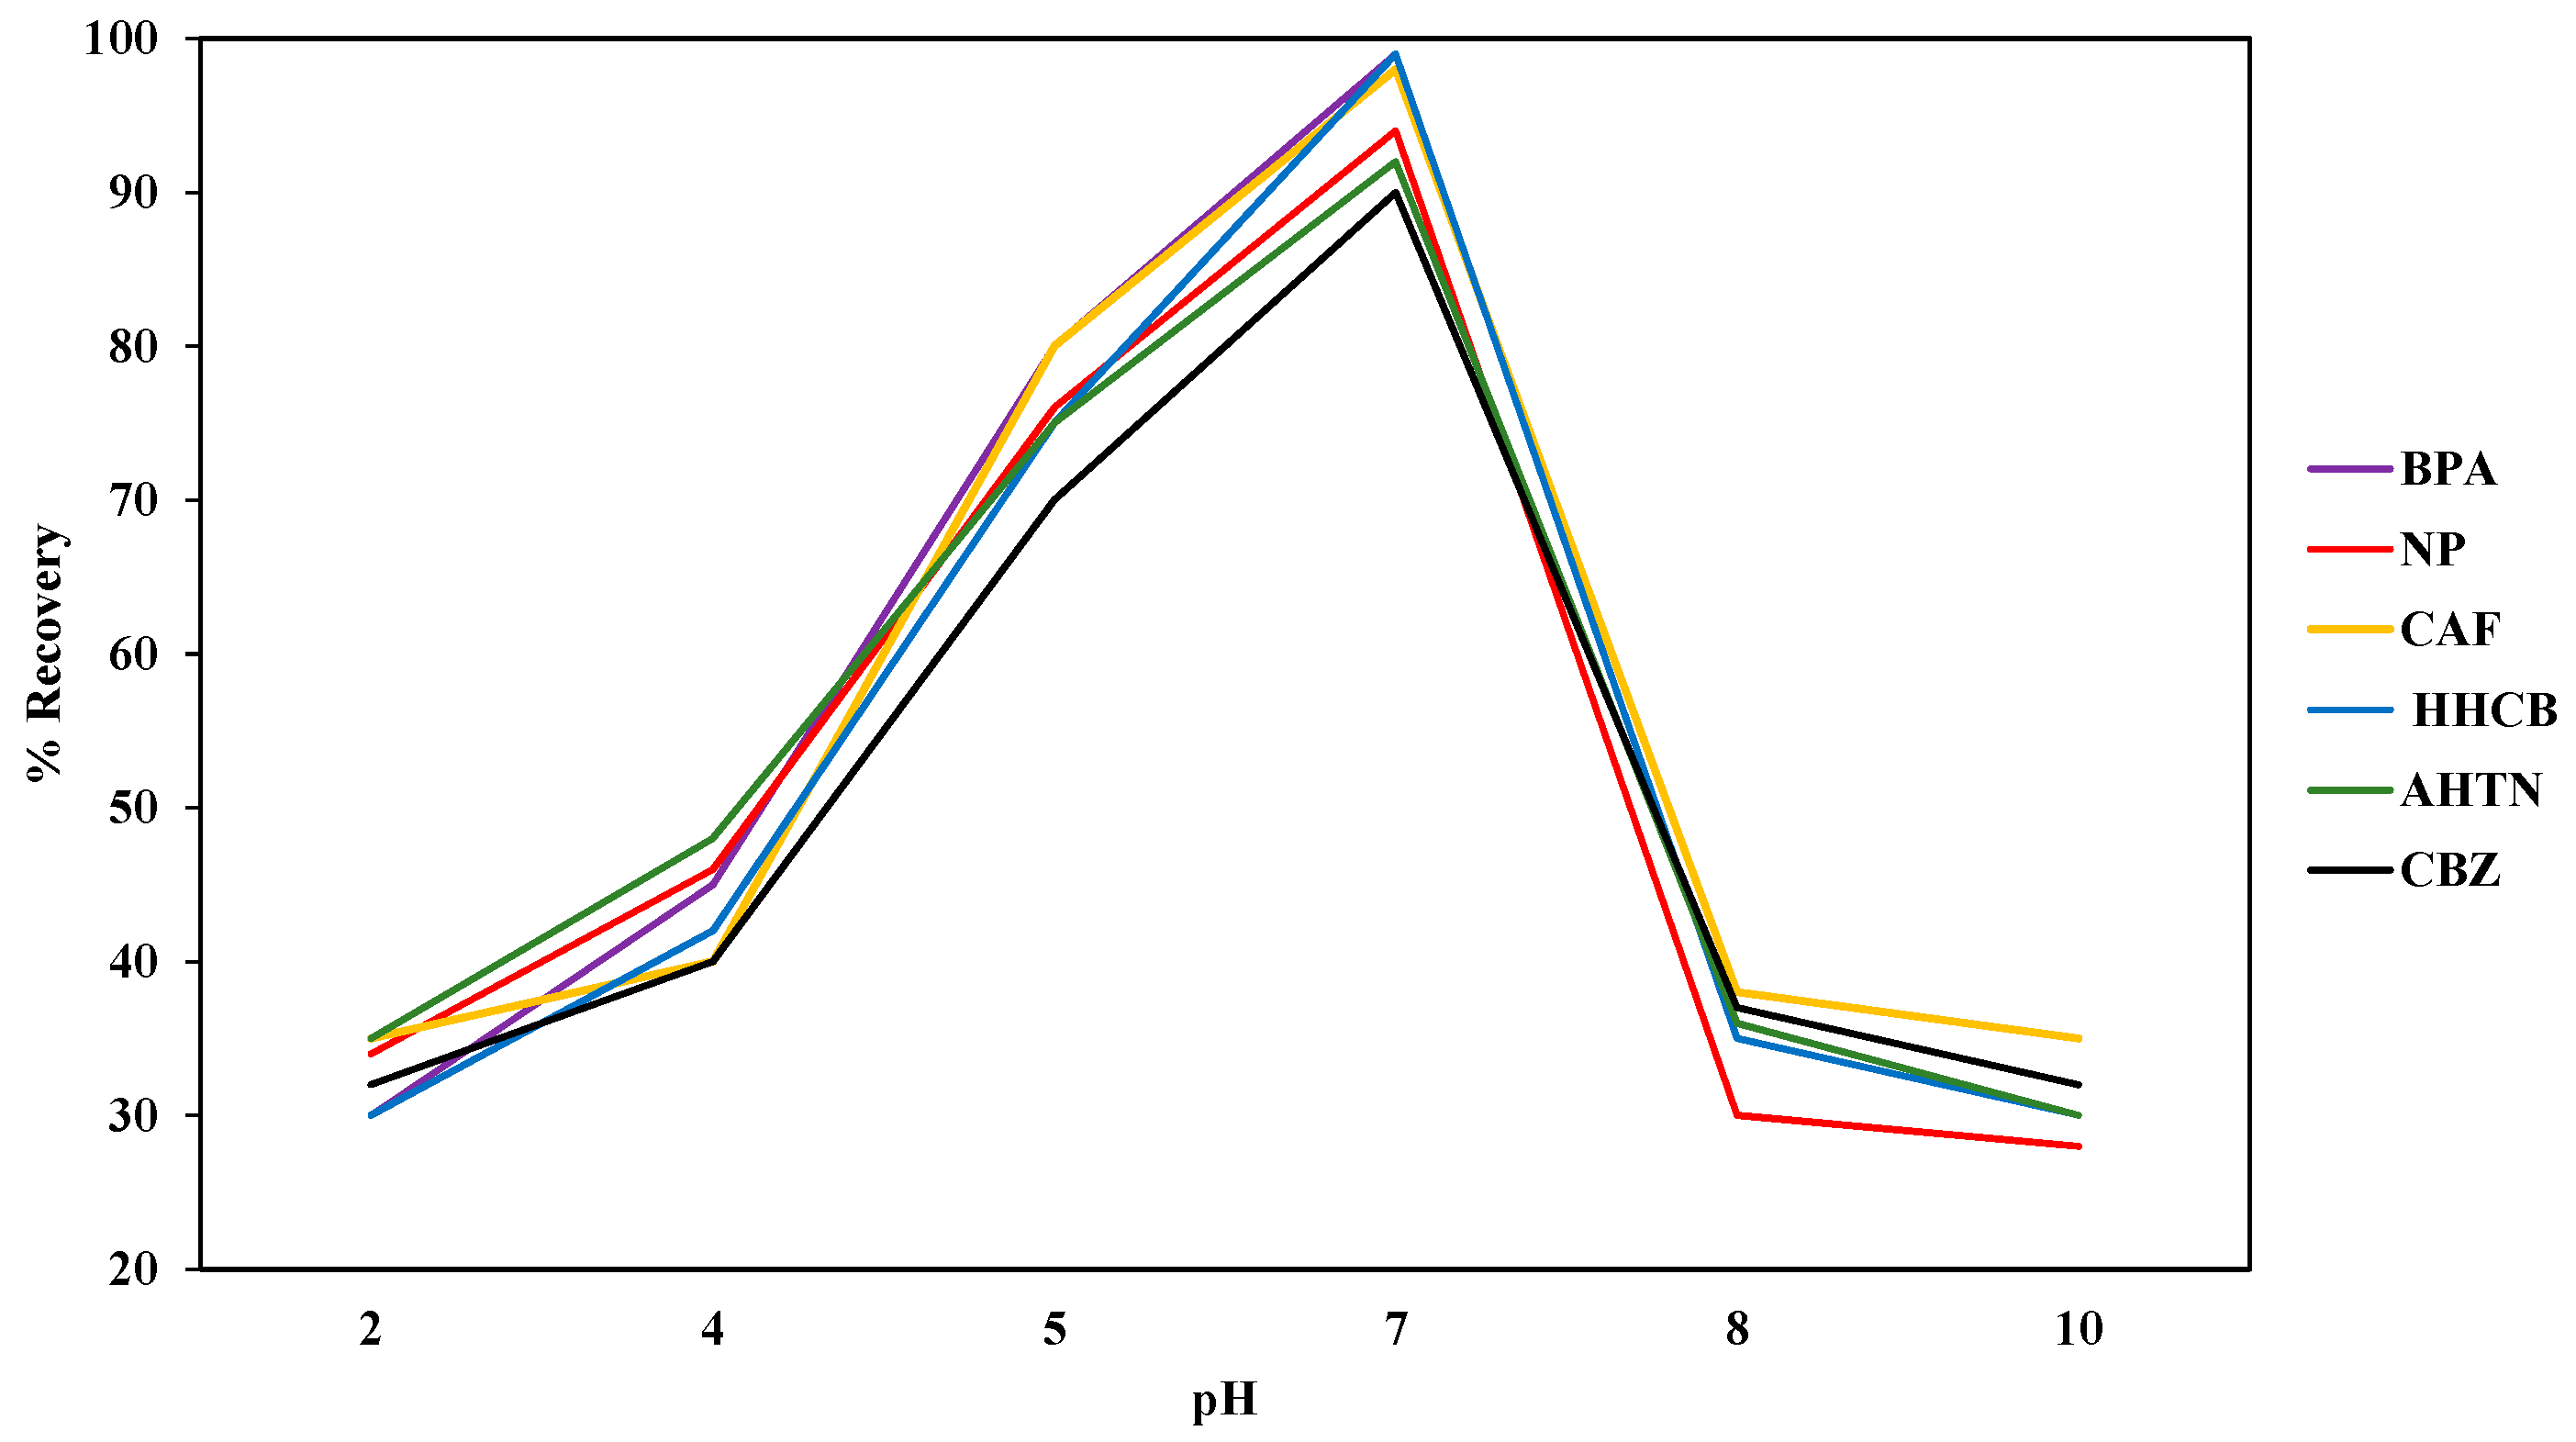
The SPE system was optimized with regard to initial analyte dose, sample pH, and sample volume. The initial analyte dose of 5 µg/L, 10 µg/L, and 15 µg/L for each analyte into actual water samples as well as ultra-pure water samples was investigated via the standard addition method while keeping sample pH, sample volume, volume of methanol, and flow rate constant. The sample pH of the actual water samples and ultra-pure water was measured using Hanna model HI-9812 multi-meter (Hanna Instruments Limited, Bedfordshire, UK). The electrode of the meter was rinsed with deionised water before determining pH of any subsequent sample to prevent inter-sample contamination. Sample pH was optimized by varying the pH of actual water samples and ultra-pure water spiked with 1000 μg/L of each analyte. The pH was adjusted to 2, 4, 5, 7, 8, and 10 with HCl (1 mol/L) and NaOH (0.6 mol/L) [
48].
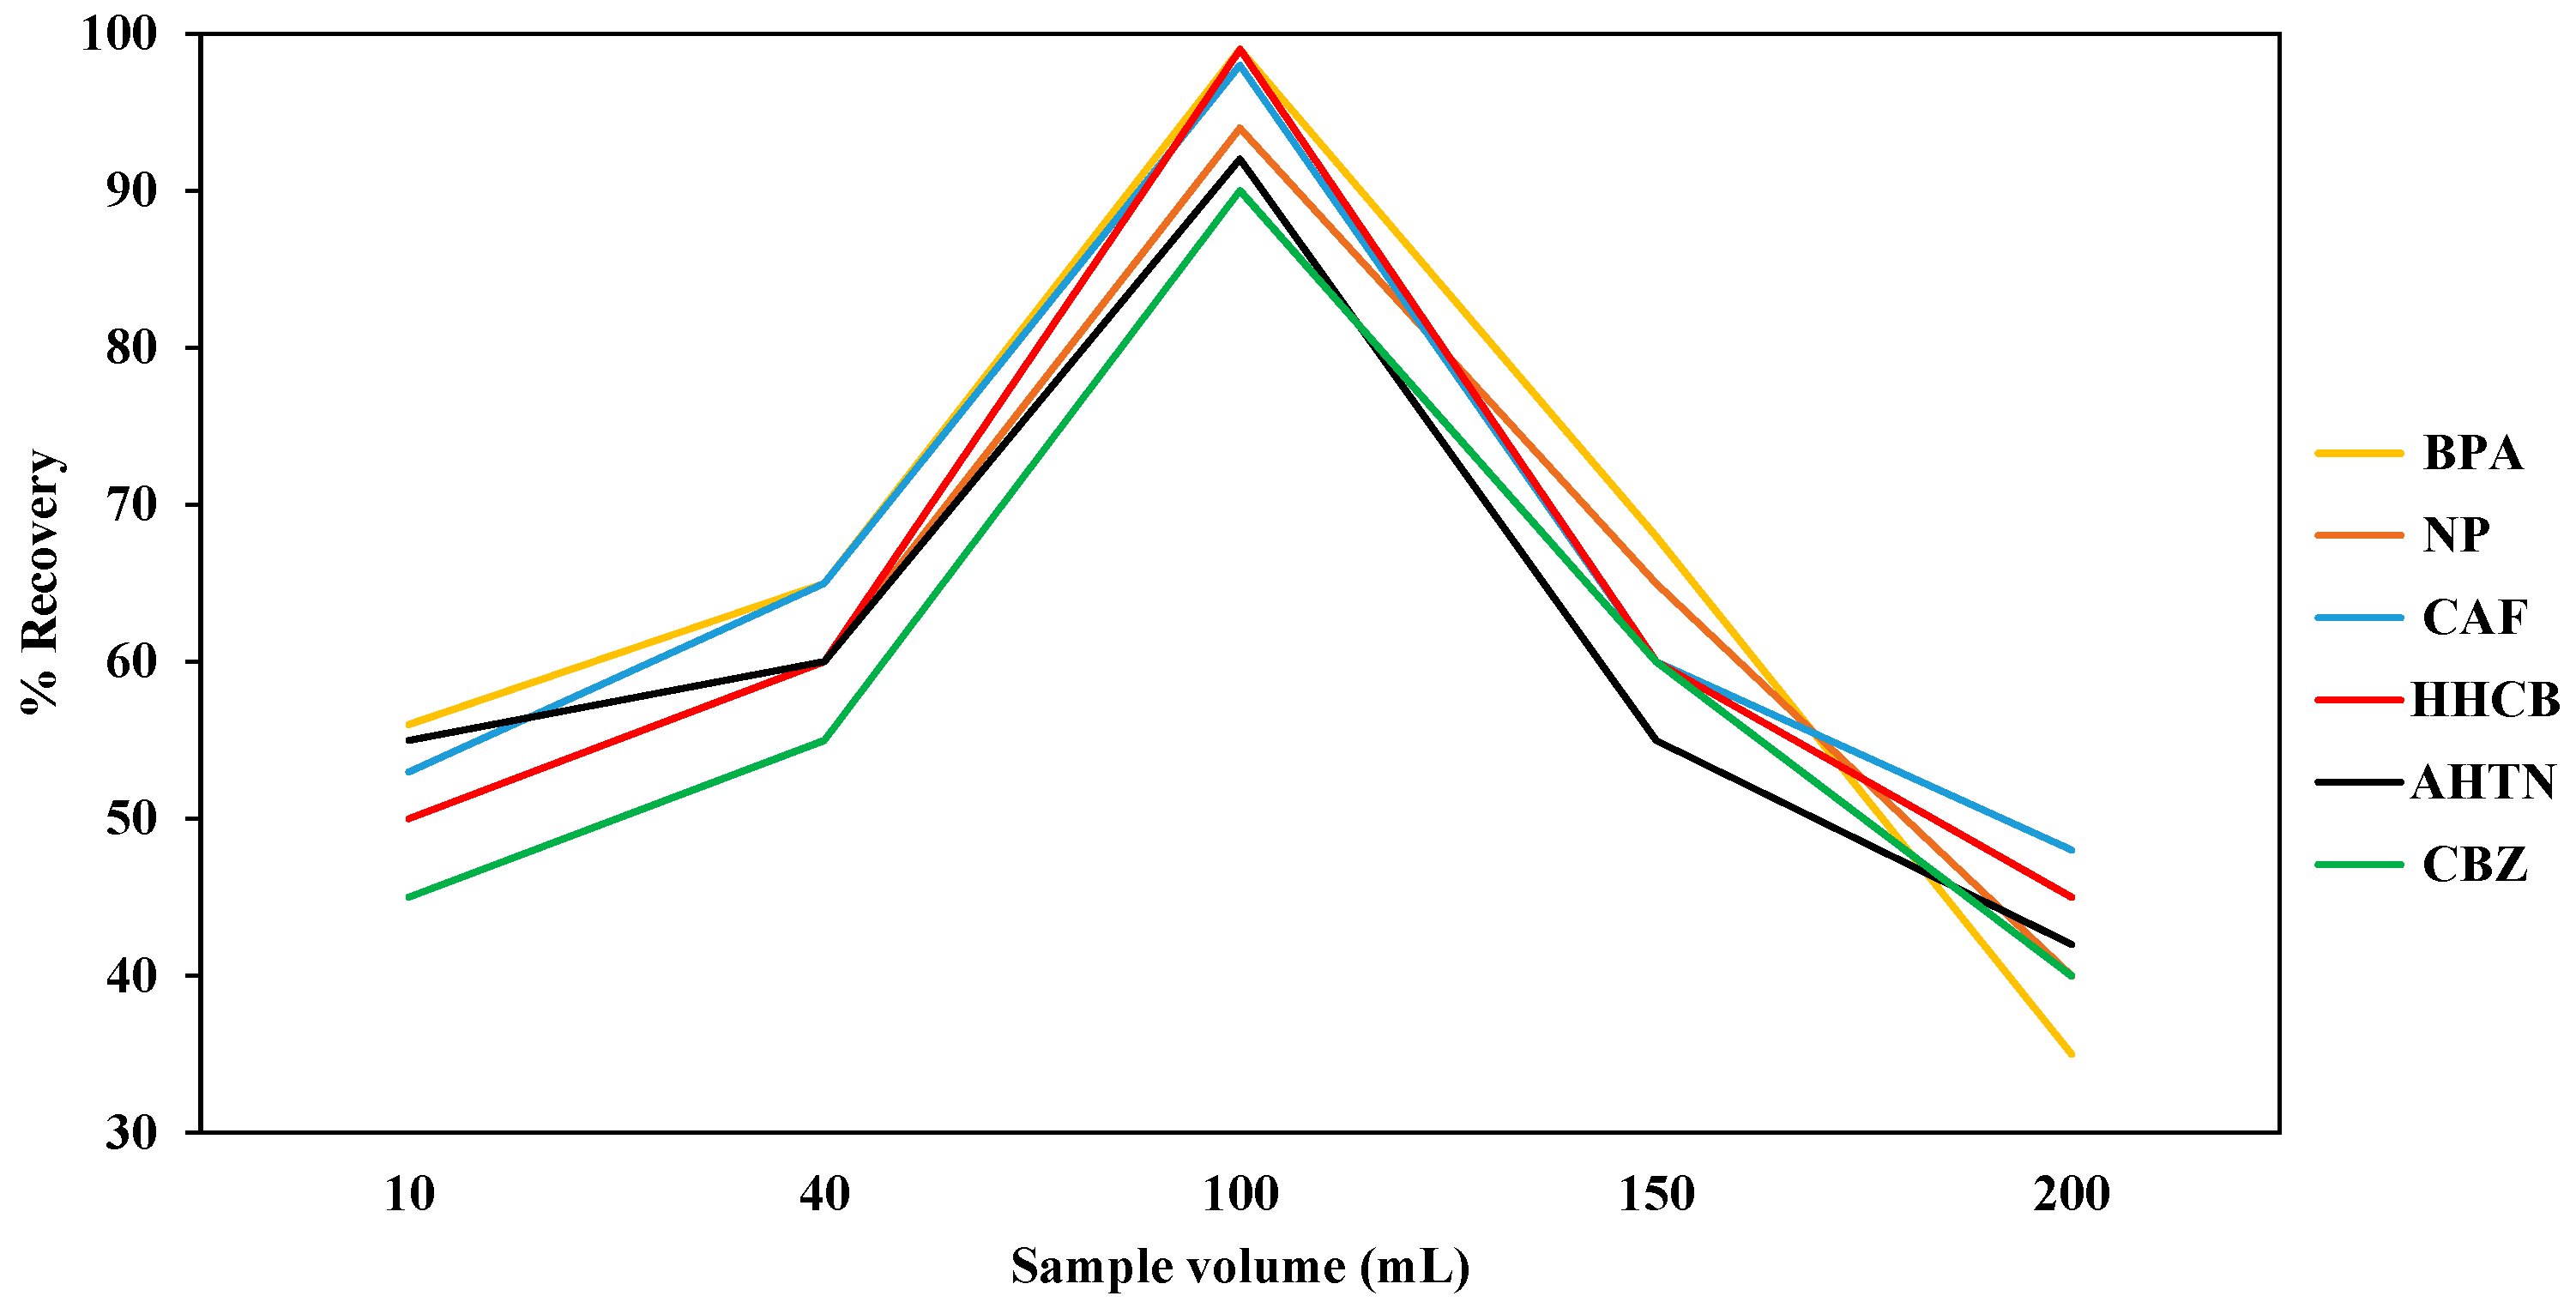
The effect of sample volume was investigated by passing different volumes of actual water samples as well as ultra-pure water spiked with 1000 μg/L of each compound through the SDB-RPS autotrace-SPE disks while keeping the volume of methanol LC-MS CHROMASOLV
® grade (5 mL), the volume of ultra-pure water (5 mL), and the flow rate (1 mL/min) constant [
48]. The volumes of spiked ultra-pure water were in the range of 10 mL to 200 mL. The compounds retained by the SDB-RPS autotrace-SPE disks were eluted with methanol (5 mL) before evaporating to dryness using nitrogen gas before reconstituting with methanol (1 mL). For quality assurance, the percentage recoveries of the SPE extracted samples were calculated by comparing the recovered levels with the standard dose levels expressed as a percentage.
2.4. Determination of Levels and Occurrence of BPA, CAF, CBZ, HHCB, NP, and AHTN in Water Samples
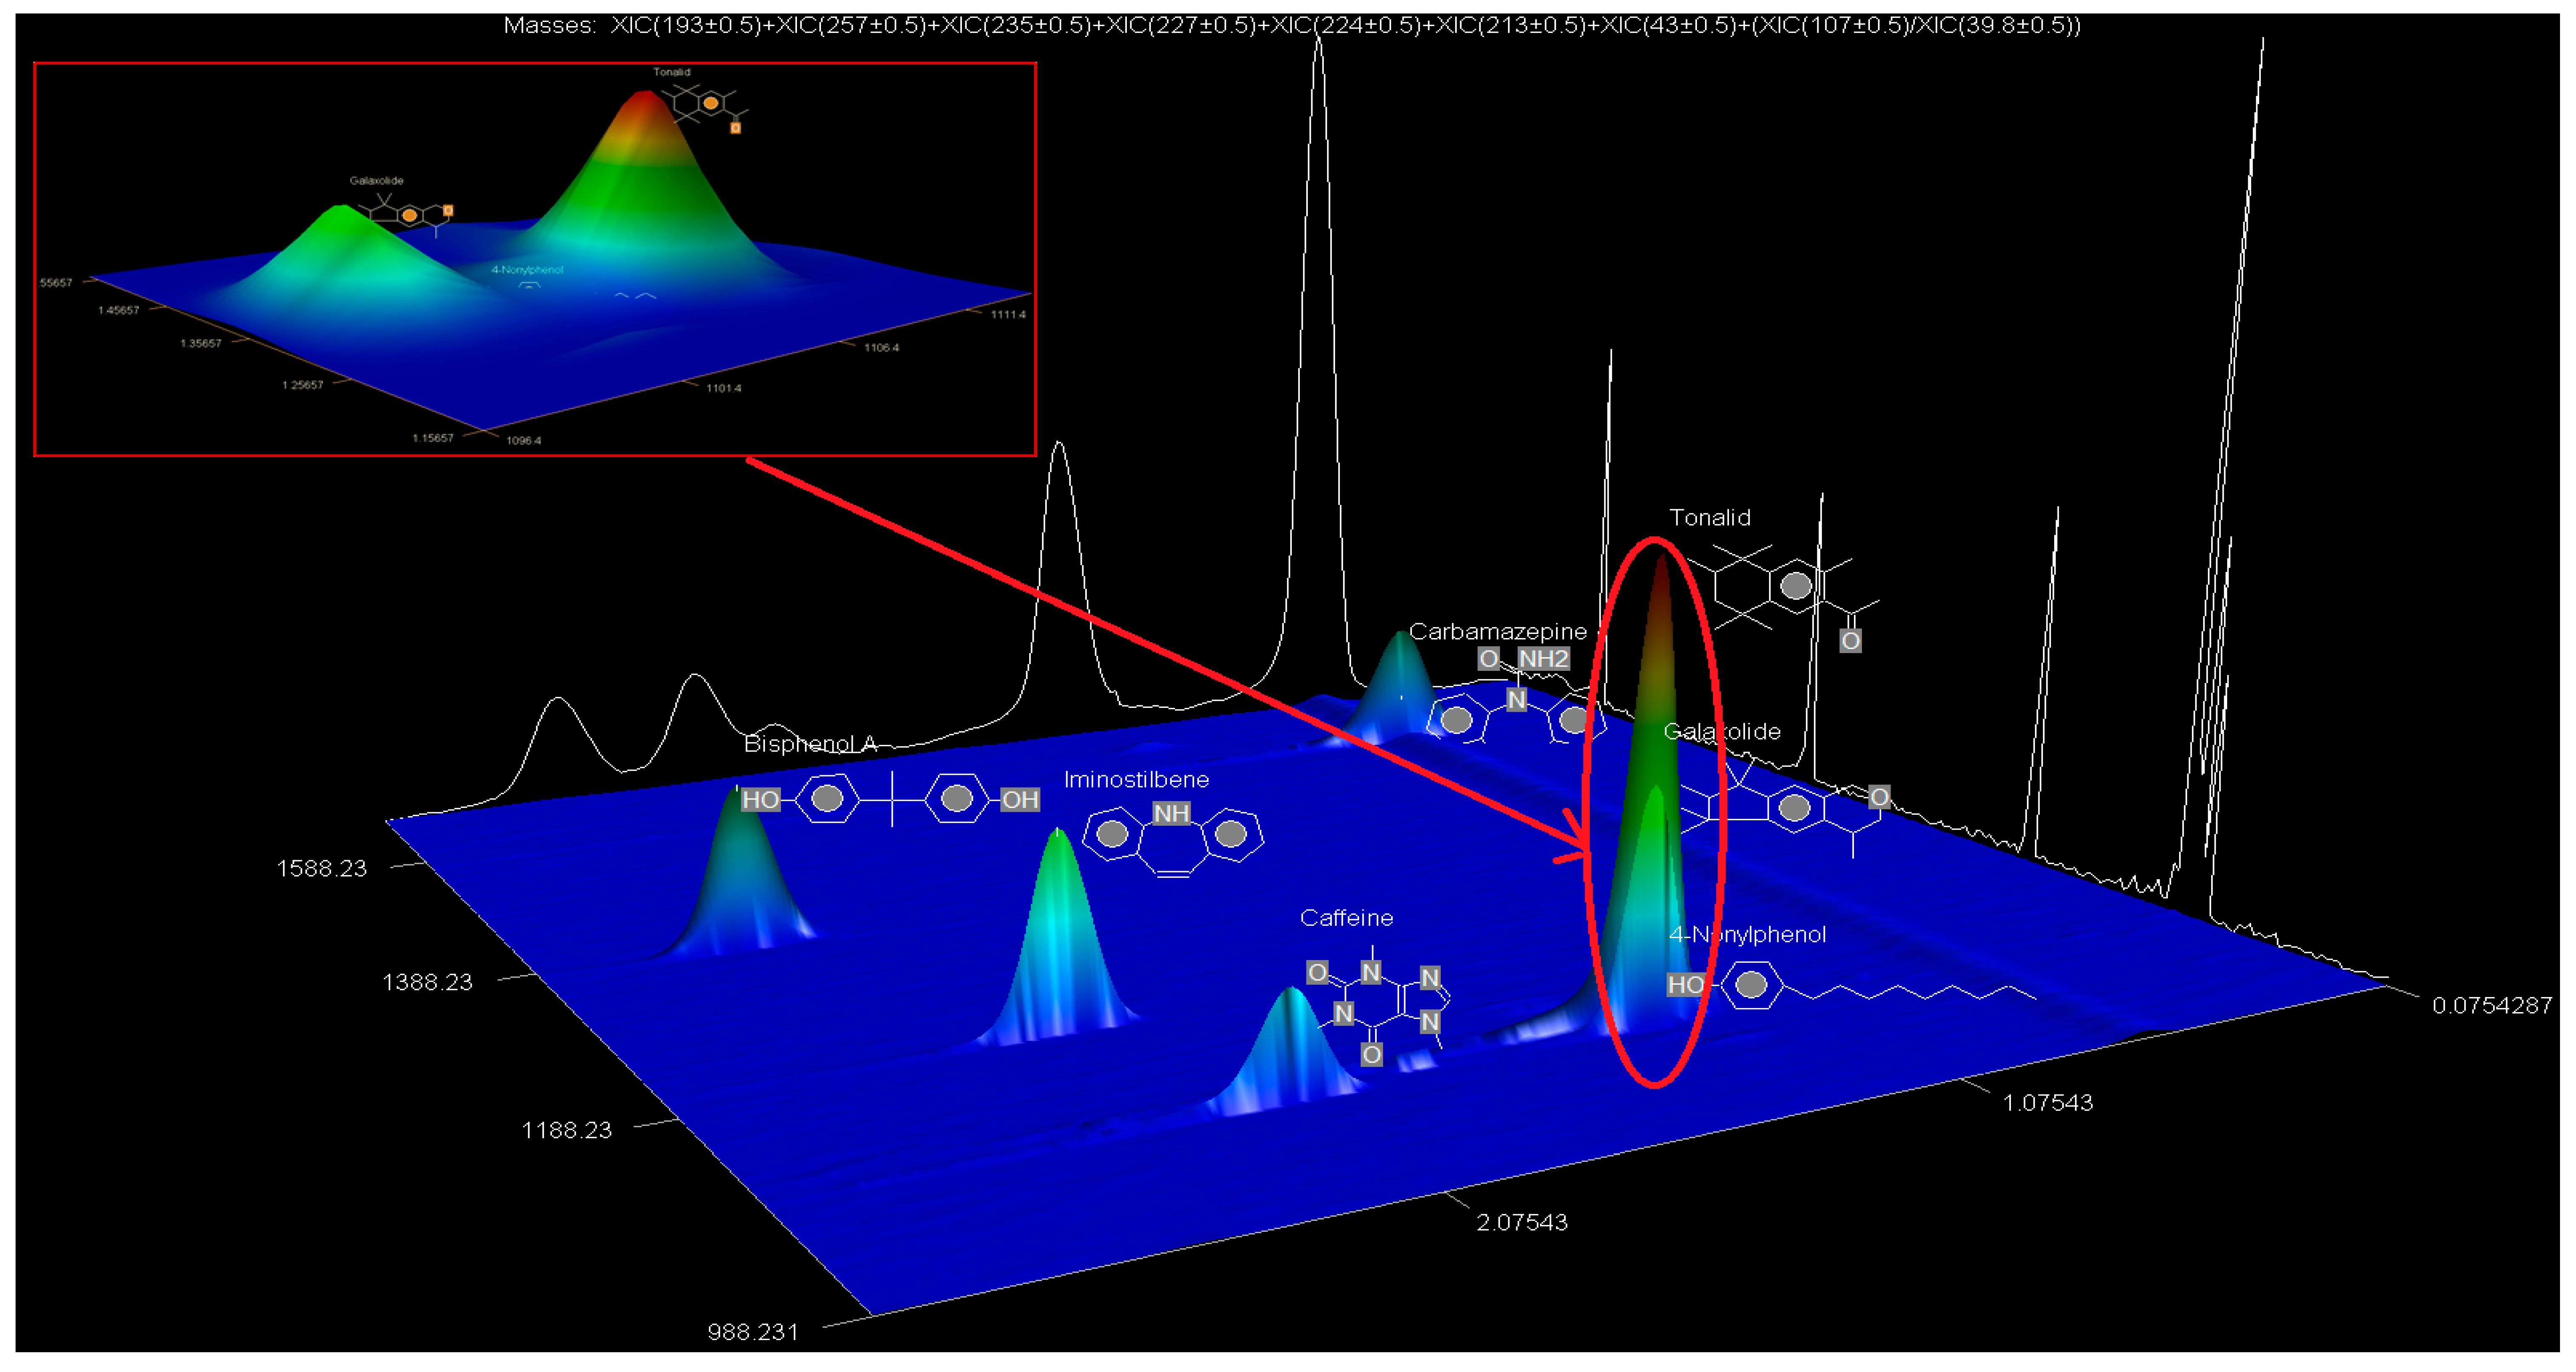
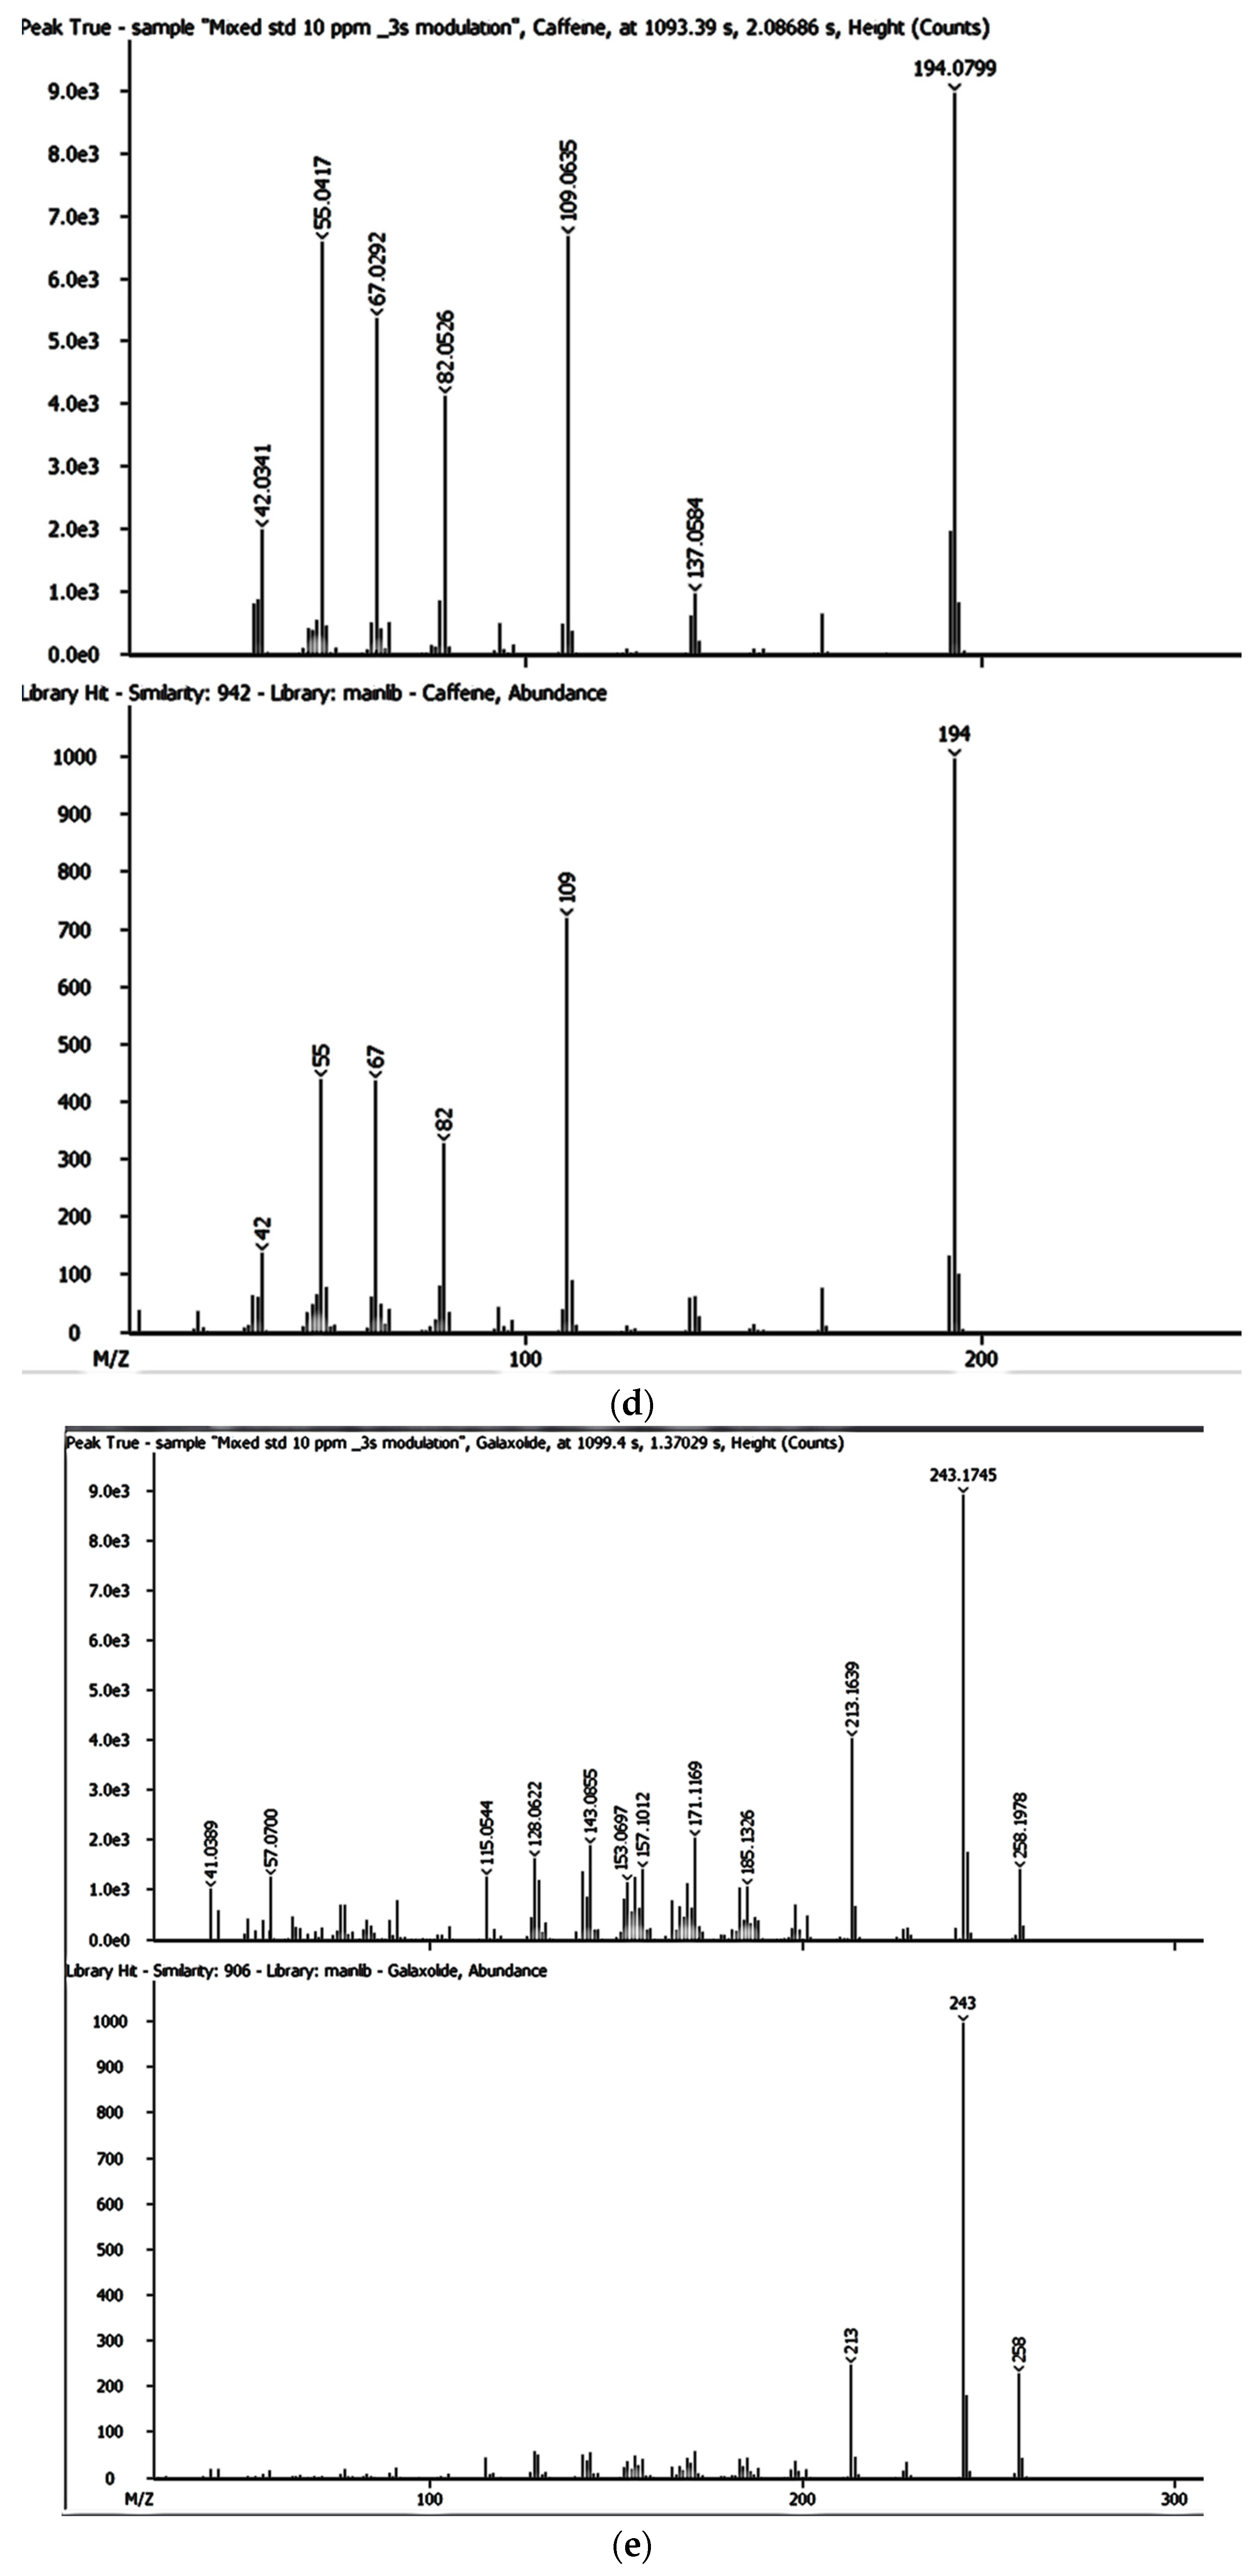
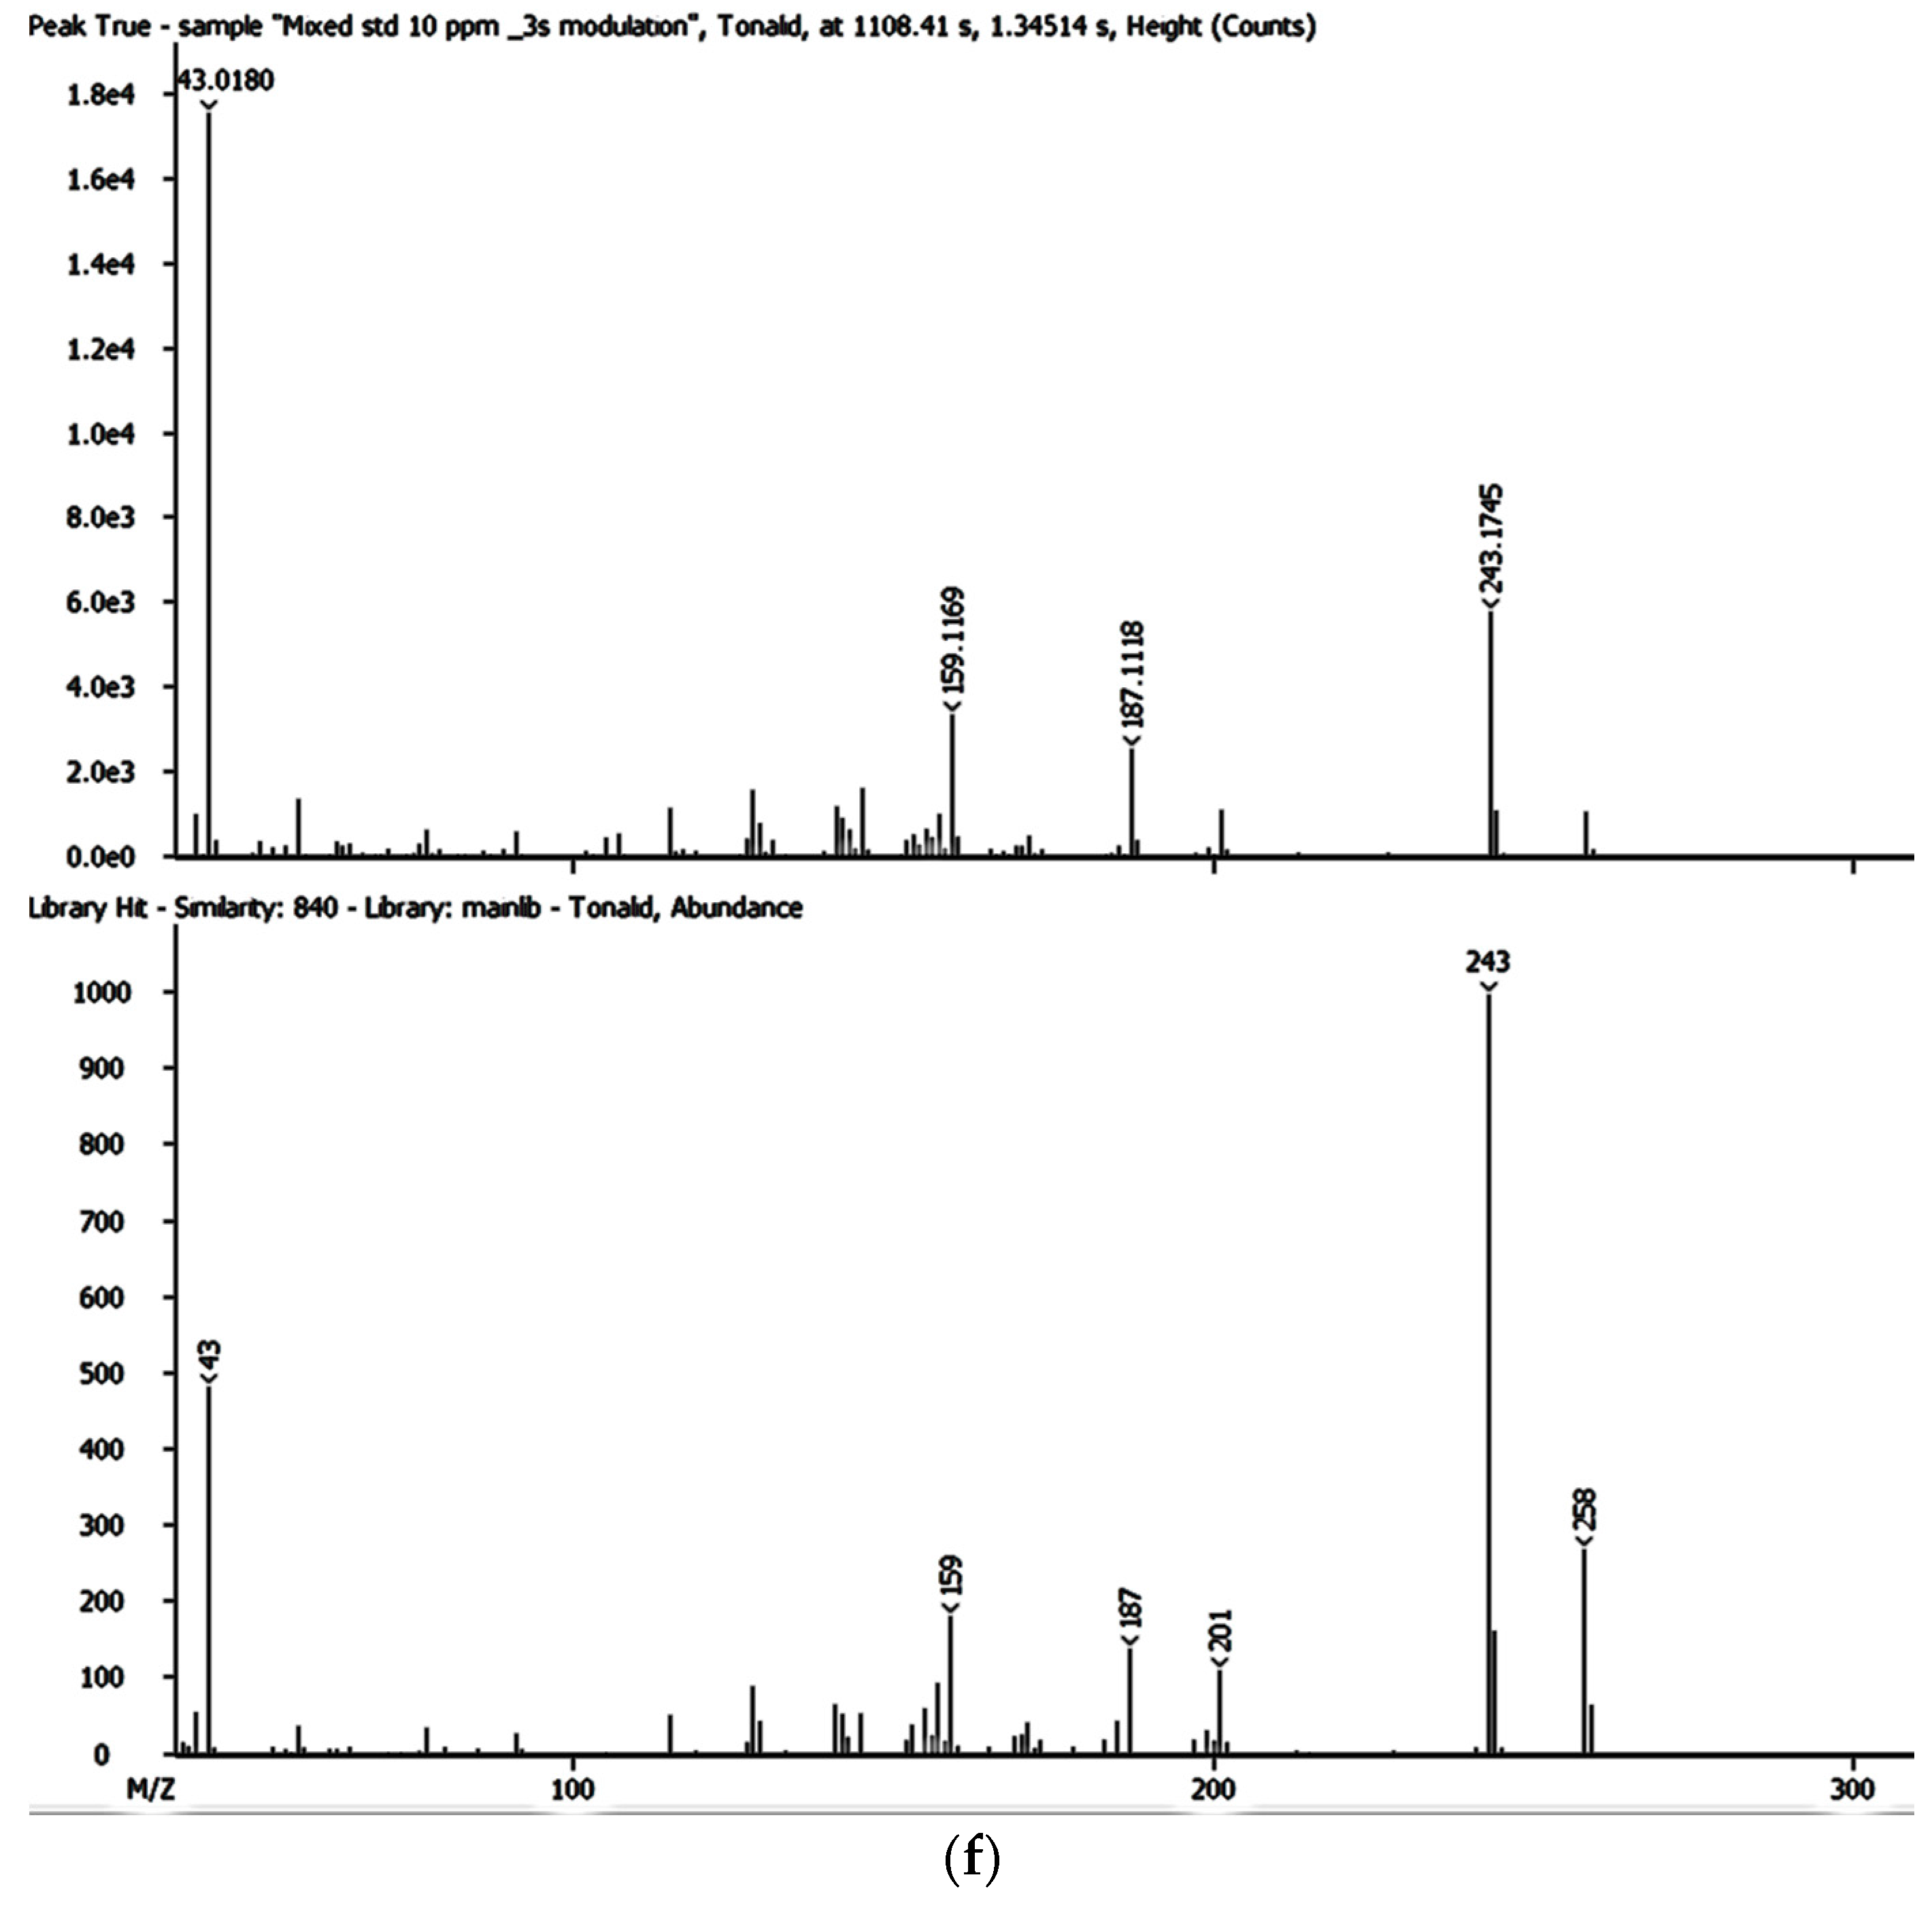
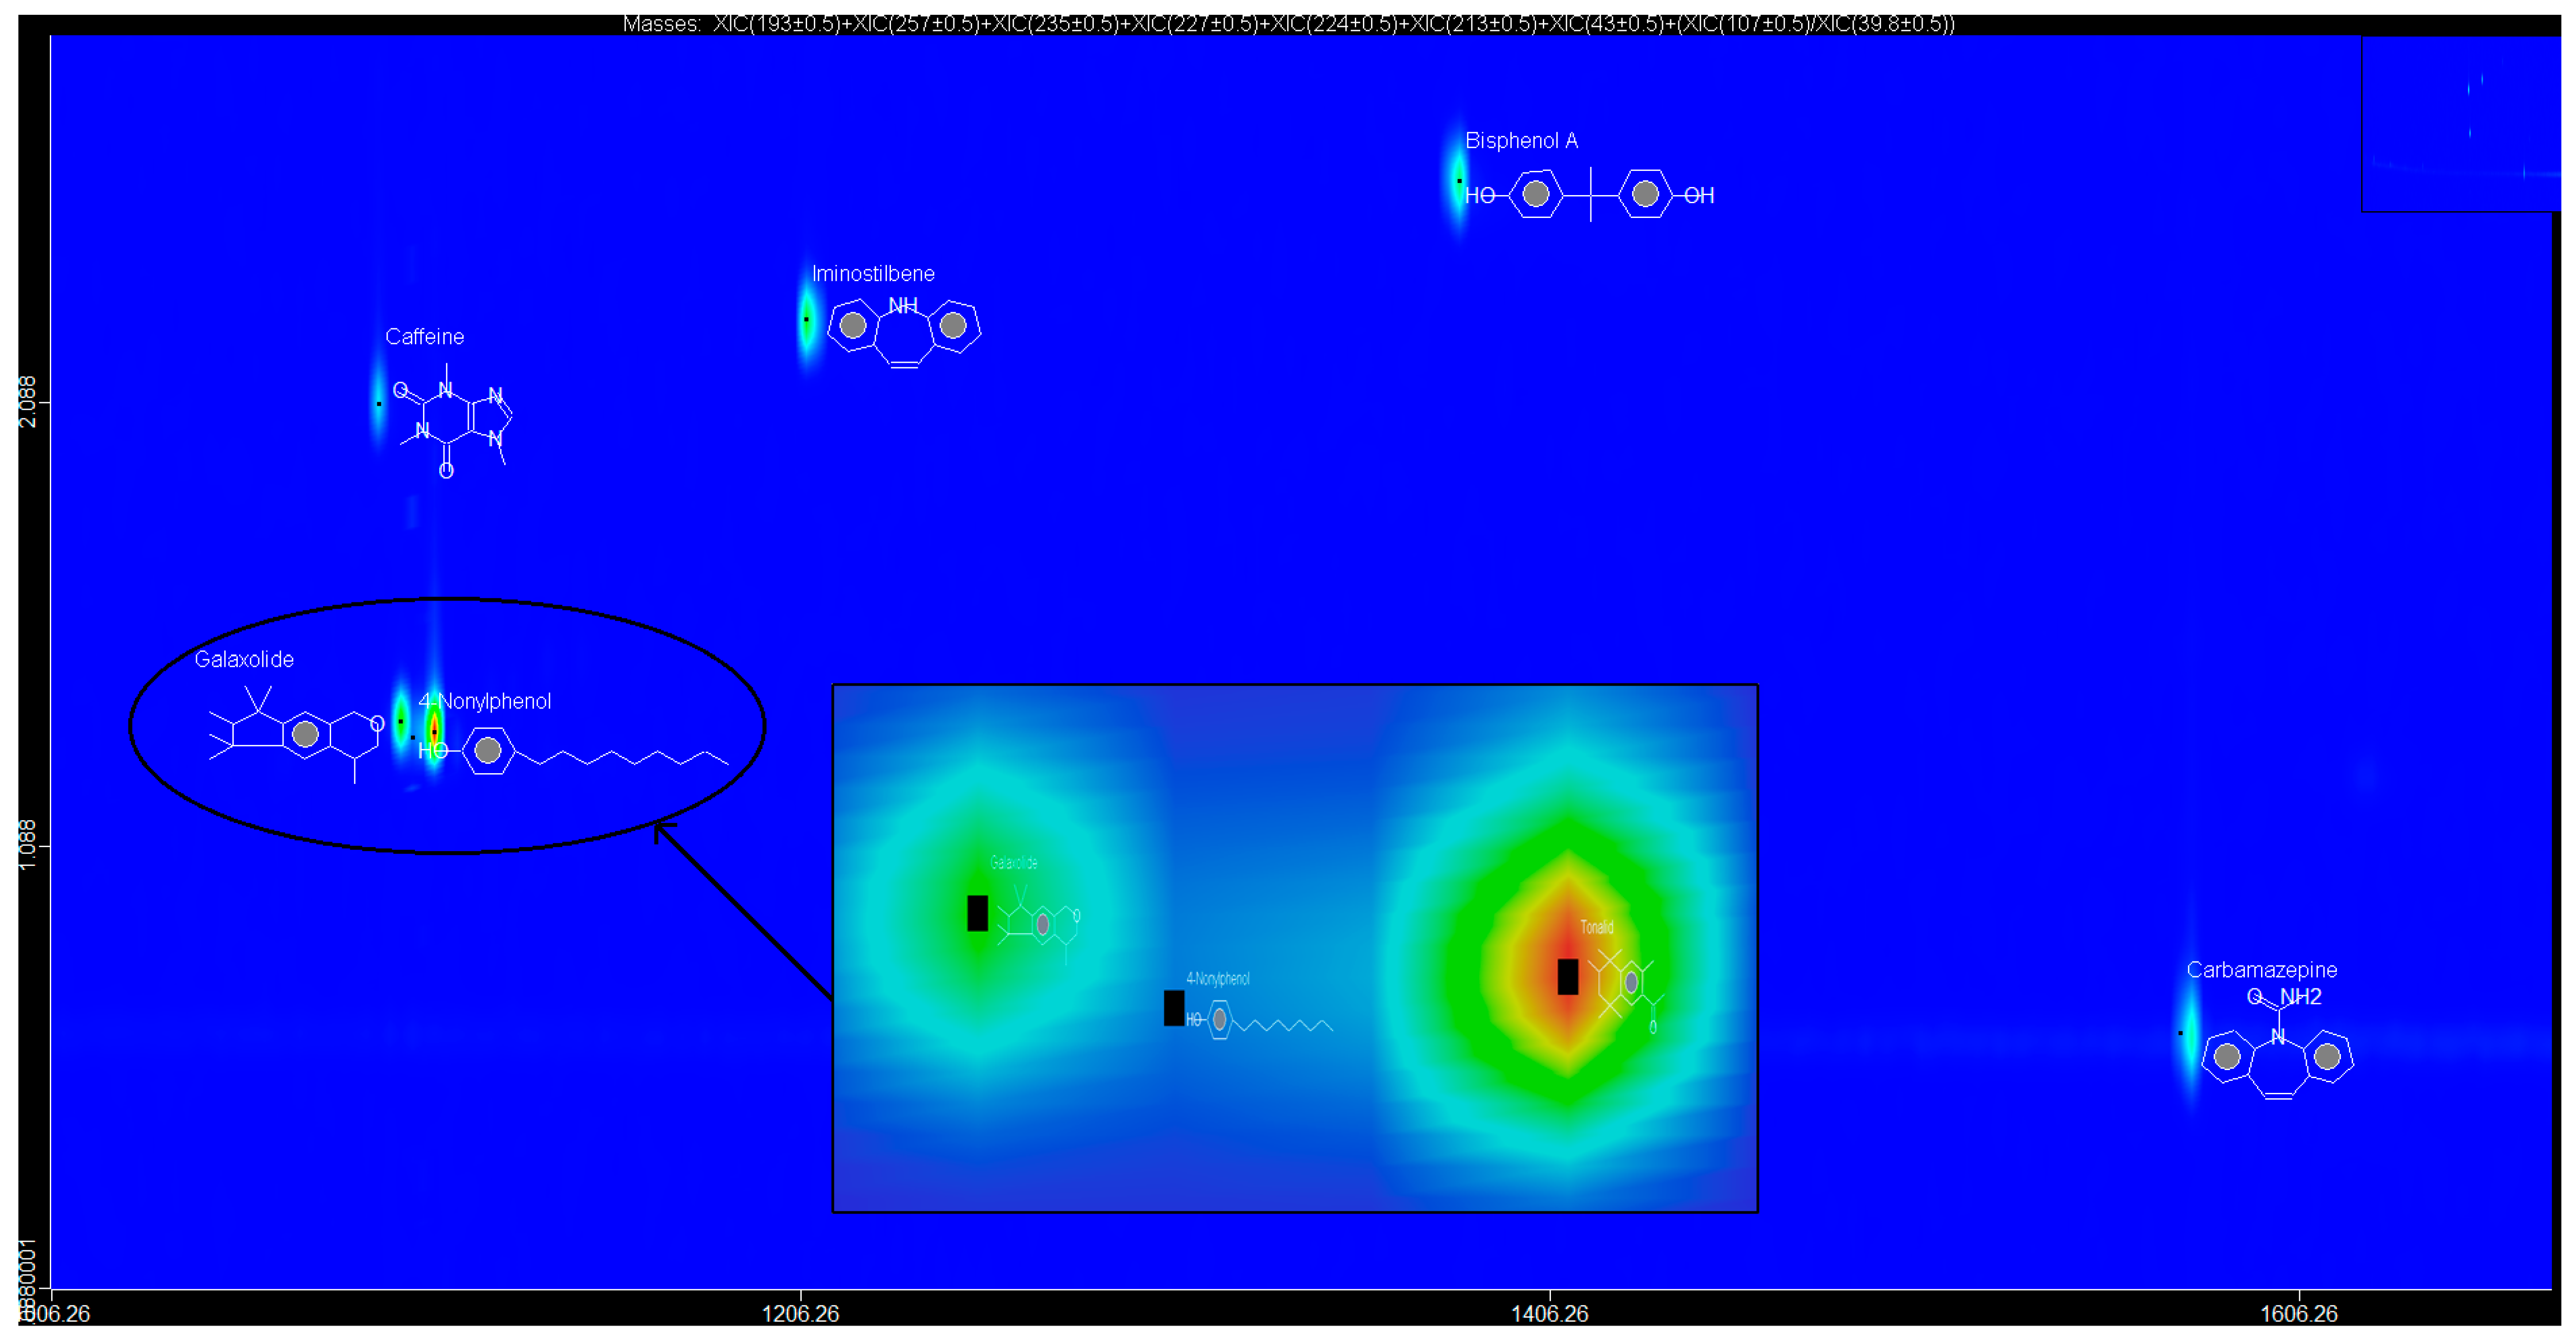
The SPE extracts were analysed using the GCxGC-HRTOFMS (LECO Corporation, St. Joseph, MI, USA) equipped with a thermal modulator and a split/splitless injector using liquid nitrogen. A low-polarity phase Rxi-5SilMS column (30 m × 0.25 mm i.d., 0.25 µm film thickness) was used for GC in the first dimension analysis (1D GC). The second dimension analysis (2D GC) was performed on a polar Rxi-17SilMS (1 m × 0.25 mm i.d., 0.25 µm film thickness). Helium was used as the carrier gas at a constant linear velocity of 1.9 mL/min. Using an autosampler (Agilent 7890A Series, Santa Clara, CA, USA), splitless injection mode was used with the vaporised sample moving through the injection port liner. The oven temperature was programmed as follows: 50 °C (held for 1 min) ramped to 210 °C at 10 °C/min (held for 2 min) and then ramped to 250 °C at 15 °C/min and held for 10 min. The injector and interface temperatures were set at 220 °C, with the MS quad temperature set at 150 °C and the MS source at 230 °C. The secondary oven was operated at a temperature 5 °C higher than that of the primary oven and was operated in an iso-ramping mode. The modulation period, the hot-pulse duration, and the cool time between stages were set at 3.0 s, 0.4 s, and 1.1 s, respectively. The transfer line to HRTOFMS detector source was operated at 250 °C. The source temperature was 230 °C with a filament bias voltage of −70 eV. The MS mass range was 45 to 550 atomic mass units (amu), with the data acquisition rate at 200 spectra/s, while the detector voltage was 1750 V. The inlet temperature was 200 °C with a modulator offset temperature of 40 °C, and the purge time was 60 s. The mass spectrometer was operated in the positive ion mode with an ionisation voltage of 70 eV using selected ion monitoring (SIM). Prior to injection, the syringe was cleaned five times with n-hexane and once with the sample. An external standard mixture was measured after each batch of five samples to verify instrument measurement performance. Data were processed and consecutively visualised on 2D and 3D chromatograms using LECO ChromaTOF-HRT® software (LECO Corporation, St. Joseph, MI, USA).
2.5. Determination of the Mass Accuracies, Limits of Quantification, Limits of Detection, Linearity, and S/N Ratios for BPA, NP, CAF, HHCB, AHTN, and CBZ
Linear regression analysis was used to determine LOD and LOQ for BPA, NP, CAF, HHCB, AHTN, and CBZ based on GC × GC-HRTOFMS’ linear calibration curves for each analyte. It was assumed from the obtained linear calibration curves for each analyte that the GC × GC-HRTOFMS response matrix Y was linearly related to the descriptor matrix X for a limited range of concentrations. The limit of quantification (LOQ) and limit of detection (LOD) for each analyte were thus determined based on the signal-to-noise (S/N) ratios of 10 and 3 based on the residual standard deviation of the response or the standard deviation (SD) of the y-intercept of the regression line of the calibration curve and the sensitivity or slope of the regression line, as shown in Equations (1) and (2):
The LOQ and LOD and tests were performed in triplicate to confirm the accuracy regarding each of the detected EMPs at varying concentrations. The mass accuracies for BPA, NP, CAF, HHCB, AHTN, and CBZ were also obtained directly from GC × GC-HRTOFMS analyses.
2.6. Determination of the Temporal and Spatial Variations in the Occurrence of the Analytes during the Study Period
The R statistical software was used to compute descriptive statistics correlation studies, Kruskal Wallis test, ANOVA, and principal component analysis (PCA) utilizing data obtained from both onsite and GC × GC-HRTOFMS analyses of all the 44 water samples over the studied period. Kruskal Wallis test and analysis of variance (ANOVA) were performed to determine temporal variations in the occurrence of analytes in the water samples at 95% confidence level. The PCA and correlation studies were used as quantitative and independent approaches for water classification, allowing the grouping of the water samples and the establishment of correlations between chemical parameters and water samples, respectively. The principal components (PCs) of the PCA were extracted using the Varimax rotation. The total number of PCs to retain was based on the Kaiser criterion, wherein only PCs with eigenvalues >1 were retained and the parameters were retained if their
p-value < 0.05 at 95% confidence level. Equation (3) shows the R-mode PCA model that was used to compute factor scores:
where
fr were the
rth common factors,
p was the specified number of factors,
j was the random variation unique to the original hydrochemical variable
Xj, and
ajr was the loading of the
jth variate on the
rth factor. The PCA model corresponded to the loading or weights on the extracted PCs. The new factor was expressed as shown using Equation (4)
where
ai was the loading of
i index;
Ii was the standardized data of
I index.
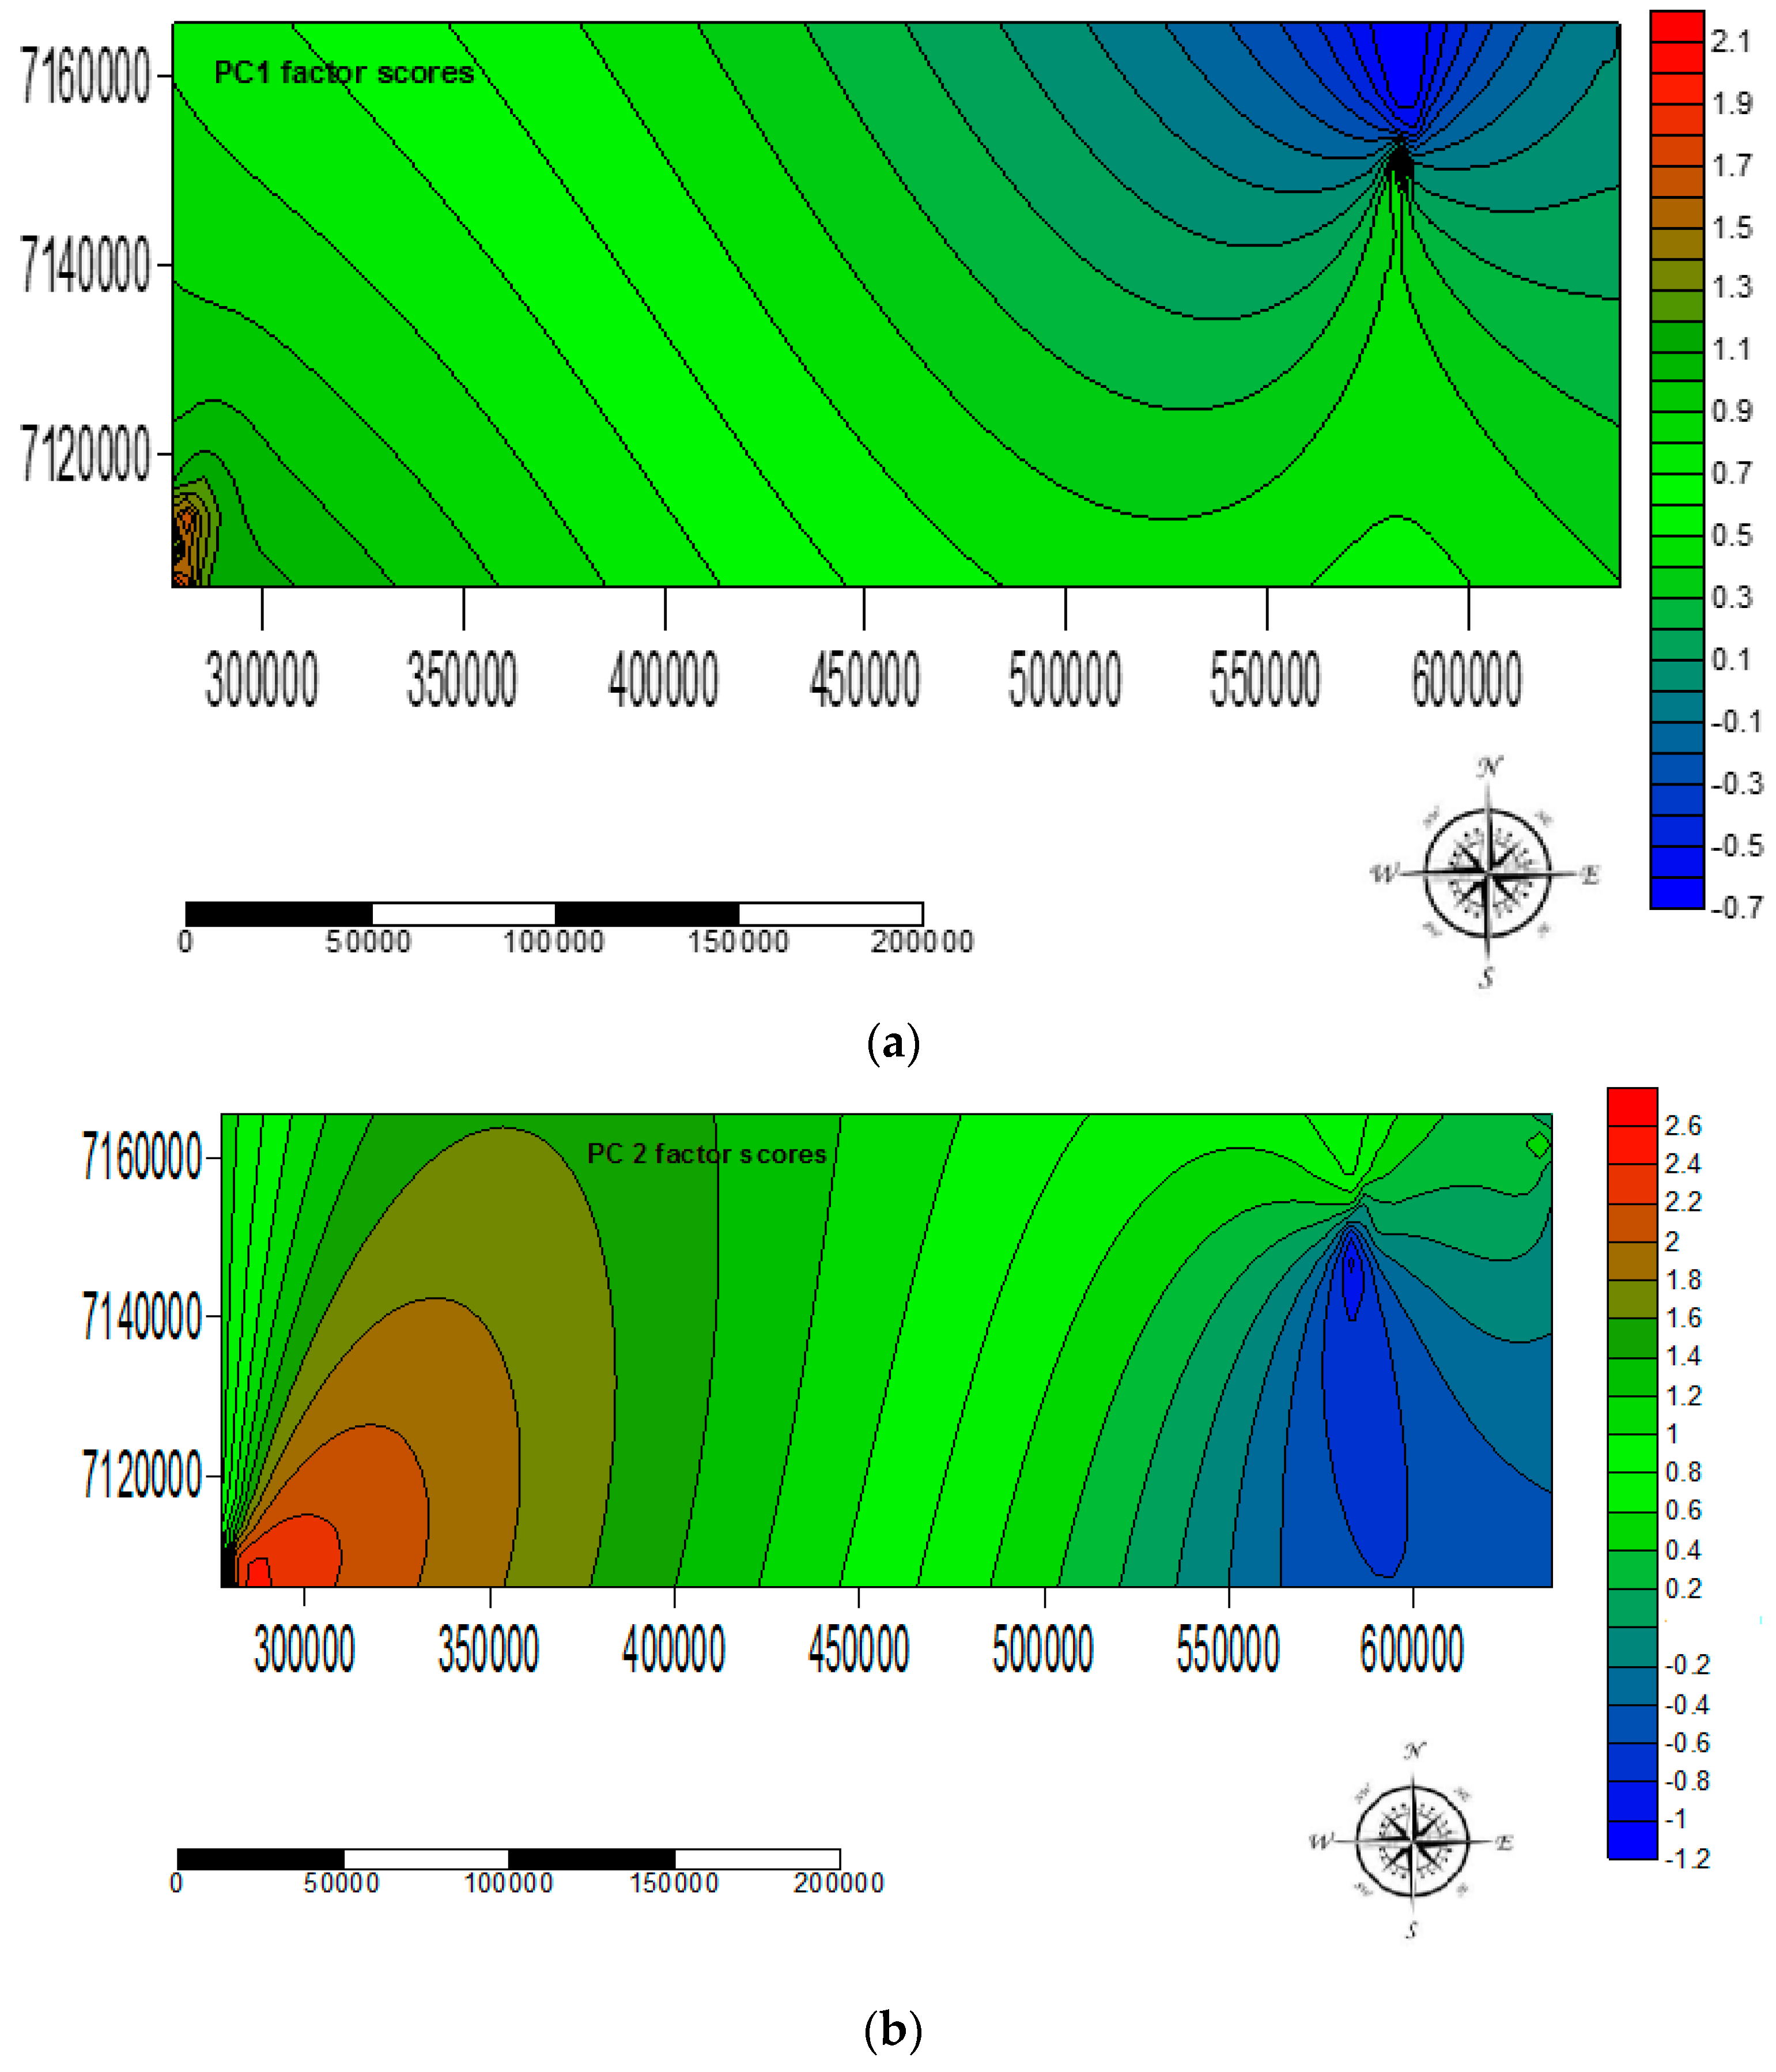
The factor score loadings for each water sample were utilised to model spatial variations in the occurrence of the EMPs using Surfer Golden Graphics software for surface mapping (version 8). Specifically, the value of each factor score represented the importance of a given factor at the sampled site. A factor score >+1 reflected sampling areas significantly influenced of EMPs highly loaded in a particular PC. Factor scores <−1 reflected sampling areas virtually unaffected by EMPS highly loaded in a particular PC, whereas near-zero scores reflected areas moderately influenced by EMPs highly loaded in a particular PC. The spatial variations of the occurrence of EMPs highly loaded in a particular PC were assessed by surface mapping contour plots of the factor scores representing each factor.
4. Conclusions
The EMPs, BPA, NP, CAF, HHCB, AHTN, and CBZ were successfully extracted and pre-concentrated using autotrace-SPE prior to determination using the GCxGC-HRTOFMS system in water samples collected from Mpumalanga, Gauteng, and North West provinces, South Africa at better S/N ratios as well as lower LOD and LOQ. Although no statistically significant temporal variation in occurrence of the analytes was observed in water samples at the 95% confidence level, all the analytes were detected, at different levels concentrations, in the different sample types analysed across a broad spectrum of wastewater effluent, surface water, groundwater, and treated water, with BPA found to be present in 62% of the sampling sites and thus identified as the most widely distributed EMP in these water systems. It was also observed that the levels and occurrence of EMPs varied spatially and were a function of two PCs (PC1 and PC2) which controlled 89.99% of the observed variance. The results indicated that the identified EMPs pose ecotoxicological risks to aquatic life as well as communities, especially in Mpumalanga province which was largely influenced by EMPs with high loadings in the two PCs. The results of this study will thus contribute to the body of knowledge on levels and occurrence of EMPs in water, especially in considering the case of Gauteng, North West, and Mpumalanga provinces in South Africa. An understanding of temporal and spatial variations in the levels and occurrence of EMPs in water is critical for enrichment of the scientific understanding of behaviour, distribution, and fate of the EMPs in water bodies necessary for informed decision making on direct future water resources management, water pollution safeguards, as well as regulation of the EMPs in water.


