Article

Comparison of the Combined Obesity Indices to Predict Cardiovascular Diseases Risk Factors and Metabolic Syndrome in Northeast China

1
Epidemiology and Biostatistics School of Public Health, NO. 1163 Xinmin Street, Jilin University, Changchun 130021, China
2
Department of Immunization Program, Changchun Center for Disease Control and Prevention, Changchun 130021, China
*
Author to whom correspondence should be addressed.
Int. J. Environ. Res. Public Health 2016, 13(8), 801; https://doi.org/10.3390/ijerph13080801
Submission received: 14 June 2016 / Revised: 28 July 2016 / Accepted: 2 August 2016 / Published: 9 August 2016

Abstract

:
Background: Obesity is associated with cardiovascular disease (CVD) risk factors (hypertension, dyslipidemia and diabetes) and metabolic syndrome (MetS), and it may be flawed that most studies only use one obesity index to predict these risk factors. Therefore, our study aims to compare the various combined obesity indices systematically, and to find the optimal combined obesity indices to predict CVD risk factors and MetS. Methods: A total of 16,766 participants aged 18–79 years old were recruited in Jilin Province in 2012. Receiver operating characteristic curve (ROC) curves and multiple logistic regressions were used to evaluate the predictive capacity of the combined obesity indices for CVD risk factors and MetS. Results: The adjusted area under receiver operating characteristic (AUROC) with two combined obesity indices had been improved up to 19.45%, compared with one single obesity index. In addition, body mass index (BMI) and waist circumference (WC) were the optimal combinations, where the AUROC (95% confidence interval (CI)) for hypertension, dyslipidemia, diabetes and MetS in males were 0.730 (0.718, 0.740), 0.694 (0.682, 0.706), 0.725 (0.709, 0.742) and 0.820 (0.810, 0.830), and in females were 0.790 (0.780, 0.799), 0.727 (0.717, 0.738), 0.746 (0.731, 0.761) and 0.828 (0.820, 0.837), respectively. Conclusions: The more abnormal obesity indices that one has the higher the risk for CVD risk factors and MetS, especially in males. In addition, the combined obesity indices have better predictions than one obesity index, where BMI and WC are the optimal combinations.

Graphical Abstract

1. Introduction

The prevalence of obesity is developing extremely quickly worldwide nowadays, especially in China [1,2], and it is believed that obesity is closely associated with cardiovascular disease (CVD) risk factors (hypertension (HTN), dyslipidemia (DLP) and diabetes mellitus (DM)) and metabolic syndrome (MetS) in literature [3,4,5,6]. Obviously, studies focusing on this field inevitably utilize indices to denote and evaluate obesity. Thus, various obesity indices have been proposed based on different research purposes [7,8], such as body mass index (BMI), waist-hip ratio (WHR), waist-to-height ratio (WHtR), etc. In addition, the optimal obesity index varies according to the study population [9].
Some studies have indicated that BMI is a strong predictor of CVD mortality for whites [10], and is one of the most commonly used indices for obesity [11]; other studies indicated that waist circumference (WC) or WHtR might be a better predictor for CVD risk factors or MetS in Korean/Chinese and other ethnic groups [8,12,13], while Mbanya et al. pointed out that WC was the best predictor in Cameroonian [14], and WHR was viewed as the index for evaluating fat distribution [9]. Moreover, Bergman et al.’s study found that body adiposity index (BAI) was a better predictor for African-American and Mexican-American [15], while Lam et al. manifested that BAI might be unlikely to be better than BMI and was not applied to Asian [9]. Therefore, BAI is not considered in the present study.
Furthermore, a significant challenge is that body composition in Asia is markedly different in comparison with the U.S., Europe, etc. Thus, no obesity index is consistently superior to others, and the selection of obesity index depends on the study population and other factors [9]. Some studies have also indicated that one single index may be not sufficient to evaluate obesity [16], and there is probably a tendency to cluster in obesity indices. But unfortunately, less research is reported on this field, not to mention systematic studies.
In this study, various combinations of BMI, WC, WHR and WHtR are investigated to evaluate the predictive ability comprehensively for CVD risk factors and MetS. In addition, 16,766 adults aged 18–79 years old in Jilin Province have participated in our study. It turns out that the participants are at a higher risk when they have more abnormal obesity indices, which are more serious in males. In addition, the combinations of indices have better performances than a single index, where BMI and WC are the optimal pairs. In addition, Jilin is located in the central part of northeast China, with latitude 40°–46° N and longitude 121°–131° E [17], so the results may be instructive and meaningful to the studies related to obesity in northeast China.

2. Methods

2.1. Study Population

A total of 16,766 adults aged 18–79 years old were selected through multistage stratified random cluster sampling in Jilin Province in 2012. These participants had lived in Jilin Province for more than 6 months (for a detailed sampling method, see Section 1 of online Supplementary Material).

2.2. Ethics Statement

The ethics committee of the School of Public Health, Jilin University approved the study (project identification code: 2012-R-011), and written informed consent was obtained from all of the participants before data collection.

2.3. Data Measurement

Height, weight, WC, hip circumference (HC) and blood pressure were measured by trained professionals, with the participants wearing light clothing but no shoes. Blood pressure was measured using a mercury sphygmomanometer. After an overnight fast, serum lipids and fasting blood glucose (FBG) were measured before breakfast, using a MODULE P800 biochemical analysis machine (Roche Co., Ltd., Shanghai, China) and a Bai Ankang fingertip blood glucose monitor (Bayer, Leverkusen, Germany), respectively.
The various obesity indices were calculated as follows:
BMI = weight(kg) height 2 (m) ,   WHR= WC(cm) HC(cm) ,   WHtR= WC(cm) height(cm)

2.4. Assessment Criteria

In the study, hypertension (HTN) was defined as resting systolic blood pressure (SBP) ≥ 140 mmHg and/or diastolic blood pressure (DBP) ≥ 90 mmHg and/or the use of antihypertensive medication in the past two weeks [18]. Dyslipidemia (DLP) was defined as using lipid-lowering drugs or having one or more of the following: triglyceride (TG) ≥ 1.7 mmol/L, total cholesterol (TC) ≥ 5.2 mmol/L, high-density lipoprotein cholesterol (HDL-C) < 1.0 mmol/L and low-density lipoprotein cholesterol (LDL-C) ≥ 3.4 mmol/L [19]. diabetes mellitus (DM) was defined as the use of hypoglycemic agents or a self-reported history of DM or FBG of 7.0 mmol/L or more [20]. MetS was defined as three or more of the following conditions clustered in one subject: (a) WC ≥ 85 cm for males or ≥80 cm for females; (b) TG ≥ 1.7 mmol/L or ongoing hypertriglyceridemia treatment; (c) HDL-C < 1.0 mmol/L for males or <1.3 mmol/L for females, or ongoing treatment; (d) SBP ≥ 130 mmHg and DBP ≥ 85 mm Hg, or ongoing antihypertensive drug therapy; and (e) FBG ≥ 5.6 mmol/L or ongoing anti-diabetic drug treatment [21,22]. The optimal cut-off values of obesity indices recommended by others studies [23,24,25] as well as the present studies were listed in Table 1, where subscript “0/1” denoted normal/abnormal for the index.

2.5. Statistical Analyses
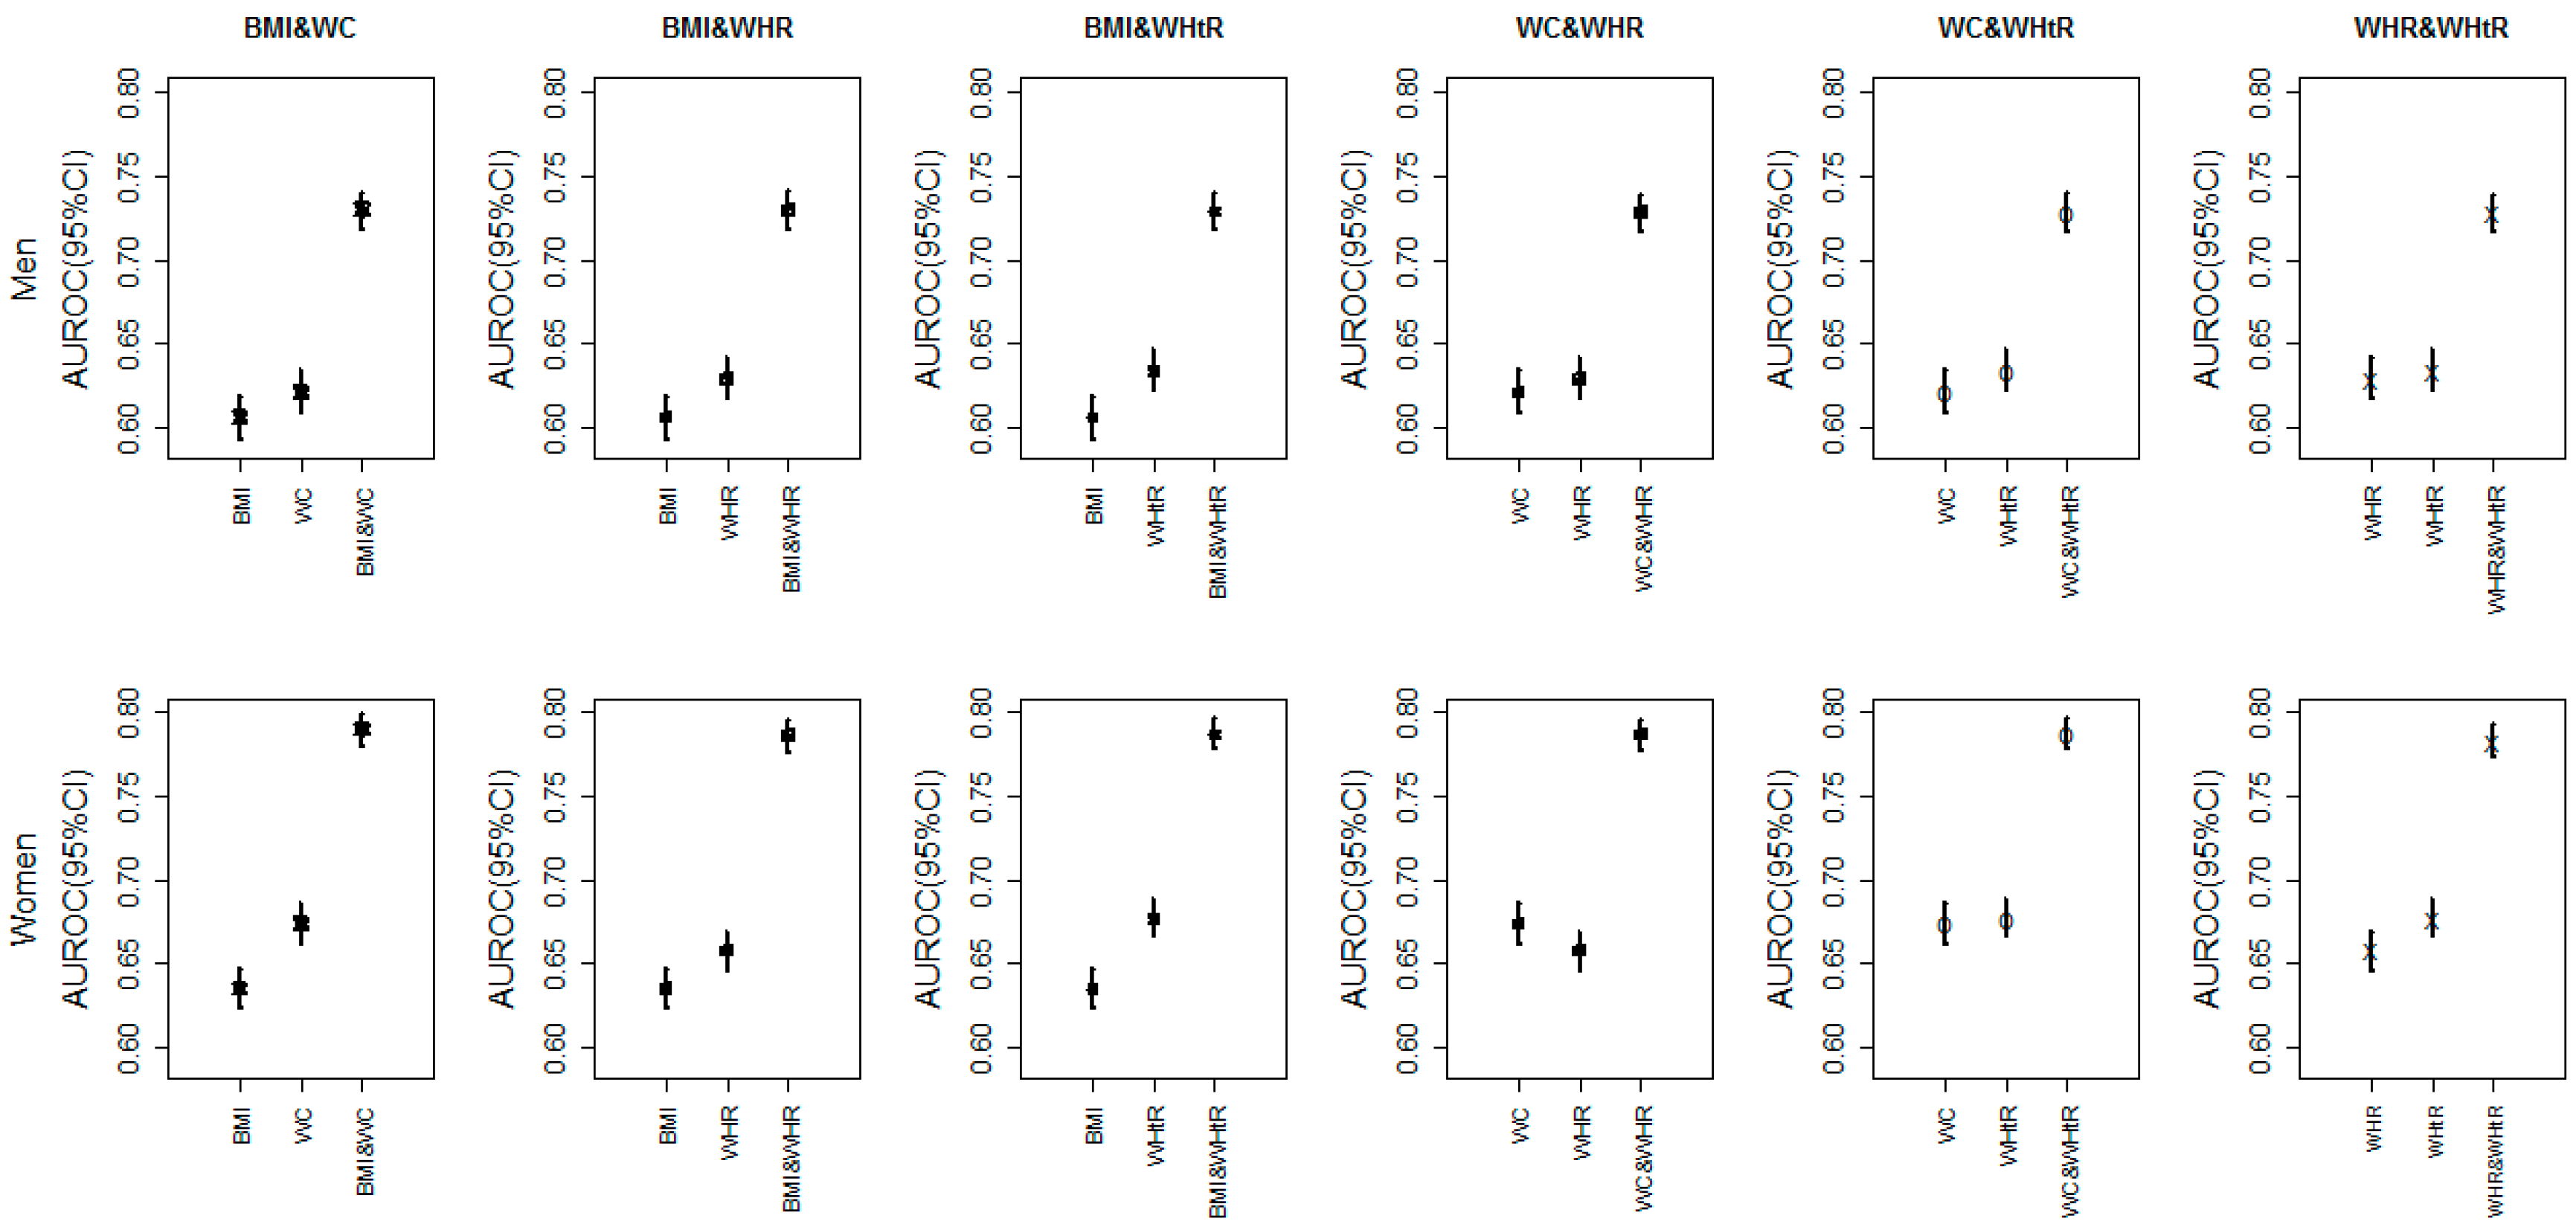
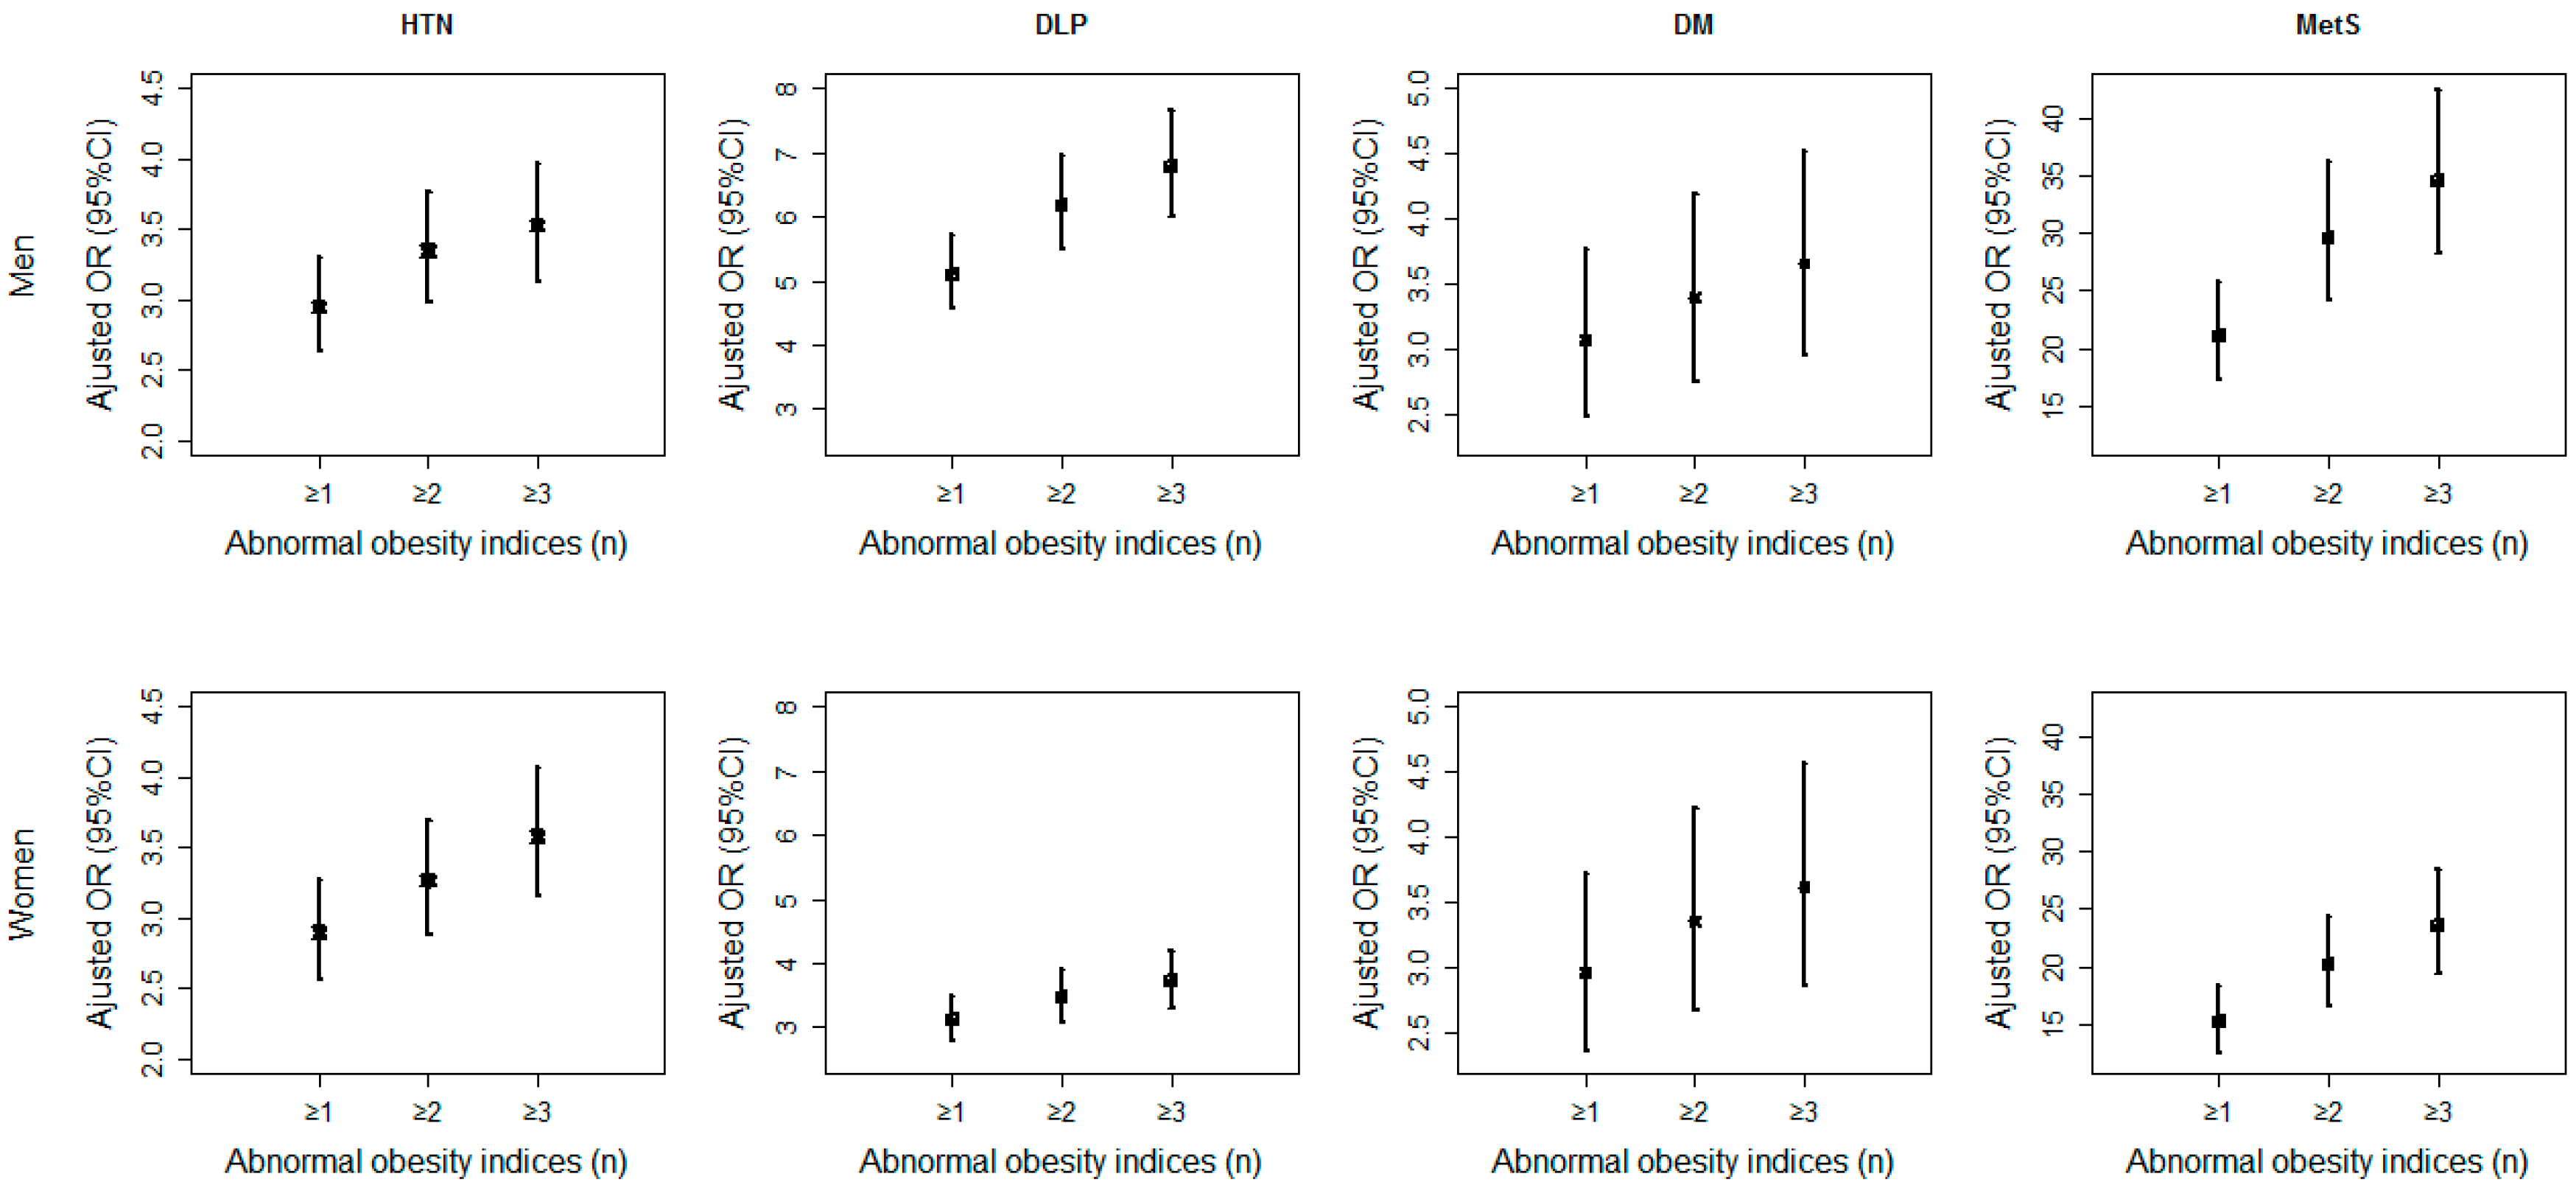
The quantitative variables were expressed as means ± standard deviations (SD) and compared using a Student’s t-test. The categorical variables were expressed as counts, percentages and compared using a Rao–Scott-χ2 test. Area under receiver operating characteristic (AUROC) analyses were used to evaluate the predictive ability. Logistic regression models were used to calculate the odds ratios (ORs) and to evaluate the combined obesity indices. All statistical analyses were performed using the IBM SPSS 20.0 (SPSS Inc., New York, NY, USA) and the R version 3.3.1 (University of Auckland, Oakland, New Zealand). Statistical significance was set at p-value < 0.05.

3. Results

The basic characteristics of the participants are given in Table 2. The percentages of BMI1, WHR1, HTN, DLP, DM and MetS in males were significantly higher than those in females (p < 0.05), while WC1 did not differ statistically significantly by gender (p > 0.05).
Figure 1 shows that the adjusted ORs were increasing obviously with the clustering of the abnormal obesity indices (where ≥1, ≥2 and ≥3 refer to the sum of number of abnormal BMI, WC, WHtR and WHR) compared with the normal obesity indices, that is, the person with more abnormal obesity indices was at a higher risk for CVD risk factors and MetS. Meanwhile, almost all the adjusted ORs in males (1st row of Figure 1) were larger than those in females (second row of Figure 1), especially for DLP and MetS (see details in online Supplementary Table S1).
Since we had the evidence that the clustering of obesity indices would increase the risk for CVD risk factors and MetS, we now investigated how much it could be improved with combinations of obesity indices using AUROC. Figure 2 shows the adjusted AUROC of a single index vs. various combinations of two indices for HTN, respectively (DLP, DM and MetS were in the online supplement Figures S1–S3). And it was obvious that the predictive capacity for HTN with two obesity indices was much better than that with one single index. For example, the adjusted AUROC of BMI and WHR for HTN in females were 0.635 and 0.658, respectively, but the adjusted AUROC of the combination BMI and WHR were 0.786 (online Supplementary Tables S2 and S3), which had increased by at least 0.128 (0.128/0.658 = 19.45%). Besides, the rise in AUROC for HTN and DM (at least 12.37%–19.45%) was larger than DLP and MetS (at least 2.27%–12.29%), and generally the rise in AUROC for females was larger than that for males. In addition, we investigated how the combinations of two obesity indices behaved in predicting CVD risk factors and MetS in different age groups as well (online Supplementary Table S4). It was shown that the younger age groups had better performances (larger AUROC). However, combinations with more than two obesity indices were not considered in our studies, due to the potential collinearity.
Finally, the effects of BMI and WC are shown in Figure 3 (and other combinations are in online Supplementary Tables S5–S7). Four categories were reassigned for each combination, from no abnormal to two abnormal obesity indices (i.e., 00, 01, 10 and 11). Generally, the adjusted ORs for the two abnormal obesity indices were much higher than those with any single abnormal obesity index, especially for MetS. Besides, the adjusted ORs for BMI0 and WC1 were a little higher than BMI1 and WC0, that is, abnormal WC might have a higher risk than abnormal BMI.

4. Discussion

The prevalences of HTN, DLP, DM and MetS in our study were 37.27%, 39.76%, 10.07% and 33.1%, respectively, which were much higher than those in other studies [19,26,27]. The reason might be the different study populations, different survey times, different threshold criteria, and different diet patterns. Firstly, the threshold criteria for MetS, WC, etc. might be different in different studies [21,28,29,30]. Secondly, the climate of residence to survey population usually requires a special diet such as eating more animal fat, more salt and fewer fresh vegetables, while the diet patterns are believed to be associated with different degrees of MetS prevalence, and lower salt intake can reduce MetS [31,32,33]. Finally, the population participates in fewer outdoor activities (exercises), especially during the cold winter months [34].
Meanwhile, a number of studies had demonstrated that obesity was associated with CVD risk factors and MetS [3,35], and various obesity indices were used in literature [36,37] to describe obesity. Furthermore, some studies also indicated that one single index might be not sufficient to evaluate obesity [16], but, unfortunately, less research was reported on this field, not to mention systematic studies.
In our study, we investigated four obesity indices, BMI, WC, WHR and WHtR, together with their clustering in predicting CVD risk factors and MetS. It turned out that the participants were at an increasing risk with the of abnormal obesity indices that one had. Generally, the adjusted ORs in males were higher than those in females, especially for DLP and MetS. One possible reason was that the prevalence of abdominal obesity in males might be more common than that in females, and the other possible reason was that females tended to control their weight in contrast with males [38,39]. Therefore, more effective attention and intervention should be paid to obesity, especially abdominal obesity in males.
Furthermore, using the combination of two indices could improve the AUROC on different levels, and the rise was up to 19.45%. Meanwhile, a number of previous studies also suggested that the combination of two indices had a better predictive capacity than either alone [40,41]. The reason might be that the combinations of different indices incorporated the information both in the amount of fat and in the distribution of fat. Similarly, the rise of AUROC for HTN and DM were larger than DLP and MetS, which might be due to the fact that DLP and MetS were primarily influenced by abdominal obesity; while HTN and DM also depended on the amount of fat to some extent. In addition, BMI and WC were the preferable combinations in general, which was in agreement with Zhu et al.’s and Ricketts et al.s study [40,42]. Besides, the AUROC of younger age groups was the largest in most cases, which implied that obesity might have much more impact on young people.
Finally, we demonstrated the adjusted ORs of each combined obesity indices for CVD risk factors and MetS. There was no surprise to find that the participant with two abnormal indices (11) gained the highest risk than other cases (00, 01 and 10) for all combinations and risk factors. Moreover, it seemed that WC had played an important role in evaluating obesity for CVD risk factors and MetS. For example, the adjusted ORs for BMI0 and WC1 were a little higher than BMI1 and WC0, that is, abnormal WC might have a higher risk than abnormal BMI, and similar findings were also obtained in other combinations with WC. Therefore, it was implied that the distribution of fat had a greater influence on CVD risk factors and MetS than the amount of fat.
Some limitations of our study should be noted here. Firstly, the definition of MetS had an overlap with WC, which might lead to overestimations of adjusted AUROC and ORs for MetS. Secondly, age was adjusted in our studies; however, other confounders that might have impact on CVD risk factors and MetS [42,43,44,45,46,47,48], such as physical activity or fitness, smoking, etc., were not under our consideration. Finally, the results in our study were attained from Jilin province, which might limit our ability to generalize the results to the rest of China.

5. Conclusions

The adjusted ORs for CVD risk factors and MetS increase with the amount of abnormal obesity indices, especially in males. The AUROC with two indices has been improved up to 19.45% compared with that of one single index, where the rise of AUROC in females is larger than that in males, and the optimal combinations are BMI and WC. In addition, abdominal obesity has more impact on most CVD risk factors and MetS, and the risk of abdominal obesity for CVD risk factors and MetS in males is larger than that in females, which imply that more effective attention and intervention should be paid to males.

Supplementary Materials

The following are available online at www.mdpi.com/1660-4601/13/8/801/s1, Figure S1: the adjusted AUROC of a single index and various combinations of two indices for dyslipidemia, Figure S2: the adjusted AUROC of a single index and various combinations of two indices for diabetes, Figure S3: the adjusted AUROC of a single index and various combinations of two indices for MetS, Table S1: the clustering effects of the obesity indices on CVD risk factors and MetS, Table S2: AUROC of the various obesity indices for CVD risk factors and MetS, Table S3: AUROC of the clustering of the various obesity indices for CVD risk factors and MetS, Table S4: AUROC of the two obesity indices combinations to predict CVD risk factors and MetS in different age groups, Table S5: the adjusted ORs of the combined obesity indices for CVD risk factors and MetS, Table S6: the adjusted ORs for the combined obesity indices with CVD risk factors and MetS, Table S7: the adjusted ORs for the combined obesity indices with CVD risk factors and MetS.

Acknowledgments

The authors gratefully acknowledge the financial support received from the National Natural Science Foundation of China (grant number: 11301213, 11571068) and from the Scientific Research Foundation of the Health Bureau of Jilin Province, China (grant number: 2011Z116). We express our gratitude to the participants and colleagues who were involved in the study.

Author Contributions

Yuchun Tao and Jianxing Yu had the original idea for the study, and, with all co-authors, carried out the design. Lina Jin provided valuable insight regarding the methodological approach and organization of the manuscript. Yaqin Yu, Yuhui Tao and Yuchun Tao were responsible for recruitment and follow-up of study participants. Yuchun Tao and Yang Yu were responsible for data cleaning and Hui Pang carried out the analyses. Yuchun Tao and Jianxing Yu drafted the manuscript, which was revised by all authors. All authors read and approved the final manuscript.

Conflicts of Interest

The authors declare no conflict of interest.

Abbreviations

The following abbreviations are used in this manuscript:
WCwaist circumference
BMIbody mass index
WHRwaist-hip ratio
WHtRwaist-to-height ratio
HChip circumference
BAIbody adiposity index
The laboratory biochemical indicators:
SBPsystolic blood pressure
DBPdiastolic blood pressure
TCtotal cholesterol
TGtriglyceride
LDL-Clow-density lipoprotein cholesterol
HDL-Chigh-density lipoprotein cholesterol
FBGfasting blood glucose
Other indicators:
CVDcardiovascular disease
HTNhypertension
DLPdyslipidemia
DMdiabetes mellitus
MetSmetabolic syndrome
ORodds ratio
CIconfidence interval
ROCreceiver operating characteristic curve
AUROCarea under ROC

References

  1. Wang, Z.; Hao, G.; Wang, X.; Chen, Z.; Zhang, L.; Guo, M.; Tian, Y.; Shao, L.; Zhu, M. Current prevalence rates of overweight, obesity, central obesity, and related cardiovascular risk factors that clustered among middle-aged population of China. Zhonghua Liu Xing Bing Xue Za Zhi 2014, 35, 354–358. (In Chinese) [Google Scholar] [PubMed]
  2. Andegiorgish, A.K.; Wang, J.; Zhang, X.; Liu, X.; Zhu, H. Prevalence of overweight, obesity, and associated risk factors among school children and adolescents in Tianjin, China. Eur. J. Pediatr. 2012, 171, 697–703. [Google Scholar] [CrossRef] [PubMed]
  3. Dankel, S.J.; Loenneke, J.P.; Loprinzi, P.D. The impact of overweight/obesity duration on the association between physical activity and cardiovascular disease risk: An application of the “fat but fit” paradigm. Int. J. Cardiol. 2015, 201, 88–89. [Google Scholar] [CrossRef] [PubMed]
  4. Roberts, V.H.J.; Frias, A.E.; Grove, K.L. Impact of maternal obesity on fetal programming of cardiovascular disease. Physiology 2015, 30, 224–231. [Google Scholar] [CrossRef] [PubMed]
  5. Lee, S.Y.; Chang, H.J.; Sung, J.; Kim, K.J.; Shin, S.; Cho, I.J.; Shim, C.Y.; Hong, G.R.; Chung, N. The impact of obesity on subclinical coronary atherosclerosis according to the risk of cardiovascular disease. Obesity 2014, 22, 1762–1768. [Google Scholar] [CrossRef] [PubMed]
  6. Li, M.; McDermott, R.A. Using anthropometric indices to predict cardio-metabolic risk factors in Australian indigenous populations. Diabetes Res. Clin. Pract. 2010, 87, 401–406. [Google Scholar] [CrossRef] [PubMed]
  7. Dong, X.; Liu, Y.; Yang, J.; Sun, Y.; Chen, L. Efficiency of anthropometric indicators of obesity for identifying cardiovascular risk factors in a Chinese population. Postgrad. Med. J. 2011, 87, 251–256. [Google Scholar] [CrossRef] [PubMed]
  8. Park, S.H.; Choi, S.J.; Lee, K.S.; Park, H.Y. Waist circumference and waist-to-height ratio as predictors of cardiovascular disease risk in Korean adults. Circ. J. 2009, 73, 1643–1650. [Google Scholar] [CrossRef] [PubMed]
  9. Lam, B.C.C.; Koh, G.C.H.; Chen, C.; Wong, M.T.K.; Fallows, S.J. Comparison of body mass index (BMI), body adiposity index (BAI), waist circumference (WC), waist-to-hip ratio (WHR) and waist-to-height ratio (WHTR) as predictors of cardiovascular disease risk factors in an adult population in Singapore. PLoS ONE 2015, 10, e0122985. [Google Scholar] [CrossRef] [PubMed]
  10. Ortega, F.B.; Sui, X.M.; Lavie, C.J.; Blair, S.N. Body mass index, the most widely used but also widely criticized index: Would a criterion standard measure of total body fat be a better predictor of cardiovascular disease mortality? Mayo Clin. Proc. 2016, 91, 443–455. [Google Scholar] [CrossRef] [PubMed]
  11. Bennasar-Veny, M.; Lopez-Gonzalez, A.A.; Tauler, P.; Cespedes, M.L.; Vicente-Herrero, T.; Yanez, A.; Tomas-Salva, M.; Aguilo, A. Body adiposity index and cardiovascular health risk factors in Caucasians: A comparison with the body mass index and others. PLoS ONE 2013, 8, e63999. [Google Scholar]
  12. Cai, L.; Liu, A.P.; Zhang, Y.M.; Wang, P.Y. Waist-to-height ratio and cardiovascular risk factors among Chinese adults in Beijing. PLoS ONE 2013, 8, e69298. [Google Scholar] [CrossRef] [PubMed]
  13. Ashwell, M.; Hsieh, S.D. Six reasons why the waist-to-height ratio is a rapid and effective global indicator for health risks of obesity and how its use could simplify the international public health message on obesity. Int. J. Food Sci. Nutr. 2005, 56, 303–307. [Google Scholar] [CrossRef] [PubMed]
  14. Mbanya, V.N.; Kengne, A.P.; Mbanya, J.C.; Akhtar, H. Body mass index, waist circumference, hip circumference, waist-hip-ratio and waist-height-ratio: Which is the better discriminator of prevalent screen-detected diabetes in a Cameroonian population? Diabetes Res. Clin. Pract. 2015, 108, 23–30. [Google Scholar] [CrossRef] [PubMed]
  15. Bergman, R.N.; Stefanovski, D.; Buchanan, T.A.; Sumner, A.E.; Reynolds, J.C.; Sebring, N.G.; Xiang, A.H.; Watanabe, R.M. A better index of body adiposity. Obesity 2011, 19, 1083–1089. [Google Scholar] [CrossRef] [PubMed]
  16. Zeng, Q.; He, Y.; Dong, S.Y.; Zhao, X.L.; Chen, Z.H.; Song, Z.Y.; Chang, G.; Yang, F.; Wang, Y.J. Optimal cut-off values of BMI, waist circumference and waist: Height ratio for defining obesity in Chinese adults. Br. J. Nutr. 2014, 112, 1735–1744. [Google Scholar] [CrossRef] [PubMed]
  17. Gao, B.; Xu, Q.T.; Li, Y.B. Dynamic change and analysis of driving factors of carbon emissions from traffic and transportation energy consumption in Jilin Province. Appl. Mech. Mater. 2014, 472, 851–855. [Google Scholar] [CrossRef]
  18. Yip, G.W.; Li, A.M.; So, H.K.; Choi, K.C.; Leung, L.C.; Fong, N.C.; Lee, K.W.; Li, S.P.; Wong, S.N.; Sung, R.Y. Oscillometric 24-h ambulatory blood pressure reference values in Hong Kong Chinese children and adolescents. J. Hypertens. 2014, 32, 606–619. [Google Scholar] [CrossRef] [PubMed]
  19. Gu, D.F.; Gupta, A.; Muntner, P.; Hu, S.S.; Duan, X.F.; Chen, J.C.; Reynolds, R.F.; Whelton, P.K.; He, J. Prevalence of cardiovascular disease risk factor clustering among the adult population of China—Results from the international collaborative study of cardiovascular disease in Asia (Interasia). Circulation 2005, 112, 658–665. [Google Scholar] [CrossRef] [PubMed]
  20. Gao, B.X.; Zhang, L.X.; Wang, H.Y.; China National Survey of Chronic Kidney Disease Working Group. Clustering of major cardiovascular risk factors and the association with unhealthy lifestyles in the Chinese adult population. PLoS ONE 2013, 8, e66780. [Google Scholar] [CrossRef] [PubMed]
  21. Wu, Y.; Yu, S.; Wang, S.; Shi, J.; Xu, Z.; Zhang, Q.; Fu, Y.; Qi, Y.; Liu, J.; Fu, R.; et al. Zinc finger protein 259 (ZNF259) polymorphisms are associated with the risk of metabolic syndrome in a Han Chinese population. Clin. Lab. 2015, 61, 615–621. [Google Scholar] [PubMed]
  22. Browning, L.M.; Hsieh, S.D.; Ashwell, M. A systematic review of waist-to-height ratio as a screening tool for the prediction of cardiovascular disease and diabetes: 0.5 Could be a suitable global boundary value. Nutr. Res. Rev. 2010, 23, 247–269. [Google Scholar] [CrossRef] [PubMed]
  23. Zhou, B.F. Predictive values of body mass index and waist circumference for risk factors of certain related diseases in Chinese adults—Study on optimal cut-off points of body mass index and waist circumference in Chinese adults. Biomed. Environ. Sci. BES 2002, 15, 83–96. [Google Scholar] [PubMed]
  24. Appropriate body-mass index for asian populations and its implications for policy and intervention strategies. Lancet 2004, 363, 157–163.
  25. Ford, E.S.; Giles, W.H.; Dietz, W.H. Prevalence of the metabolic syndrome among us adults—Findings from the third national health and nutrition examination survey. JAMA 2002, 287, 356–359. [Google Scholar] [CrossRef] [PubMed]
  26. Ezquerra, E.A.; Vazquez, J.M.C.; Barrero, A.A. Obesity, metabolic syndrome and diabetes: Cardiovascular implications and therapy. Rev. Esp. Cardiol. 2008, 61, 752–764. [Google Scholar] [CrossRef]
  27. Alberti, K.G.M.M.; Eckel, R.H.; Grundy, S.M.; Zimmet, P.Z.; Cleeman, J.I.; Donato, K.A.; Fruchart, J.C.; James, W.P.T.; Loria, C.M.; Smith, S.C. Harmonizing the metabolic syndrome a joint interim statement of the international diabetes federation task force on epidemiology and prevention; national heart, lung, and blood institute; american heart association; world heart federation; international atherosclerosis society; and international association for the study of obesity. Circulation 2009, 120, 1640–1645. [Google Scholar] [PubMed]
  28. Wang, S.H.; Wang, L.; Zhou, Y.; Guo, Y.J.; Yuan, Y.; Li, F.F.; Huang, Y.; Xia, W.Q. Prevalence and control of dyslipidaemia among diabetic patients with microalbuminuria in a Chinese hospital. Diabetes Vasc. Dis. Res. 2013, 10, 169–178. [Google Scholar] [CrossRef] [PubMed]
  29. Palazon-Bru, A.; Gil-Guillen, V.F.; Orozco-Beltran, D.; Pallares-Carratala, V.; Valls-Roca, F.; Sanchis-Domenech, C.; Martin-Moreno, J.M.; Redon, J.; Navarro-Perez, J.; Fernandez-Gimenez, A.; et al. Is the physician’s behavior in dyslipidemia diagnosis in accordance with guidelines? Cross-sectional escarval study. PLoS ONE 2014, 9, e91567. [Google Scholar] [CrossRef] [PubMed]
  30. Executive summary: Standards of medical care in diabetes—2012. Diabetes Care 2012, 35, S4–S10.
  31. Bian, S.S.; Gao, Y.X.; Zhang, M.L.; Wang, X.; Liu, W.Q.; Zhang, D.L.; Huang, G.W. Dietary nutrient intake and metabolic syndrome risk in Chinese adults: A case-control study. Nutr. J. 2013, 12, 106. [Google Scholar] [CrossRef] [PubMed]
  32. Li, G.; de Courten, M.; Jiao, S.F.; Wang, Y. Prevalence and characteristics of the metabolic syndrome among adults in Beijing, China. Asia Pac. J. Clin. Nutr. 2010, 19, 98–102. [Google Scholar] [PubMed]
  33. Chen, J.; Gu, D.F.; Huang, J.F.; Rao, D.C.; Jaquish, C.E.; Hixson, J.E.; Chen, C.S.; Chen, J.C.; Lu, F.H.; Hu, D.S.; et al. Metabolic syndrome and salt sensitivity of blood pressure in non-diabetic people in China: A dietary intervention study. Lancet 2009, 373, 829–835. [Google Scholar] [CrossRef]
  34. Yu, J.X.; Ma, Y.H.; Yang, S.; Pang, K.; Yu, Y.Q.; Tao, Y.C.; Jin, L.N. Risk factors for cardiovascular disease and their clustering among adults in Jilin (China). Int. J. Environ. Res. Pubulic Health 2016, 13. [Google Scholar] [CrossRef] [PubMed]
  35. Bastien, M.; Poirier, P.; Lemieux, I.; Despres, J.P. Overview of epidemiology and contribution of obesity to cardiovascular disease. Prog. Cardiovasc. Dis. 2014, 56, 369–381. [Google Scholar] [CrossRef] [PubMed]
  36. Ashwell, M.; Gunn, P.; Gibson, S. Waist-to-height ratio is a better screening tool than waist circumference and BMI for adult cardiometabolic risk factors: Systematic review and meta-analysis. Obes. Rev. 2012, 13, 275–286. [Google Scholar] [CrossRef] [PubMed]
  37. Hsieh, S.D.; Muto, T. The superiority of waist-to-height ratio as an anthropometric index to evaluate clustering of coronary risk factors among non-obese men and women. Prev. Med. 2005, 40, 216–220. [Google Scholar] [CrossRef] [PubMed]
  38. Can, A.S.; Bersot, T.P.; Gonen, M. Anthropometric indices and their relationship with cardiometabolic risk factors in a sample of Turkish adults. Public Health Nutr. 2009, 12, 538–546. [Google Scholar] [CrossRef] [PubMed]
  39. Oanh, T.H.T.; Nguyen, D.N.; Phongsavan, P.; Dibley, M.J.; Bauman, A.E. Prevalence and risk factors with overweight and obesity among Vietnamese adults: Caucasian and Asian cut-offs. Asia Pac. J. Clin. Nutr. 2009, 18, 226–233. [Google Scholar]
  40. Zhu, S.K.; Heshka, S.; Wang, Z.M.; Shen, W.; Allison, D.B.; Ross, R.; Heymsfield, S.B. Combination of BMI and waist circumference for identifying cardiovascular risk factors in whites. Obes. Res. 2004, 12, 633–645. [Google Scholar] [CrossRef] [PubMed]
  41. Du, S.M.; Ma, G.S.; Li, Y.P.; Fang, H.Y.; Hu, X.Q.; Yang, X.G.; Hu, Y.H. Relationship of body mass index, waist circumference and cardiovascular risk factors in Chinese adult. Biomed. Environ. Sci. 2010, 23, 92–101. [Google Scholar] [CrossRef]
  42. Ricketts, T.A.; Sui, X.M.; Lavie, C.J.; Blair, S.N.; Ross, R. Addition of cardiorespiratory fitness within an obesity risk classification model identifies men at increased risk of all-cause mortality. Am. J. Med. 2016, 129, e13–e20. [Google Scholar] [CrossRef] [PubMed]
  43. Barry, V.W.; Baruth, M.; Beets, M.W.; Durstine, J.L.; Liu, J.H.; Blair, S.N. Fitness vs. fatness on all-cause mortality: A meta-analysis. Prog. Cardiovasc. Dis. 2014, 56, 382–390. [Google Scholar] [CrossRef] [PubMed]
  44. Lavie, C.J.; Milani, R.V.; Ventura, H.O. Effects of obesity and weight changes on cardiac and vascular structure and function does the clinical impact carry any weight? JACC Heart Fail. 2014, 2, 509–511. [Google Scholar] [CrossRef] [PubMed]
  45. McAuley, P.A.; Beavers, K.M. Contribution of cardiorespiratory fitness to the obesity paradox. Prog. Cardiovasc. Dis. 2014, 56, 434–440. [Google Scholar] [CrossRef] [PubMed]
  46. DeFina, L.F.; Haskell, W.L.; Willis, B.L.; Barlow, C.E.; Finley, C.E.; Levine, B.D.; Cooper, K.H. Physical activity versus cardiorespiratory fitness: Two (partly) distinct components of cardiovascular health? Prog. Cardiovasc. Dis. 2015, 57, 324–329. [Google Scholar] [CrossRef] [PubMed]
  47. Myers, J.; McAuley, P.; Lavie, C.J.; Despres, J.P.; Arena, R.; Kokkinos, P. Physical activity and cardiorespiratory fitness as major markers of cardiovascular risk: Their independent and interwoven importance to health status. Prog. Cardiovasc. Dis. 2015, 57, 306–314. [Google Scholar] [CrossRef] [PubMed]
  48. Lavie, C.J.; De Schutter, A.; Parto, P.; Jahangir, E.; Kokkinos, P.; Ortega, F.B.; Arena, R.; Milani, R.V. Obesity and prevalence of cardiovascular diseases and prognosis-the obesity paradox updated. Prog. Cardiovasc. Dis. 2016, 58, 537–547. [Google Scholar] [CrossRef] [PubMed]
Figure 1. The clustering effects of the obesity indices on cardiovascular disease (CVD) risk factors and metabolic syndrome (MetS).
Ijerph 13 00801 g001
Figure 2. The adjusted area under receiver operating characteristic (AUROC) of a single index vs. various combinations of two indices for hypertension (HTN).
Ijerph 13 00801 g002
Figure 3. The adjusted odds ratios (ORs) of the combination body mass index (BMI) and waist circumference (WC) for CVD risk factors and MetS.
Ijerph 13 00801 g003
Table 1. Optimal cut off values of obesity indices and corresponding abbreviations.
IndexCut-offCategoryAbbreviation
BMI24BMI ≤ 24 kg/m2BMI0
BMI > 24 kg/m2BMI1
WC85 (male)WC ≤ 85(male) or WC ≤ 80 (female)WC0
80 (female)WC > 85(male) or WC > 80 (female)WC1
WHR0.88 (male)WHR ≤ 0.88(male) or WHR ≤ 0.85 (female)WHR0
0.85 (female)WHR > 0.88(male) or WHR > 0.85 (female)WHR1
WHtR0.5WHtR ≤ 0.5WHtR0
WHtR > 0.5WHtR1
Table 2. Descriptive characteristics of participants by gender.
VariableAllMaleFemalet/χ2p-Value
(n = 16,766)(n = 7697)(n = 9069)
Age (year)47.80 ± 13.1847.00 ± 13.7448.47 ± 12.66−7.20<0.001
BMI18467 (50.50%)3982 (51.73%)4485 (49.45%)8.660.003
WC18077 (48.17%)3651 (47.43%)4426 (48.80%)3.130.077
WHR18550 (50.00%)4152 (53.94%)4398 (48.49%)49.45<0.001
WHtR18826 (52.64%)3856 (50.10%)4970 (54.80%)36.96<0.001
HTN6249 (37.27%)3162 (41.08%)3087 (34.04%)88.31<0.001
DLP6679 (39.76%)3410 (44.30%)3269 (36.05%)118.44<0.001
DM1688 (10.07%)820 (10.65%)868 (9.57%)5.390.020
MetS5535 (33.01%)2638 (34.27%)2897 (31.94%)10.210.001

