
Investigation and Evaluation of Children’s Blood Lead Levels around a Lead Battery Factory and Influencing Factors

Abstract
:1. Introduction
2. Materials and Methods
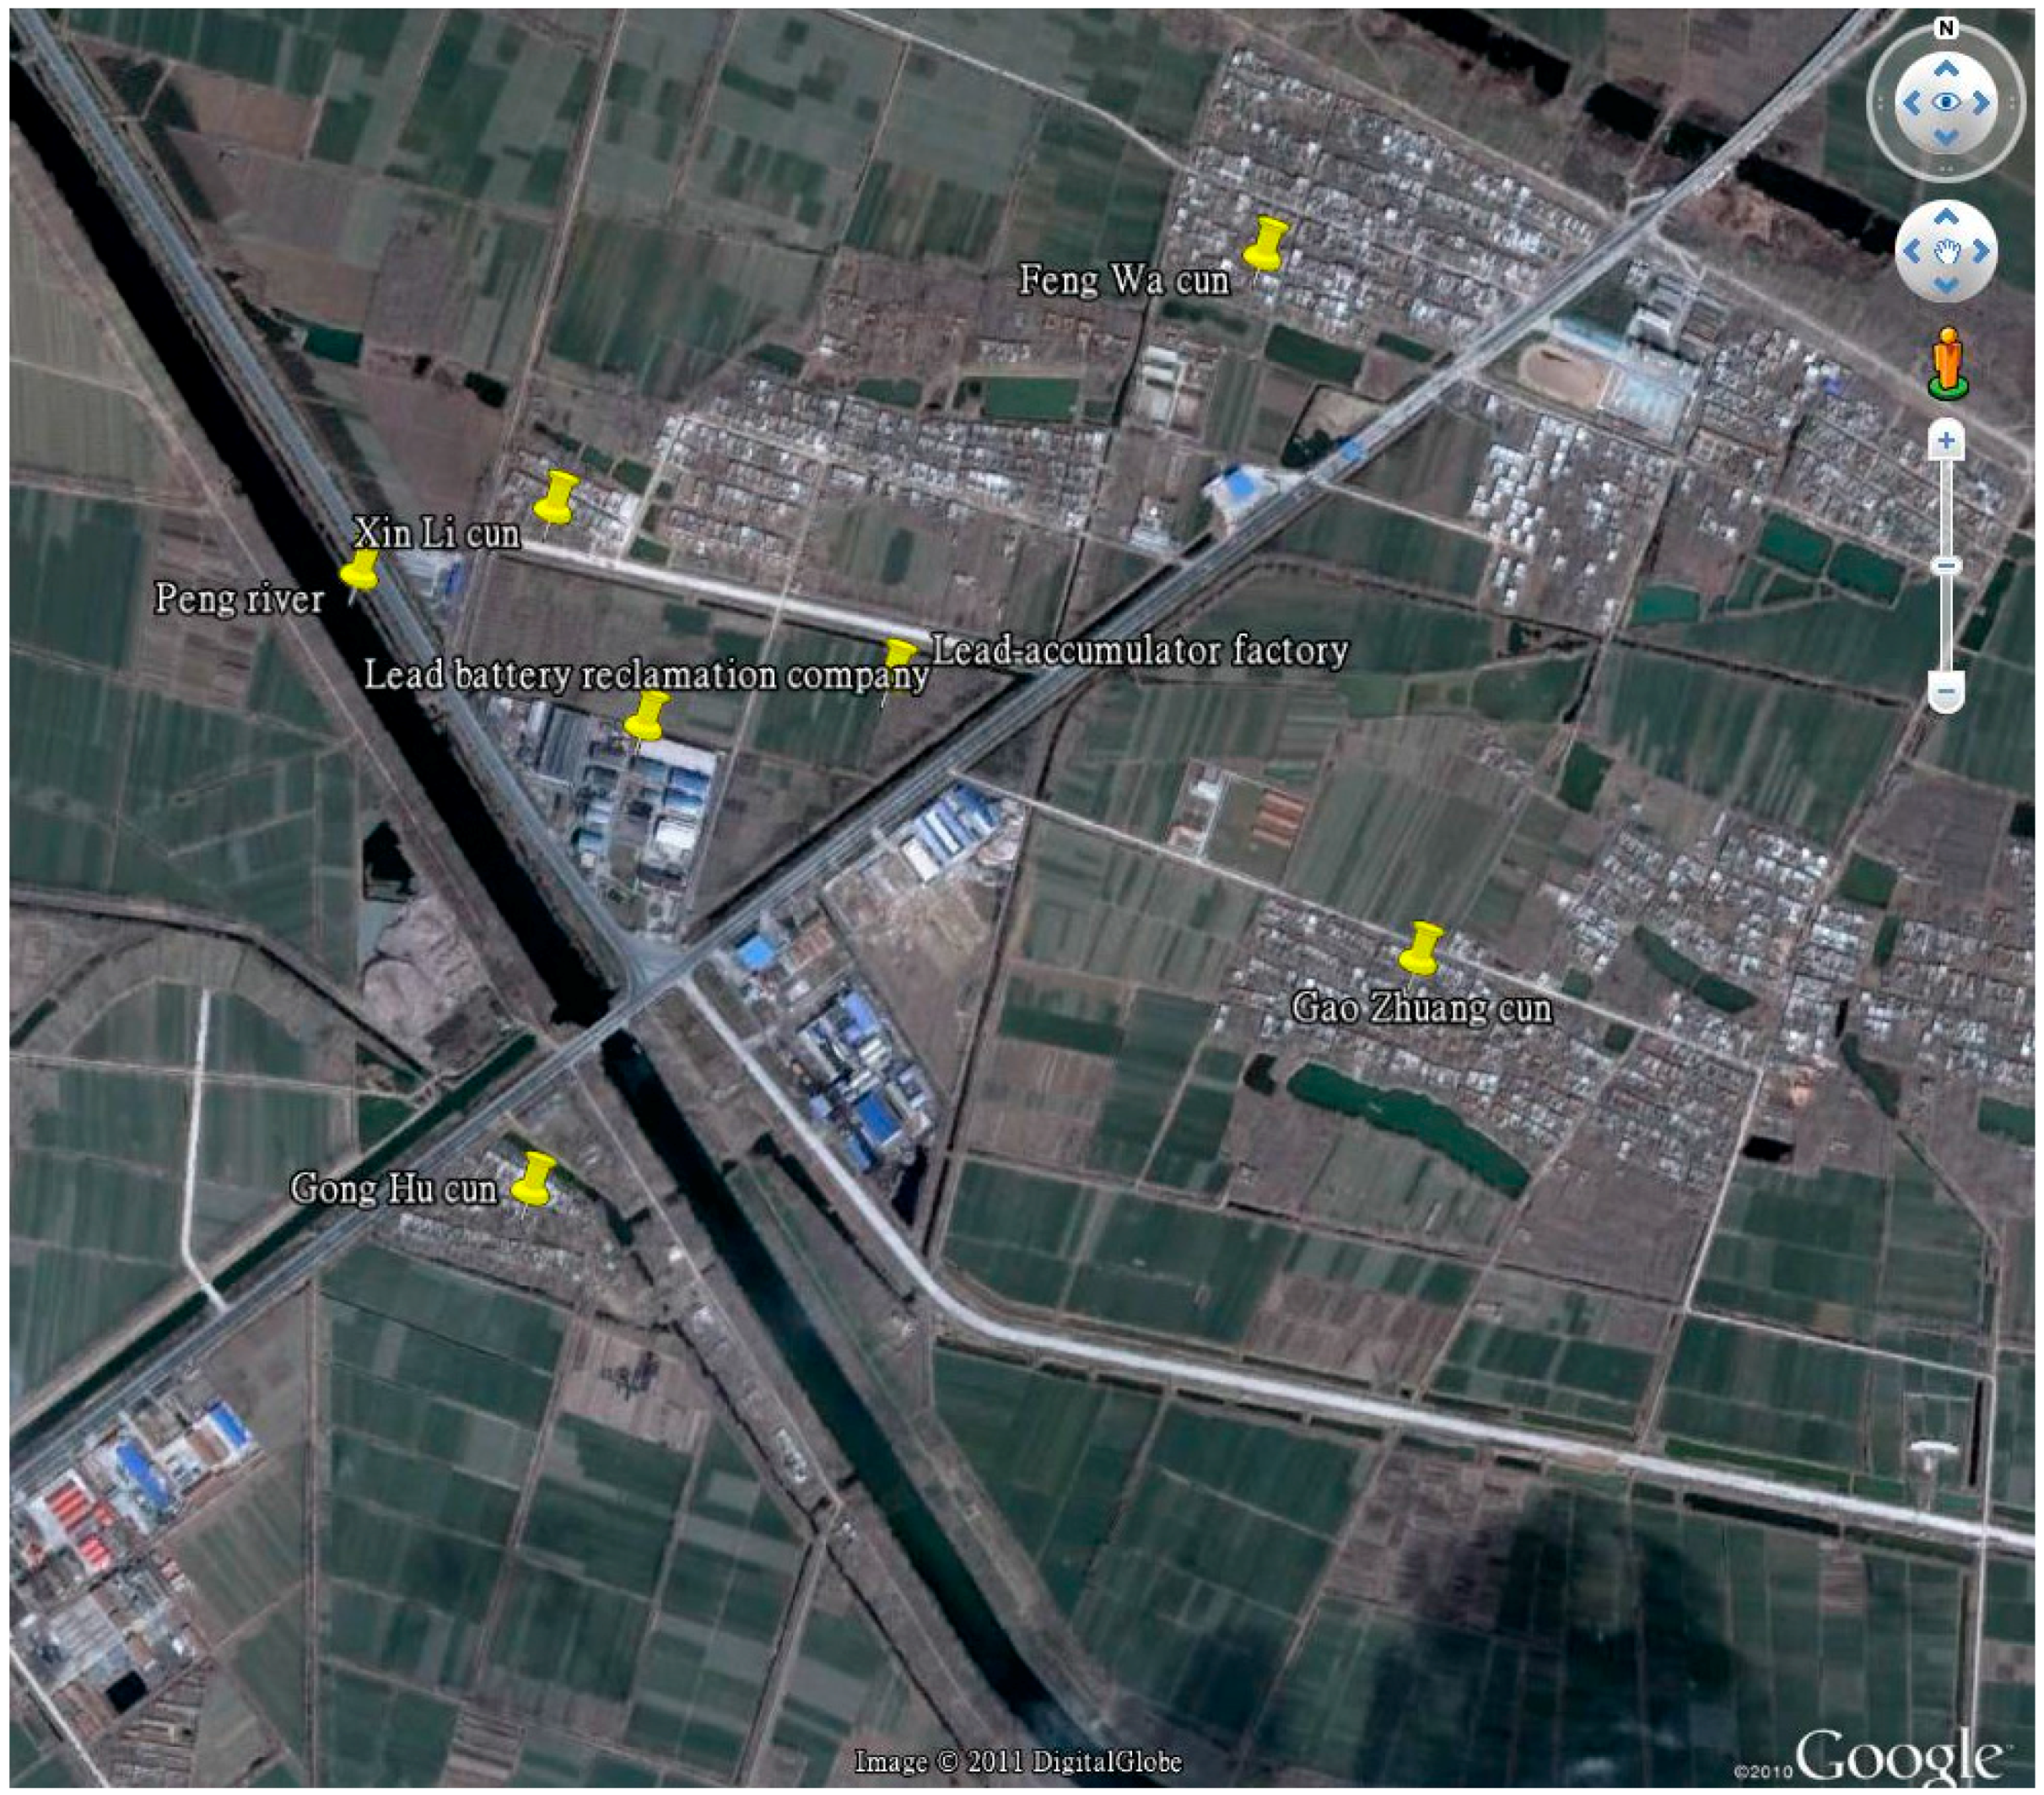
2.1. Sample Collection
2.2. Analysis of Samples
2.2.1. Lead in Blood
2.2.2. Lead in Vegetables
2.2.3. Lead in Soil
2.2.4. Lead in Water
2.3. Statistical Analysis
3. Results
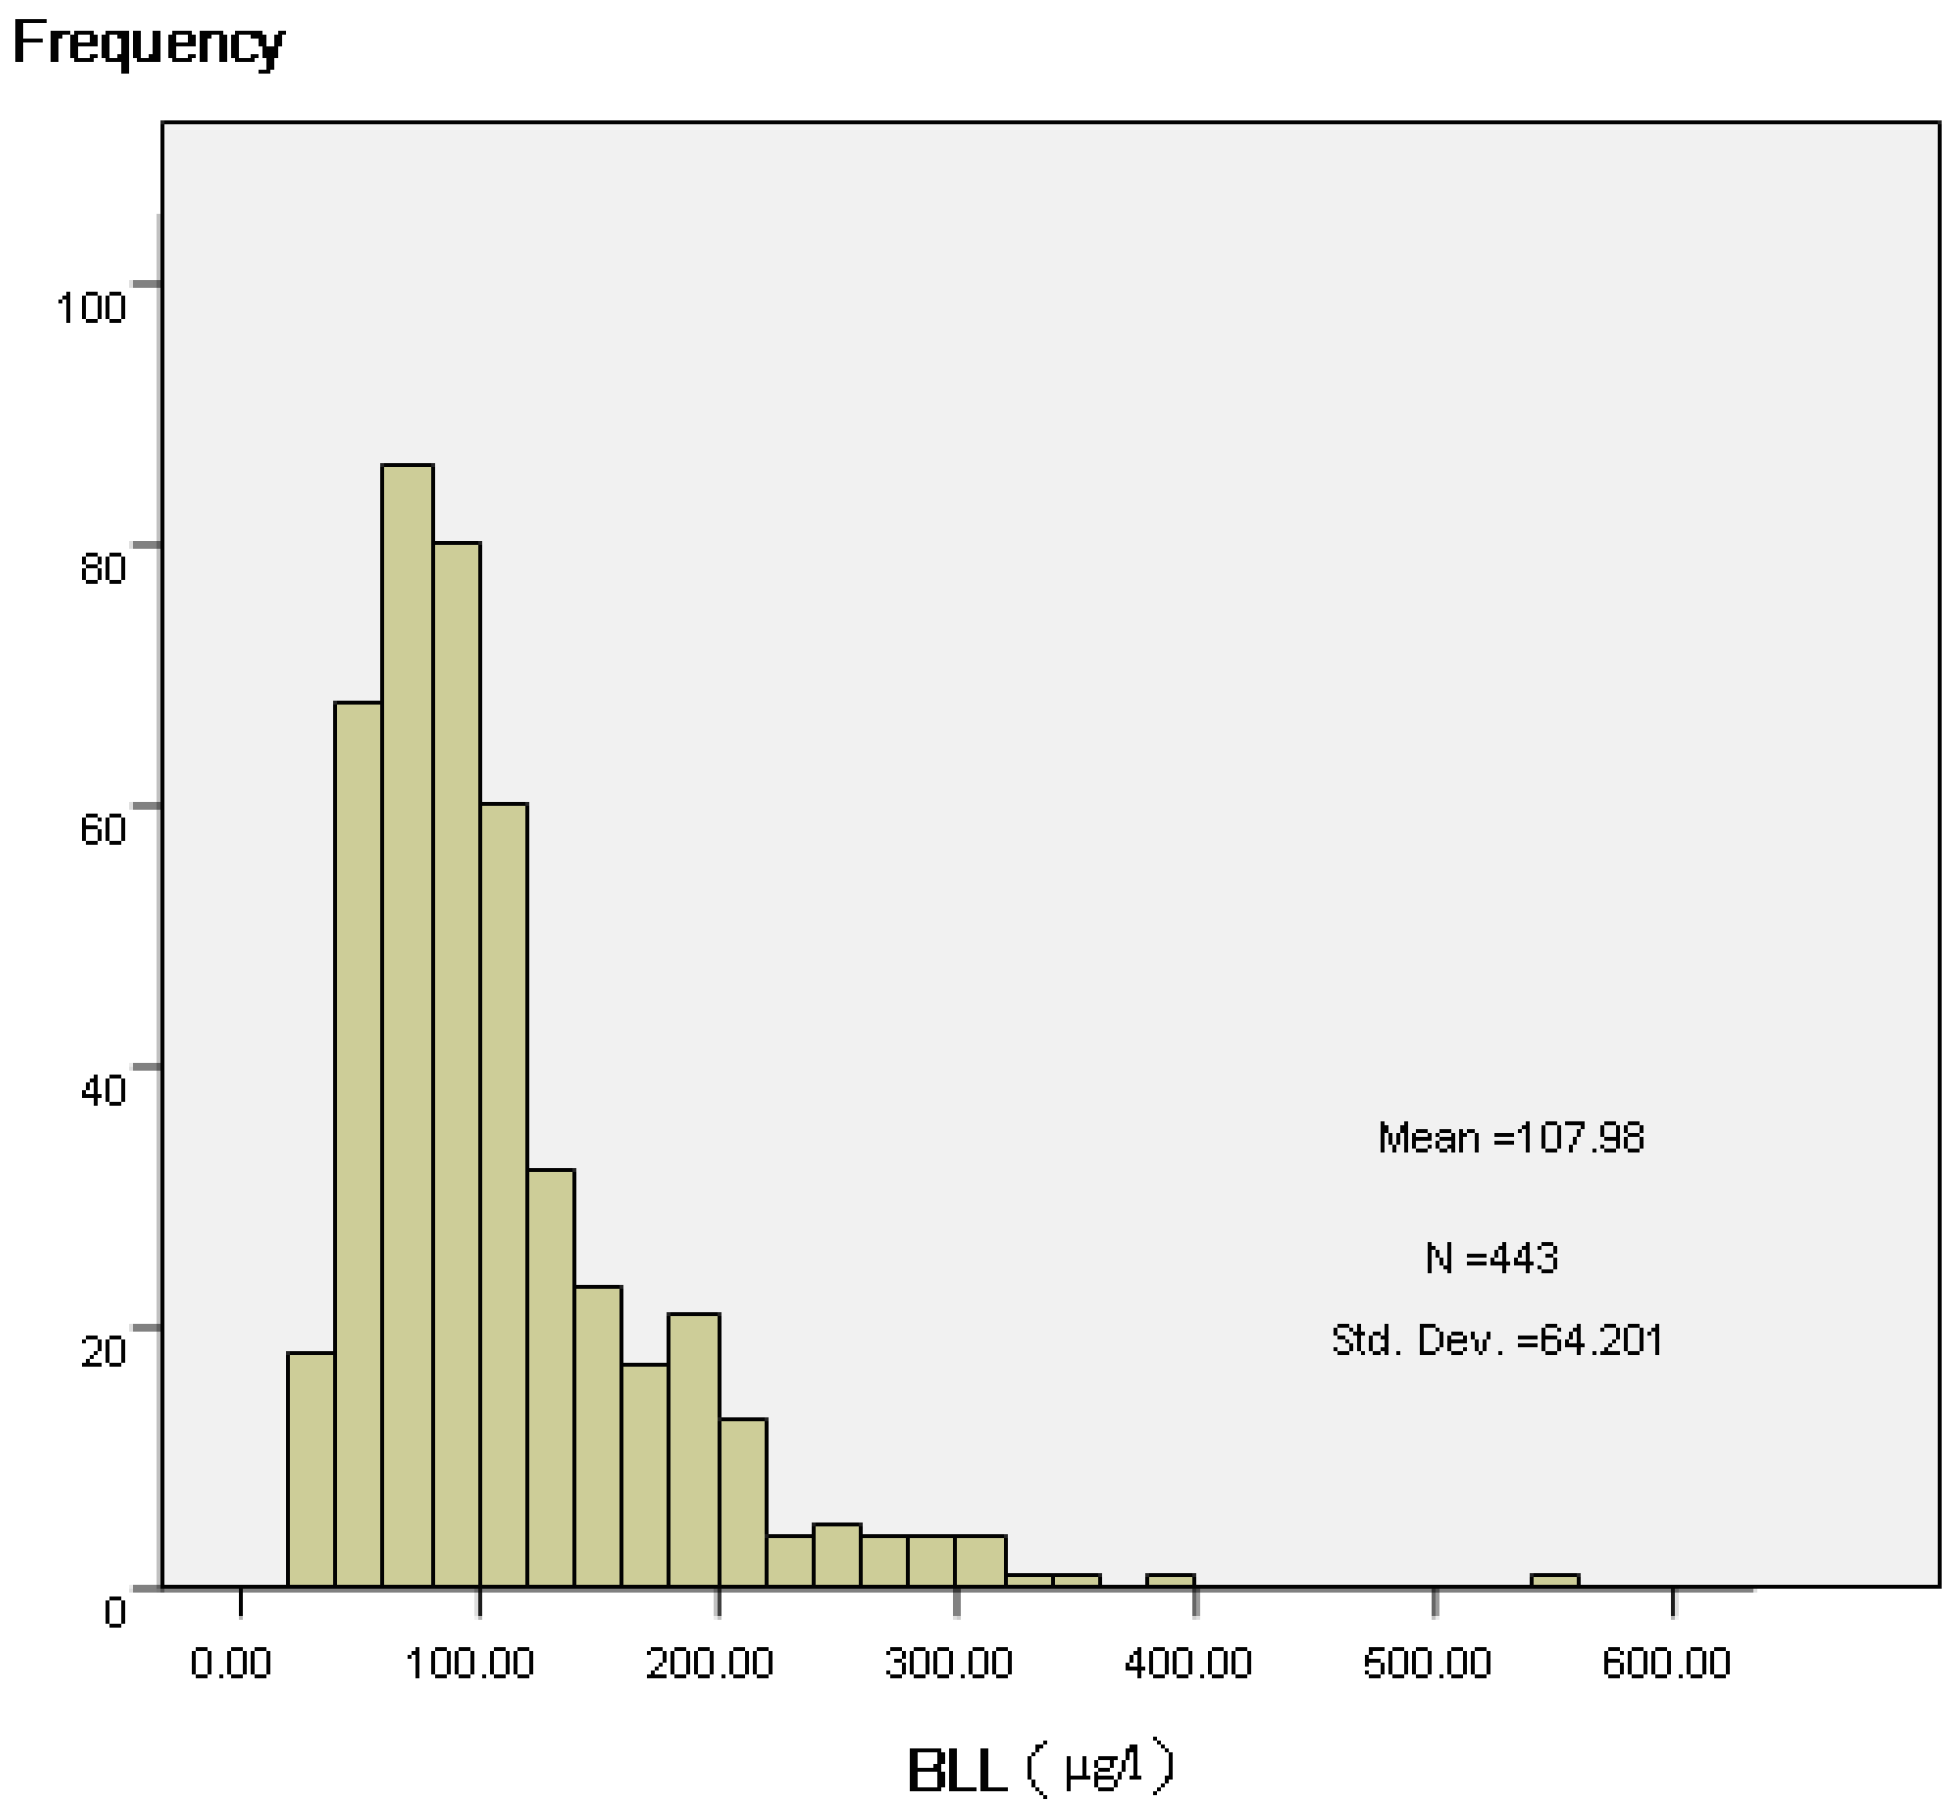
3.1. Blood Lead
3.2. Lead in the Environment and Vegetable
4. Discussion
5. Conclusions
Acknowledgments
Author Contributions
Conflicts of Interest
References
- Chen, A.; Cai, B.; Dietrich, K.N.; Radcliffe, J.; Rogan, W.J. Lead exposure, IQ, and behavior in urban 5- to 7-year olds: Does lead affect behavior only by lowering IQ? Pediatrics 2007, 119, 650–658. [Google Scholar] [CrossRef] [PubMed]
- Miranda, M.L.; Kim, D.; Galeano, M.A.; Paul, C.J.; Hull, A.P.; Morgan, S.P. The relationship between early childhood blood lead levels and performance on end of grade tests. Environ. Health Perspect. 2007, 115, 1242–1247. [Google Scholar] [CrossRef] [PubMed]
- Nevin, R. Understanding international crime trends: The legacy of preschool lead exposure. Environ. Res. 2007, 104, 315–316. [Google Scholar] [CrossRef] [PubMed]
- Baranowska-Bosiacka, I.; Dziedziejko, V.; Safranow, K.; Gutowska, I.; Marchlewicz, M.; Dołegowska, B.; Rać, M.E.; Wiszniewska, B.; Chlubek, D. Inhibition of erythrocyte phosphori- bosyltransferases (APRT and HPRT) by Pb2+: A potential mechanism of lead toxicity. Toxicology 2009, 259, 77–83. [Google Scholar] [CrossRef] [PubMed]
- Guilarte, T.R.; Toscano, C.D.; McGlothan, J.L.; Weaver, S.A. Environmental enrichment reverses cognitive and molecular deficits induced by developmental lead exposure. Ann. Neurol. 2003, 53, 50–56. [Google Scholar] [CrossRef] [PubMed]
- Surkan, P.J.; Schnaas, L.; Wright, R.J.; Téllez-Rojo, M.M.; Lamadrid-Figueroa, H.; Hu, H.; Hernández-Avila, M.; Bellinger, D.C.; Schwartz, J.; Perroni, E.; et al. Maternal self-esteem, exposure to lead, and child neurodevelopment. Neurotoxicology 2008, 29, 278–285. [Google Scholar] [CrossRef] [PubMed]
- Cecil, K.M.; Brubaker, C.J.; Adler, C.M. Decreased brain volume in adults with childhood lead exposure. PLoS Med. 2008, 5, e112. [Google Scholar] [CrossRef] [PubMed]
- Rabito, F.A.; Iqbal, S.; Shorter, C.F.; Osman, P.; Philips, P.E.; Langlois, E.; White, L.E. The association between demolition activity and children’s blood lead levels. Environ. Res. 2007, 103, 345–351. [Google Scholar] [CrossRef] [PubMed]
- Lalor, G.C.; Vutchkov, M.K.; Bryan, S.T.; Christie, C.D.; Donaldson, D.; Young, J.; Chambers, S. Acute Lead Poisoning Associated with Backyard Lead Smelting in Jamaica. West Indian Med. J. 2006, 55, 394–398. [Google Scholar] [CrossRef] [PubMed]
- Nevin, R. Trends in preschool lead exposure, mental retardation, and scholastic achievement: Association or causation? Environ. Res. 2009, 109, 301–310. [Google Scholar] [CrossRef] [PubMed] [Green Version]
- ATSDR. Toxicological Profile for Lead; US Department of Health and Human Services, Public Health Service: Atlanta, GA, USA, 2007.
- CDC. USA Center for Disease Control and Prevention on New Blood Lead Level Information. Available online: http://www.cdc.gov/nceh/lead/ (accessed on 16 December 2015).
- Tan, Z.W.; Dai, Y.H.; Xie, X.H. Blood lead status and influencing factors among preschooI children in urban areas of China. Chin. J. Pediatr. 2011, 49, 294–300. [Google Scholar]
- Casteel, S.W.; Cowart, R.P.; Weis, C.P.; Henningsen, G.M.; Hoffman, E.; Brattin, W.J.; Guzman, R.E.; Starost, M.F.; Payne, J.T.; Stockham, S.L.; et al. Bioavailability of lead to juvenile swine dosed with soil from the Smuggler Mountain NPL Site of Aspen, Colorado. Fundam. Appl. Toxicol. 1997, 36, 177–187. [Google Scholar] [CrossRef] [PubMed]
- Google Earth Map on Line Share. Available online: http://www.earthol.com/ (accessed on 12 January 2013).
- Wierzbicka, M.H.; Przedpelska, E.; Ruzik, R. Comparison of the toxicity and distribution of cadmium and lead in plant cells. Protoplasma 2007, 231, 99–111. [Google Scholar] [CrossRef] [PubMed]
- Wilson, I.H.; Wilson, S.B. Confounding and causation in the epidemiology of lead. Int. J. Environ. Res. Public Health 2016, 1–16. [Google Scholar] [CrossRef] [PubMed]
- Gottesfeld, P.; Pokhrel, A.K. Review: Lead Exposure in Battery Manufacturing and Recycling in Developing Countries and Among Children in Nearby Communities. J. Occup. Environ. Hyg. 2011, 8, 520–532. [Google Scholar] [CrossRef] [PubMed]
- Du, F.R.; Cao, J.Y. Investigation of environment pollution and child blood level in area of reclaiming smelting. Chin. J. School Health 2009, 30, 169–170. [Google Scholar]
- Zhao, J.L.; Feng, Y.Y.; Gao, C.L. Investigation of child blood lead level in mining area. Chin. J. Child Health Care 2009, 17, 223–225. [Google Scholar]
- Wang, Q.; Wang, J. Investigation on lead level in blood of 2141 preschool children. Mater. Child Health Care China 2009, 24, 1389–1392. [Google Scholar]
- Chiaradia, M.; Gulson, B.L.; MacDonald, K. Contamination of houses by occupationally-exposed workers from a lead-zinc-copper mine and impact on blood leads in the families. Occup. Environ. Med. 1997, 54, 117–124. [Google Scholar] [CrossRef] [PubMed]
- Gulson, B.L.; Mizon, K.J.; Korsch, M.J.; Howarth, D. Importance of monitoring family members in establishing sources and pathways of lead in blood. Sci. Total Environ. 1996, 188, 173–182. [Google Scholar] [CrossRef]
- Kaiser, R.; Henderson, A.K.; Daley, W.R.; Naughton, M.; Khan, M.H.; Rahman, M.; Kieszak, S.; Rubin, C.H. Blood lead levels of primary school children in Dhaka, Bangladesh. Environ. Health Perspect. 2001, 109, 563–566. [Google Scholar] [CrossRef] [PubMed]
- Neesanan, N.; Kasemsup, R.; Ratanachuaeg, S.; Kojaranjit, P.; Sakulnoom, K.; Padungtod, C. Preliminary study on assessment of lead exposure in Thai children aged between 3–7 years old who live in Umphang District, Tak Province. J. Med. Assoc. Thail. 2011, 94, 113–120. [Google Scholar]
- Nichani, V.; Li, W.I.; Smith, M.A.; Noonan, G.; Kulkarni, M.; Kodavor, M.; Naeher, L.P. Blood lead levels in children after phase- out of leaded gasoline in Bombay, India. Sci. Total Environ. 2006, 363, 95–106. [Google Scholar] [CrossRef] [PubMed]
- Van Alphen, M. Atmospheric heavy metal deposition plumes adjacent to a primary lead-zinc smelter. Sci. Total Environ. 1999, 36, 119–134. [Google Scholar] [CrossRef]
- Zahran, S.; Mielke, H.W.; Weiler, S.; Gonzales, C.R. Nonlinear associations between blood lead in children, age of child, and quantity of soil lead in metropolitan New Orleans. Sci. Total Environ. 2011, 409, 1211–1218. [Google Scholar] [CrossRef] [PubMed]
- Cao, S.; Duan, X.; Zhao, X.; Wang, B.; Ma, J.; Fan, D.; Sun, C.; He, B.; Wei, F.; Jiang, G. Isotopic ratio based source apportionment of children’s blood lead around coking plant area. Environ. Int. 2014, 73, 158–166. [Google Scholar] [CrossRef] [PubMed]
- Olivero-Verbel, J.; Duarte, D.; Echenique, M.; Guette, J.; Johnson-Restrepo, B.; Parsons, P.J. Blood lead levels in children aged 5–9 years living in Cartagena, Colombia. Sci. Total Environ. 2007, 372, 707–716. [Google Scholar] [CrossRef] [PubMed]
- Freitas, C.; Simonetti, M.; Silva, M.; Sakuma, A.; Duran, M.C.; Carvalho, M.F.; Tiglea, P.; De Capitani, E.M.; Buschinelli, T.; Braga, A. Epidemiological investigation of children exposed to lead in the city of Bauru, Sao Paulo-Brazil. Epidemiology 2003, 14, s65. [Google Scholar] [CrossRef]
- Pérez-Bravo, F.; Ruz, M.; Morán-Jiménez, M.J.; Olivares, M.; Rebolledo, A.; Codoceo, J.; Sepúlveda, V.; Jenkin, A.; Santos, J.L.; Fontanellas, A. Association between aminolevulinate dehydrase genotypes and blood lead levels in children from a leadcontaminated area in Antofagasta, Chile. Arch. Environ. Contam. Toxicol. 2004, 47, 276–280. [Google Scholar] [CrossRef] [PubMed]
- Cousillas, A.Z.; Mañay, N.; Pereira, L.; Alvarez, C.; Coppes, Z. Evaluation of lead exposure in Uruguayan children. Bull. Environ. Contam. Toxicol. 2005, 75, 629–636. [Google Scholar] [CrossRef] [PubMed]
- Nicolescu, R.; Petcu, C.; Cordeanu, A.; Fabritius, K.; Schlumpf, M.; Krebs, R.; Krämer, U.; Winneke, G. Environmental exposure to lead, but not other neurotoxic metals, relates to core elements of ADHD in Romanian children: Performance and questionnaire data. Environ. Res. 2010, 110, 476–483. [Google Scholar] [CrossRef] [PubMed]
- Schulz, C.; Angerer, J.; Ewers, U.; Heudorf, U.; Wilhelm, M.; Human Biomonitoring Commission of the German Federal Environment Agency. Revised and new reference values for environmental pollutants in urine or blood of children in Germany derived from the German Environmental Survey on Children 2003–2006. Int. J. Hyg. Environ. Health 2009, 212, 637–647. [Google Scholar] [CrossRef] [PubMed]
- Gulson, B.; Mizon, K.; Taylor, A.; Korsch, M.; Davis, J.M.; Louie, H.; Wu, M.; Gomez, L.; Antin, L. Pathways of Pb and Mn observed in a 5-year longitudinal investigation in young children and environmental measures from an urban setting. Environ. Pollut. 2014, 191, 38–49. [Google Scholar] [CrossRef] [PubMed]


| Name of RM | Certified | Measured |
|---|---|---|
| Lead in ox blood | ||
| Level I (μg/L) | 96 ± 8 | 94.52 ± 3.57 μg/L (n = 82) |
| Level II (μg/L) | 189 ± 10 | 185 ± 4.79 μg/L (n = 82) |
| Lead in vegetable (laver) ug/g | 0.81 ± 0.03 | 0.79 ± 0.04 ug/g (n = 16) |
| Lead in soil (mg/kg) | 47.4 ± 3.5 | 46.92 ± 2.18 mg/kg (n = 16) |
| Lead in water (ug/mL) | 2.0 ± 0.12 | 1.98 ± 0.09 ug/ML (n = 8) |
| Matrix | LOD | Level | Measured | Recovery (%) | RSD% |
|---|---|---|---|---|---|
| Blood (μg/L) | 0.45 | 5 | 4.87 ± 0.42 (n = 54) | 97.4 | 4.5 |
| 50 | 49.17 ± 1.58 (n = 54) | 98.3 | 3.2 | ||
| 150 | 151.09 ± 10.21 (n = 54) | 100.7 | 6.8 | ||
| Vegetable (laver) (μg/kg) | 5.0 | 50 | 48.26 ± 2.13 (n = 12) | 96.5 | 4.4 |
| 200 | 197.84 ± 10.94 (n = 12) | 98.9 | 5.5 | ||
| 500 | 503.21 ± 19.01 (n = 12) | 100.6 | 3.8 | ||
| Soil (μg/kg) | 5 | 50 | 49.05 ± 2.97 (n = 12) | 98.1 | 6.1 |
| 200 | 198.28 ± 8.75 (n = 12) | 99.1 | 4.4 | ||
| 500 | 495.87 ± 23.22 (n = 12) | 99.2 | 4.7 | ||
| Water (μg/L) | 2.5 | 20 | 19.41 ± 1.06 (n = 12) | 97.0 | 5.4 |
| 100 | 98.76 ± 3.05 (n = 12) | 98.8 | 3.1 | ||
| 500 | 496.28 ± 14.79 (n = 12) | 99.3 | 3.0 |
| No. | Range of Lead Concentration (μg/L) | Median (μg/L) | Percentile (μg/L) | BLL > 100 μg/L Number and Percent (%) | |||||
|---|---|---|---|---|---|---|---|---|---|
| 5th | 25th | 50th | 75th | 95th | |||||
| Age of subjects | |||||||||
| 0–1 | 37 | 34–556 | 92 | 36 | 50 | 92 | 128 | 334 | 18 (48.65) |
| 1–4 | 119 | 33–394 | 111 * | 49 | 78 | 111 | 165 | 292 | 69 (57.98) |
| 4–7 | 107 | 38–315 | 88 | 47 | 65 | 88 | 134 | 252 | 42 (39.25) |
| 7–10 | 91 | 36–221 | 80 | 38 | 59 | 78 | 106 | 155 | 26 (28.57) |
| 10–15 | 89 | 26–224 | 82 | 36 | 56 | 84 | 112 | 205 | 36 (40.45) |
| Gender | |||||||||
| male | 260 | 33–394 | 100 | 43 | 68 | 100 | 145 | 234 | 132 (50.77) |
| female | 183 | 26–556 | 81 ** | 38 | 59 | 81 | 110 | 238 | 59 (32.24) |
| Distance (m) | |||||||||
| 0–250 | 60 | 36–556 | 151 | 53 | 89 | 151 | 209 | 325 | 43 (71.67) |
| 250–500 | 165 | 34–394 | 106 ** | 44 | 80 | 106 | 144 | 223 | 89 (53.94) |
| 500–800 | 48 | 37–284 | 81 ** | 40 | 54 | 81 | 102 | 194 | 14 (29.17) |
| 800–1000 | 170 | 26–297 | 73 ** | 39 | 56 | 73 | 98 | 148 | 45 (26.47) |
| Direction † | |||||||||
| Northwest (NW) | 176 | 36–556 | 116 | 53 | 57 | 121 | 182 | 298 | 110 (62.5) |
| Southwest (SW) | 86 | 34–202 | 82 ** | 38 | 63 | 79 | 106 | 180 | 25 (29.07) |
| Northeast (NE) | 92 | 26–279 | 72 ** | 36 | 55 | 71 | 96 | 127 | 20 (21.74) |
| Southeast (SE) | 89 | 37–246 | 82 ** | 43 | 83 | 88 | 129 | 173 | 36 (40.45) |
| Job of parents | |||||||||
| In the recycling plant | 140 | 34–556 | 101 | 43 | 77 | 101 | 148 | 251 | 72 (51.43) |
| None in the recycling plant | 303 | 26–294 | 84 ** | 42 | 62 | 84 | 118 | 224 | 119 (39.27) |
| Total | 443 | 24–556 | 89 | 42 | 64 | 89 | 133 | 232 | 191 (43.12) |
| Variable | Parameter Normal Model (r2 = 0.50) | ||
|---|---|---|---|
| β | t-Value | p-Value | |
| Age | −0.036 | −5.0427 | 0.000 |
| Distance | −0.052 | −5.2072 | 0.000 |
| Direction | 0.010 | 0.7078 | 0.479 |
| Parents’ job | 0.060 | 2.9332 | 0.004 |
| Sex | −0.043 | −2.2574 | 0.024 |
| Water Samples | Number | Lead Range | Median | Number and Excess Ratio (%) † |
|---|---|---|---|---|
| Kind | ||||
| well | 4 | <1–5 | 45 | 0(0.00) |
| canal | 12 | <1–77 | 7 | 1(8.33) |
| Direction | ||||
| Northeast | 4 | 17–77 | 23 | 1(25.00) |
| Southeast | 3 | 1–5 | 2 | 0(0.00) |
| Southwest | 5 | <1–5 | 1 | 0.00 |
| Northwest | 4 | 4–12 | 15 | 0.00 |
| Distance (m) | ||||
| ≤250 | 4 | 12–77 | 23 | 1(25.00) |
| ~500 | 4 | 4–17 | 11 | 0(0.00) |
| ~800 | 4 | 1–5 | 4 | 0(0.00) |
| ~1000 | 4 | <1–1 | 1 | 0(0.00) |
| Total | 16 | <1–77 | 7 | 1(6.25) |
| Vegetable Samples | Number | Lead Range | Median | Number and Excess Ratio (%) † |
|---|---|---|---|---|
| Direction | ||||
| Northeast | 9 | 0.006–1.075 | 0.051 | 3(33.33) |
| Southeast | 10 | 0.049–3.079 | 0.285 | 4(40.00) |
| Southwest | 8 | 0.007–1.475 | 0.172 | 3(37.5) |
| Northwest | 9 | 0.071–4.676 | 1.049 | 6(66.67) |
| Distance (m) | ||||
| ≤250 | 12 | 0.045–4.676 | 1.352 | 10(83.33) |
| ~500 | 8 | 0.009–1.056 | 0.451 | 5(62.50) |
| ~800 | 8 | 0.008–0.425 | 0.119 | 1(12.50) |
| ~1000 | 8 | 0.006–0.147 | 0.052 | 0(0.00) |
| Total | 36 | 0.006–4.676 | 0.265 | 16(44.44) |
| Soil Samples | Number | Lead Range | Median | Exceedance and Ratio † |
|---|---|---|---|---|
| Kind | ||||
| Surface | 25 | 10.07–424.73 | 101.69 | 2(8.00) |
| Subsurface | 8 | 13.60–113.64 | 52.92 | 0(0.00) |
| Direction | ||||
| Northeast | 9 | 14.38–121.60 | 57.85 | 0(0.00) |
| Southeast | 7 | 13.60–121.45 | 46.17 | 0(0.00) |
| Southwest | 8 | 29.07–182.81 | 79.52 | 0(0.00) |
| Northwest | 9 | 59.67–424.73 | 120.08 | 2(22.22) |
| Distance (m) | ||||
| ≤250 | 11 | 113.64–424.73 | 121.60 | 2(18.18) |
| ~500 | 8 | 13.61–282.81 | 74.33 | 0(0.00) |
| ~800 | 8 | 25.60–101.69 | 63.16 | 0(0.00) |
| ~1000 | 6 | 10.07–41.06 | 27.47 | 0(0.00) |
| Total | 33 | 10.07–424.73 | 87.96 | 2(6.06) |
| Reference | Country | Age of Subject | Dwell Environment | Study Year | No. | Mean (μg/L) |
|---|---|---|---|---|---|---|
| [9] | Jamaica | 2−12years | Lead Smelting | - | 107 | 251 |
| [16] | America | <12 years | smelter communities | 2002 | 169 | 16 |
| 1980 | 196 | 236 | ||||
| [26] | India | 0−23months | Low socioeconomic | 2003–2004 | 178 | 72 (GM) |
| 24−47 months | 191 | 81 | ||||
| 48−71 months | 167 | 83 | ||||
| 72−95 months | 158 | 87 | ||||
| 96−119 months | 104 | 99 | ||||
| 120−143 months | 6 | 83 | ||||
| [30] | Colombia | 5−9 years | Lead fishing net sinker, metal melting | 2004 | 189 | 55 |
| [31] | Brazil | 0−12 years | Battery recycling | 2002 | 624 | 93 |
| [32] | Chile | 5−12 years | Lead storage facilities | 1998 | 93 | 164 |
| [33] | Uruguay | 0−14 years | Urban area | 2003 | 107 | 94 |
| [34] | Romania | 8−12 years | Near to battery factory | 2006 | 37 46 | 32 51 |
| [35] | German | Child | Normal | 2003–2006 | 35 | |
| [36] | Australian | 0.5~2 years | Normal | 2001~2002 | 156 | 27 (GM) |
| 2~3 years | 2002~2003 | 169 | 24 (GM) | |||
| 3~4 years | 2003~2004 | 133 | 20 (GM) | |||
| 4~5 years | 2004~2005 | 117 | 19 (GM) | |||
| 5~7 years | 2005~2006 | 134 | 17 (GM) |
© 2016 by the authors; licensee MDPI, Basel, Switzerland. This article is an open access article distributed under the terms and conditions of the Creative Commons Attribution (CC-BY) license (http://creativecommons.org/licenses/by/4.0/).
Share and Cite
Zhang, F.; Liu, Y.; Zhang, H.; Ban, Y.; Wang, J.; Liu, J.; Zhong, L.; Chen, X.; Zhu, B. Investigation and Evaluation of Children’s Blood Lead Levels around a Lead Battery Factory and Influencing Factors. Int. J. Environ. Res. Public Health 2016, 13, 541. https://doi.org/10.3390/ijerph13060541
Zhang F, Liu Y, Zhang H, Ban Y, Wang J, Liu J, Zhong L, Chen X, Zhu B. Investigation and Evaluation of Children’s Blood Lead Levels around a Lead Battery Factory and Influencing Factors. International Journal of Environmental Research and Public Health. 2016; 13(6):541. https://doi.org/10.3390/ijerph13060541
Chicago/Turabian StyleZhang, Feng, Yang Liu, Hengdong Zhang, Yonghong Ban, Jianfeng Wang, Jian Liu, Lixing Zhong, Xianwen Chen, and Baoli Zhu. 2016. "Investigation and Evaluation of Children’s Blood Lead Levels around a Lead Battery Factory and Influencing Factors" International Journal of Environmental Research and Public Health 13, no. 6: 541. https://doi.org/10.3390/ijerph13060541
APA StyleZhang, F., Liu, Y., Zhang, H., Ban, Y., Wang, J., Liu, J., Zhong, L., Chen, X., & Zhu, B. (2016). Investigation and Evaluation of Children’s Blood Lead Levels around a Lead Battery Factory and Influencing Factors. International Journal of Environmental Research and Public Health, 13(6), 541. https://doi.org/10.3390/ijerph13060541