Article

Change in Environmental Benefits of Urban Land Use and Its Drivers in Chinese Cities, 2000–2010

1
Institute of Land Resources and Urban-Rural Planning, School of Geographical Sciences, Guangzhou University, Guangzhou 510006, China
2
Department of Geography, National Taiwan University, 1, Roosevelt Road, Section 4, Taipei 106, Taiwan
3
Institute of Geography, University of Hamburg, Hamburg 20144, Germany
*
Author to whom correspondence should be addressed.
Int. J. Environ. Res. Public Health 2016, 13(6), 535; https://doi.org/10.3390/ijerph13060535
Submission received: 4 March 2016 / Accepted: 16 March 2016 / Published: 26 May 2016

Abstract

:
Driven by rising income and urban population growth, China has experienced rapid urban expansion since the 1980s. Urbanization can have positive effects on the urban environment; however, improvement of urban environment quality, especially its divergence between relatively developed and undeveloped cities in China, is currently a rather rudimentary and subjective issue. This study analyzed urban environmental benefits among China’s prefectural cities based on their structure of urban land use in 2000 and 2010. First, we divided 347 prefectural cities into two groups, 81 coastal and capital cities in the relatively developed group (RD) and 266 other prefectural cities in the undeveloped group (RP). Then, we defined three areas of urban environmental benefits, including green infrastructure, industrial upgrade, and environmental management, and developed an assessment index system. Results showed that all prefectural cities saw improvement in urban environmental quality in 2000–2010. Although the RD cities had higher income and more population growth, they had less improvement than the RP cities during the same period. We also found that demographic and urban land agglomeration among RD cities restrained green infrastructure expansion, making green infrastructure unsuitable as a permanent solution to environmental improvement. It is therefore urgent for China to promote balanced improvement among the three areas of urban environmental benefits and between the RD and RP cities through regional differentiation policies.

1. Introduction

China has experienced rapid urban transformation and expansion since the reform and open-door policy in 1978. It has been estimated that construction land (settlements, industrial/mining sites, and transportation) expanded from 27.2 × 10⁴ km2 in 1990 to 32.6 × 10⁴ km2 in 2006, a 20% increase [1]. Although the central government has implemented rigorous control on urban land expansion to cope with growing land scarcity [2,3], the expansion has continued unabatedly with an increase of 2.08 × 10⁴ km2 urban construction land in 2000–2010 [4]. Many studies have attributed urban land expansion in China to higher income and urban population growth [5,6,7,8,9,10,11]. These observations are supported by government statistics, which show that per capita disposable income of urban households increased by 12,830 yuan in 2000–2010 [12] and urban population in the cities increased by 127.81 million in the same period [13].
Rapid urban expansion in China has been linked to a number of environmental issues, such as farmland loss [14,15,16], soil sealing and pollution [17], air and water pollution [18,19,20], urban heat islands [21,22], and biodiversity loss [23]. More recently, urban environmental quality has become the focus of scientific research and the hot topic among the public in China. Examples include fine particulate (PM2.5) in China [18], increased flows of nitrogen and phosphorus in the food system of Beijing [20], and brownfields (sites polluted or potentially polluted by hazardous substances) in China’s major cities [17]. It is generally agreed that substantial socio-economic development and rapid urbanization in the past three decades in China were gained at the cost of environmental quality, both natural and urban. Thus, the central government has begun to pay close attention to searching for a win-win model for socio-economic development and environmental sustainability. Similar efforts have also been initiated by local governments, such as the low carbon eco-city program [24,25].
One aspect of urbanization in China that has not received much attention is its positive effects on the environment (environmental benefits hereafter). The limited literature on the topic has shown that urban land use at the city level can bring about environmental benefits, together with multiple other urban system services, to contribute to human well-being, especially in developing countries. The stage model of urban environmental evolution based on a comparative study in East Asia, e.g., Japan, South Korea, and China, shows urban environmental evolution from poverty, industrial pollution, mass consumption, to eco-city stage caused by rising income and urbanization [26]. A system dynamic simulation model of the drivers and environmental impacts of urban growth suggests an improvement of local environmental quality in Shenzhen, South China, as a result of increasing affluence and economic growth [27]. Thus, our working hypothesis in this study is that the urban environment could improve with rising income and urbanization.
Using the above working hypothesis, the main purpose of this study is to analyze urban environmental benefits among China’s prefectural cities based on their structure of urban land use in 2000 and 2010. Urban land use includes construction land, industrial land, parks, green space, and public infrastructure. We assume that the structure of urban land use changes over time as a response to increasing urban population and affluence, and these changes can in turn affect urban environmental quality. We further assume that the change in environmental benefits varies among cities as cities in China experience different rates of urban expansion and income growth. This second assumption is supported by a study, which reported urban expansion rate and intensity were significantly higher in the eastern region prior to 2000 but the trend reversed after 2000 [28]. The same study also justifies our selection of the study period 2000–2010, as it represents an important period of change in China’s urbanization.
One of the problems of analyzing the relationship between urbanization and the environment is the definition of environmental quality [29,30]. As pointed out by Nichol and Wong [31], environmental quality is an abstract concept resulting from both human and natural factors operating at different spatial scales. This is why studies have chosen different indicators to define the concept. For example, in their study of the relationship between urbanization and the environment in the Huai River Basin in China, Guo, Wang, Nijkamp, and Xu [32] first defined the quality of environment as consisting of the three functional groups of environmental endowment, environmental pressure, and environmental management, and then used a variety of indicators to measure each of the functional groups.
Based on a literature review, this study defines the environmental benefits of urban land use as the positive effects on the environment posed by urban land use activities, which consist of the following three areas. The first is environmental improvement through expansion of green infrastructure such as greenways, parks, and other conservation lands [23,33,34]. As urban residents grow in number and become wealthier, they are likely to ask for more green spaces, which have shown to provide a range of benefits such as increasing home sale price [35,36], improving urban quality of life and public health [37,38], and even helping cities to adapt to climate change [39].
The second is environmental improvement through conversion of manufacturing to service industry. As urban land expands as a result of population growth and rising income [9,40], land scarcity is bound to increase land prices and to encourage conversion of urban land from manufacturing to more valuable service industry [27,41,42]. This, in turn, can improve the environmental quality of a city through, for example, reduction of pollutants.
The third is environmental improvement through better environmental management [43,44]. Municipal solid waste management has become an important issue in China with rapid urbanization [45]. Safe waste disposal rates vary among regions, with more affluent cities in the coastal region having higher rates than the central region [46]. Meanwhile, urban residents expect to have access to water and sanitation services, which can improve with higher income [47] and environmental governance [48].
Urban land use as a link between the environment and urban residents plays a key role in environmental change in the cities. An in-depth understanding of the environmental benefits of urban land use is therefore important for achieving well-balanced and sustainable urban development in China. Although this study focuses on the environmental benefits of urban land use, it also provides an opportunity to look into problems hidden in China’s rapid urbanization, which deserve consideration in government policies.
Following the introduction, Section 2 describes the research method, including the study sites, assessment of environmental benefits of urban land use, and a weighted regression model to explore the driving factors for changes in environmental benefits. Section 3 presents the patterns and changes of environmental benefits of urban land use in 2000 and 2010 and the results of the regression analysis. Section 4 discusses the relationship between income, urban population, and environmental benefits and the implications of sustainable urban land use. The paper closes with a summary and recommendations for policy changes.

2. Materials and Methods

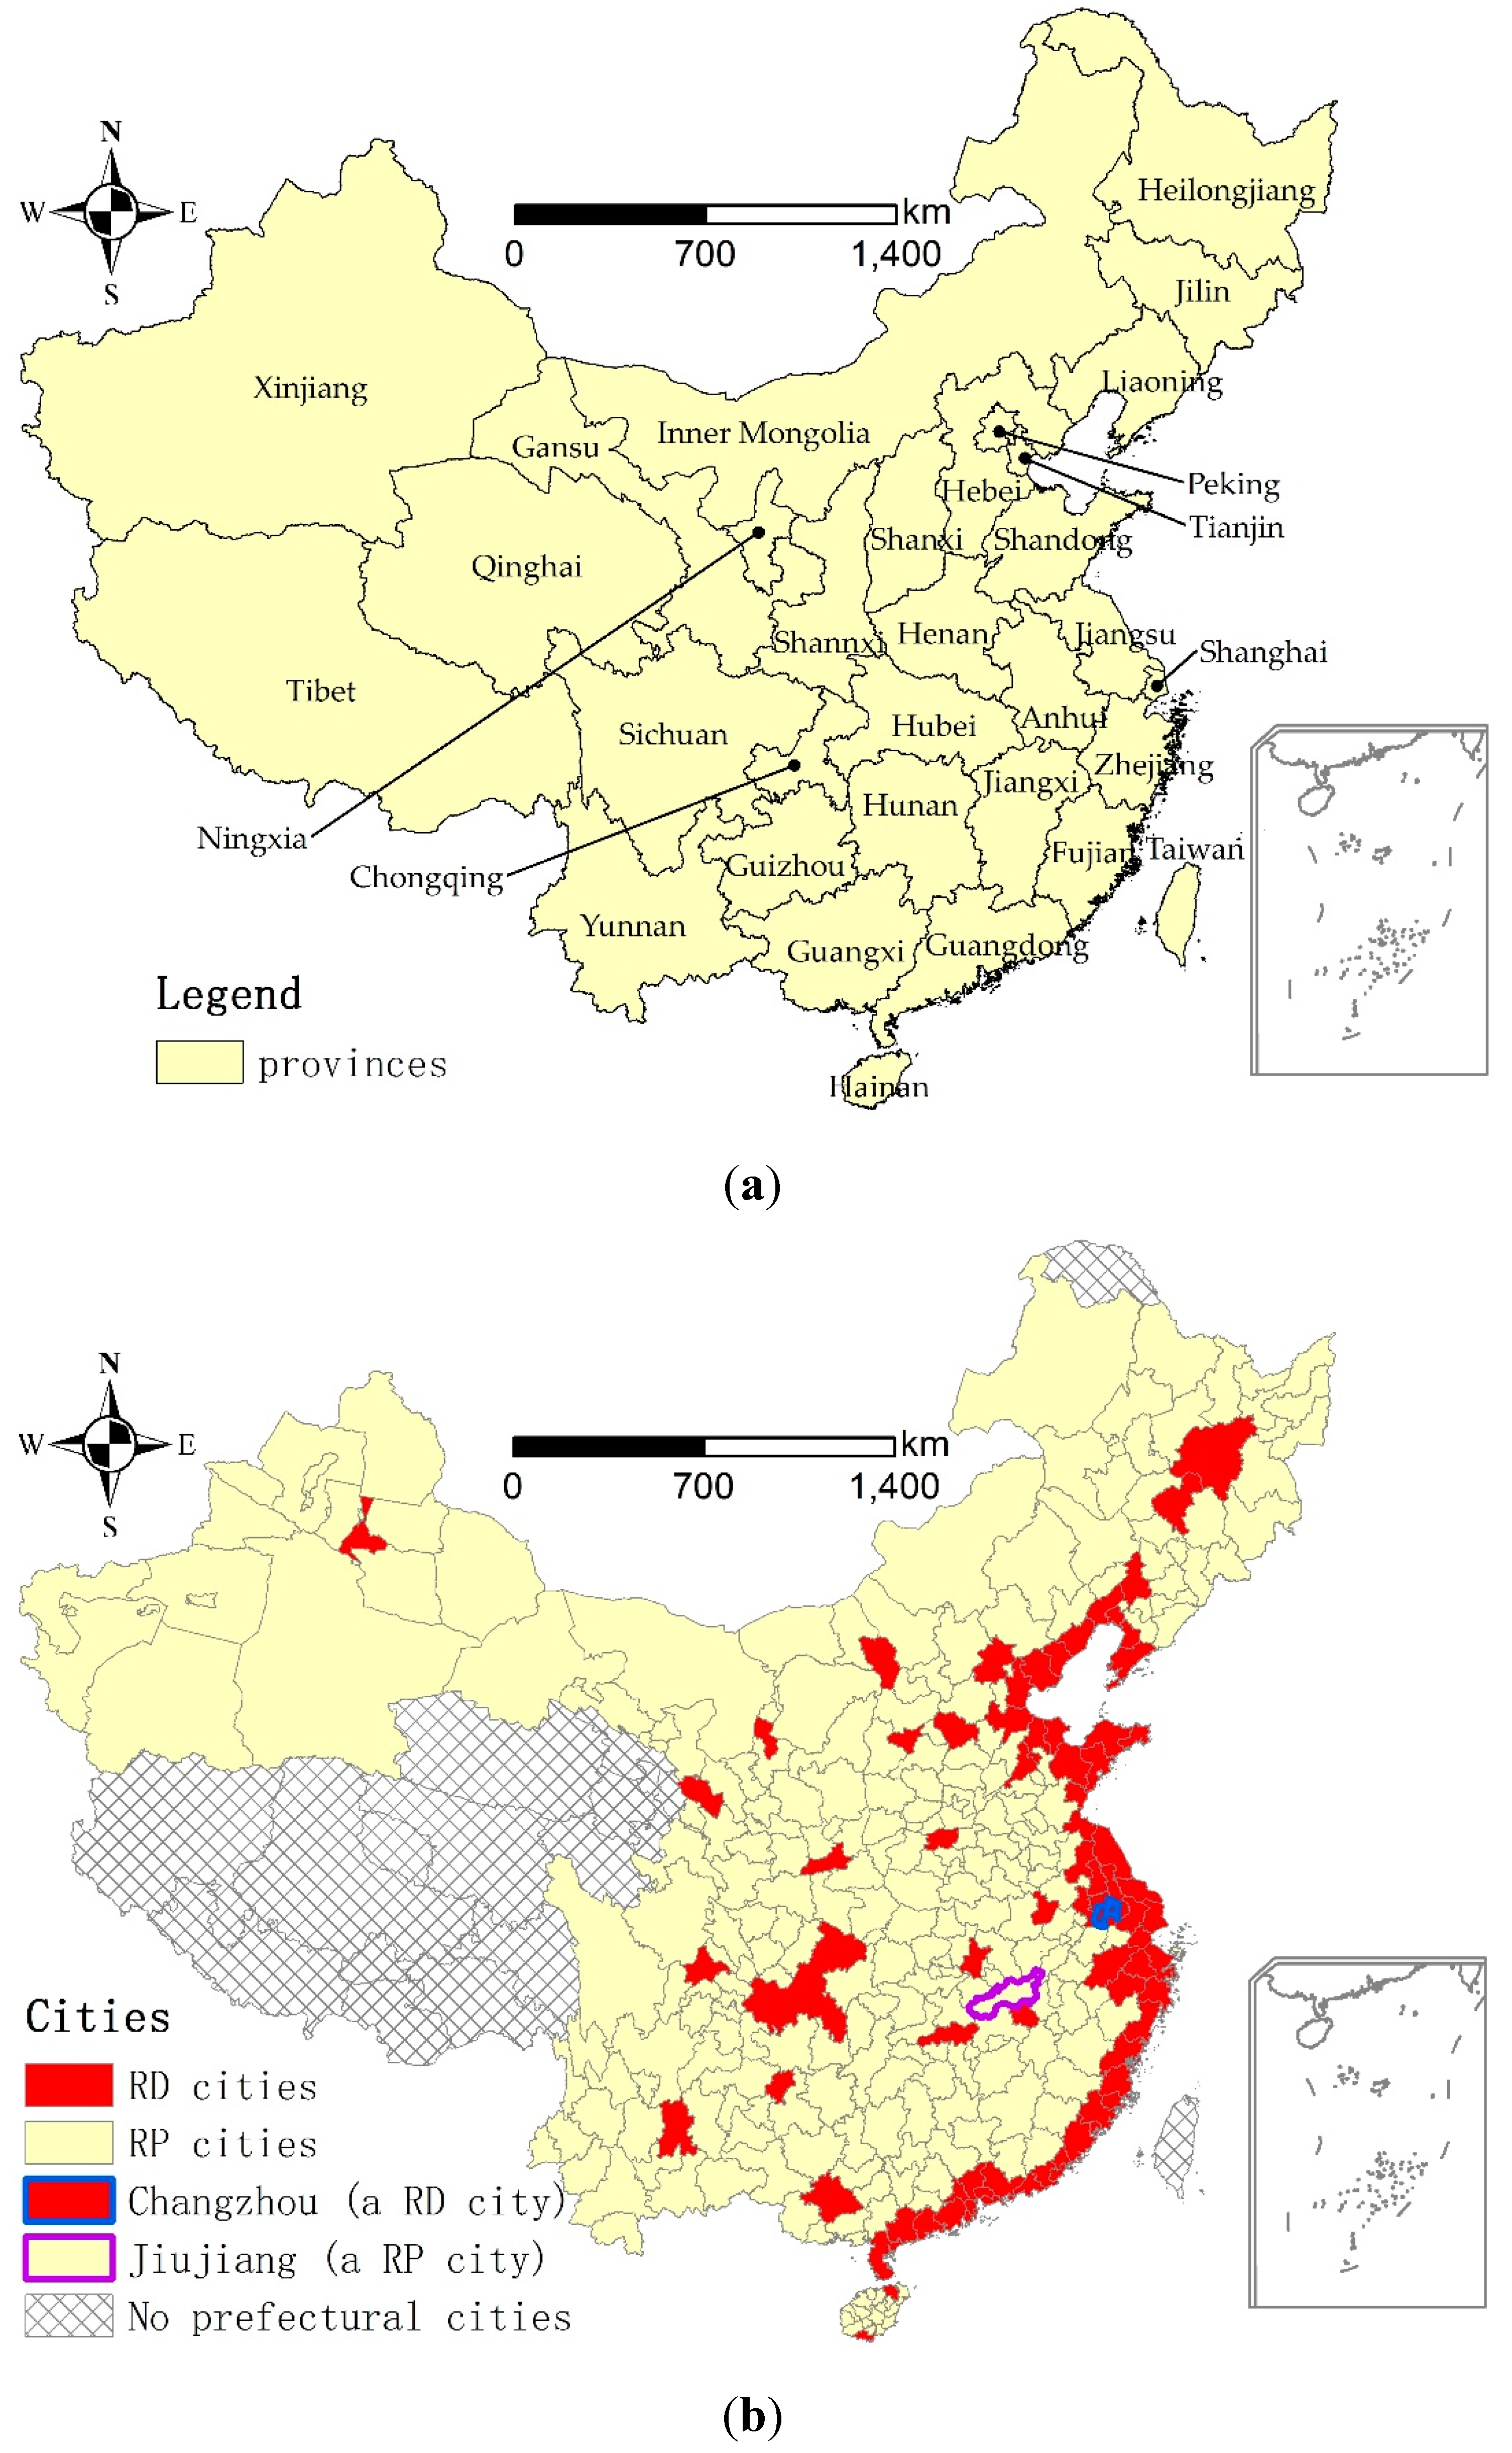
2.1. Prefectural Cities

A prefectural city is an administrative division, ranking below a province and above a county in China’s administrative structure. A prefectural city comprises urban and rural areas. This study only considered the urban areas, which are named cities or city districts. Similar to the regional disparity [8], urban expansion also varies among China’s prefectural cities. As shown in Figure 1, both urban population growth and construction land expansion in 2000–2010 were higher in the coastal cities and capital cities (provincial capitals and provincial-level municipalities of Beijing, Tianjin, Shanghai, and Chongquing) than other prefectural cities. Although per capita disposable income of urban households in all of the prefectural cities increased dramatically in 2000–2010, it was 21,377 yuan in coastal and capital cities and only 15,326 yuan in other prefectural cities in 2010 [49]. Considering the remarkable differences in urbanization and income growth, we grouped the 81 coastal and capital cities into relatively developed cities (RD cities) and the rest of the prefectural cities (266) into RP cities (Figure 2). This subdivision of prefectural cities provided the basis for subsequent data analysis on: (1) the spatial distribution of environmental benefits among the prefectural cities in 2000 and 2010; (2) the change of environmental benefits between the RD and RP cities in 2000–2010; and (3) the driving factors influencing the change of environmental benefits in 2000–2010.

2.2. Assessment of Environmental Benefits of Urban Land Use

As indicated previously, we expected environmental benefits of urban land use to derive from green infrastructure, industrial upgrade, and better environmental management. Based on a literature review, we selected specific indicators for these three areas of environmental benefits for subsequent data analysis.
Green infrastructure has been introduced as a planning tool for promoting human health and ecosystem services in the cities [50,51], which in turn are closely related to not just the amount but also the pattern of green infrastructure [52,53,54]. In this study, area of parks and green space per capita, density of parks and green space, and park size were selected to represent the total amount, the allocation, and the pattern of green infrastructure, respectively, in the cities [52,55,56,57,58,59].
Industrial upgrade can reduce pollutants in the cities such as industrial SO2 and industrial wastewater; therefore, SO2 emission and discharge and reuse of industrial waste water are important indicators for revealing the environmental dimension of sustainable urbanization [42,55,57,58,60]. Additionally, amount of SO2 per unit of urban area has been used for measuring urban environmental competitiveness [56]. In this study, we used the indicators of density of industrial land, density of industrial SO2 discharged, and rate of discharged industrial wastewater meeting national standard to measure the environmental benefits related to industrial upgrade.
To measure the quality of environmental management, we used the indicators of proportion of and intensity of urban maintenance and construction fund invested in environmental expenditure, and the disposal rate of domestic harmless garbage [42,55,57,58,59,60,61]. Table 1 shows the indicators selected for this study, using the years of 2000 and 2010.
Of the nine indicators, only density of industrial land and density of industrial SO2 discharged were expected to be negatively related to the environmental benefits [62]; therefore, to be consistent, the reciprocals of these two indicators were used in subsequent analysis. Further, all the indicators were normalized to uniform dimension. Then, the value of environmental benefits of urban land use (ebu) was calculated using the entropy-based weight method, which ensured that a greater weight was assigned to an indicator with a smaller degree of uncertainty or smaller entropy [63]:
e b u = w i × X i
w i = ( 1 e i ) / ( 1 e i )
e i = 1 ln   n ( X i × ln X i )
where wi is the entropy weight of indicator i; Xi is the normalized value of indicator i; ei is the entropy value of indicator i; n is the number of objects assessed.
Because ebu consisted of three aspects of environmental benefits, it could be divided into ebuei for green infrastructure, ebudi for industrial upgrade, and ebuma for environmental management. This subdivision allowed an examination of the three aspects separately in the results.

2.3. Regression Model Specification

To explore the driving factors for change of environmental benefits, this study employed a weighted regression model, using ebu as the dependent variable. The independent variables included five socio-economic and demographic variables and one interaction variable.
Per capita disposable income of urban households (pci) and size of urban population (aup) were expected to be positively related to improvement of ebu [26,27]. Driven by higher income, rapid urbanization in China represents a demographic transfer from rural areas to cities or from RP to RD cities. In other words, aup was expected to be conditional to pci, i.e., a city with a higher income level is expected to have a larger urban population and vice versa. Therefore, we introduced an interaction variable between aup and pci in the model. Land urbanization (lu) and demographic urbanization (du) characterizing the process of rapid urbanization in China were also included [64]. Additionally, as explained in the introduction section, change in ebu was conditional to urban land scarcity; thus, per capita urban construction land area (pcucl) was introduced as an independent variable to measure urban land scarcity. Table 2 lists these independent variables.
In equation form, the econometric model can be expressed as follows:
l n ( y j ) = c + β l n ( x j ) + γ l n ( p c i j ) × l n ( a u p j ) + ε j
where yj is the dependent variable or ebu of prefectural city j; xj is a vector of the independent variables; l n ( p c i j ) × l n ( a u p j ) is the interaction variable; c is a common intercept; β and γ denote unknown parameters to be estimated; and εj is an unobserved error term.
The model was computed for 2000 and 2010 using the software EViews 7.2 (Quantitative Micro Software, Irvine, CA, USA). The unknown parameters were estimated using the weighted least squares regression method, which is designed to maximize the efficiency of parameter estimation. We explored the mechanism of changes in ebu by analyzing changes in these estimated parameters for 2000 and 2010.

3. Results

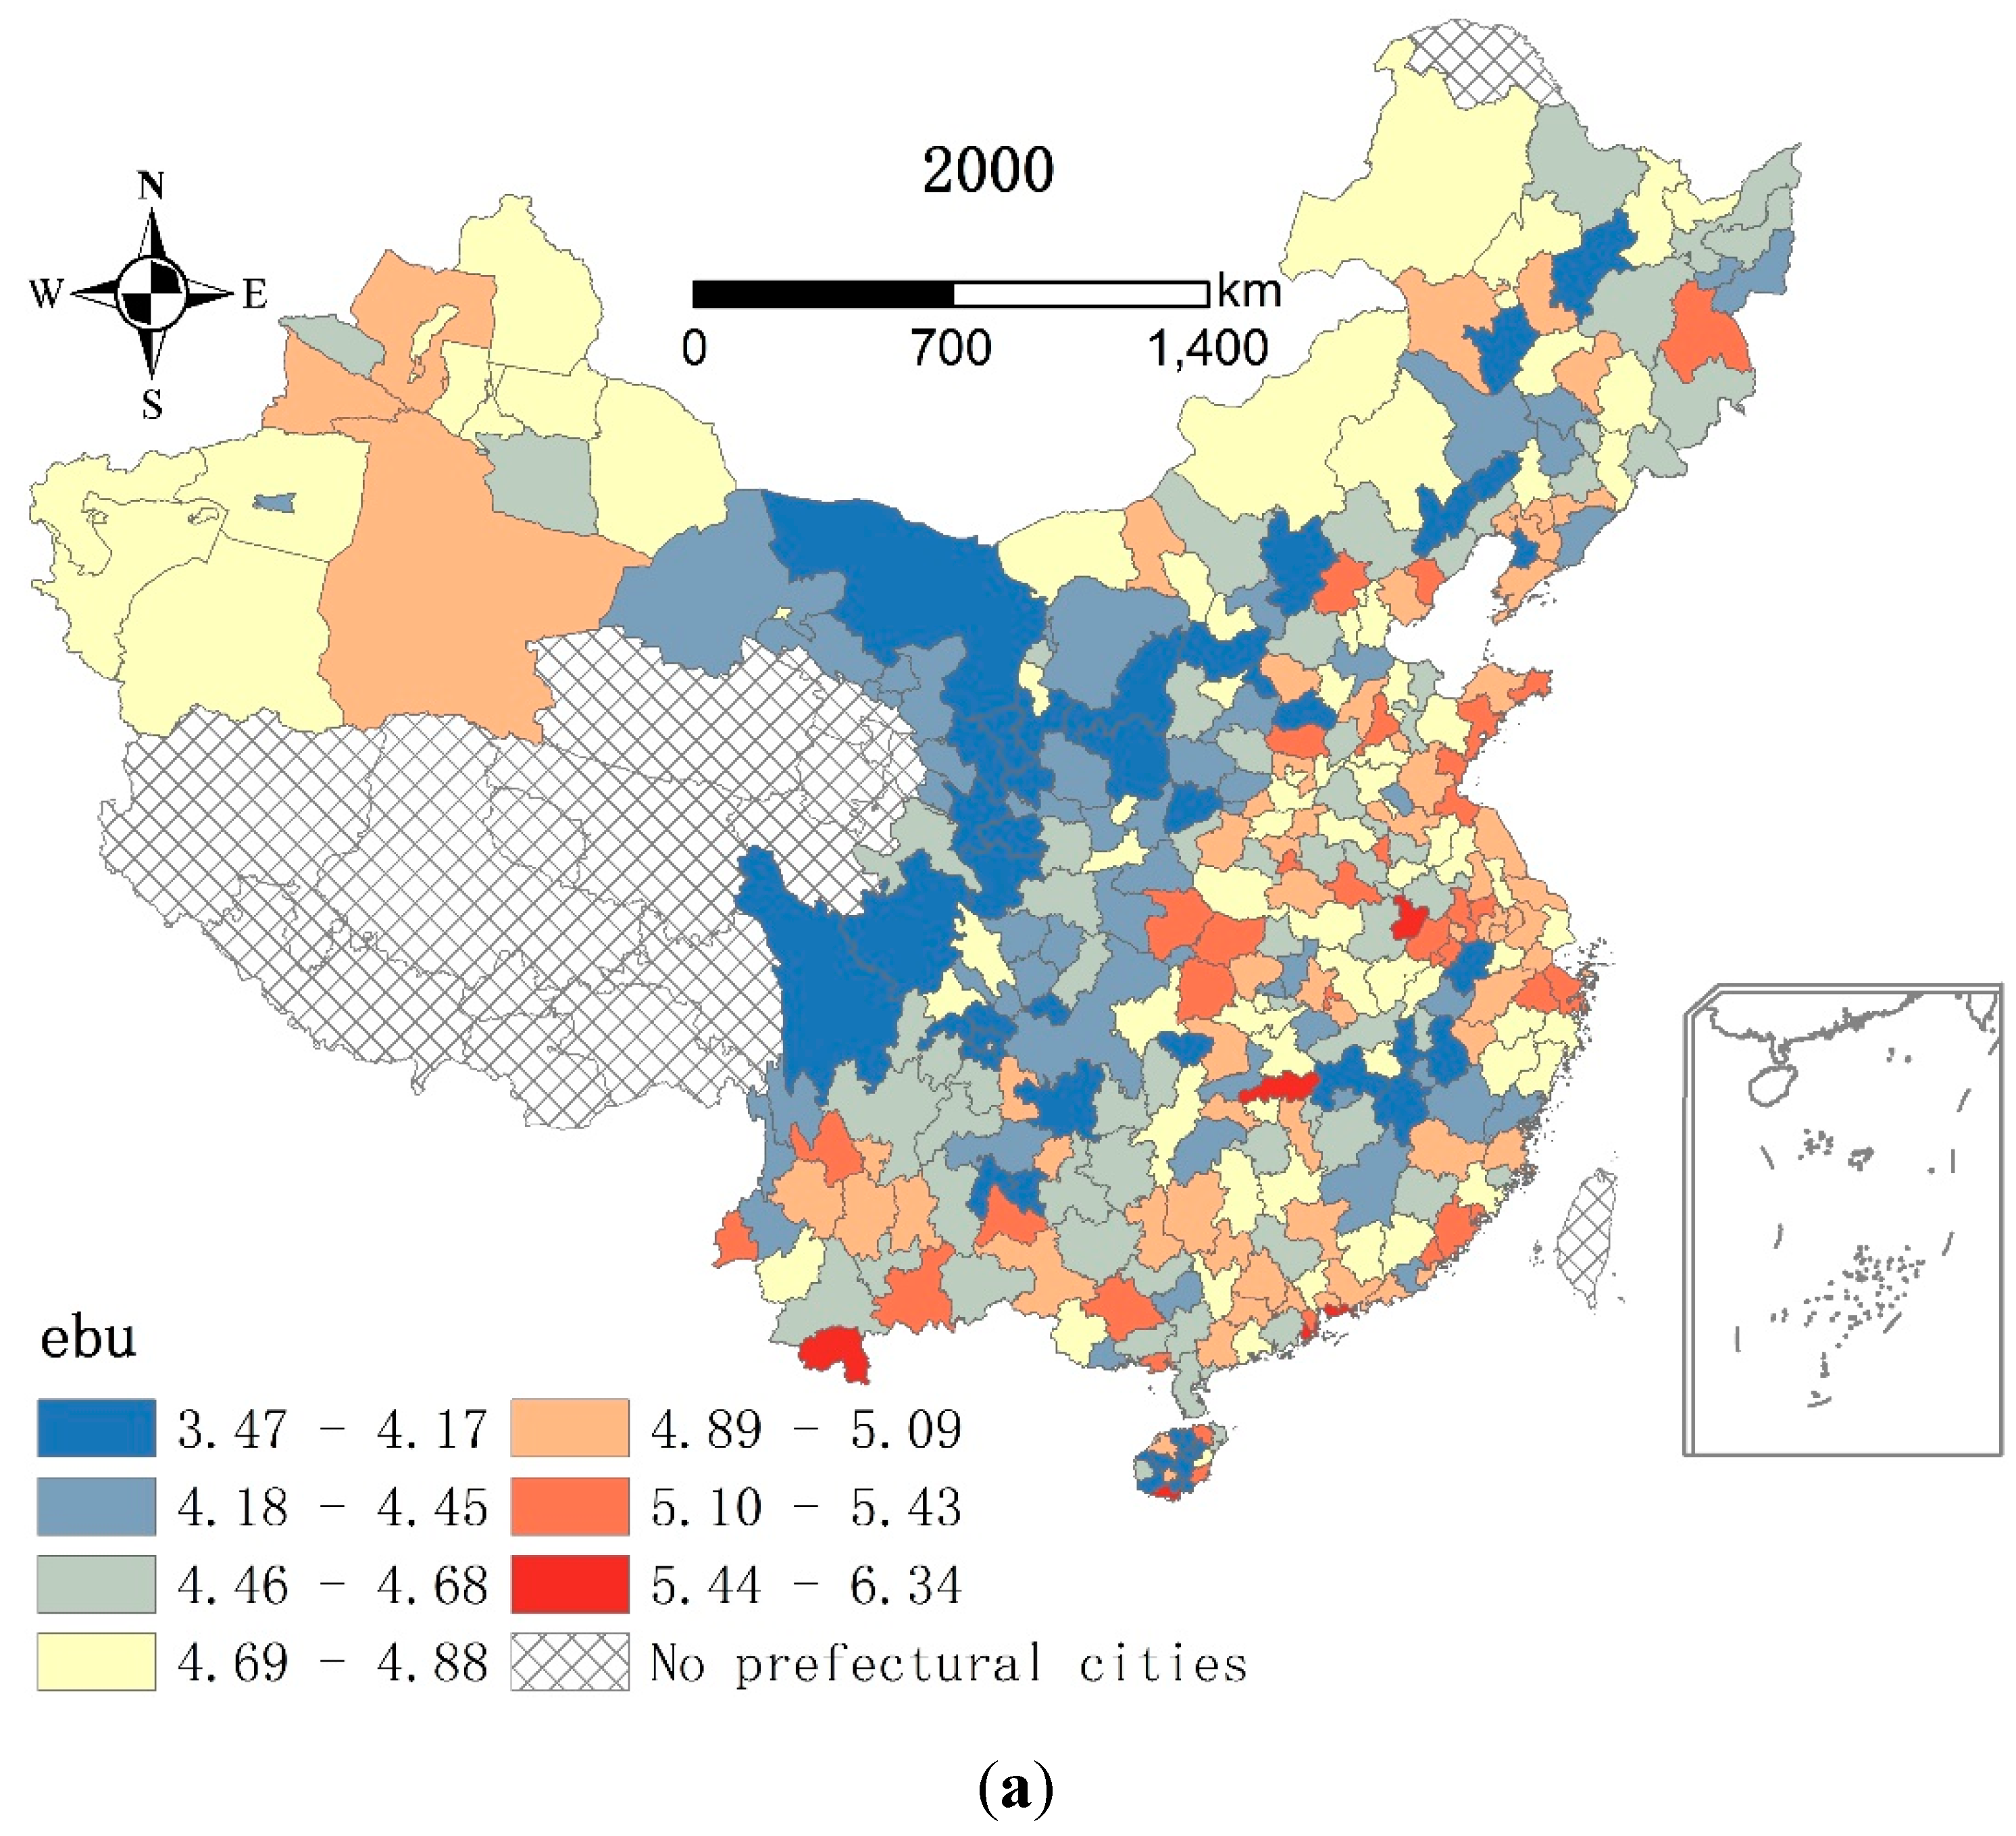
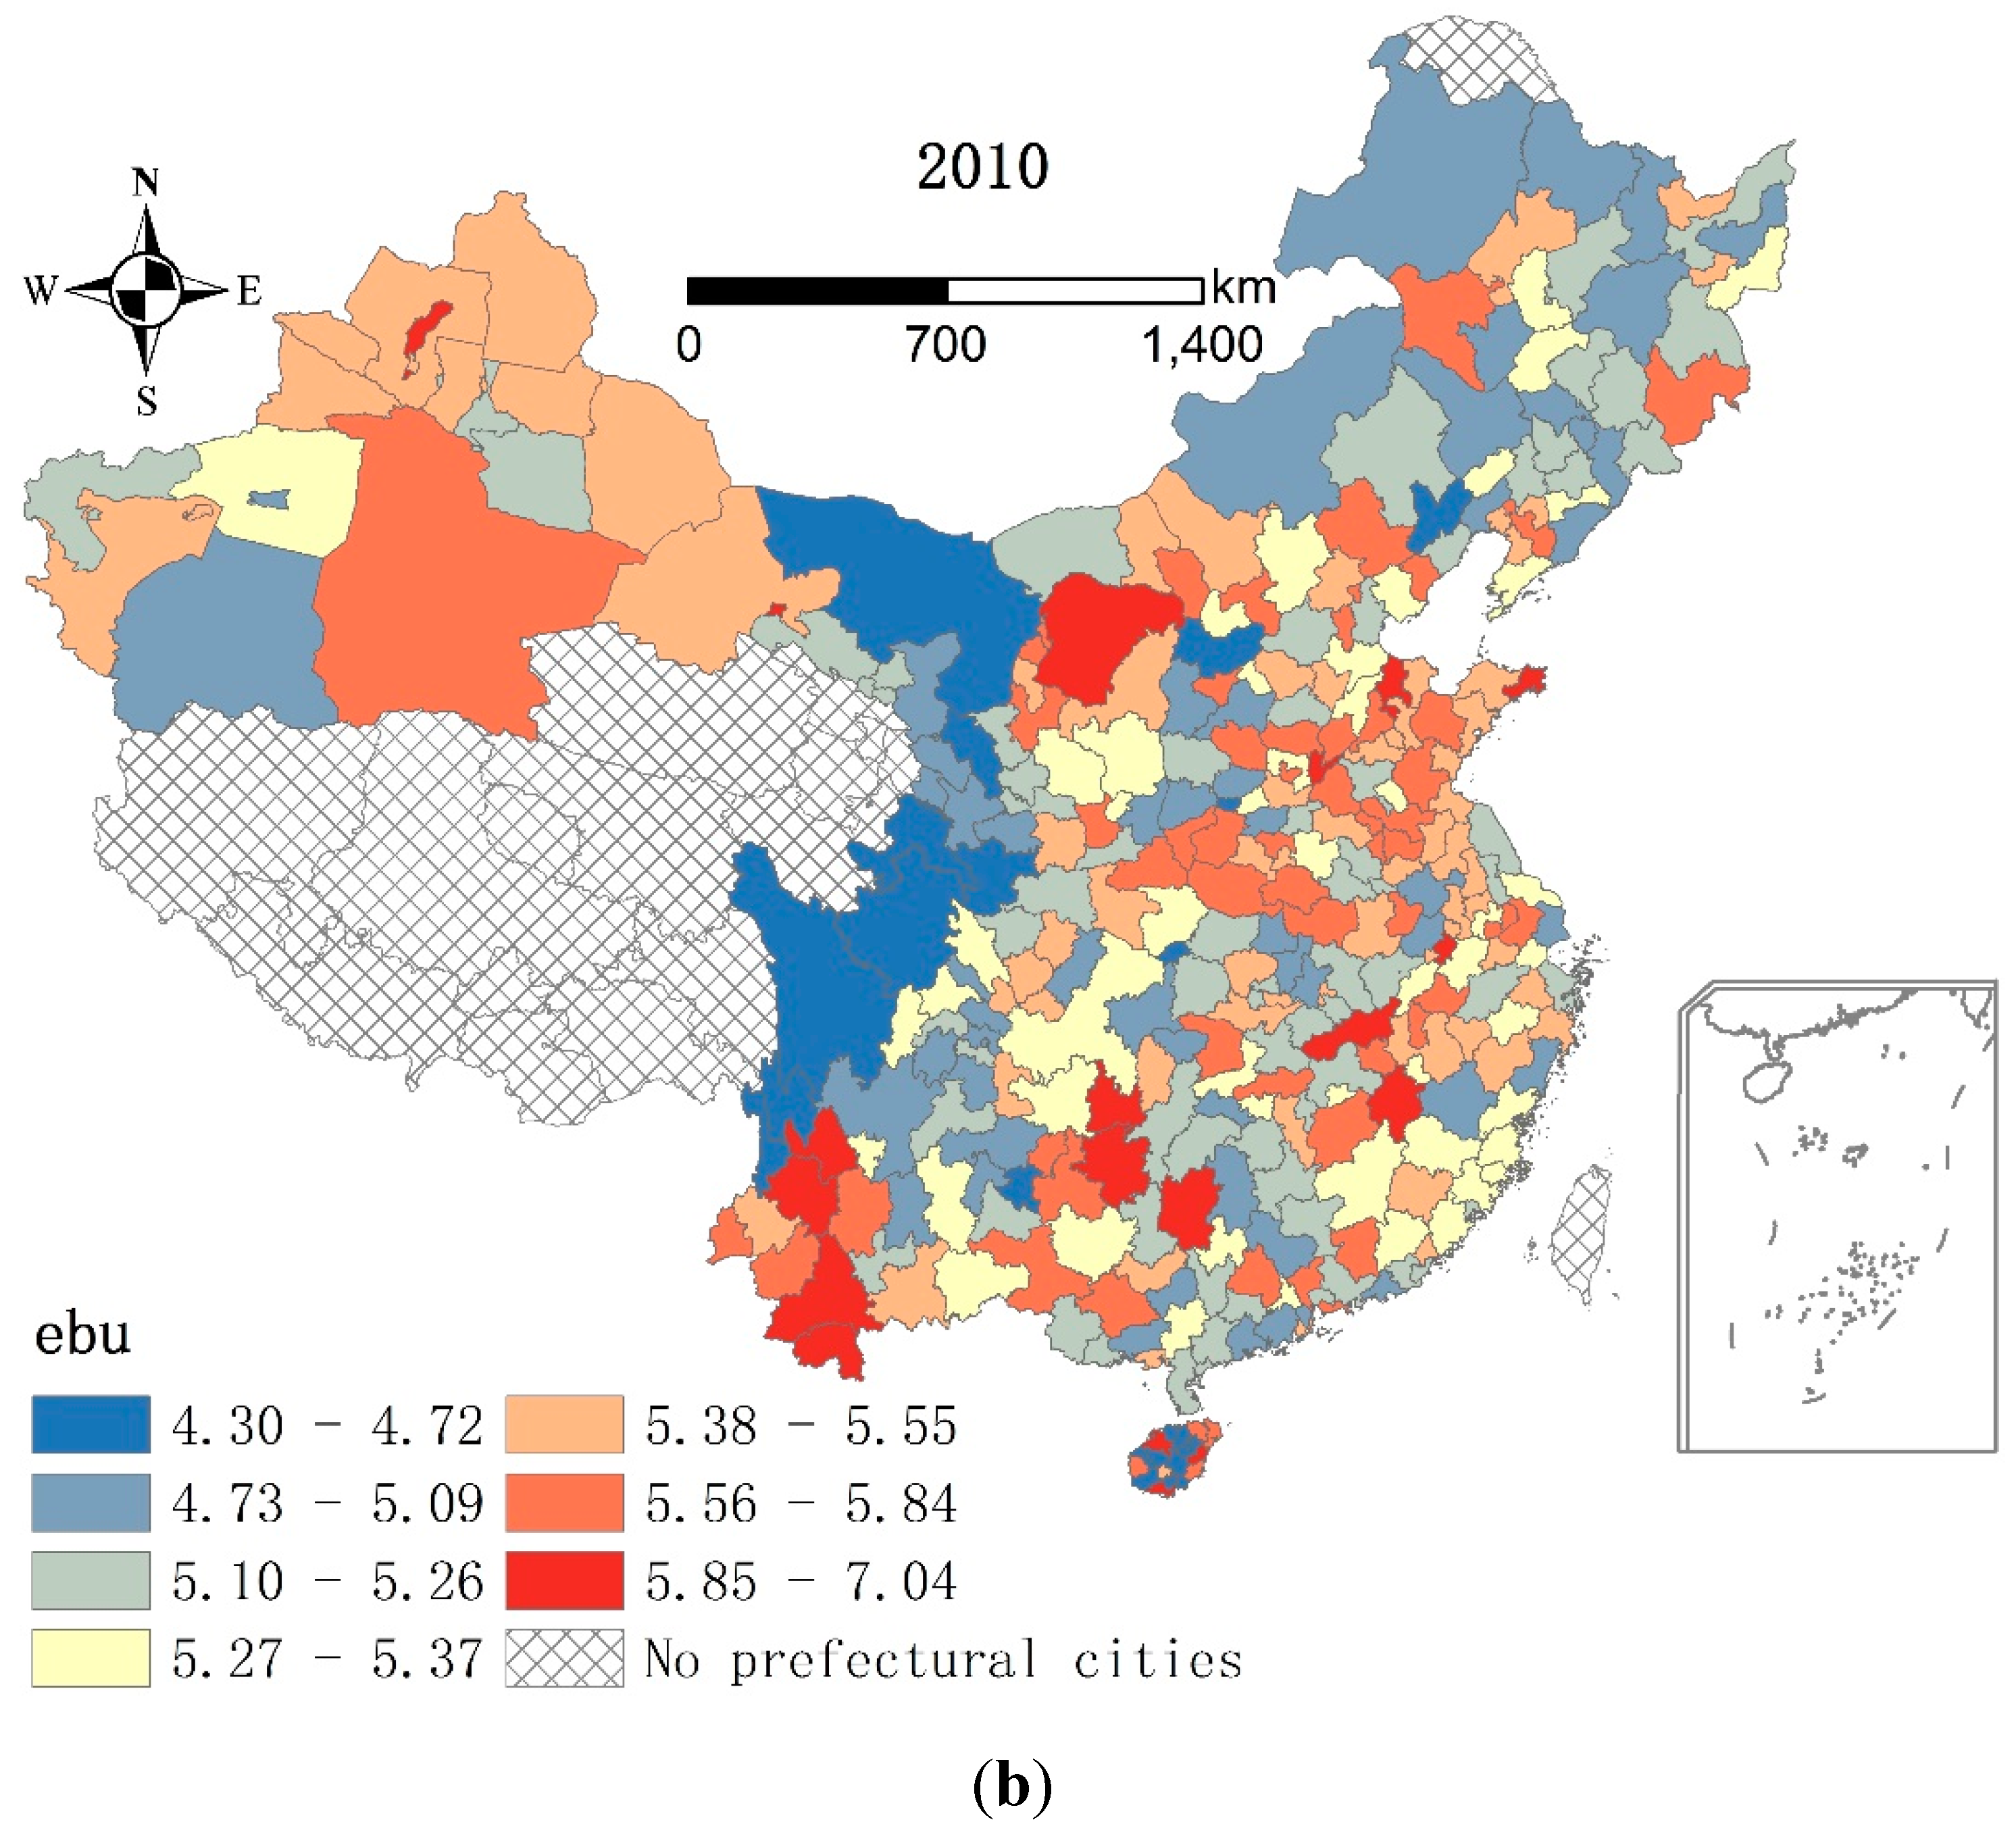
3.1. Spatial Pattern of Environmental Benefits of Urban Land Use

Figure 3 shows the environmental benefits of urban land use at the city level in 2000 and 2010. In 2000, the ebu values range from 3.47 to 6.34, with an average of 4.68. The average ebu among the RD cities is 4.94, as most coastal and capital cities have ebu values above 4.69. Meanwhile, the average ebu among the RP cities is 4.60, as most cities in Sichuan, Gansu, Shaanxi, Ningxia, Jiangxi, and the western Inner Mongolia have ebu values below 4.45. In general, more environmental benefits of urban land use are found among the RD cities than the RP cities.
In 2010, the ebu values range from 4.30 to 7.04, with an average of 5.32 (Figure 3). In a different pattern from 2000, most cities with above-average ebu values are RP cities. Although RP cities in western Sichuan, central and southern Gansu, and western Inner Mongolia have much lower ebu values, the proportion of RP cities with ebu values higher than 5.56 amounts to 76%. The RD cities have an average ebu value of 5.36, as 77.78% of these cities have ebu values lower than 5.55. In general, most RP cities have more environmental benefits than the RD cities in 2010.

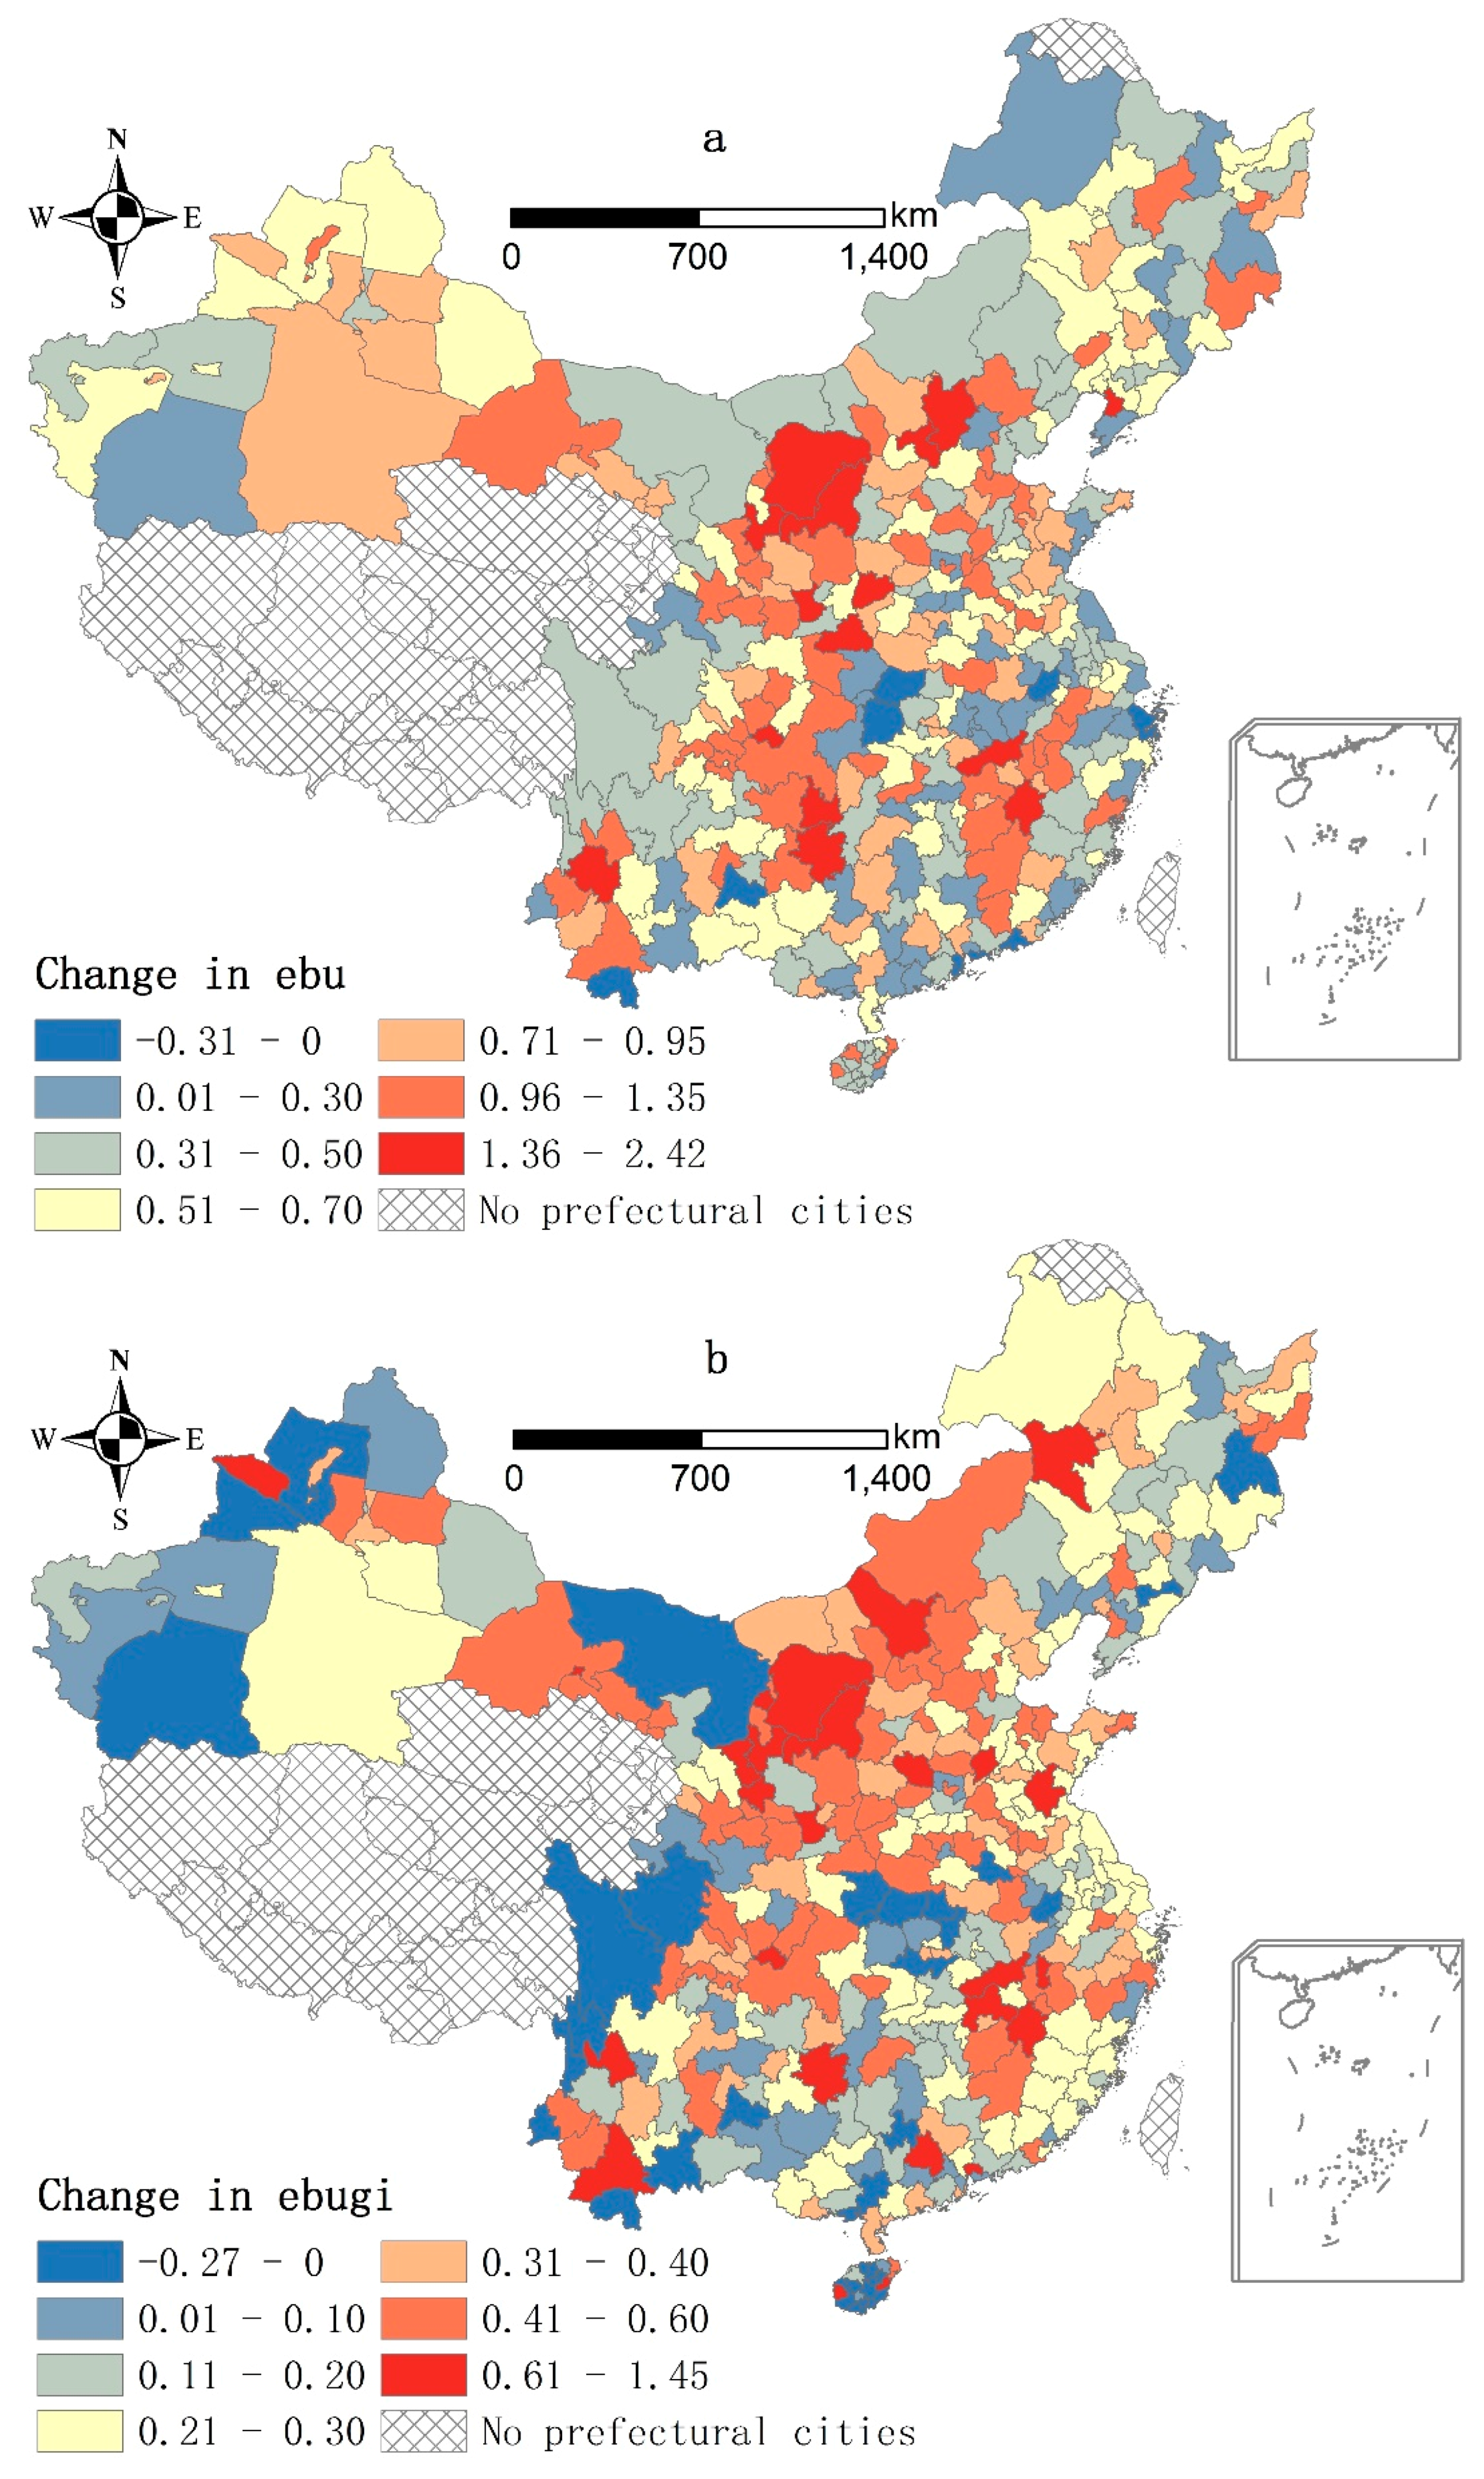
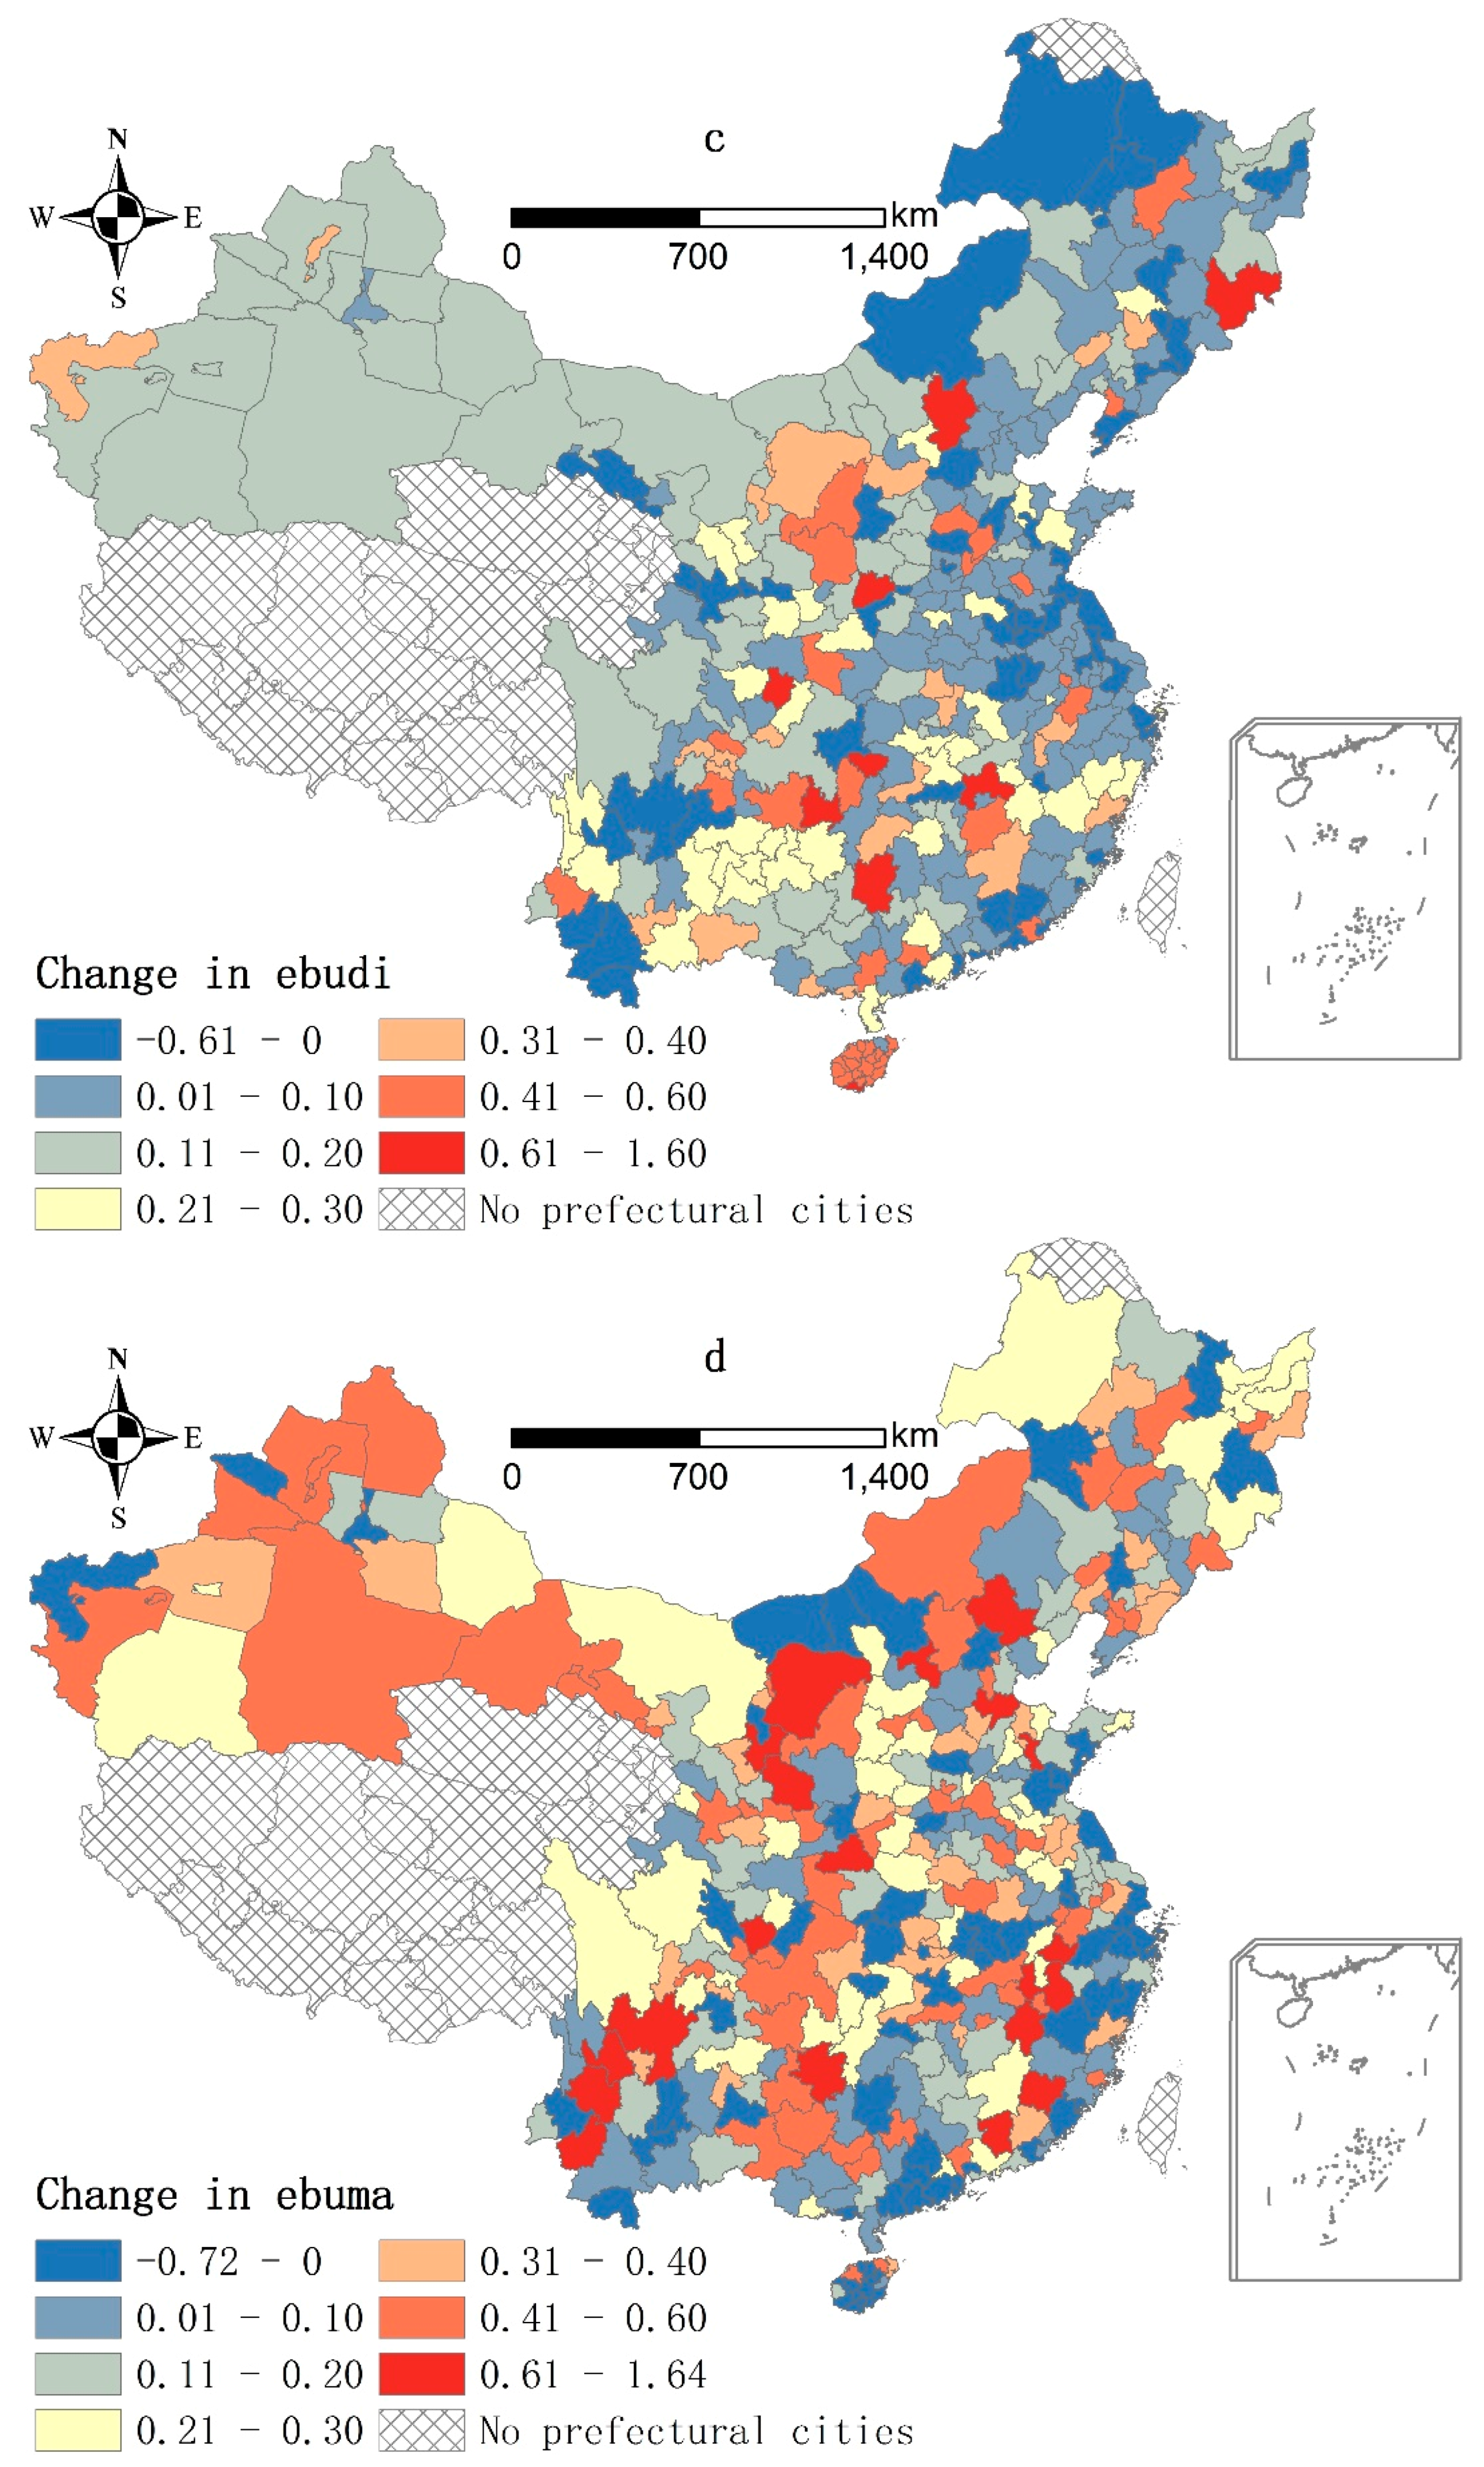
3.2. Change in Environmental Benefits of Urban Land Use

Change of ebu was mapped by subtracting the ebu in 2000 from the ebu in 2010. As shown in Figure 4a, changes in ebu at the city level range from −0.31 to 2.42, with 97% of the cities having increases. When examined in detail, there are differences between the RD and RP cities. Most RD cities have change values between −0.31 and 0.70. Meanwhile, cities with increases of more than 0.71 are primarily RP cities in Jiangxi, western Yunnan, eastern Guizhou, eastern Sichuan, northern Shaanxi, northern and eastern Gansu, northern Hebei, and southern Inner Mongolia. In general, the average increase of ebu among the RD cities is much lower than the RP cities between 2000 and 2010, as shown in Table 3.
Figure 4b–d show changes of ebugi, ebudi, and ebuma, the three aspects of environmental benefits, separately. The three maps are based on the same class breaks of 0, 0.1, 0.2, 0.3, 0.4, and 0.6. The spatial pattern of changes in ebugi in Figure 4b is similar to that of ebu in Figure 4a, with higher increases (>0.3) mainly among the RP cities. Most RD cities, on the other hand, have values between 0.21 and 0.30. Figure 4c shows that changes in ebudi are less than 0.30 in most cities, with values generally between −0.60 and 0.10 for RD cities and generally greater than 0.11 for RP cities. Figure 4d shows that changes of ebuma exceed 0.11 in most cities. Cities, which have values higher than 0.21, are primarily RP cities. Meanwhile, RD cities have lower increases in ebuma overall. In fact, a number of RD cites along the coast have decreases in ebuma.
To further clarify the differences between the RD and RP cities, we calculated the contribution breakdown of ebugi, ebudi, and ebuma to ebu among the whole prefectural cities, RD cities, and RP cities, as shown in Table 3. For the whole prefectural cities, contribution of ebugi to ebu is greatest followed by ebuma, whereas ebudi has the lowest contribution. Contribution of ebugi is higher among the RD cities than the RP cities. On the other hand, contributions of ebudi and ebuma among the RP cities are greater than those of the RD cities.

3.3. Example: Environmental Benefits of Urban Land Use in Changzhou and Jiujiang

We selected Changzhou and Jiujiang to illustrate the differences in the change in environmental benefits of urban land use between a RD city and a RP city. Figure 2 shows the location of these two cities. Changzhou is a RD city located in Jiangsu province, with 1.33 million of urban population growth and 92.49 km2 of urban land expansion in 2000–2010. The per capita disposable income of urban households in Changzhou increased from 8540 yuan to 25,875 yuan. Jiujiang is a RP city located in the northern Jiangxi province, with 0.15 million of urban population growth and 46.77 km2 of urban land expansion in 2000–2010. The per capita disposable income of urban households in Jiujiang increased from 5081 yuan to 15,764 yuan.
Table 4 shows that Changzhou’s ebu is higher in 2000 but lower in 2010 than Jiujiang’s, as the increase of ebu is much less in Changzhou than in Jiujiang. In fact, the increases of the three ebu components are all lower in Changzhou than in Jiujiang. In terms of their contribution, ebugi is the largest, followed by ebuma and ebudi, for both Changzhou and Jiujiang. However, Changzhou has a higher contribution of ebugi and lower contributions of ebudi and ebuma than Jiujiang. Table 5 shows the original values of indicators for the ebu assessment.

3.4. Regression Results

Table 6 lists the statistical description of the independent variables in logarithm. Table 7 shows the regression results. The relationships between ebu and pci, aup and du are all positive in 2000. Based on the regression coefficient, pci is the most important among the three independent variables, followed by aup. The interaction variable of pci and aup has a low and negative impact on ebu. Likewise, pcucl and lu also have low and negative impacts on ebu.
In 2000–2010, the coefficient of aup increases by 0.227, which is the largest among all coefficients. Next is the coefficient of pci, which has an increase of 0.052. This implies that aup and pci have more positive impacts on ebu in 2010 than in 2000. At the same time, the negative impact of the interaction variable of pci and aup becomes stronger in 2010. The coefficient of du decreases by 0.002 in 2000–2010; this suggests that its impact on ebu has no obvious change. It is noted that the impact of pcucl turns from negative to positive in 2000–2010, and the positive impact is more significant than the negative impact. The coefficients of lu decreases from −0.002 to −0.009 in 2000–2010, indicating a more significant negative impact in 2010.

4. Discussion

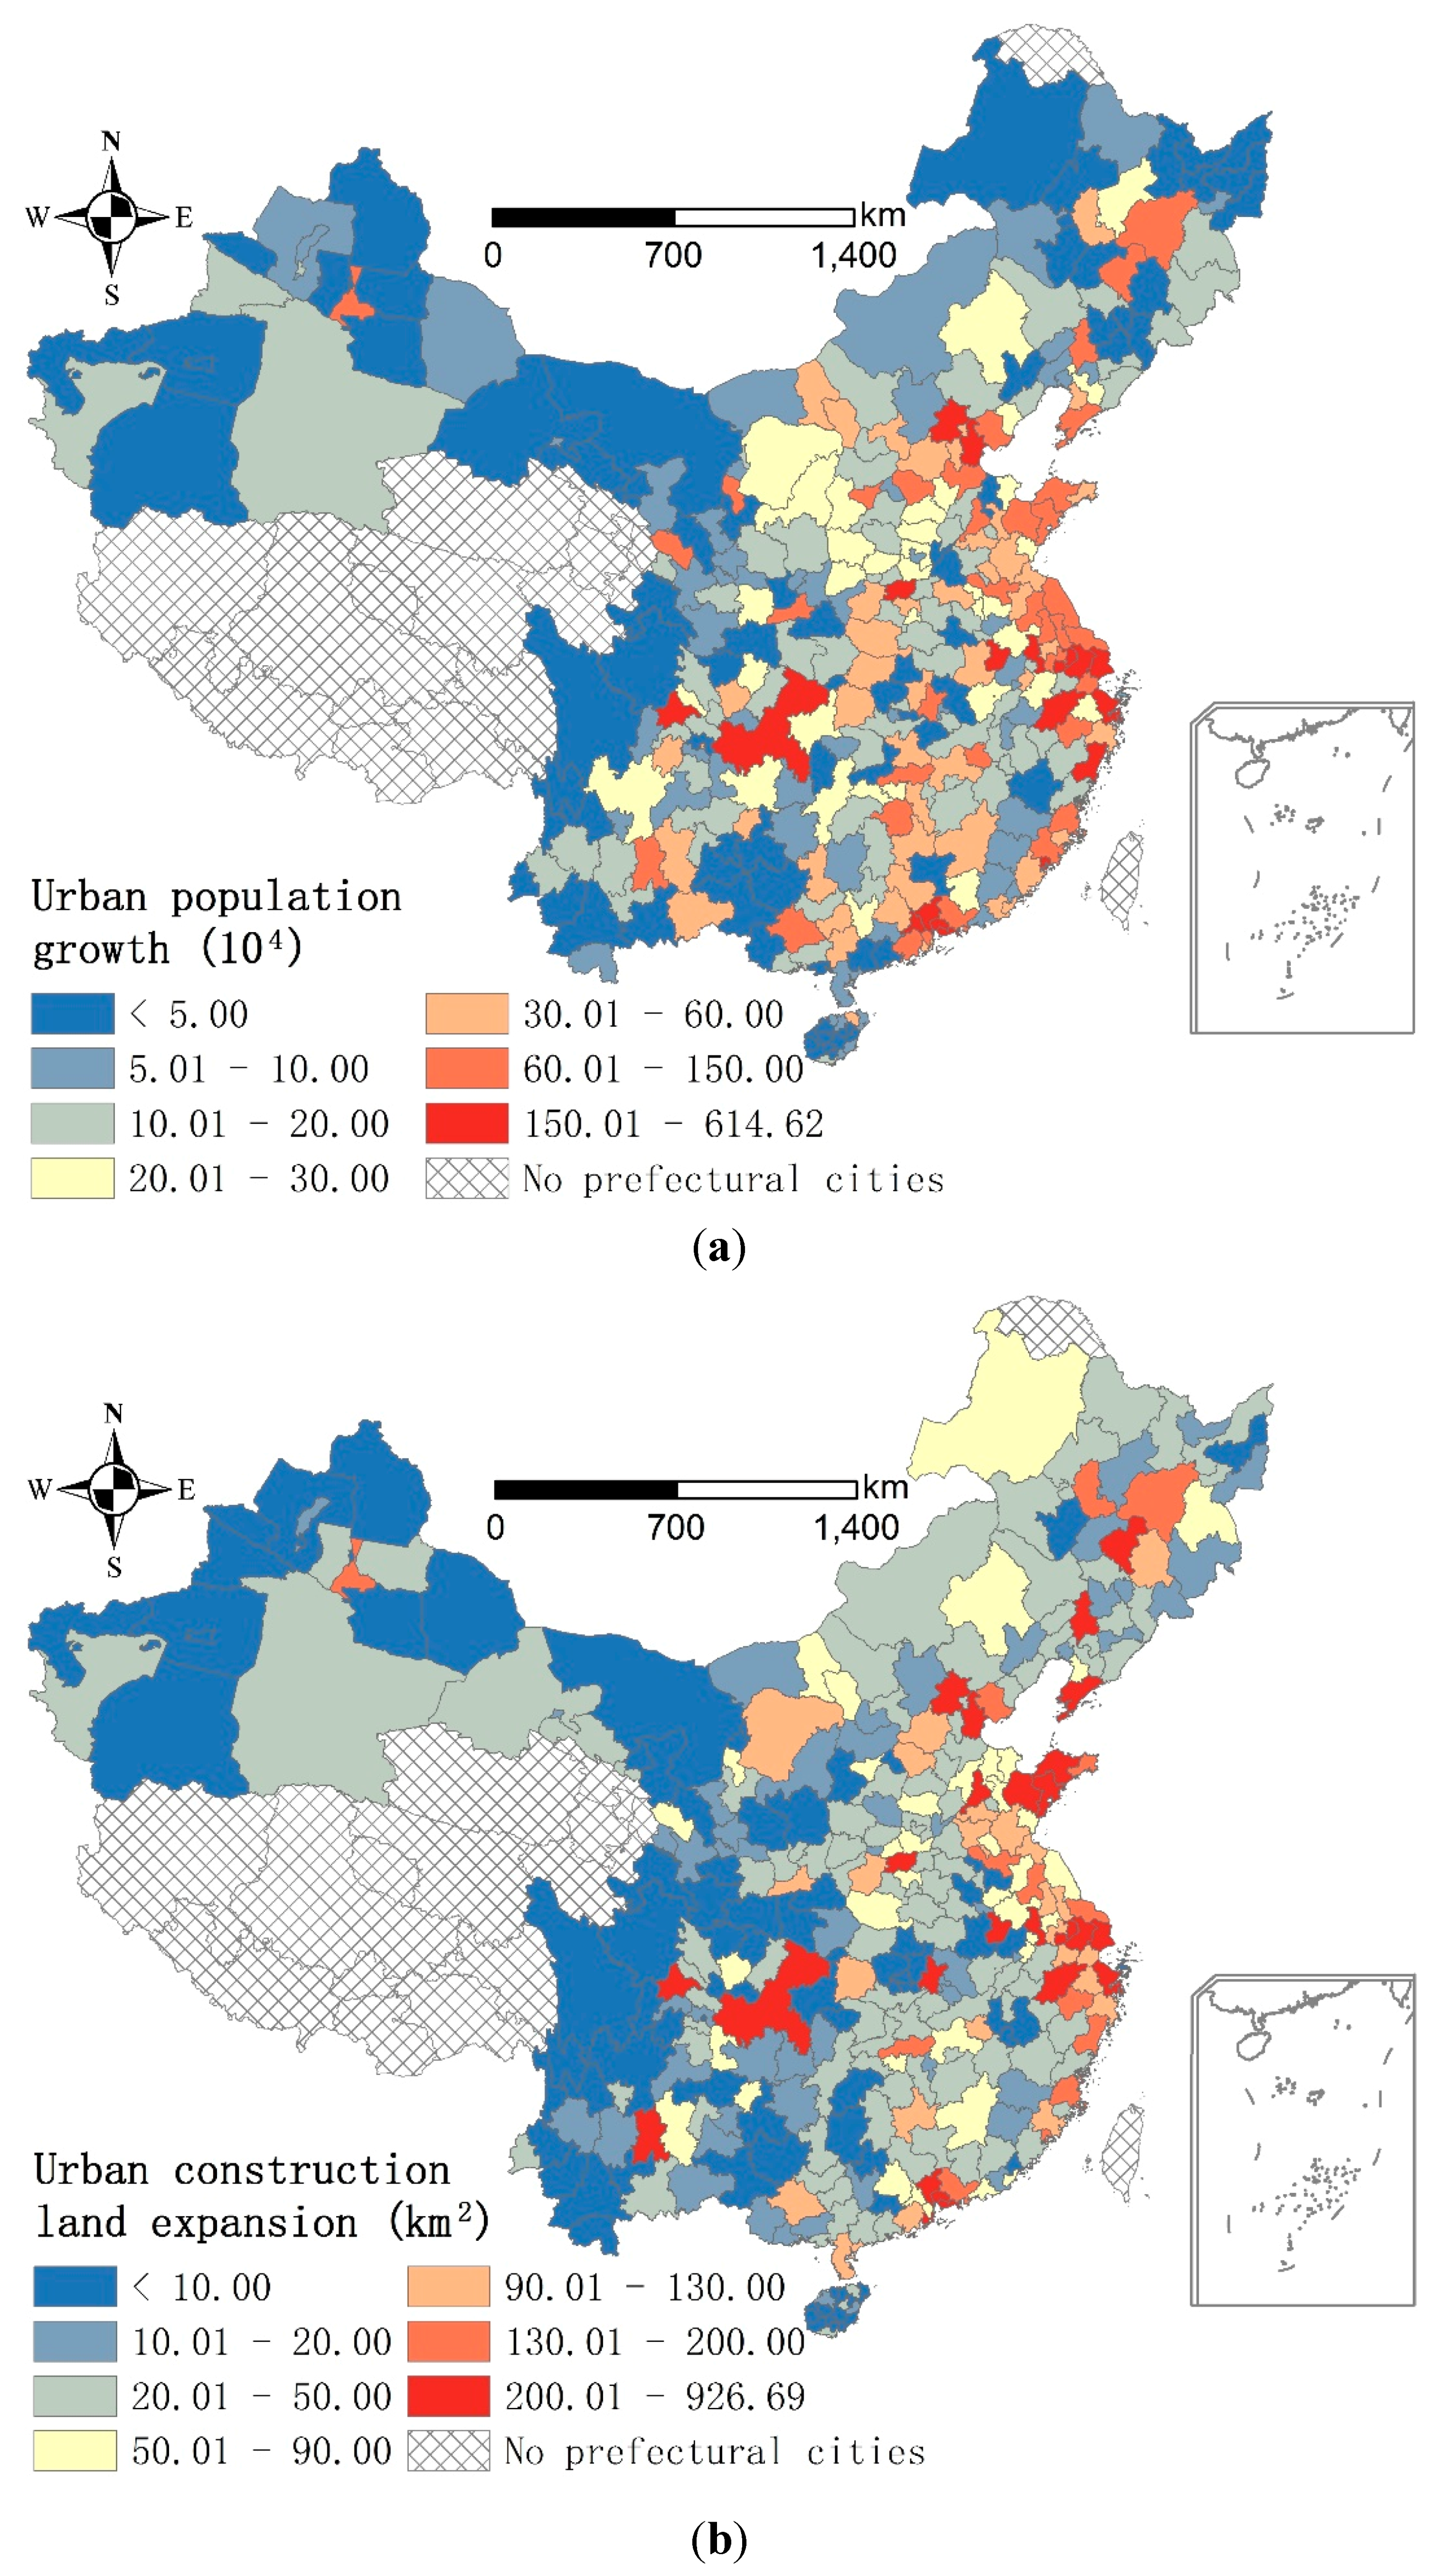
4.1. Relationship between Income, Urban Population Growth, and Environmental Benefits

The literature indicates that environmental benefits of urban land use are positively related to income and urban population growth [26,27]. The increase of ebu (Figure 4a) and the increase of the positive coefficients of pci and aup (Table 7) reveal that growth of per capita disposable income of urban household and urban population indeed brought about the improvement of environmental benefits in the prefectural cities in 2000–2010. However, this inference seems to be contradicted by two observations: the lower average increase of environmental benefits in RD than RP cities, and the intensifying negative impact of the interaction variable of pci and aup (Table 7). But this is not the case upon closer examination. The interaction of pci and aup represents a demographic transfer, driven by higher income, from rural areas to cities or from RP to RD cities. Rural labor transfer amounted to nearly 390 million in 1978–2009 [65]. Although the arrival of the Lewis turning point in China, a point at which an excess supply of labor is changed to one of labor shortage, has been subject to debate [66,67,68], transferred rural labor actually increased from 128.91 million to 171.67 million in 2000–2009 [69]. This indicates that a large amount of demographic agglomeration in RD cities suppressed the improvement of urban environmental benefits in 2000–2010, as shown by the higher negative coefficient of the interaction variable between pci and aup in 2010.
Demographic agglomeration can have a negative impact on environmental improvement because it causes greater land scarcity and lower pcucl. Figure 5 shows that the RD cities had a much lower pcucl than the RP cities in 2000 and 2010. As shown by the original data from China Urban Construction Statistical Yearbook, the average pcucl of the RD cities was 25.76 m2 and 18.77 m2 lower than the RP cities in 2000 and 2010, respectively. Land economics theory indicates that land is apt to be allocated to more valuable uses as land scarcity increases [41]. Thus, as land scarcity worsened in RD cities, they restrained green infrastructure expansion for more valuable uses, such as industrial land. For example, per capita area of and density of parks and green space in the RD cities increased by 16.1 m2 and 9.57% in 2000–2010, which were 1 m2 and 3.58% lower than the RP cities, respectively. Meanwhile, park size in the RD cities increased by 6.56 m2, which was 4.52 m2 lower than the RP cities. Thus, the average increase of the ebugi was much lower in the RD cities than the RP cities in 2000–2010 (Table 4).
However, previous studies have also revealed that land scarcity can lead to industrial upgrade towards a service economy [27,41,42], which can be beneficial for environmental improvement. Then, if land scarcity becomes more serious, it could bring about more environmental benefits relating to industrial upgrade, especially among RD cities. As shown in Figure 4c, ebudi values indeed increased in most cities, but increment was lower among RD cities. Specifically, the average increase of ebudi in the RD cities was 0.071 in 2000–2010, which was 0.105 lower than the RP cities. This implies that the effects of a service economy on urban environmental improvement have not fully manifested as anticipated. There is much potential to promote industrial upgrade towards a service economy especially among RD cities.
According to the analysis above, a lower pcucl or more serious land scarcity per se constrained green infrastructure expansion, especially among RD cities. Could the opposite be true, i.e., more environmental benefits realized as a result of a higher pcucl? In 2000, the RD cities had higher ebu values (Figure 3) and much lower pcucl values (Figure 5) than the RP cities overall. This mismatching resulted in the negative impact of pcucl on ebu in 2000 (Table 7). However, the pattern changed in 2010. Although ebu and the pcucl in most cities increased in 2000–2010, the RP cities had overall higher ebu values and also higher pcucl values than the RD cities. This matching led to the positive impact of pcucl on ebu in 2010. Additionally, the coefficient of pcucl increased from −0.008 to 0.020 in 2000–2010 (Table 4), suggesting that pcucl had a stronger impact on ebu in 2010 than 2000. In short, if we did not consider the effect of the mismatching, an increase of pcucl, which could be interpreted as an increase of urban land supply, could indeed contribute to an improvement of ebu.
Since land scarcity due to a large amount of demographic agglomeration can suppress the improvement of ebu, it seems reasonable to expand urban land especially in RD cities. However, Table 7 shows that land urbanization exerts negative impacts on improvement of ebu. To explain this contradiction, we can start with Figure 6, which shows that urban land agglomerated in RD cities. Specifically, high lu values (>1.39) were found in RD cities while most RP cities had low lu values (<0.78) in 2000. This divergence of the lu values was much more apparent than that of the ebu values at the city level. Although the lu values generally increased in 2010, their spatial pattern at the city level, unlike that of ebu, had no obvious changes. The differences between the patterns of lu and ebu therefore resulted in the negative impacts of lu on ebu in 2000 and 2010. As high ebu values moved towards RP cities, high lu values moved towards RD cities in 2000–2010. Meanwhile, the coefficient of lu decreased from −0.002 to −0.009 in 2000–2010 (Table 7), implying that the impact of lu had deepened in 2010. Thus, urban land agglomeration in RD cities inhibited the improvement of ebu among the whole prefectural cities.

4.2. Implications for Sustainable Urban Land Use

Although this study focuses on the environmental benefits of urban land use, we have found three aspects of unsustainable urban land use, which deserve consideration in government policies. The first is related to green infrastructure expansion. According to the original data from China Urban Construction Statistical Yearbook, for all prefectural cities, the area and the density of parks and green space increased by 1 million hm2 and 11.67% in 2000–2010, respectively. Meanwhile, the area of parks and green space per capita and the park size increased by 15.71 m2 and 2.23 hm2, respectively. The expansion of these green infrastructure indicators indeed resulted in major environmental improvement, which in turn contributed to most improvement in environmental benefits, as shown in Figure 4b and Table 4. Industrial upgrade, however, had the least contribution. Moreover, the RD cities had a much higher contribution of green infrastructure expansion, and a much lower contribution of industrial upgrade to the increase of environmental benefits, than the RP cities. This finding is consistent with previous studies, which have suggested that green infrastructure expansion is a stage in the process of urbanization forced by income and urban population growth [35,36,37,38,39]. Our previous discussion has also indicated the contribution of higher pcucl, i.e., higher urban land supply, to the improvement of environmental benefits. The growing land scarcity, however, has been the key issue of economic development and urbanization in China [3]. In response, urban land supply will be restrained rigorously by a restriction of 120 million hectares for cultivated land to ensure food security [70]. Additionally, according to the Ministry of Land and Resources of the People’s Republic of China, urban growth boundaries of 14 RD cities including Peking, Shanghai, Guangzhou, Shenzhen, Chengdu, Wuhan, Zhengzhou, Nanjing, Suzhou, Shenyang, Hangzhou, Xiamen, Xi’an and Guiyang, will be designated in 2015. Furthermore, designation of urban growth boundaries will be extended to 600 cities in China. Thus, the continuing massive increase in urban land supply is not possible in the long run. Further, green infrastructure expansion through increasing urban land supply is not a permanent solution to environmental improvement.
The second is related to the demographic agglomeration in RD cities. Although rapid industrialization in RD cities contributed to large increases in income, it also led to massive in-migration, which in turn suppressed environmental improvement due to the restrained green infrastructure expansion and the poor performance of industrial upgrade and environmental management [16,65,69,71]. This implies that RD cities paid more attention to industrialization than environmental improvement. For example, the proportion and the intensity of urban maintenance and construction fund invested in environmental expenditure increased by 1.28 percent and 7.97 thousand yuan per hm2 in 2000–2010 in the RD cities, which were 2.32 percent and 14.72 thousand yuan per hm2 lower than the RP cities. This finding is consistent with the research results of Lu et al. [72], which showed that Guangdong Province paid more attention to industrial development and less to living conditions in cities during the period 2000–2010. On the basis of the 2005 Population Survey, Knight, Deng and Li [71] predicted another 123 million migrants moving into cities in China from 2010 to 2020. These migrants will cause more demographic agglomeration in RD cities. It is therefore plausible that suppression of environmental improvement will be further intensified if RD cities continue to sacrifice environmental improvement for industrialization.
The third is related to urban land agglomeration in RD cities [73,74]. To accelerate the reform of the open-door policy in 1978, the Chinese central government implemented unbalanced development strategies to encourage development of RD cities ahead of RP cities after the mid-1980s. Since then, RD cities have been given priority for urban land expansion. Although the central government started to promote regional coordinated development after 2000, RD cities still had the priority to attain urban land quota in land use planning. As discussed previously, urban land agglomeration in RD cities, however, did not yield more environmental benefits from green infrastructure expansion than in RP cities. Urban land scarcity in RD cities in fact promoted land conversion to more valuable uses such as industrial use rather than green infrastructure. In other words, urban land agglomeration meant more industrial development and more demographic agglomeration in RD cities in a pattern of positive feedback. In turn, land scarcity became more serious, resulting in further restraint of green infrastructure expansion. In short, urban land agglomeration hindered balanced improvement of environmental benefits across the prefectural cities.

5. Conclusions

This study analyzed urban environmental benefits among China’s major cities based on their structure of urban land use in 2000 and 2010. We developed an assessment index system covering three aspects of environmental benefits, including green infrastructure, industrial upgrade, and urban environmental management. Our results showed that higher income and urban population growth did bring about improvement of the environmental benefits in all cities in 2000–2010; however, coastal and capital cities had less improvement on average than the other cities. We also found that improvement of the environmental benefits was mostly dependent on green infrastructure expansion, with the least contribution from industrial upgrade. This pattern was particularly conspicuous among RD cities.
As urban expansion continues at a rapid rate, it is important for China to promote balanced improvement of environmental benefits. First, the environmental benefits among green infrastructure improvement, industrial upgrade and environmental management improvement should be balanced. Specifically, more attention should be paid to industrial upgrade and better environmental management (e.g., harmless treated domestic garbage, management of sewerage, landscaping, and environmental sanitation). Second, environmental improvement between RD and RP cities should be balanced through regional differentiation policies. For RD cities, it is urgent to promote industrial upgrade and transformation to a service economy for improving the environmental benefits in the long run. For RP cities, it is urgent to increase income level and urban population growth through the promotion of high value-added industries, some of which could be transferred from RD cities to alleviate their demographic agglomeration. At the same time, more urban land quota could be arranged in RP cities through land use planning to reduce urban land agglomeration in RD cities. Looking to the future, we suggest that urban land use needs to be integrated into rural-urban interactions so that viable and sustainable pathways can be developed for flows of resources, goods and people under changing environmental and economic conditions.

Acknowledgments

This work was supported by the National Natural Science Foundation of China (Grant No. 41401191), the Guangdong Natural Science Foundation (Grant No. 2015A030313504), Young Innovation Talent Program in Guangdong (Grant No. 2014KQNCX109), Planning Program of Social Science in Guangzhou (Grant No. 15Q27), Science Research Program of Universities and Colleges in Guangzhou (Grant No.1201430923), Planning Program of Science and Technology in Guangzhou (Grant No. 201510020009), National science and technology support plan (Grant No. 2013BAJ13B01), and German Science Foundation (DFG) through Cluster of Excellence “Integrated Climate System Analysis and Prediction” (CliSAP). The insightful and constructive comments of anonymous reviewers are greatly appreciated.

Author Contributions

Xiaoqing Song had the original idea and data for the study and, with all co-authors carried out the design. Xiaoqing Song drafted the manuscript, which was revised by all authors especially by Kang-tsung Chang. All authors read and approved the final manuscript.

Conflicts of Interest

The authors declare no conflict of interest.

References

  1. Liu, T.; Liu, H.; Qi, Y. Construction land expansion and cultivated land protection in urbanizing China: Insights from national land surveys, 1996–2006. Habitat Int. 2015, 46, 13–22. [Google Scholar] [CrossRef]
  2. Gao, J.L.; Wei, Y.D.; Chen, W.; Chen, J.L. Economic transition and urban land expansion in provincial China. Habitat Int. 2014, 44, 461–473. [Google Scholar] [CrossRef]
  3. Gong, J.Z.; Chen, W.L.; Liu, Y.S.; Wang, J.Y. The intensity change of urban development land: Implications for the city master plan of Guangzhou, China. Land Use Policy 2014, 40, 91–100. [Google Scholar] [CrossRef]
  4. Ministry of Housing and Urban-Rural Development, P.R. China. China Urban Construction Statistical Yearbook; China Planning Press: Beijing, China, 2001. (In Chinese) [Google Scholar]
  5. Deng, X.Z.; Huang, J.K.; Rozelle, S.; Uchida, E. Growth, population and industrialization, and urban land expansion of China. J. Urban Econ. 2008, 63, 96–115. [Google Scholar] [CrossRef]
  6. Han, J.; Hayashi, Y.; Cao, X.; Imura, H. Application of an integrated system dynamics and cellular automata model for urban growth assessment: A case study of Shanghai, China. Landsc. Urban Plan. 2009, 91, 133–141. [Google Scholar] [CrossRef]
  7. Liu, J.Y.; Zhan, J.Y.; Deng, X.Z. Spatio-temporal patterns and driving forces of urban land expansion in China during the economic reform era. Ambio 2005, 34, 450–455. [Google Scholar] [CrossRef] [PubMed]
  8. Ma, Y.L.; Xu, R.S. Remote sensing monitoring and driving force analysis of urban expansion in Guangzhou City, China. Habitat Int. 2010, 34, 228–235. [Google Scholar] [CrossRef]
  9. Seto, K.C.; Fragkias, M.; Guneralp, B.; Reilly, M.K. A meta-analysis of global urban land expansion. PLoS ONE 2011, 6, 1–9. [Google Scholar] [CrossRef] [PubMed]
  10. Seto, K.C.; Kaufmann, R.K. Modeling the drivers of urban land use change in the Pearl River Delta, China: Integrating remote sensing with socioeconomic data. Land Econ. 2003, 79, 106–121. [Google Scholar] [CrossRef]
  11. Tan, M.H.; Li, X.B.; Lu, C.H. Urban land expansion and arable land loss of the major cities in China in the 1990s. Sci. China Ser. D 2005, 48, 1492–1500. [Google Scholar] [CrossRef]
  12. National Bureau of Statistics of China. China Statistical Yearbook; China Statistics Press: Beijing, China, 2011. (In Chinese)
  13. Population Census Office under the State Council Department of Population and Employment Statistics, National Bureau of Statistics. Tabulation on the Population Census of the People’s Republic of China; China Statistics Press: Beijing, China, 2000. (In Chinese)
  14. Deng, X.; Huang, J.; Rozelle, S.; Zhang, J.; Li, Z. Impact of urbanization on cultivated land changes in China. Land Use Polic. 2015, 45, 1–7. [Google Scholar] [CrossRef]
  15. Liu, J.; Kuang, W.; Zhang, Z.; Xu, X.; Qin, Y.; Ning, J.; Zhou, W.; Zhang, S.; Li, R.; Yan, C.; et al. Spatiotemporal characteristics, patterns, and causes of land-use changes in China since the late 1980s. J. Geogr. Sci. 2014, 24, 195–210. [Google Scholar] [CrossRef]
  16. Wang, L.; Li, C.; Ying, Q.; Cheng, X.; Wang, X.; Li, X.; Hu, L.; Liang, L.; Yu, L.; Huang, H.; et al. China’s urban expansion from 1990 to 2010 determined with satellite remote sensing. Chin. Sci. Bull. 2012, 57, 2802–2812. [Google Scholar] [CrossRef]
  17. Yang, H.; Huang, X.J.; Thompson, J.R.; Flower, R.J. China’s soil pollution: Urban brownfields. Science 2014, 344, 691–692. [Google Scholar] [CrossRef] [PubMed]
  18. Han, L.J.; Zhou, W.Q.; Li, W.F. City as a major source area of fine particulate (PM2.5) in China. Environ. Pollut. 2015, 206, 183–187. [Google Scholar] [CrossRef] [PubMed]
  19. Liao, J.B.; Wang, T.J.; Jiang, Z.Q.; Zhuang, B.L.; Xie, M.; Yin, C.; Wang, X.; Zhua, J.; Fua, Y.; Zhang, Y.; et al. WRF/Chem modeling of the impacts of urban expansion on regional climate and air pollutants in Yangtze River Delta, China. Atmos. Environ. 2015, 106, 204–214. [Google Scholar] [CrossRef]
  20. Ma, L.; Guo, J.H.; Velthof, G.L.; Li, Y.M.; Chen, Q.; Ma, W.; Oenema, O.; Zhang, F. Impacts of urban expansion on nitrogen and phosphorus flows in the food system of Beijing from 1978 to 2008. Glob. Environ. Chang. 2014, 28, 192–204. [Google Scholar] [CrossRef]
  21. Cui, L.L.; Shi, J. Urbanization and its environmental effects in Shanghai, China. Urban Clim. 2012, 2, 1–15. [Google Scholar] [CrossRef]
  22. Zhang, H.; Qi, Z.; Ye, X.; Cai, Y.; Ma, W.; Chen, M. Analysis of land use/land cover change, population shift, and their effects on spatiotemporal patterns of urban heat islands in metropolitan Shanghai, China. Appl. Geogr. 2013, 44, 121–133. [Google Scholar] [CrossRef]
  23. Zhao, S.Q.; Da, L.J.; Tang, Z.Y.; Fang, H.J.; Song, K.; Fang, J. Ecological consequences of rapid urban expansion: Shanghai, China. Front. Ecol. Environ. 2006, 4, 341–346. [Google Scholar] [CrossRef]
  24. Caprotti, F. Critical research on eco-cities? A walk through the Sino-Singapore Tianjin Eco-City, China. Cities 2014, 36, 10–17. [Google Scholar] [CrossRef]
  25. Li, Y. Low carbon eco-city: New approach for Chinese urbanization. Habitat Int. 2014, 44, 102–110. [Google Scholar]
  26. Bai, X.M.; Imura, F. A comparative study of urban environment in East Asia: Stage model of urban environmental evolution. Int. Rev. Environ. Strateg. 2000, 1, 135–158. [Google Scholar]
  27. Guneralp, B.; Seto, K.C. Environmental impacts of urban growth from an integrated dynamic perspective: A case study of Shenzhen, South China. Glob. Environ. Chang. 2008, 18, 720–735. [Google Scholar] [CrossRef]
  28. Xu, X.L.; Min, X.B. Quantifying spatiotemporal patterns of urban expansion in China using remote sensing data. Cities 2013, 35, 104–113. [Google Scholar] [CrossRef]
  29. Pacione, M. Urban environmental quality and human wellbeing—A social geographical perspective. Landsc. Urban Plan. 2003, 65, 19–30. [Google Scholar] [CrossRef]
  30. Van Kamp, I.; Leidelmeijer, K.; Marsman, G.; de Hollander, A. Urban environmental quality and human well-being towards a conceptual framework and demarcation of concepts; a literature study. Landsc. Urban Plan. 2003, 65, 5–18. [Google Scholar] [CrossRef]
  31. Nichol, J.; Wong, M.S. Modeling urban environmental quality in a tropical city. Landsc. Urban Plan. 2005, 73, 49–58. [Google Scholar] [CrossRef]
  32. Guo, Y.; Wang, H.; Nijkamp, P.; Xu, J. Space-time indicators in interdependent urban—Environmental systems: A study on the Huai River Basin in China. Habitat Int. 2015, 45, 135–146. [Google Scholar] [CrossRef]
  33. Walmsley, A. Greenways: Multiplying and diversifying in the 21st century. Landsc. Urban Plan. 2006, 76, 252–290. [Google Scholar] [CrossRef]
  34. Kabisch, N.; Qureshi, S.; Haase, D. Human–environment interactions in urban green spaces—A systematic review of contemporary issues and prospects for future research. Environ. Impact Asses. Rev. 2015, 50, 25–34. [Google Scholar] [CrossRef]
  35. Anderson, S.T.; West, S.E. Open space, residential property values, and spatial context. Reg. Sci. Urban Econ. 2006, 36, 773–789. [Google Scholar] [CrossRef]
  36. Sander, H.A.; Zhao, C. Urban green and blue: Who values what and where? Land Use Policy 2015, 42, 194–209. [Google Scholar] [CrossRef]
  37. Ibes, D.C. A multi-dimensional classification and equity analysis of an urban park system: A novel methodology and case study application. Landsc. Urban Plan. 2015, 137, 122–137. [Google Scholar] [CrossRef]
  38. Wolch, J.R.; Byrne, J.; Newell, J.P. Urban green space, public health, and environmental justice: The challenge of making cities “just green enough”. Landsc. Urban Plan. 2014, 125, 234–244. [Google Scholar] [CrossRef]
  39. Matthews, T.; Lo, A.Y.; Byrne, J.A. Reconceptualizing green infrastructure for climate change adaptation: Barriers to adoption and drivers for uptake by spatial planners. Landsc. Urban Plan. 2015, 138, 155–163. [Google Scholar] [CrossRef]
  40. Brueckner, J.K. Urban sprawl: Diagnosis and remedies. Int. Reg. Sci. Rev. 2000, 23, 160–171. [Google Scholar] [CrossRef]
  41. Barlowe, R. Land Resource Economics: The Economics of Real Estate, 3rd ed.; Prentice-Hall: Englewood Cliffs, NJ, USA, 1978. [Google Scholar]
  42. Li, Y.H.; Chen, C.; Wang, Y.F. Urban-rural transformation and farm land conversion in China: The application of the environmental Kuznets Curve. J. Rural Stud. 2014, 36, 311–317. [Google Scholar] [CrossRef]
  43. Borba, M.L.; Smct, J.; Sijibcsma, C. Enhancing Livelihoods through Sanitation; Thematic Overview Paper 19; IRC International Water and Sanitation Center: CW Delf, The Netherlands, 2007. [Google Scholar]
  44. Langergraber, G.; Muellegger, E. Ecological Sanitation—A way to solve global sanitation problems? Environ. Int. 2005, 31, 433–444. [Google Scholar] [CrossRef] [PubMed]
  45. Zhang, D.Q.; Tan, S.K.; Gersberg, R.M. Municipal solid waste management in China: Status, problems and challenges. J. Environ. Manag. 2010, 91, 1623–1633. [Google Scholar] [CrossRef] [PubMed]
  46. Chen, X.D.; Geng, Y.; Fujita, T. An overview of municipal solid waste management in China. Waste Manag. 2010, 30, 716–724. [Google Scholar] [CrossRef] [PubMed]
  47. Shafik, N. Economic development and environmental quality: An econometric analysis. Oxf. Econo. Pap. 1994, 46, 757–773. [Google Scholar]
  48. Allen, A.; Dávila, J.D.; Hofmann, P. Governance of Water and Sanitation Services for the Peri-Urban Poor: A Framework for Understanding and Action in Metropolitan Regions; Jenner City Print Ltd.: Essex, UK, 2006. [Google Scholar]
  49. Department of Comprehensive Statistics and Department of Rural Survey of National Bureau of Statistics. China Statistical Yearbook for Regional Economy; China Statistics Press: Beijing, China, 2011. (In Chinese)
  50. Tzoulas, K.; Korpela, K.; Venn, S.; Yli-Pelkonen, V.; Kaźmierczak, A.; Niemelac, J.; James, P. Promoting ecosystem and human health in urban areas using green infrastructure: A literature review. Landsc. Urban Plan. 2007, 81, 167–178. [Google Scholar] [CrossRef]
  51. Andersson, E.; Barthel, S.; Borgstrom, S.; Colding, J.; Elmqvist, T.; Folke, C.; Gren, Å. Reconnecting cities to the biosphere: Stewardship of green infrastructure and urban ecosystem services. AMBIO 2014, 43, 445–453. [Google Scholar] [CrossRef] [PubMed]
  52. Brown, G. A theory of urban park geography. J. Leis. Res. 2008, 40, 589–607. [Google Scholar]
  53. Cavan, G.; Lindley, S.; Jalayer, F.; Yeshitela, K.; Pauleit, S.; Renner, F.; Gill, S.; Capuano, P.; Nebeb, A.; Woldegerima, T.; et al. Urban morphological determinants of temperature regulating ecosystem services in two African cities. Ecol. Indic. 2014, 42, 43–57. [Google Scholar] [CrossRef]
  54. Derkzen, M.L.; van Teeffelen, A.J.A.; Verburg, P.H. Quantifying urban ecosystem services based on high resolution data of urban green space: An assessment for Rotterdam, the Netherlands. J. Appl. Ecol. 2015, 52, 1020–1032. [Google Scholar] [CrossRef]
  55. Bai, X.R.; Tang, J.C. Ecological security assessment of Tianjin by PSR Model. Procedia Environ. Sci. 2010, 2, 881–887. [Google Scholar] [CrossRef]
  56. Jiang, Y.H.; Shen, J.F. Measuring the urban competitiveness of Chinese cities in 2000. Cities 2010, 27, 307–314. [Google Scholar] [CrossRef]
  57. Shen, L.Y.; Zhou, J.Y. Examining the effectiveness of indicators for guiding sustainable urbanization in China. Habitat Int. 2014, 44, 111–120. [Google Scholar] [CrossRef]
  58. Shen, L.Y.; Zhou, J.Y.; Skitmore, M.; Xia, B. Application of a hybrid Entropy–McKinsey Matrix method in evaluating sustainable urbanization: A China case study. Cities 2015, 42, 186–194. [Google Scholar] [CrossRef]
  59. Zhou, N.; He, G.; Williams, C.; Fridley, D. ELITE cities: A low-carbon eco-city evaluation tool for China. Ecol. Indic. 2015, 48, 448–456. [Google Scholar] [CrossRef]
  60. Shen, L.Y.; Ochoa, J.J.; Shah, M.N.; Zhang, X.L. The application of urban sustainability indicators—A comparison between various practices. Habitat Int. 2011, 35, 17–29. [Google Scholar] [CrossRef]
  61. Zhang, X.L.; Wu, Y.Z.; Shen, L.Y. An evaluation framework for the sustainability of urban land use: A study of capital cities and municipalities in China. Habitat Int. 2011, 35, 141–149. [Google Scholar] [CrossRef]
  62. Hao, J.; Wang, L. Improving urban air quality in China: Beijing case study. J. Air Waste Manag. Assoc. 2005, 55, 1298–1305. (In Chinese) [Google Scholar] [CrossRef] [PubMed]
  63. Han, B.L.; Liu, H.X.; Wang, R.S. Urban ecological security assessment for cities in the Beijing–Tianjin–Hebei metropolitan region based on fuzzy and entropy methods. Ecol. Model. 2015, 318, 217–225. [Google Scholar] [CrossRef]
  64. Ye, L.; Wu, A.M. Urbanization, land development, and land financing: Evidence from Chinese cities. J. Urban Aff. 2014, 36, 354–368. [Google Scholar] [CrossRef]
  65. PUTRLI Research Group. The process of urbanization in the transfer of rural labor: Strategic and policy choice. Econ. Chin. Countrys. 2011, 6, 4–14. (In Chinese) [Google Scholar]
  66. Cai, F. Demographic transition, demographic dividend, and Lewis turning point in China. China Econ. J. 2010, 3, 107–119. [Google Scholar] [CrossRef]
  67. Cai, F.; Du, Y. Wage increases, wage convergence, and the Lewis turning point in China. China Econ. Rev. 2011, 22, 601–610. [Google Scholar] [CrossRef]
  68. Zhang, X.; Yang, J.; Wang, S. China has reached the Lewis turning point. China Econ. Rev. 2011, 22, 542–554. [Google Scholar] [CrossRef]
  69. He, J.X.; Shu, H.Y.; Tian, Y. Study on calculation of rural labor force transfer in China and influential factors. China Popul. Resour. Environ. 2011, 21, 148–152. (In Chinese) [Google Scholar]
  70. Guo, S.; Shen, G.Q.P.; Chen, Z.M.; Yu, R. Embodied cultivated land use in China 1987–2007. Ecol. Indic. 2014, 47, 198–209. [Google Scholar] [CrossRef]
  71. Knight, J.; Deng, Q.H.; Li, S. The puzzle of migrant labour shortage and rural labour surplus in China. China Econ. Rev. 2011, 22, 585–600. [Google Scholar] [CrossRef]
  72. Lu, C.; Wu, Y.Z.; Shen, Q.P.; Wang, H. Driving force of urban growth and regional planning: A case study of China’s Guangdong Province. Habitat Int. 2013, 40, 35–41. [Google Scholar] [CrossRef]
  73. Chen, H.; Jia, B.; Lau, S.S.Y. Sustainable urban form for Chinese compact cities: Challenges of a rapid urbanized economy. Habitat Int. 2008, 32, 28–40. [Google Scholar] [CrossRef]
  74. Zhao, J.; Song, Y.; Tang, L.; Shi, L.; Shao, G. China’s cities need to grow in a more compact way. Environ. Sci. Technol. 2011, 45, 8607–8608. (In Chinese) [Google Scholar] [CrossRef] [PubMed]
Figure 1. Urban population growth and urban construction land expansion in the prefectural cities, China, 2000–2010. (a) Urban population growth (104); (b) Urban construction land expansion (km2).
Ijerph 13 00535 g001
Figure 2. Provinces and the prefectural cities in China. (a) Provinces in China; (b) The prefectural cities in China.
Ijerph 13 00535 g002
Figure 3. Environmental benefits of urban land use in the prefectural cities, China, 2000 and 2010. (a) Environmental benefits of urban land use in the prefectural cities, China, 2000; (b) Environmental benefits of urban land use in the prefectural cities, China, 2010.
Ijerph 13 00535 g003aIjerph 13 00535 g003b
Figure 4. Change in environmental benefits of urban land use in the prefectural cities, China, 2000–2010. (a) Change in ebu (environmental benefits of urban land use) in the prefectural cities, China, 2000–2010; (b) Change in ebugi (environmental benefits of green infrastructure) in the prefectural cities, China, 2000–2010; (c) Change in ebudi (environmental benefits from industrial upgrade) in the prefectural cities, China, 2000–2010; (d) Change in ebuma (environmental benefits from environmental management) in the prefectural cities, China, 2000–2010.
Ijerph 13 00535 g004aIjerph 13 00535 g004b
Figure 5. Per capita urban construction land area in the prefectural cities, China, 2000 and 2010. (a) Per capita urban construction land area in the prefectural cities, China, 2000; (b) Per capita urban construction land area in the prefectural cities, China, 2010.
Ijerph 13 00535 g005
Figure 6. Land urbanization in the prefectural cities, China, 2000 and 2010. (a) Land urbanization in the prefectural cities, China, 2000; (b) Land urbanization in the prefectural cities, China, 2010.
Ijerph 13 00535 g006aIjerph 13 00535 g006b
Table 1. Assessment index system of environmental benefits of urban land use.
Standard LayerIndexSignDefinitionUnit
Green infrastructureArea of parks and green space per capita+The ratio of area of parks and green space to urban populationm2
Density of parks and green space+The ratio of area of parks and green space to area of built district%
Park size+The ratio of park area to number of parkshm2
Industrial upgradeDensity of industrial land-The ratio of industrial land area to urban construction land area%
Density of industrial SO2 discharged-The ratio of volume of industrial SO2 discharged to urban construction land areat/km2
Rate of discharged industrial wastewater meeting national standard+The ratio of volume of discharged industrial wastewater meeting national standard to volume of industrial wastewater discharged%
Environmental managementProportion of urban maintenance and construction fund invested in environmental expenditure+The ratio of expenditure fund for sewerage, landscaping and environmental sanitation to the total expenditure of urban maintenance and construction fund%
Intensity of urban maintenance and construction fund invested in environmental expenditure+The ratio of expenditure fund for sewerage, landscaping and environmental sanitation to urban construction land area104 yuan per km2
Disposal rate of domestic harmless garbage+The ratio of volume of domestic garbage harmless treated to volume of domestic garbage treated%
Data sources: Volume of industrial SO2 discharged, volume of industrial wastewater discharged meeting national standard, and volume of industrial wastewater discharged were obtained from China City Statistical Yearbook; urban population and total population were obtained from Tabulation on The Population Census of The People’s Republic of China; per capita disposable income of urban households was obtained from China Statistical Yearbook for Regional Economy, and corrected by price index; and all the other data were obtained from China Urban Construction Statistical Yearbook. “+” means value of the index is positively related to environmental benefits of urban land use, and vice versa.
Table 2. Definition of independent variables.
VariableDefinitionUnit
Per capita incomepciPer capita disposable income of urban households104 yuan
Urban populationaupSize of urban population104
Per capita urban construction land areapcuclThe ratio of urban construction land area to amount of urban populationm2
Demographic urbanizationduThe ratio of amount of urban population to total amount of population%
Land urbanizationluThe ratio of urban construction land area to total land area%
Data sources: pci was obtained from China Statistical Yearbook for Regional Economy was corrected by price index; other variables were obtained from the same data sources as shown in Table 1.
Table 3. Change in environmental benefits of urban land use, 2000–2010.
CitiesNumberAverage IncreaseContribution (%)
ebuebugiebudiebumaebugiebudiebuma
The whole prefectural cities3470.6380.2790.1510.20843.68223.69232.626
The RD cities810.4230.2600.0710.09261.58416.77521.641
The RP cities2660.7030.2840.1750.24440.40324.95834.638
Note: ebu denotes environmental benefits of urban land use; ebugi denotes environmental benefits of green infrastructure; ebudi denotes environmental benefits from industrial upgrade; ebuma denotes environmental benefits from environmental management.
Table 4. Change in environmental benefits of urban land use in Changzhou and Jiujiang, 2000–2010.
CitiesebuIncreaseContribution (%)
20002010ebuebugiebudiebumaebugiebudiebuma
Changzhou4.905.350.460.270.030.1559.207.2133.59
Jiujiang4.625.991.370.680.140.5549.6410.2240.15
Note: ebu denotes environmental benefits of urban land use; ebugi denotes environmental benefits of green infrastructure; ebudi denotes environmental benefits from industrial upgrade; ebuma denotes environmental benefits from environmental management.
Table 5. The original values of assessment indices of environmental benefits of urban land use, Changzhou and Jiujiang.
Standard LayerIndexChangzhouJiujiang
2000201020002010
Green infrastructureArea of parks and green space per capita (m2)19.1928.5428.0874.53
Density of parks and green space (%)28.3441.9228.5554.35
Park size (hm2)8.4621.5624.7841.13
Industrial upgradeDensity of industrial land (%)32.5823.8424.8924.01
Density of industrial SO2 discharged (t/km2)56.1014.2462.503.86
Rate of discharged industrial wastewater meeting national standard (%)96.4099.9871.1092.05
Environmental managementProportion of urban maintenance and construction fund invested in environmental expenditure (%)21.3726.9423.1421.93
Intensity of urban maintenance and construction fund invested in environmental expenditure (104 yuan per km2)2.924.760.5812.81
Disposal rate of domestic harmless garbage (%)84.0598.7939.1179.24
Table 6. Statistical description of variables in 2000 and 2010.
ln(ebu)ln(pci)ln(aup)ln(pcucl)ln(du)ln(lu)
2000Mean1.548.634.034.303.91−1.01
Median1.558.594.064.283.94−0.79
Maximum1.859.987.266.024.613.18
Minimum1.258.080.821.982.21−5.31
Std. Dev.0.080.271.100.450.431.44
Observations347347347347347347
2010Mean1.679.694.314.594.07−0.47
Median1.679.654.314.564.08−0.36
Maximum1.9510.487.616.314.613.71
Minimum1.469.021.253.203.13−4.74
Std. Dev.0.070.231.090.370.301.47
Observations347347347347347347
Table 7. Regression result of change in environmental benefits of urban land use.
Variable20002010
CoefficientStd. Errort-StatisticCoefficientStd. Errort-Statistic
Constant−0.0620.030−2.046−0.6210.033−18.932
ln(pci)0.1610.00444.7440.2130.00361.873
ln(aup)0.0760.0089.5060.3030.00555.644
ln(pcucl)−0.0080.001−16.0410.0200.00121.401
ln(du)0.0530.00142.8100.0510137.783
ln(lu)−0.0020−5.457−0.0090−48.689
ln(pciln(aup)−0.0080.001−8.610−0.0330.001−52.164
R20.995R20.994
Note: The independent variables are all significant at the 0.05 level.

