
Accuracy of Body Mass Index Cutoffs for Classifying Obesity in Chilean Children and Adolescents


 , and
, and
Abstract
:1. Introduction
2. Methods
2.1. Sample
2.2. Data Collection
2.3. BMI Classification and Outcome Variables
2.4. Classification of the Z-Score
2.5. Statistical Analysis
3. Results
4. Discussion
5. Conclusions
Acknowledgments
Author Contributions
Conflicts of Interest
References
- Ng, M.; Fleming, T.; Robinson, M.; Thomson, B.; Graetz, N.; Margono, C.; Mullany, E.C.; Biryukov, S.; Abbafati, C.; Abera, S.F.; et al. Global, regional, and national prevalence of overweight and obesity in children and adults during 1980–2013: A systematic analysis for the Global Burden of Disease Study 2013. Lancet 2014, 384, 766–781. [Google Scholar] [CrossRef]
- Rivera, J.A.; González de Cossío, T.; Pedraza, L.S.; Cony-Aburto, T.; Georgina-Sánchez, T.; Martorell, R. Childhood and adolescent overweight and obesity in Latin America: A systematic review. Lancet Diabetes Endocrinol. 2014, 2, 321–332. [Google Scholar] [CrossRef]
- WHO. Overview–Preventing Chronic Diseases: A Vital Investment. WHO Global Report, 2015. Avaliable online: http://www.who.int/chp/chronic_disease_report/en/ (accessed on 15 January 2016).
- WHO. Mean Body Mass Index (BMI)—Situation and Trends. Global Health Observatory (GHO) Data. 2015. Avaliable online: http://www.who.int/gho/ncd/risk_factors/bmi_text/en/ (accessed on 28 December 2015).
- Burrows, R.A.; Leiva, L.B.; Weisstaub, G.; Lera, L.M.; Albala, C.B.; Blanco, E.; Gahagan, S. High HOMA-IR, adjusted for puberty, relates to the metabolic syndrome in overweight and obese Chilean youths. Pediatr. Diabetes 2011, 12, 212–218. [Google Scholar] [CrossRef] [PubMed]
- Raj, M.; Kumar, R.K. Obesity in children & adolescents. Indian J. Med. Res. 2010, 132, 598–607. [Google Scholar] [PubMed]
- Gonzalez Jimenez, E.; Aguilar Cordero, M.J.; Garcia Garcia, C.J.; Garcia Lopez, P.A.; Alvarez, F.J.; Padilla Lopez, C.A. Prevalence of nutritional overweight and obesity and hypertension as well as their relationship with anthropometric indicators in a population of students in Granada and its provinces. Nutr. Hosp. 2011, 26, 1004–1010. [Google Scholar] [PubMed]
- Gupta, N.; Goel, K.; Shah, P.; Misra, A. Childhood obesity in developing countries: Epidemiology, determinants, and prevention. Endocr. Rev. 2012, 33, 48–70. [Google Scholar] [CrossRef] [PubMed]
- Stang, J.; Story, M. Adolescent Growth and development. In Guidelines for Adolescent Nutrition Services; University of Minnesota: Minneapolis, MN, USA, 2005; pp. 1–8. [Google Scholar]
- Must, A.; Anderson, S.E. Body mass index in children and adolescents: Considerations for population-based applications. Int. J. Obes. 2006, 30, 590–594. [Google Scholar] [CrossRef] [PubMed]
- Reilly, J.J. Diagnostic accuracy of the BMI for age in paediatrics. Int. J. Obes. 2006, 30, 595–597. [Google Scholar] [CrossRef] [PubMed]
- Cole, T.J.; Lobstein, T. Extended international (IOTF) body mass index cut-offs for thinness, overweight and obesity. Pediatr. Obes. 2012, 7, 284–294. [Google Scholar] [CrossRef] [PubMed]
- De Onis, M. Development of A WHO Growth Reference for School-Aged Children and Adolescents. Bull. World Health Organ. 2007, 85, 660–667. [Google Scholar] [CrossRef] [PubMed]
- Must, A.; Dallal, G.E.; Dietz, W.H. Reference data for obesity: 85th and 95th percentiles of body mass index (wt/ht2) and triceps skinfold thickness. Am. J. Clin. Nutr. 1991, 53, 839–846. [Google Scholar] [PubMed]
- Cadossi, R.; Canè, V. Pathways of transmission of ultrasound energy through the distal metaphysis of the second phalanx of pigs: An in vitro study. Osteoporos Int. 1996, 6, 196–206. [Google Scholar] [CrossRef] [PubMed]
- Schtscherbyna, A.; Pinheiro, M.F.; Mendonça, L.M.; Gouveia, C.; Luiz, R.R.; Machado, E.S.; Farias, M.L. Factors associated with low bone mineral density in a Brazilian cohort of vertically HIV-infected adolescents. Int. J. Infect. Dis. 2012, 16, e872–e878. [Google Scholar] [CrossRef] [PubMed]
- International Society for Advancement of Kinanthropometry. In International Standards for Anthropometric Assessment; International Society for the Advancement of Kinanthropometry (ISAK): Potchefstroom, South Africa, 2001.
- De Onis, M.; Lobstein, T. Defining obesity risk status in the general childhood population: Which cut-offs should we use? Int. J. Pediatr. Obes. 2010, 5, 458–460. [Google Scholar] [CrossRef] [PubMed]
- Ogden, C.L.; Li, Y.; Freedman, D.S. Smoothed percentage body fat percentiles for U.S. children and adolescents, 1999–2004. Natl. Health Stat. Rep. 2011, 43, 1–7. [Google Scholar]
- Hesketh, K.; Wake, M.; Waters, E.; Carlin, J.; Crawford, D. Stability of body mass index in Australian children: A prospective cohort study across the middle childhood years. Public Health Nutr. 2004, 7, 303–309. [Google Scholar] [CrossRef] [PubMed]
- Belfort, M.B.; Zupancic, J.A.F.; Riera, K.M.; Turner, J.H.G.; Prosser, L.A. Health state preferences associated with weight status in children and adolescents. BMC Pediatr. 2011, 11. [Google Scholar] [CrossRef] [PubMed]
- Rhodes, E.T.; Prosser, L.A.; Lieu, T.A.; Songer, T.J.; Ludwig, D.S.; Laffel, L.M. Preferences for type 2 diabetes health states among adolescents with or at risk of type 2 diabetes mellitus. Pediatr. Diabetes 2011, 12, 724–732. [Google Scholar] [CrossRef] [PubMed]
- Finbråten, A.K.; Martins, C.; Andersen, G.L.; Skranes, J.; Brannsether, B.; Júlíusson, P.B.; Syversen, U.; Stevenson, R.D.; Vik, T. Assessment of body composition in children with cerebral palsy: A cross-sectional study in Norway. Dev. Med. Child Neurol. 2015, 57, 858–864. [Google Scholar] [CrossRef] [PubMed]
- Bell, L.M.; Byrne, S.; Thompson, A.; Ratnam, N.; Blair, E.; Bulsara, M.; Jones, T.W.; Davis, E.A. Increasing body mass index Z-score is continuously associated with complications of overweight in children, even in the healthy weight range. J. Clin. Endocrinol. Metab. 2007, 92, 517–522. [Google Scholar] [CrossRef] [PubMed]
- Holmes, M.V.; Lange, L.A.; Palmer, T.; Lanktree, M.B.; North, K.E.; Almoguera, B.; Buxbaum, S.; Chandrupatla, H.R.; Elbers, C.C.; Guo, Y.; et al. Causal effects of body mass index on cardiometabolic traits and events: A Mendelian randomization analysis. Am. J. Hum. Genet. 2014, 94, 198–208. [Google Scholar] [CrossRef] [PubMed]
- Rudolf, M.C.; Krom, A.J.; Cole, T.J. How good are BMI charts for monitoring children’s attempts at obesity reduction? Arch. Dis. Child. 2012, 97, 418–422. [Google Scholar] [CrossRef] [PubMed]
- Farias, J.C., Jr.; Konrad, L.M.; Rabacow, F.M.; Grup, S.; Araújo, V.D. Sensitivity and specificity of criteria for classifying body mass index in adolescents. Rev. Saude Publica 2009, 43, 53–59. [Google Scholar] [PubMed]
- WHO. Physical Status: The Use and Interpretation of Anthropometry World Health Organization; WHO Expert Committee: Geneva, Switzerland, 1995. [Google Scholar]
- Cole, T.J.; Bellizzi, M.C.; Flegal, K.M.; Dietz, W.H. Establishing a standard definition for child overweight and obesity worldwide: International survey. BMJ Br. Med. J. 2000, 320. [Google Scholar] [CrossRef]
- Kuczmarski, R.J.; Ogden, C.L.; Guo, S.S.; Grummer-Strawn, L.M.; Flegal, K.M.; Mei, Z.; Wei, R.; Curtin, L.R.; Roche, A.F.; Johnson, C.L. 2000 CDC Growth Charts for the United States: Methods and development. Vital Health Stat. 2002, 11, 1–190. [Google Scholar]
- Conde, W.L.; Monteiro, C.A. Body mass index cutoff points for evaluation of nutritional status in Brazilian children and adolescents. J. Pediatr. 2006, 82, 266–272. [Google Scholar] [CrossRef]
- Taylor, R.W.; Grant, A.M.; Williams, S.M.; Goulding, A. Sex differences in regional body fat distribution from pre- to postpuberty. Obesity 2010, 18, 1410–1416. [Google Scholar] [CrossRef] [PubMed]
- Cossio-Bolaños, M.A.; Gómez-Campos, R.; Lee-Andruske, C.; Viveros-Flores, A.; Luarte-Rocha, C.; Olivares, P.; Garcia-Rubio, J.; Arruda, M. Physical Growth, Biological Age, and Nutritional Transitions of Adolescents Living at Moderate Altitudes in Peru. Int. J. Environ. Res. Public Health 2015, 12, 12082–12094. [Google Scholar] [CrossRef] [PubMed]


| Variables | TOTAL; n = 280 | BOYS; n = 155 | GIRLS; n = 125 |
|---|---|---|---|
| Median (Minimum–Max) | Median (Minimum–Max) | Median (Minimum–Max) | |
| AGE (years) | 11.2 (8.0–16.9) | 11.3 (11.3–16.9) | 11.1 (8.0–15.2) |
| WEIGHT (kg) | 45.6 (19.9–88.3) | 45.4 (20.0–82.0) | 45.7 (19.9–88.3) |
| HEIGHT (cm) | 145.3 (120.0–177.0) | 145.7 (120.0–177.0) | 143.4 (120.0–166.0) |
| BMI (kg/m2) | 21.1 (12.0–38.2) | 20.9 (12.0–31.6) | 21.3 (12.5–38.2) |
| %FM DXA | 32.8 (13.9–51.7) | 30.7 (13.9–46.4) | 35.4 (17.6–51.7) |
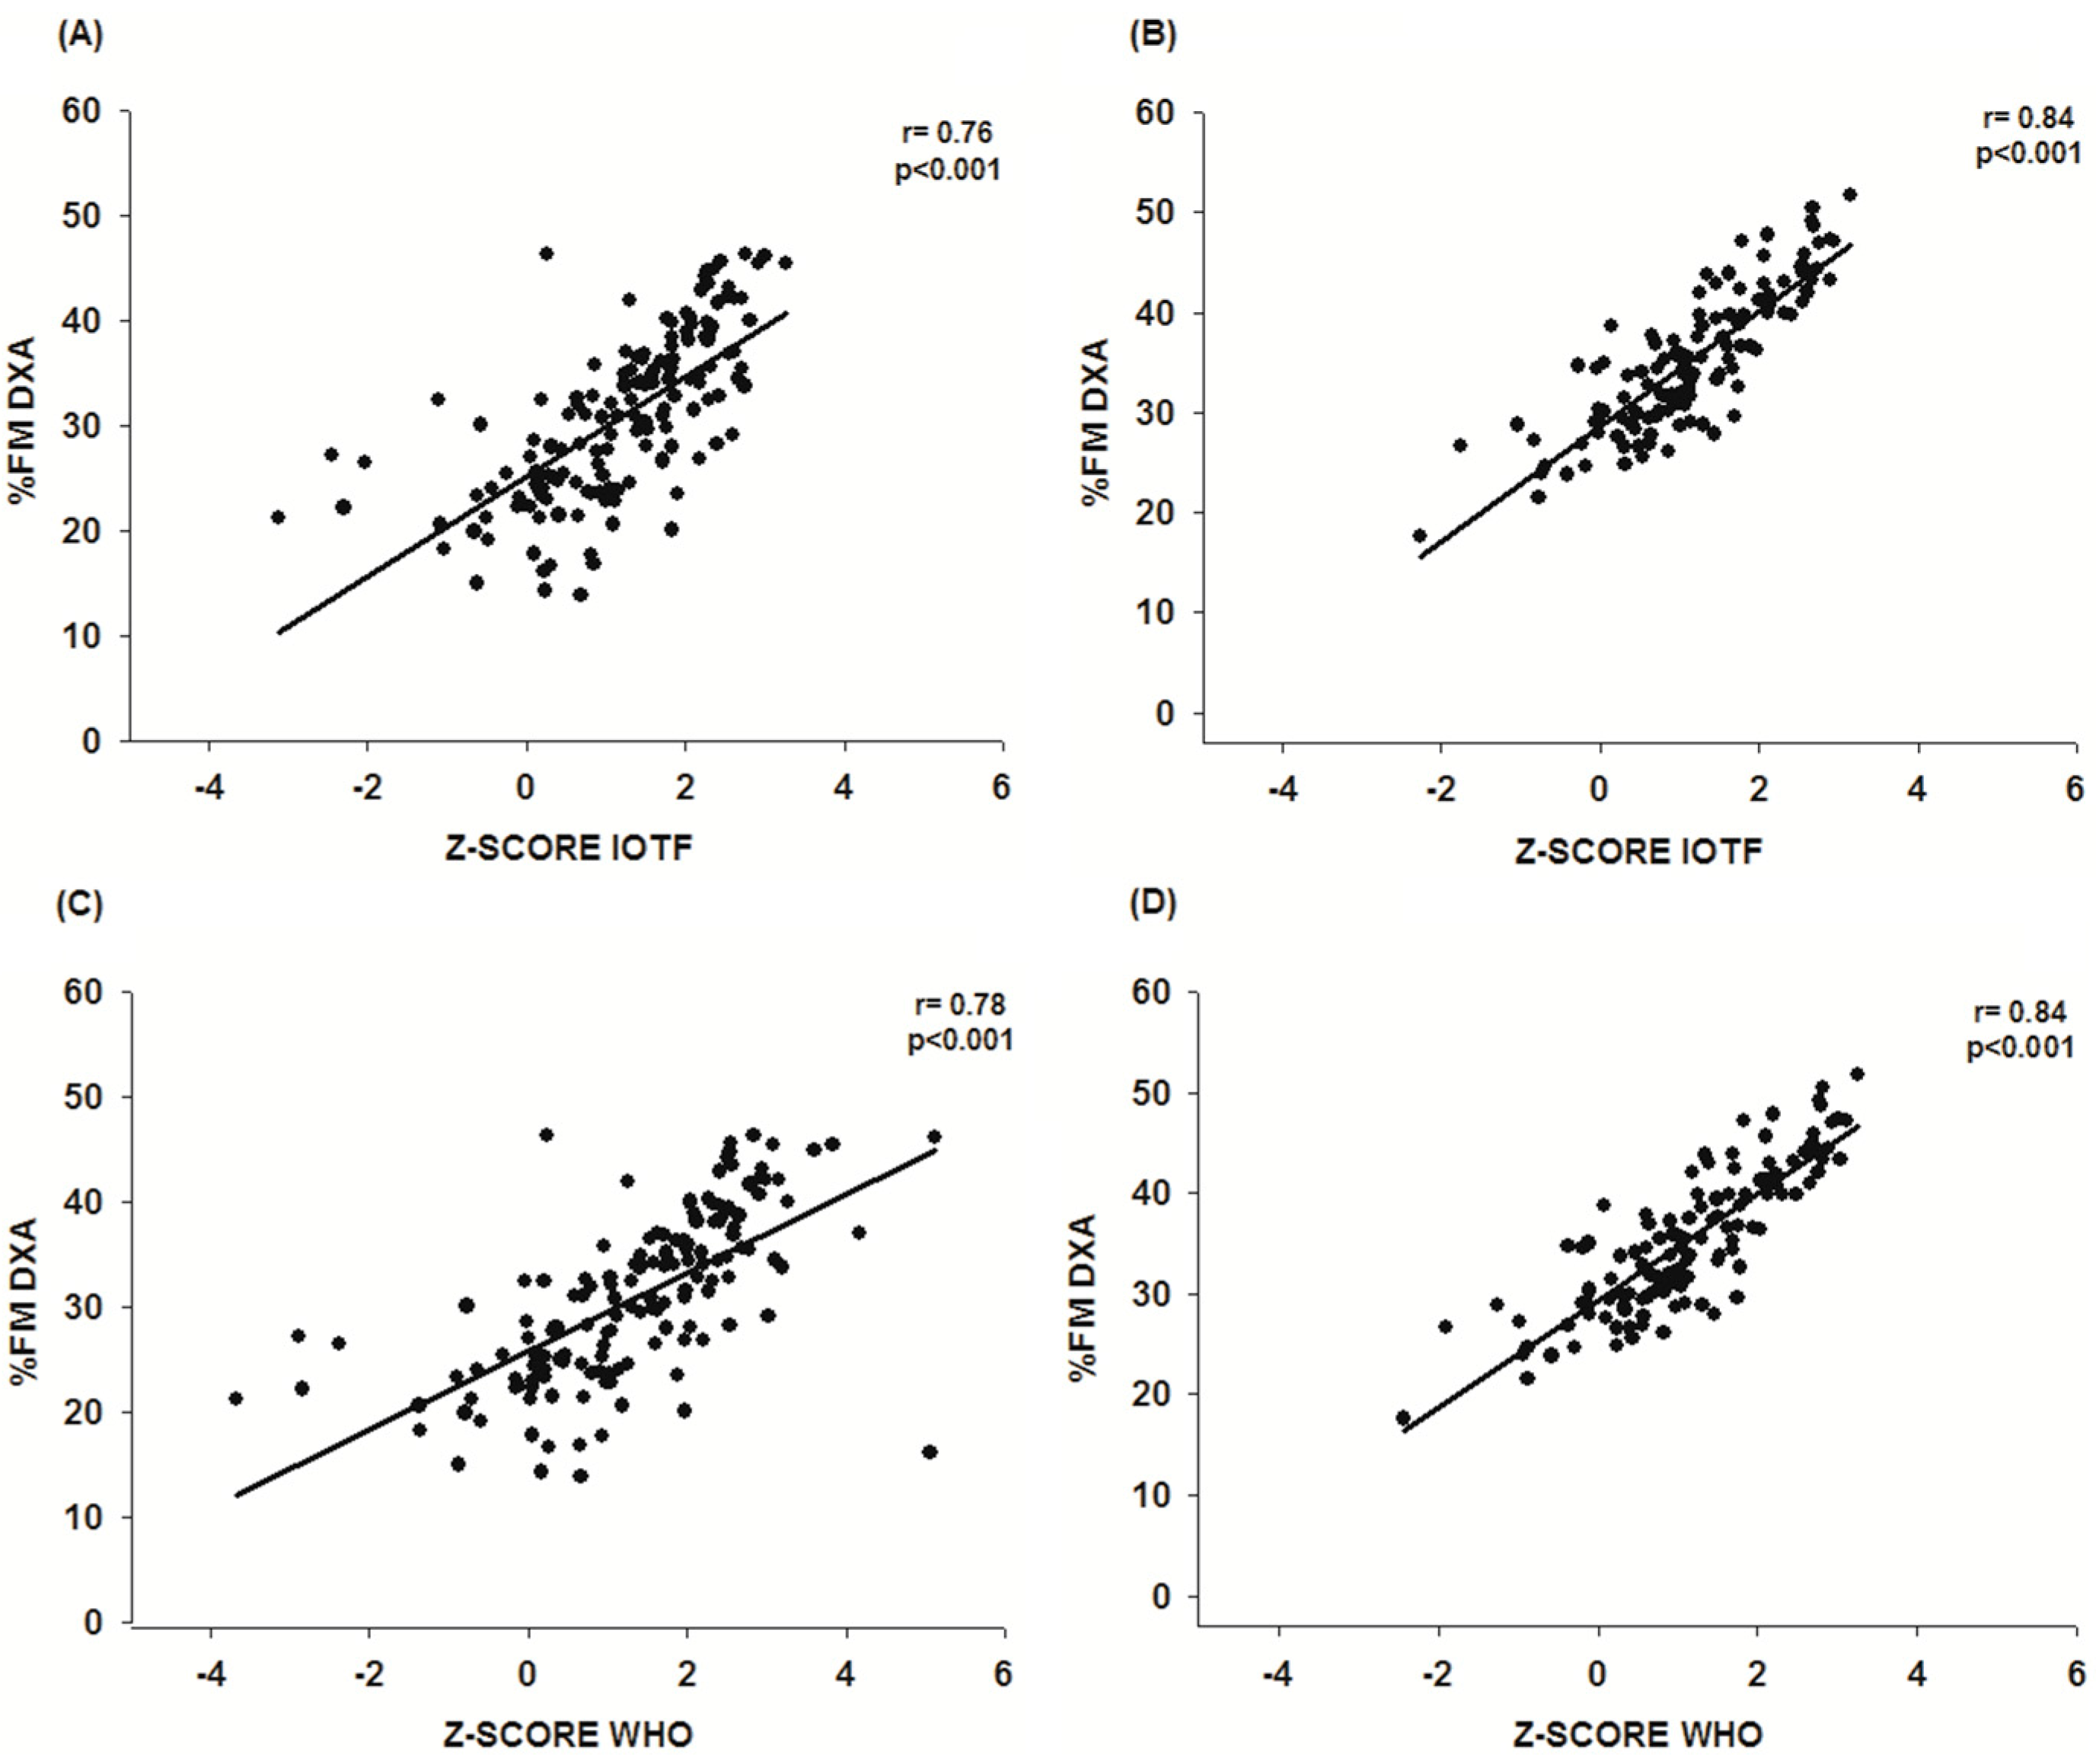
| Z-SCORE IOTF (BMI) | 1.3 (−3.1–3.3) | 1.2 (−3.1–3.3) | 1.5 (−2.3–3.2) |
| Z-SCORE WHO (BMI) | 1.2 (−3.7–5.1) | 1.3 (−3.7–5.1) | 1.2 (−2.4–3.3) |
| BMI Cut Off | Category | %FM DXA | |||||||
|---|---|---|---|---|---|---|---|---|---|
| Boys n = 155 | Girls n = 125 | ||||||||
| Normal n (%) | Obese n (%) | Total | p | Normal n (%) | Obese n (%) | Total | p | ||
| IOTF | Normal | 121 (93.1) | 9 (6.9) | 130 | <0.001 | 95 (91.3) | 9 (8.7) | 104 | <0.001 |
| Obese | 11 (44.0) | 14 (56.0) | 25 | 3 (14.3) | 18 (85.7) | 21 | |||
| WHO | Normal | 101 (98.1) | 2 (1.9) | 103 | <0.001 | 90 (94.7) | 5 (5.3) | 95 | <0.001 |
| Obese | 31 (59.6) | 21 (40.4) | 52 | 8 (26.7) | 22 (73.3) | 30 | |||
| Total | 132 (85.2) | 23 (14.8) | 98 (78.4) | 27 (21.6) | |||||
| References | BOYS | GIRLS | ||||||
|---|---|---|---|---|---|---|---|---|
| CRITERION | AUC (IC 95%) | SENS (%) | SPEC | CRITERION | AUC (IC 95%) | SENS (%) | SPEC | |
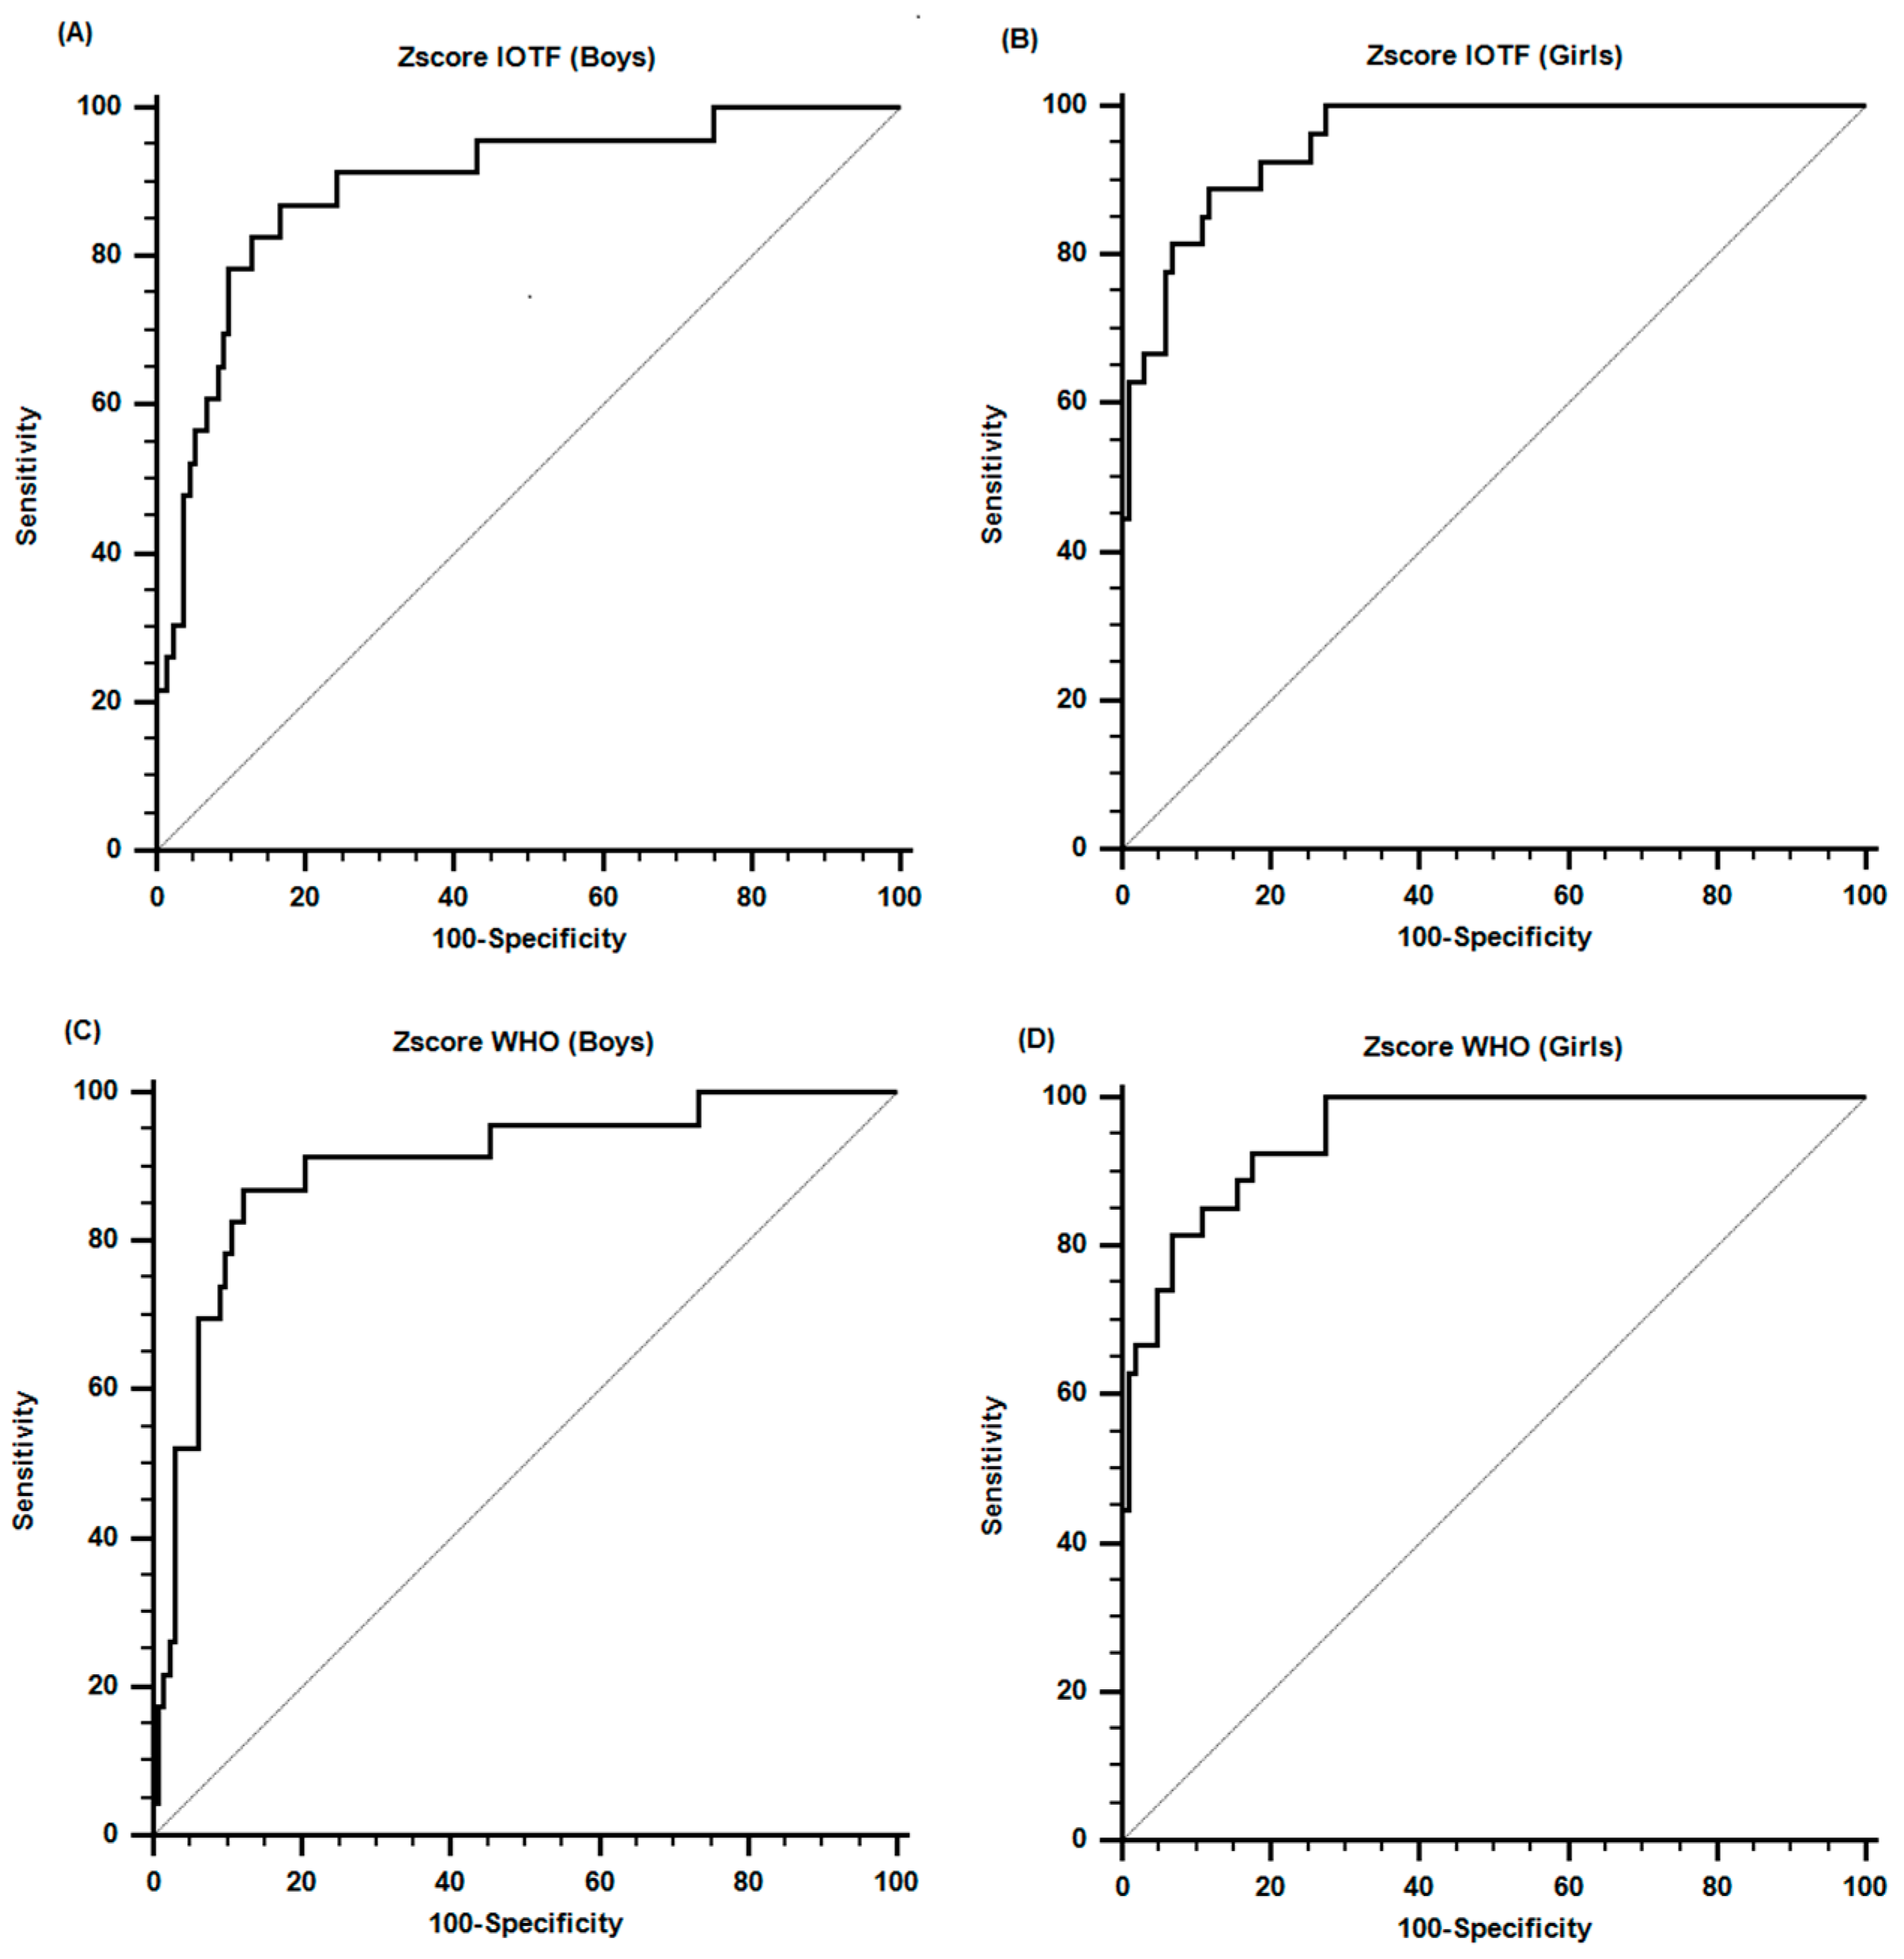
| IOTF | >1.9 | 0.89 (0.83–0.94) | 87.0 | 83.3 | >1.7 | 0.95 (0.90–0.98) | 88.9 | 87.8 |
| WHO | >2.3 | 0.90 (0.84–0.94) | 86.9 | 87.9 | >1.6 | 0.95 (0.90–0.98) | 92.6 | 82.7 |
© 2016 by the authors; licensee MDPI, Basel, Switzerland. This article is an open access article distributed under the terms and conditions of the Creative Commons Attribution (CC-BY) license (http://creativecommons.org/licenses/by/4.0/).
Share and Cite
Gómez-Campos, R.; David Langer, R.; De Fátima Guimarães, R.; Contiero San Martini, M.; Cossio-Bolaños, M.; De Arruda, M.; Guerra-Júnior, G.; Moreira Gonçalves, E. Accuracy of Body Mass Index Cutoffs for Classifying Obesity in Chilean Children and Adolescents. Int. J. Environ. Res. Public Health 2016, 13, 472. https://doi.org/10.3390/ijerph13050472
Gómez-Campos R, David Langer R, De Fátima Guimarães R, Contiero San Martini M, Cossio-Bolaños M, De Arruda M, Guerra-Júnior G, Moreira Gonçalves E. Accuracy of Body Mass Index Cutoffs for Classifying Obesity in Chilean Children and Adolescents. International Journal of Environmental Research and Public Health. 2016; 13(5):472. https://doi.org/10.3390/ijerph13050472
Chicago/Turabian StyleGómez-Campos, Rossana, Raquel David Langer, Roseane De Fátima Guimarães, Mariana Contiero San Martini, Marco Cossio-Bolaños, Miguel De Arruda, Gil Guerra-Júnior, and Ezequiel Moreira Gonçalves. 2016. "Accuracy of Body Mass Index Cutoffs for Classifying Obesity in Chilean Children and Adolescents" International Journal of Environmental Research and Public Health 13, no. 5: 472. https://doi.org/10.3390/ijerph13050472