Article

The Effects of Coarse Particles on Daily Mortality: A Case-Crossover Study in a Subtropical City, Taipei, Taiwan

1
Division of Pulmonary and Critical Medicine, Department of Internal Medicine, Kaohsiung Medical University Hospital, Kaohsiung 807, Taiwan
2
Graduate Institute of Medicine, Kaohsiung Medical University, Kaohsiung 807, Taiwan
3
Department of Pharmacology, College of Medicine, Kaohsiung Medical University, Kaohsiung 807, Taiwan
4
Department of Public Health, College of Health Sciences, Kaohsiung Medical University, Kaohsiung 807, Taiwan
5
Division of Environmental Health and Occupational Medicine, National Health Research Institute, Miaoli 350, Taiwan
*
Author to whom correspondence should be addressed.
Int. J. Environ. Res. Public Health 2016, 13(3), 347; https://doi.org/10.3390/ijerph13030347
Submission received: 1 December 2015 / Revised: 11 March 2016 / Accepted: 14 March 2016 / Published: 22 March 2016

Abstract

:
Many studies have examined the effects of air pollution on daily mortality over the past two decades. However, information on the relationship between levels of coarse particles (PM2.5–10) and daily mortality is relatively sparse due to the limited availability of monitoring data. Furthermore, the results are inconsistent. In the current study, the association between coarse particle levels and daily mortality in Taipei, Taiwan’s largest city, which has a subtropical climate, was undertaken for the period 2006–2008 using a time-stratified case-crossover analysis. For the single pollutant model (without adjustment for other pollutants), PM2.5–10 showed statistically significant association with total mortality both on warm and cool days, with an interquartile range increase associated with a 11% (95% CI = 6%–17%) and 4% (95% CI = 1%–7%) rise in number of total deaths, respectively. In two-pollutant models, PM2.5–10 remained significant effects on total mortality after the inclusion of SO2 and O3 both on warm and cool days. We observed no significant associations between PM2.5–10 and daily mortality from respiratory diseases both on warm and cool days. For daily mortality from circulatory diseases, the effect of PM2.5–10 remained significant when SO2 or O3 was added in the regression model both on warm and cool days. Future studies of this type in cities with varying climates and cultures are needed.

1. Introduction

Over the past decade, many epidemiologic studies demonstrated positive associations between ambient levels of airborne particulate matter (PM) (generally measured as PM with an aerodynamic diameter ≤10 μm [PM10]) and daily mortality rate [1,2,3,4,5,6,7] and hospital admissions or emergency room (ER) visits for cardiovascular and respiratory morbidity [8,9,10,11,12]. The evidence for adverse effects of PM air pollution on public health has led to more stringent standards for levels of PM in outdoor air in the USA and other countries [13].
While previous studies have primarily used PM10 as an exposure indicator, fine particles (PM2.5) have become a greater health and regulatory concern due to epidemiologic studies suggesting that PM2.5 might exert more severe damage than larger particles [14,15,16,17]. It is now generally accepted that PM2.5 are more harmful to health than larger particles (PM10) because PM2.5 offer a greater surface area and hence potentially larger concentrations of adsorbed or condensed toxic air pollutants per unit mass [18,19]. Indeed, this provides the basis for the World Health Organization (WHO) recommendation to use PM2.5 rather than PM10 concentrations as air quality indicators [7].
Most prior studies have only used PM2.5 or PM10 as PM measurement, meaning that the effects of other particle sizes—particularly PM2.5–10—are not well understood [19,20,21]. Fewer studies have examined the potential adverse health effects attributed to the coarse fraction, that is, particles ranging in size from 2.5 μm to 10 μm in aerodiameter (PM2.5–10) [20]. PM2.5–10 originate mainly from abrasive mechanical processes such as mechanical grinding, windblown dust, and agricultural activities. PM2.5–10 are predominantly composed of crustal-related materials such as calcium (Ca), magnesium (Mg), aluminum (Al), silicon, and iron (Fe), and primary organic materials such as pollen, spores, as well as plant and animal debris [18,22,23]. In contrast, the origin of chemical composition of PM2.5 is combustion-related constituents. PM2.5 are composed of many organic and inorganic compounds, including sulfate, nitrate, organic carbon and elemental carbon, carbonates, metals, and water [24,25]. The adverse health effects associated with ambient exposure to PM2.5–10 may thus differ from those of PM2.5 considering differences in the sites of deposition in the respiratory tract and sources and chemical composition for these two different-sized fractions [26].
Relatively fewer studies have been undertaken which address the association between PM2.5–10 and rate of mortality because only a few cities have monitoring data [16,21,27,28,29,30,31]. Not surprisingly, findings with PM2.5–10 are thus inconsistent. These studies were conducted primarily in America and European cities [16,27,29,30,31], with only two studies conducted in Asia [21,28]. As a result, the findings may not be applicable to Asian countries such as Taiwan, where the characteristics of study context may be different, such as levels of PM2.5–10, population sensitivity to PM2.5–10, variability in PM2.5–10 composition and toxicity [32]. Thus, more comprehensive knowledge of the health risks associated with exposure to PM2.5–10 is still needed, as suggested in a review on this topic by Brunekreef and Forsberg [20].
To our knowledge, no Taiwanese epidemiological studies investigated the acute effects of PM2.5–10 due to the lack of monitoring data. This study was thus undertaken to examine the association between short-term exposure to PM2.5–10 and daily mortality among individuals residing in Taipei city, the largest metropolitan city in Taiwan, over a 3-year period from 2006 to 2008, using a case-crossover design.

2. Materials and Methods
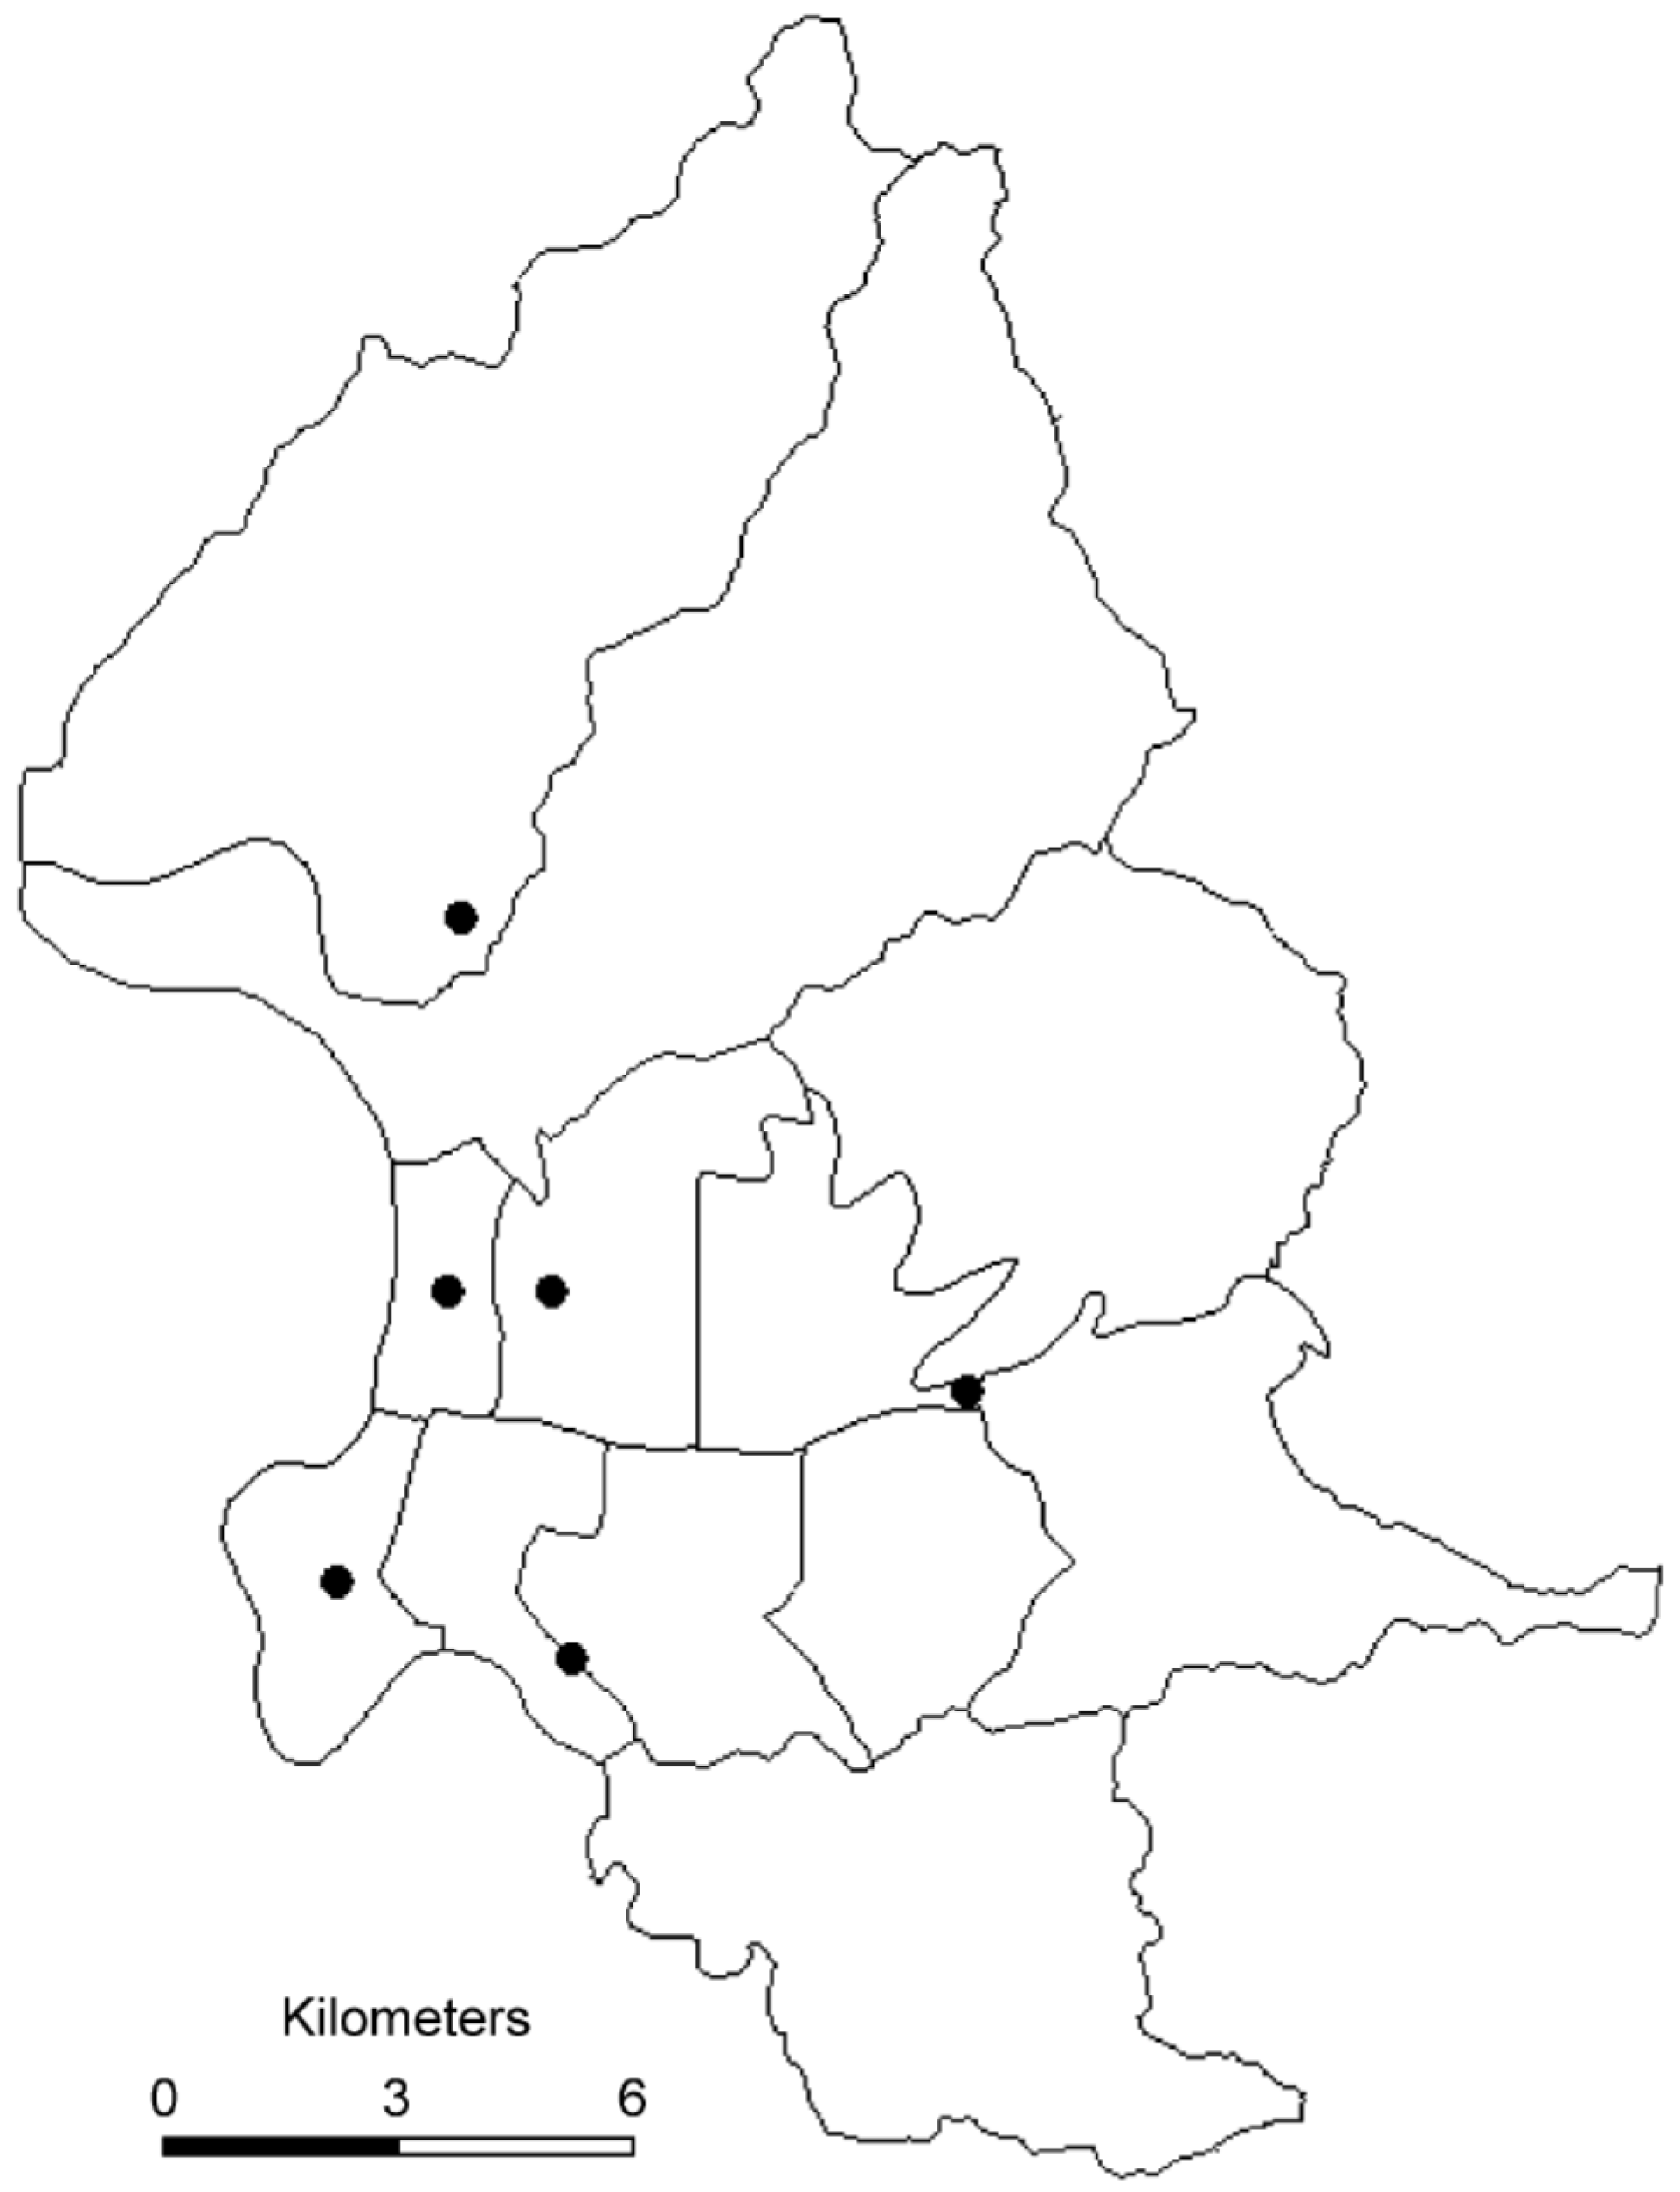
2.1. Taipei City

This study examined daily mortality in relation to PM2.5–10 levels in Taipei for the 3-year period from 2006 to 2008. Taipei is the largest metropolitan city in Taiwan with a population of approximately 2.64 million located in northern Taiwan. The major air pollution source is automobile exhaust emission. Taipei has a subtropical climate, with an annual average temperature of 23 °C.

2.2. Mortality Data

Total daily deaths within Taipei city were obtained from the Department of Health (DOH), which is in charge of the death registration system, for the period from 2006 to 2008 (daily mortality data from DOH were not available nationwide after the year 2009). For each death, detailed demographic information, including gender, date of death, date of birth, cause of death, place of death, and residential district were recorded. Deaths due to accidents (ICD-9 codes 800–999) and deaths occurring outside of the city were excluded from the analysis. The deaths were divided into the following two groups according to the International Classification of Diseases, 9th revision (ICD-9): (1) diseases of the respiratory system (ICD-9 codes 460–519); and (2) diseases of circulatory systems (ICD-9 codes 390–459). Further, this study was approved by the ethics review board of Kaohsiung Medical University Hospital (KMUHIRB-EXEMPT-20150016).

2.3. Pollutants and Meteorological Data

Six air quality monitoring stations were established in Taipei city by the Taiwanese Environmental Protection Administration (EPA), a central governmental agency in 1994 (Figure 1). The monitoring stations were fully automated and routinely monitored five “criteria” pollutants including sulfur dioxide (SO2) (by ultraviolet fluorescence); particulate matter (PM10) (by beta-ray absorption); nitrogen dioxide (NO2) (by ultraviolet fluorescence), carbon monoxide (CO) (by nondispersive infrared photometry), and ozone (O3) (by ultraviolet photometry) levels. However, PM2.5 was not regularly monitored. PM2.5 concentrations in Taiwan were measured continuously since 2006. PM2.5 was measured using tapered element oscillating microbalance method samplers. The availability of the monitoring network for PM2.5 and the continuation of PM10 monitoring provided an opportunity to calculate PM2.5–10 concentrations. The concentration of the coarse fraction was calculated by subtracting PM2.5 levels from PM10 levels. For each day, hourly air pollution data were obtained for all of the monitoring stations. We calculated the daily 24-h mean concentrations for PM10, PM2.5, PM2.5–10, NO2, CO, and SO2 and maximal 8-h mean concentration for O3. The maximal 8-h mean was used because the WHO recommended that the 8-h mean reflects the most health-relevant exposure to O3 [7]. Daily information on mean temperature and mean humidity was provided by the Taipei Observatory of the Central Weather Bureau.

2.4. Statistics

Data were analyzed using the case-crossover technique [33,34,35]. This design is an alternative to Poisson time series regression models for studying the short-term effects attributed to air pollutants [36]. In general, the case-crossover design and the time-series approach yielded almost identical results [37,38,39].
The time-stratified approach was used for the case-crossover analysis [36]. A stratification of time into separate months was made to select referent days as the days falling on the same day of the week within the same month as the index day. Air pollution levels during the case period were compared with exposures occurring on all referent days. This time-stratified referent selection scheme minimizes bias due to non-stationarity of air pollution time-series data [40,41,42]. The results of previous studies indicated that increased mortality was associated with higher air pollutant levels on the same day or the previous two days [43]. Longer lag times have rarely been described. Thus, the cumulative lag period up to 2 previous days (i.e., the average air pollutant levels of the same and previous 2 days) was used. Because pollutants vary considerably by season, especially O3 and particles, seasonal interactions between PM and daily mortality have often been reported. However, previous studies were conducted mostly in countries where the climates are substantially different from that in Taipei [44] which has a subtropical climate with no apparent four-season cycle. Hence in this study the potential interactions of seasonality on the effects of PM2.5–10 was not considered; but temperature was used instead. The adverse health effects of each air pollutant were examined for the “warm” days (days with a mean temperature above 23 °C) and “cool” days (days with a mean temperature below 23 °C) separately.
The associations between mortality and levels of PM2.5–10 were estimated using the odds ratio (OR) and their 95% confidence intervals (CI) which were produced using conditional logistic regression with weights equal to the number of deaths on that day. All statistical analyses were performed using the SAS package (version 9.2; SAS Institute Inc., Cary, NC, USA). Both single-pollutant models and multi-pollutant models were fitted with a different combination of pollutants (up to two pollutants per model) to assess the stability of the effect of PM2.5–10. Exposure levels to air pollutants were entered into the models as continuous variables. Meteorologic variables such as daily average temperature and humidity on the same day, which might play a confounding role, were included in the model. Inclusion of barometric pressure did not markedly change the effect estimates and therefore was not considered in the final model. OR were calculated for the interquartile difference (IQR, between the 25th and the 75th percentile) for PM2.5–10, as observed during the study period.

3. Results and Discussion

The distribution of air pollution, meteorologic measurements, and daily number of deaths in Taipei during the period from 2006 to 2008 are shown in Table 1. An average of 14 persons died of non-accidental causes each day in the city over the study period. Median PM2.5–10 during study period was 19.61 ug/m3 (IQR: 14.65–24.78).
Pearson’s correlation coefficients among the air pollutants are presented in Table 2. Table 3 shows the effect estimates of PM2.5–10 on daily mortality in single-pollutant models and two-pollutant models. For the single pollutant model (without adjustment for other pollutants), PM2.5–10 showed statistically significant association with total mortality both on warm and cool days, with an IQR increase associated with a 11% (95% CI = 6%–17%) and 4% (95% CI = 1%–7%) rise in number of total deaths, respectively. There is no indication of an association between PM2.5–10 and total number of death due to respiratory diseases both on warm and cool days. PM2.5–10 had significant effects on the risk of death from circulatory diseases only on warm days (10% increase for each IQR range change; 95% CI = 1%–21%).
In two-pollutant models, PM2.5–10 remained significant effects on total mortality after the inclusion of SO2 and O3 both on warm and cool days. We observed no significant associations between PM2.5–10 and daily mortality from respiratory diseases both on warm and cool days. For daily mortality from circulatory diseases, the effect of PM2.5–10 remained significant when SO2 or O3 was added in the regression model both on warm and cool days.
This study is one of the few that investigated the association between exposure to PM2.5–10 and daily mortality in Asia [21,28]. Consistent with previous studies, our study demonstrated significant association between PM2.5–10 and the risk of mortality for all causes both on warm and cool days in Taipei [16,27,31].
The correlation between fine and coarse PM was moderate at values of 0.28–0.69 in previous studies with higher value at 0.69 in Steubenville, USA [45]. In contrast, the relationship between PM10 and fine as well as coarse PM was greater [20]. The implication is that analyses based on PM10 are generally not able to support arguments on the relative importance of fine and coarse PM in the induction of deaths. The correlation between fine and coarse PM (r = 0.51) in this study enable separation of the two effects but it was not possible to disentangle their potential effects in a two-pollutant model given their correlation levels. It is unfortunate that, thus far, few studies have reported the results from two-pollutant analyses.
We did not adjust PM2.5. Therefore, the adverse effects of PM2.5–10 are not likely to be a result of an independent PM2.5–10 exposure and are likely to confound with PM2.5 levels. While it does not appear as though associations with PM2.5–10 are simply due to confounding by PM2.5, it is possible that both PM2.5 and PM2.5–10 are acting as surrogates of a broader mixture of pollution. Englert suggested that the relative sizes of effects attributed to fractions of PM10 depend on their relative mass percentages [46]. Although PM2.5–10 represented only about 41% of the PM10 mass concentration in our study, we found statistically significant association between PM2.5–10 and the risk of mortality, which supports a specific effect of this PM fraction. Because some overlap exists in the size ranges between combustion-generated fine particles and mechanically generated particles that generally fall into the coarse range, there is some possibility that the effects detected could be related to fine particles in this intermodal range [27].
Epidemiologic studies on the effects of PM2.5–10 on daily mortality are limited and inconsistent. Studies conducted in 15 counties in California, Malig and Ostro observed an increased excess risk (ER) of both all-cause mortality (ER per 10 μg/m3 = 0.7%, 95% CI = 0.1%–1.5%) and cardiovascular mortality (ER per 10 μg/m3 = 1.3%, 95% CI = 0.1%–2.5%) from a 2-day lag in PM2.5–10 [27]. Zanobetti and Schwartz found a 0.46% (95% CI = 0.21%–0.71%) increase in total mortality, a 0.32% (95% CI = 0.00%–0.64%) increase in cardiovascular disease (CVD), a 0.84% (95% CI = 0.07%–1.62%) increase in stroke, and a 2.16% (95% CI = 1.14%–3.20%) increase in respiratory deaths for a 10 ug/m3 increase in 2-day averaged PM2.5–10 levels in 47 US cities [16]. A study conducted in Stockholm, Meister et al. found positive association between PM2.5–10 and daily mortality, with an ER of 1.68% (95% CI = 0.2%–3.15%) per 10 ug/m3 increase in PM2.5–10 level7s [31]. Contrary to the US studies, two European studies failed to show significant association between PM2.5–10 levels and all cause or cause specific mortality [29,30]. A study conducted in Shanghai, China, Kan et al. did not find significant associations of PM2.5–10 with mortality outcomes [28]. A study conducted in three Chinese cities within the China Air Pollution and Health Effects Study (CAPES), Chen et al. noted a 0.25% (95% CI = 0.08%–0.42%) increase in total mortality, a 0.25% (95% CI = 0.10%–0.40%) increase in cardiovascular disease (CVD), and a 0.48% (95% CI = 0.20%–0.76%) increase in respiratory mortality for a 10 ug/m3 increase in 1-day lagged PM2.5–10 in the single-pollutant models [21].
Most studies that have reported significant effects on mortality associated with PM2.5–10 were conducted in arid areas, including such places as Phoenix, Arizona [47], Coachella Valley, California [48], and Mexico City [49]. In addition, recent studies from southern Europe have explored the effects of windblown Saharan dust, including studies conducted in Rome (Italy), Madrid (Spain), and Barcelona (Spain), which found evidence of an effect of PM2.5–10 on daily mortality during Saharan dust days, despite rather moderate particle concentration [50,51,52]. In arid areas, particle dust often originates from the surrounding land, not from local point sources, and particle levels are therefore expected to be more spatially homogeneous [31].
An 11% and 4% increase of all-cause mortality per 10 μg/m3 increment in the 3-day moving average (lag 2) concentrations of PM2.5–10 were found during the warm and cool days, respectively. The magnitude of PM2.5–10 effect estimates reported in our study were generally larger than those noted previously. Although the study methods might have influenced the analysis data, disparities between the findings of our research and that concerning Western populations provide evidence of differential toxicity of PM2.5–10 with different components across locations and on various health outcomes. The basis for differences in these studies is not known. In addition, our previous study showed that PM2.5 had a statistically significant association with total mortality both on warm and cool days, with an increment of 10 μg/m3 with a 4.06% and 3.48% rise in number of total deaths, respectively [53]. However, no significant effects were found between PM10 and all-cause mortality. Our study suggested a greater effect of coarse PM on all-cause mortality compared with PM2.5 and PM10 [54].
Only in recent years have researchers begun to separately address the adverse health effects attributed to PM2.5–10, because (1) PM2.5–10 were initially considered as potentially less toxic than PM2.5 due to their large size and small surface area to mass ratio and (2) it is only recently that PM2.5 were measured separately [55]. However, PM2.5–10 may plausibly impact health given their deposition in the lungs, high biological content such as organic matter and microbes, and, in urban areas, high content of heavy metals such as Fe and Al [56]. Further, particle agglomerates that are large enough to be in the coarse fraction may contain many ultrafine particles and other attached constituents [52].
Results from toxicological studies showed that on an equal mass basis, coarse and fine PM both produce inflammatory effects, including some evidence that coarse PM may be more inflammatory than fine PM [57,58,59,60]. Controlled human exposure studies have also provided evidence of acute alterations in markers of inflammation, coagulation, and autonomic tone [61,62,63,64,65]. In addition, controlled exposure to concentrated ambient PM2.5–10 can also produce increase in neutrophils in healthy humans [62,63]. Such inflammatory responses are a major component of asthmatic disease and may incite or exacerbate other respiratory conditions [66,67].
Major PM2.5–10 components vary by region and by season, but typically include Ca, Mg, Al, silicon, and Fe, and primary organic materials such as pollen, spores, and plant and animal debris [18,22,23]. Despite considerable research, the relative toxicity of different constituents of PM2.5–10 remain unclear but likely vary dependent upon the components [60]. The origin of chemical pollutants in an urban atmosphere is known to be predominantly attributed to road traffic [12]. Concentrations in urban environments generally are more influenced by transportation than in rural conditions, in which agriculture, other sources such as unpaved and construction sites, and wind are key influences [18]. In our study, the effect of PM2.5–10 on daily mortality did not vary by season (no effect modification). The reason for this is unknown. The seasonal pattern of air pollution health effects needs to be further investigated.
The case-crossover study design was proposed by Maclure [33] to study the influence of transient, intermittent exposures on the subsequent risk of rare acute-onset events in close temporal proximity to exposure. This design offers the ability to control many confounders by design rather than by statistical modelling. This design is an adaptation of the case-control study in which each case serves as his or her own referent. Therefore, time-invariant subject-specific variables such as gender, age, underlying chronic disease, or other individual-level characteristics do not act as confounders. In addition, time-stratified approach [36] was found to be effective in controlling for seasonality, time trends, and chronic and slowly varying potential confounders [40,41,42]. In general, the case-crossover design and the general additive model (GAM) approach, which has been the analytic method of choice for studying short-term adverse effects of air pollution since 1990 [68], produced almost identical results [37,38,39].
For a factor to confound the relationship between PM2.5–10 levels and daily mortality, it needs to be correlated with both variables. It is unlikely that smoking and other indoor pollutants confound the present association since day to day variations in indoor emissions, including smoking, may not be correlated with coarse PM air pollutants.
Exposure measurement error is a common concern in environmental epidemiology. PM2.5–10 levels are typically more spatially heterogeneous than PM2.5 due to its higher deposition velocities in the atmosphere for these higher mass particles [26,56]. Concentrations of PM have also been shown to vary across space based on proximity to different sources, making exposure assignment especially difficult given the limited numbers of monitoring stations with data to estimate PM2.5–10 [56]. The potential for exposure measurement error in epidemiologic studies based on monitoring stations is likely to be greater for investigating associations of health indicators with PM2.5–10 than PM2.5 [26]. Larger measurement error relative to PM2.5 may be a plausible explanation for weakened associations for PM2.5–10 in this study. Measurements of PM2.5–10 levels are indirect, estimated through subtraction of PM2.5 from PM10 concentrations measured at the same monitoring station in this study. While past investigations deemed this a reliable approach to estimating PM2.5–10 in urban areas [56], there are inherently errors due to the uncertainty of both filters. PM2.5–10 were assigned from fixed, outdoor monitoring stations to individuals to estimate exposure (assuming that exposure was homogeneous encompassing all the studied area). Exposure measurement errors resulting from differences between the population-average exposure and ambient PM2.5–10 levels are not avoidable. However, the potential for misclassification of exposure due to the lack of personal measurements of PM2.5–10 exposure in this study is of the Berkson-type, known to produce a bias toward the null and an underestimate of the relationship [43,69].
Our study population is homogenous in terms of race compared with populations in other cities. This study was conducted in a tropical city. These facts may restrict somewhat the generalizability of these findings to other locations with different meteorological and racial characteristics. Further, behavior such as air conditioning usage or time spent outdoors may affect personal exposures. This might affect the magnitude of the observed associations compared with other geographical locations.

4. Conclusions

In summary, we found statistically significant association between PM2.5–10 and the risk of death for all causes. This finding is not likely to be a result of an independent PM2.5–10 exposure as PM2.5 is not controlled for in this study. The ecological design of the study precludes the inference of cause and effect. However, these findings reinforce the possible role of PM2.5–10 in induction of adverse health effects.

Acknowledgments

This study is based in part on data from the National Insurance Research Database provided by the Bureau of National Health Insurance, Department of Health and managed by National Health Research Institutes. The interpretation and conclusions contained herein do not represent those of Bureau of National Health Insurance, Department of Health or National Health Research Institutes. This study was supported by National Health Research Institutes (EM-105-PP-08) and National Science Council (NSC-104-2314-B-037-015-MY3).

Author Contributions

Meng-Hsuan Cheng wrote the manuscript. Hui-Fen Chiu provided essential insight into the interpretation of the results. Chun-Yuh Yang contributed to study design and interpretation of the data.

Conflicts of Interest

The authors declare no conflict of interest.

References

  1. Levy, J.I.; Hammitt, J.K.; Spengler, J.D. Estimating the mortality impacts of particulate matter: What can be learned from between-study variability? Environ. Health Perspect. 2000, 108, 109–117. [Google Scholar] [CrossRef] [PubMed]
  2. Pope, C.A.; Burnett, R.T.; Thurston, G.D.; Thun, M.J.; Calle, E.E.; Krewski, D.P.; Godleski, J.J. Cardiovascular mortality and long-term exposure to particulate air pollution: Epidemiological evidence of general pathophysiological pathways of disease. Circulation 2004, 109, 71–77. [Google Scholar] [CrossRef] [PubMed]
  3. Goodman, P.G.; Dockery, D.W.; Clancy, L. Cause-specific mortality and the extended effects of particulate pollution and temperature exposure. Environ. Health Perspect. 2004, 112, 179–185. [Google Scholar] [CrossRef] [PubMed]
  4. Analitis, A.; Katsouyanni, K.; Dimakopoulou, K.; Samoli, E.; Nikoloulopoulos, A.K.; Petasakis, Y.; Touloumi, G.; Schwartz, J.; Anderson, H.R.; Cambra, K.; et al. Short-term effects of ambient particles on cardiovascular and respiratory mortality. Epidemiology 2006, 17, 230–233. [Google Scholar] [CrossRef] [PubMed]
  5. Schwartz, J. The effects of particulate air pollution on daily deaths: A multi-city case-crossover analysis. Occup. Environ. Med. 2004, 61, 956–961. [Google Scholar] [CrossRef] [PubMed]
  6. Cohen, A.J.; Anderson, H.R.; Ostra, B.; Pandey, K.D.; Krzyzanowski, M.; Kunzli, N.; Gutschmidt, K.; Pope, A.; Romieu, I.; Samet, J.M.; et al. The global burden of disease due to outdoor air pollution. J. Toxicol. Environ. Health Part A 2006, 68, 1–7. [Google Scholar]
  7. World Health Organization (WHO). WHO Air Quality Guidelines: Global Update 2005; Geneva, Switzerland, 2006. [Google Scholar]
  8. Samet, J.M.; Graff, D.; Bernsten, J.; Ghio, A.J.; Huang, Y.C.; Delvin, R.B. A comparison of studies on the effects of controlled exposure to fine, coarse, and ultrafine ambient particulate matter from a single location. Inhal. Toxicol. 2007, 19, 29–32. [Google Scholar] [CrossRef] [PubMed]
  9. Zanobetti, A.; Schwartz, J.; Dockery, D.W. Airborne particles are a risk factor for hospital admissions for heart and lung disease. Environ. Health Perspect. 2000, 108, 1071–1077. [Google Scholar] [CrossRef] [PubMed]
  10. Le Tertre, A.; Medina, S.; Samoli, E.; Forsberg, B.; Michelozzi, P.; Boumghar, A.; Boumghar, A.; Vonk, J.M.; Bellini, A.; Atkinson, R.; et al. Short-term effects of particulate air pollution on cardiovascular diseases in eight European cities. J. Epidemiol. Community Health 2002, 56, 773–779. [Google Scholar] [CrossRef] [PubMed]
  11. Bedeschi, E.; Campari, C.; Candela, S.; Collini, G.; Caranci, N.; Frasca, G.; Galassi, C.; Francesca, G.; Vigotti, M.A. Urban air pollution and respiratory emergency visits at pediatric unit, Reggio Emilia, Italy. J. Toxicol. Environ. Health Part A 2007, 70, 261–265. [Google Scholar] [CrossRef] [PubMed]
  12. Beckerman, B.S.; Jerrett, M.; Finkelestein, M.; Kanaroglou, P.; Brook, J.R.; Arain, M.A.; Sears, M.R.; Stieb, D.; Balmes, J.; Chapman, K. The association between chronic exposure to traffic-related air pollution and ischemic heart disease. J. Toxicol. Environ. Health Part A 2012, 75, 402–411. [Google Scholar] [CrossRef] [PubMed]
  13. Dominici, F.; Peng, R.D.; Bell, M.L.; Pham, L.; McDermott, A.; Zeger, S.L.; Samet, J.M. Fine particulate air pollution and hospital admission for cardiovascular and respiratory diseases. J. Am. Med. Assoc. 2006, 295, 1127–1134. [Google Scholar] [CrossRef] [PubMed]
  14. Cifuentes, L.A.; Vega, J.; Kopfer, K.; Lave, L.B. Effect of the fine fraction of particulate matter versus the coarse mass and other pollutants on daily nortality in Santiago Chile. J. Air Waste Manag. Assoc. 2000, 50, 1287–1298. [Google Scholar] [CrossRef] [PubMed]
  15. Schwartz, J.; Dockery, D.W.; Neas, L.M. Is daily mortality associated specifically with fine particles? J. Air Waste Manage. Assoc. 1996, 46, 927–939. [Google Scholar] [CrossRef]
  16. Zanobetti, A.; Schwartz, J. The effect of fine and coarse particulate air pollution and mortality: A national analysis. Environ. Health Perspect. 2009, 117, 898–903. [Google Scholar] [CrossRef] [PubMed]
  17. Liao, D.; Shaffer, M.L.; He, F.; Rodriguez-Colon, S.; Eu, R.; Whitsel, E.A.; Bixler, E.O.; Cascio, W.E. Fine particulate air pollution is associated with higher vulnerability to atrial fibrillation—The APACR study. J. Toxicol. Environ. Health Part A 2011, 74, 693–705. [Google Scholar] [CrossRef] [PubMed]
  18. Wilson, W.E.; Suh, H.H. Fine particles and coarse particles: Concentration relationship relevant to epidemiologic studies. J. Air Waste Manag. Assoc. 1997, 47, 1238–1249. [Google Scholar] [CrossRef] [PubMed]
  19. Pope, C.A.; Dockery, D.W. Health effects of fine particulate air pollution: Lines that connect. J. Air Waste Manage. Assoc. 2006, 36, 709–742. [Google Scholar] [CrossRef]
  20. Brunekreef, B.; Forsberg, B. Epidemiological evidence of effects of coarse airborne particles on health. Eur. Respir. J. 2005, 26, 309–318. [Google Scholar] [CrossRef] [PubMed]
  21. Chen, R.; Li, Y.; Ma, Y.; Pan, G.; Zeng, G.; Xu, X.; Chen, B.; Kan, H. Coarse particles and mortality in three Chinese cities: The China air pollution and health effects study (CAPES). Sci. Total Environ. 2011, 409, 4934–4938. [Google Scholar] [CrossRef] [PubMed]
  22. Fang, G.C.; Chang, C.N.; Wu, Y.S.; Wang, V.; Fu, P.P.; Yang, D.G. The study of fine and coarse particles, and metallic elements for the daytime and night time in a suburban area of central Taiwan, Taichung. Chemosphere 2000, 41, 639–644. [Google Scholar] [CrossRef]
  23. Wang, H.; Shooter, D. Source apportionment of fine and coarse atmospheric particles in Auckland, New Zealand. Sci. Total Environ. 2005, 340, 189–198. [Google Scholar] [CrossRef] [PubMed]
  24. Peng, R.D.; Bell, M.L.; Geyh, A.S.; McDermott, A.; Zeger, S.L.; Samet, J.M.; Dominici, F. Emergency admissions for cardiovascular and respiratory diseases and the chemical composition of fine particle air pollution. Environ. Health Perspect. 2009, 117, 957–963. [Google Scholar] [CrossRef] [PubMed]
  25. Suh, H.H.; Zanobetti, A.; Schwartz, J.; Coull, B.A. Chemical properties of air pollutants and cause-specific hospital admissions among the elderly in Atlanta, Georgia. Environ. Health Perspect. 2011, 119, 1421–1428. [Google Scholar] [CrossRef] [PubMed]
  26. Peng, R.D.; Chang, H.H.; Bell, M.L.; McDermott, A.; Zeger, S.L.; Samet, J.M.; Dominici, F. Coarse particulate matter air pollution and hospital admissions for cardiovascular and respiratory diseases among medicare patients. J. Am. Med. Assoc. 2008, 299, 2172–2179. [Google Scholar] [CrossRef] [PubMed]
  27. Malig, B.J.; Ostro, B.D. Coarse particles and mortality: Evidence from a multi-city study in California. Occup. Environ. Med. 2009, 66, 832–839. [Google Scholar] [CrossRef] [PubMed]
  28. Kan, H.; London, S.J.; Chen, G.; Zhang, Y.; Song, G.; Zhao, N.; Jiang, L.; Chen, B. Differentiating the effects of fine and coarse particles on daily mortality in Shanghai, China. Environ. Int. 2007, 33, 376–384. [Google Scholar] [CrossRef] [PubMed]
  29. Janssen, N.A.H.; Fischer, P.; Marra, M.; Ameling, C.; Cassee, F.R. Short-term effects of PM2.5, PM10 and PM2.5–10 on daily mortality in the Netherlands. Sci. Total Environ. 2013, 463, 20–26. [Google Scholar] [CrossRef] [PubMed]
  30. Samoli, E.; Stafoggia, M.; Rodopoulou, S.; Ostro, B.; Declercq, C.; Alessandrini, E.; Diaz, J.; Karanasiou, A.; Kelessis, A.G.; Le Tertre, A.; et al. Association between fine and coarse particles and mortality in Mediterranean cities: Results from the MED-PARTICLES project. Environ. Health Perspect. 2013, 121, 932–938. [Google Scholar] [CrossRef] [PubMed]
  31. Meister, K.; Johansson, C.; Forsberg, B. Estimated short-term effects of coarse particles on daily mortality in Stockholm, Sweden. Environ. Health Perspect. 2012, 120, 431–436. [Google Scholar] [CrossRef] [PubMed]
  32. Bell, M.L.; Ebisu, K.; Peng, R.D.; Walker, J.; Samet, J.M.; Zeger, S.L.; Dominici, F. Seasonal and regional short-term effects of fine particles on hospital admissions in 202 US counties, 1999–2005. Am. J. Epidemiol. 2008, 168, 1301–1310. [Google Scholar] [CrossRef] [PubMed]
  33. Maclure, M. The case-crossover design: A method for studying transient effects on the risk of acute events. Am. J. Epidemiol. 1991, 133, 144–153. [Google Scholar] [PubMed]
  34. Marshall, R.J.; Jackson, R.T. Analysis of case-crossover designs. Stat. Med. 1993, 12, 2333–2341. [Google Scholar] [CrossRef] [PubMed]
  35. Mittleman, M.A.; Maclure, M.; Robins, J.M. Control sampling strategies for case-crossover studies: An assessment of relative efficiency. Am. J. Epidemiol. 1995, 142, 91–98. [Google Scholar] [PubMed]
  36. Levy, D.; Lumley, T.; Sheppard, L.; Kaufman, J.; Checkoway, H. Referent selection in case-crossover analyses of acute health effects of air pollution. Epidemiology 2001, 12, 186–192. [Google Scholar] [CrossRef] [PubMed]
  37. Neas, L.N.; Schwartz, J.; Dockery, D. A case-crossover analysis of air pollution and mortality in Philadelphia. Environ. Health Perspect. 1999, 107, 629–631. [Google Scholar] [CrossRef] [PubMed]
  38. Lee, J.T.; Schwartz, J. Reanalysis of the effects of air pollution on daily mortality in Seoul, Korea: A case-crossover design. Environ. Health Perspect. 1999, 107, 633–636. [Google Scholar] [CrossRef] [PubMed]
  39. Lu, Y.; Zeger, S. On the equivalence of case-crossover and time series methods in environmental epidemiology. Biostatistics 2007, 8, 337–344. [Google Scholar] [CrossRef] [PubMed]
  40. Lumley, T.; Levy, D. Bias in the case-crossover design: Implications for studies of air pollution. Environmetrics 2000, 11, 689–704. [Google Scholar] [CrossRef]
  41. Janes, H.; Sheppard, L.; Lumley, T. Case-crossover analyses of air pollution exposure data: Referent selection strategies and their implications for bias. Epidemiology 2005, 16, 717–726. [Google Scholar] [CrossRef] [PubMed]
  42. Mittleman, M.A. Optimal referent selection strategies in case-crossover studies: A settled issue. Epidemiology 2005, 16, 15–16. [Google Scholar] [CrossRef]
  43. Katsouyanni, K.; Touloumi, G.; Spix, C.; Schwartz, J.; Balducci, F.; Medina, S.; Rossi, G.; Wojtyniak, B.; Sunyer, J.; Bacharova, L.; et al. Short term effects of ambient sulphur dioxide and particulate matter on mortality in 12 European cities: Results from time series data from the APHEA project. Br. Med. J. 1997, 314, 1658–1663. [Google Scholar] [CrossRef]
  44. Hsieh, Y.L.; Yang, Y.H.; Wu, T.N.; Yang, C.Y. Air pollution and hospital admissions for myocardial infarction in a subtropical city: Taipei, Taiwan. J. Toxicol. Environ. Health A 2010, 73, 757–765. [Google Scholar] [CrossRef] [PubMed]
  45. Dockery, D.W.; Pope, C.A. An association between air pollution and mortality in six U.S. cities. New Engl. J. Med. 1993, 329, 1753–1759. [Google Scholar] [CrossRef] [PubMed]
  46. Englert, N. Fine particles and human health—A review of epidemiological studies. Toxicol. Lett. 2004, 149, 235–242. [Google Scholar] [CrossRef] [PubMed]
  47. Mar, T.F.; Norris, G.A.; Koenig, J.Q.; Larson, T.V. Associations between air pollution and mortality in Phoenix, 1995–1997. Environ. Health Perspect. 2000, 108, 347–353. [Google Scholar] [CrossRef] [PubMed]
  48. Ostro, B.D.; Broadwin, R.; Lipsett, M.J. Coarse and fine particles and daily mortality in the Coachella Valley, California: A follow-up study. J. Expo. Anal. Environ. Epidemiol. 2000, 10, 412–419. [Google Scholar] [CrossRef] [PubMed]
  49. Castillegos, M.; Borja-Aburto, V.H.; Dockery, D.W.; Gold, D.R.; Loomis, D. Airborne coarse particles and mortality. Inhal. Toxicol. 2000, 12, 61–72. [Google Scholar] [CrossRef]
  50. Mallone, S.; Stafoggia, M.; Faustini, A.; Gobi, G.P.; Marconi, A.; Forastiere, F. Saharan dust and association between particulate matter and daily mortality in Rome, Italy. Environ. Health Perspect. 2011, 119, 1409–1414. [Google Scholar] [CrossRef] [PubMed]
  51. Tobias, A.; Perez, L.; Diaz, J.; Linares, C.; Alastruey, A.; Querol, X. Short-term effects of particulate matter on total mortality during saharan dust outbreak: A case-crossover analysis in Madrid (Spain). Sci. Total Environ. 2011, 412, 386–389. [Google Scholar] [CrossRef] [PubMed]
  52. Perez, L.; Tobias, A.; Querol, X.; Kunzli, N.; Pey, J.; Alastuey, A.; Viana, M.; Valero, N.; Gonzalez-Cabre, M.; Sunyer, J. Coarse particles from Saharan Dust and daily mortality. Epidemiology 2008, 19, 800–807. [Google Scholar] [CrossRef] [PubMed]
  53. Yang, C.Y.; Chang, C.C.; Chuang, H.Y.; Tsai, S.S.; Wu, T.N.; Ho, C.K. Relationship between air pollution and daily mortality in a subtropical city: Taipei, Taiwan. Environ. Int. 2004, 30, 519–523. [Google Scholar] [CrossRef] [PubMed]
  54. Tsai, S.S.; Chang, C.C.; Liou, S.H.; Yang, C.Y. The effects of fine particulate air pollution on daily mortality: A case-crossover study in a subtropical city, Taipei, Taiwan. Int. J. Environ. Res. Public Health 2014, 11, 5081–5093. [Google Scholar] [CrossRef] [PubMed]
  55. Host, S.; Larrieu, S.; Pascal, L.; Blanchard, M.; Declercq, C.; Fabre, P.; Jusot, J.F.; Chardon, B.; Le Tertre, A.; Wagner, V.; et al. Short-term associations between fine and coarse particles and hospital admissions for cardiorespiratory diseases in six French cities. Occup. Environ. Med. 2008, 65, 544–551. [Google Scholar] [CrossRef] [PubMed]
  56. Adar, S.D.; Filigrana, P.A.; Clements, N.; Peel, J.L. Ambient coarse particulate matter and human health: A systematic review and meta-analysis. Curr. Environ. Health Rep. 2014, 1, 258–274. [Google Scholar] [CrossRef] [PubMed]
  57. Schins, R.P.; Lightbody, J.H.; Borm, P.J.; Shi, T.M.; Donaldson, K.; Stone, V. Inflammatory effects of coarse and fine particulate matter in relation to chemical and biological constituents. Toxicol. Appl. Pharmacol. 2004, 195, 1–11. [Google Scholar] [CrossRef] [PubMed]
  58. Becker, S.; Soukup, J.M.; Sioutas, C.; Cassee, F.R. Response of human alveolar macrophages to ultrafine, fine, and coarse urban air pollution particles. Exp. Lung Res. 2003, 29, 29–44. [Google Scholar] [CrossRef] [PubMed]
  59. Tong, H.; Cheng, W.Y.; Samet, J.M.; Gilmour, M.I.; Devlin, R.B. Differential cardiopulmonary effects of size-fractionated ambient particulate matter in mice. Cardiovasc. Toxicol. 2010, 10, 259–267. [Google Scholar] [CrossRef] [PubMed]
  60. Ghio, A.J.; Carraway, M.S.; Madden, M.C. Composition of air pollution particles and oxidative stress in cells, tissues, and living systems. J. Toxicol. Environ. Health Part B. 2012, 15, 1–21. [Google Scholar] [CrossRef] [PubMed]
  61. Behbod, B.; Urch, B.; Speck, M.; Scott, J.A.; Liu, L.; Poon, R.; Coull, B.; Schwartz, J.; Koutrakis, P.; Silverman, F.; et al. Endotoxin in concentrated coarse and fine ambient particles induce acute systemic inflammation in controlled human exposure. Occup. Environ. Med. 2013, 70, 761–767. [Google Scholar] [CrossRef] [PubMed]
  62. Graff, D.W.; Cascio, W.E.; Rappold, A.; Zhou, H.B.; Huang, Y.C.; Delvin, R.B. Exposure to concentrated coarse air pollution particles causes mild cardiopulmonary effects in healthy young adults. Environ. Health Perspect. 2009, 117, 1089–1094. [Google Scholar] [CrossRef] [PubMed]
  63. Alexis, N.E.; Lay, J.C.; Zeman, K.; Bennett, W.E.; Peden, D.B.; Soukup, J.M.; Devlin, R.B.; Becker, S. Biological material on inhaled coarse fraction particulate matter activates airway phagocytes in vivo in healthy volunteers. J. Allergy Clin. Immunol. 2006, 117, 1396–1403. [Google Scholar] [CrossRef] [PubMed]
  64. Samet, J.M.; Krewski, D. Health effects associated with exposure to ambient air pollution. J. Toxicol. Environ. Health Part A 2007, 70, 227–242. [Google Scholar] [CrossRef] [PubMed]
  65. Gong, H.; Linn, W.S.; Terrell, S.L.; Clark, K.W.; Geller, M.D.; Anderson, K.R.; Cascio, W.E.; Sioutas, C. Altered heart-rate variability in asthmatic and healthy volunteers exposed to concentrated ambient coarse particles. Inhal. Toxicol. 2004, 16, 335–343. [Google Scholar] [CrossRef] [PubMed]
  66. Barbato, A.; Turato, G.; Baraldo, S.; Bazzan, E.; Calabrese, F.; Tura, M.; Zuin, R.; Beghe, B.; Maestrelli, P.; Fabbri, L.M.; et al. Airway inflammation in childhood asthma. Am. J. Respir. Crit. Care Med. 2003, 168, 798–803. [Google Scholar] [CrossRef] [PubMed]
  67. Brussel, G.G.; Joos, G.F.; Bracke, K.R. New insights into the immunology of chronic obstructive pulmonary disease. Lancet 2011, 378, 1015–1026. [Google Scholar] [CrossRef]
  68. Schwartz, J.; Marcus, A. Mortality and air pollution in London: A time series analysis. Am. J. Epidemiol. 1990, 131, 185–194. [Google Scholar] [PubMed]
  69. Zeger, S.L.; Thomas, D.; Dominici, F.; Samet, J.M.; Schwartz, J.; Dockery, D.; Cohen, A. Exposure measurement error in time-series studies of air pollution: Concepts and consequences. Environ. Health Perspect. 2000, 108, 419–426. [Google Scholar] [CrossRef] [PubMed]
Figure 1. Map of Taipei city showing location of the air-quality-monitoring stations.
Ijerph 13 00347 g001
Table 1. Mortality counts, weather and air pollutant concentrations in Taipei, Taiwan, 2006–2008.
ParameterMin25%50%75%MaxMean
PM10 (μg/m3) a15.3336.2648.0162.28205.3552.07
PM2.5 (μg/m3) a8.2519.7927.7537.02117.7230.65
PM2.5–10(μg/m3) a2.7914.6519.6124.78144.1521.45
SO2 (ppb) a1.123.074.055.3511.144.32
NO2 (ppb) a3.7320.6624.5329.5555.5125.37
CO (ppm) a0.150.530.660.821.730.70
O3 (ppb) b6.9830.1937.7649.64115.4340.63
Temperature (°C)9.3519.6724.3228.2732.7823.74
Humidity (%)47.9266.9573.2179.2894.1973.02
Total deaths per day21114173214.29
Respiratory deaths011271.51
Circulatory death0245113.93
Min: minimum value; Max: maximum value; a 24-h average; b daily maximal 8-h average.
Table 2. Correlation coefficients among air pollutants.
VariablePM2.5PM2.5–10SO2NO2COO3
PM100.91 *0.83 *0.63 *0.47 *0.45 *0.44 *
PM2.51.000.51 *0.61 *0.52 *0.51 *0.44 *
PM2.510-1.00 *0.47 *0.27 *0.24 *0.32 *
SO2--1.000.49 *0.45 *0.31 *
NO2---1.000.88 *0.25 *
CO----1.000.14 *
O3-----1.00
* p < 0.05.
Table 3. Adjusted odds ratios (AORs) and 95% confidence intervals (CIs) for daily mortality for each interquartile range increase a of PM 2.5–10 in Taipei, Taiwan, 2006–2008, stratified by temperature.
TemperatureTotal Deaths AOR (95% CI)Respiratory Disease AOR (95% CI)Circulatory Disease AOR (95% CI)
≥23 °C (617 days)
Without adjustment b1.11 (1.06–1.17)1.11 (0.95–1.29)1.10 (1.01–1.21)
Adjusted for SO21.11 (1.06–1.17)1.10 (0.97–1.29)1.10 (1.00–1.20)
Adjusted for NO21.08 (1.03–1.14)1.07 (0.91–1.27)1.07 (0.97–1.18)
Adjusted for CO1.07 (1.02–1.12)1.06 (0.90–1.25)1.06 (0.97–1.17)
Adjusted for O31.12 (1.07–1.17)1.10 (0.94–1.29)1.11 (1.01–1.22)
<23 °C (479 days)
Without adjustment b1.04 (1.01–1.07)1.03 (0.93–1.13)1.05 (1.00–1.11)
Adjusted for SO21.05 (1.02–1.09)1.04 (0.94–1.16)1.07 (1.01–1.14)
Adjusted for NO21.01 (0.98–1.04)1.00 (0.91–1.11)1.03 (0.97–1.09)
Adjusted for CO1.02 (0.99–1.05)1.02 (0.92–1.13)1.03 (0.97–1.10)
Adjusted for O31.04 (1.01–1.07)1.03 (0.93–1.13)1.06 (1.00–1.11)
a Calculated for an interquartile range increases of PM2.5–10 (10.13 μg/m3) and adjusted for temperature and humidity; b Single pollutant model.

