Article

Effects of Air Pollution on Hospital Emergency Room Visits for Respiratory Diseases: Urban-Suburban Differences in Eastern China

1
School of Environmental Science and Engineering, Shandong University, Jinan 250100, China
2
Shandong Center for Disease Control and Prevention, Jinan 250014, China
3
Shandong Experimental High School, Jinan 250001, China
4
School of Foreign Languages and Literature, Shandong University, Jinan 250100, China
*
Author to whom correspondence should be addressed.
These authors contributed equally to this work.
Int. J. Environ. Res. Public Health 2016, 13(3), 341; https://doi.org/10.3390/ijerph13030341
Submission received: 26 January 2016 / Revised: 11 March 2016 / Accepted: 14 March 2016 / Published: 19 March 2016

Abstract

:
A study on the relationships between ambient air pollutants (PM2.5, SO2 and NO2) and hospital emergency room visits (ERVs) for respiratory diseases from 2013 to 2014 was performed in both urban and suburban areas of Jinan, a heavily air-polluted city in Eastern China. This research was analyzed using generalized additive models (GAM) with Poisson regression, which controls for long-time trends, the “day of the week” effect and meteorological parameters. An increase of 10 μg/m3 in PM2.5, SO2 and NO2 corresponded to a 1.4% (95% confidence interval (CI): 0.7%, 2.1%), 1.2% (95% CI: 0.5%, 1.9%), and 2.5% (95%: 0.8%, 4.2%) growth in ERVs for the urban population, respectively, and a 1.5% (95%: 0.4%, 2.6%), 0.8% (95%: −0.7%, 2.3%), and 3.1% (95%: 0.5%, 5.7%) rise in ERVs for the suburban population, respectively. It was found that females were more susceptible than males to air pollution in the urban area when the analysis was stratified by gender, and the reverse result was seen in the suburban area. Our results suggest that the increase in ERVs for respiratory illnesses is linked to the levels of air pollutants in Jinan, and there may be some urban-suburban discrepancies in health outcomes from air pollutant exposure.

1. Introduction

The health effects of air pollution have been a matter of increasing public concern. Among all risk factors investigated in the 2010 Global Burden of Disease (GBD2010), outdoor air pollution ranked as the top global health risk burden and resulted in approximately 3.2 million premature annual deaths worldwide [1]. Abundant epidemiological studies have shown that severe air pollution episodes can have a bearing on daily mortality and hospital admissions for respiratory diseases and cardiovascular diseases [2,3]. It was estimated that the 1952 London smog episode caused approximately 12,000 excess deaths and 50%–300% higher mortality rates than the previous year [4]. During the years 1973 to 1980 in Philadelphia, U.S., a 100 μg/m3 increase in total suspended particulates (TSP) was associated with an increase of 7% (95% confidence internal (95% CI): 4%, 10%) in total mortality [5]. In Utah Valley, U.S., during the periods when daily PM10 concentrations exceeded 150 μg/m3, the increases in children's and adult hospital admissions for respiratory diseases were nearly 200 percent and 44 percent, respectively [6]. Comparable results were reported in research studies performed in Germany [7], Canada [8], Ireland [9] and Finland [10]. Some researchers also investigated the health effects of air pollution in developing countries. Gouveia and Fletcher found daily hospital admissions of children in São Paulo, Brazil, for total respiratory diseases had significant associations with O3, NO2 and PM10 [11]. Cropper et al. reported that a 100 μg/m3 increase in TSP result in a 2.3% increase in non-traumatic deaths in Delhi, India [12]. Loomis et al. estimated that a 10 µg/m3 in 24-h average PM2.5 level was related to a 4.2% (95% CI: 0.97%, 8.61%) increase in infant mortality in Mexico City [13]. Vichit-Vadakan et al. evaluated three panel studies in Bangkok, Thailand, and reported that an increase of 45 µg/m3 in PM10 was associated with about a 30% increase in lower respiratory symptoms in children and 50% increase in adults [14]. Wong et al. concluded that the city-combined effects of air pollutants in Asia were estimated to be equal or greater than those in developed countries [15].
However, low levels of ambient air pollutants are still significantly associated with health effects, e.g., chronic obstructive pulmonary diseases hospitalizations [16], and asthma hospital admissions [10]. Unlike hospital admissions, emergency room admissions are unrestricted by bed availability [17]. Currently, emergency rooms visits (ERVs) are recognized as a sensitive indicator for the short-term health outcomes of air pollution, including some severe cases of acute respiratory diseases and more severe cases.
In China, the unprecedented economic growth accompanied by industrialization and urbanization is based on enormous natural resource and energy consumption, of which coal still remains the largest share [18]. Moreover, a series of severe air pollution events in developed regions and megacities caused multiple effects upon industrial production activities, transportations and health as well as the living standards of citizens and rural residents. Recent studies performed in the metropolises, such as Beijing and Shanghai, have observed a statistically significant association between particulate matter, gaseous pollutants and mortality and hospital admissions for respiratory and cardiovascular diseases [19,20,21], attracting a great deal of attention from the government and the public.
As a typical industrial city in Eastern China, Jinan was listed among the most heavily air-polluted cities in the world [22], and has been suffering from intense air pollution in the last two decades due to its high population density, large traffic volume and intense industrial activities [23,24]. It was reported that the annual average concentration of PM2.5 was 108 µg/m3 in Jinan in 2013, which is much greater than the safe level of 10 µg/m3 recommended by the World Health Organization (WHO). Previous researches have demonstrated that mortality was associated with increases in PM2.5 concentrations, even if the annual concentration was lower than 10 μg/m3 or if the daily concentration was lower than 30 μg/m3 [25,26]. However, there are rare studies on the potential health effects of air pollution in Jinan. Moreover, air pollution in suburban areas in China cannot be overlooked, and another feature of interest in this paper is to quantify the effects of outdoor air pollutants on the suburban residents.
Thus, in our study, the daily number of ERVs for respiratory diseases is used as a health outcome to analyze the short-term effects of PM2.5, SO2 and NO2 on the exposed population across urban and suburban areas, and to explore the urban-suburban differences.

2. Materials and Methods

2.1. Study Area

Jinan (36°10’–37°90’ N, 116°12’–117°35’ E) is a semi-enclosed city surrounded by the Yellow River and Taishan Mountain, with an urban population of 3.75 million inhabitants. According to statistics, more than 21 million tons of coal was consumed in this city in 2012, emitting 114,520 tons of SO2 and 51,609 tons of industrial dust [27]. In addition, due to its unique landform and rapid growth in building construction sites and motor vehicles, Jinan has been suffering from severe air pollution and is listed as one of the major haze regions in China [23].
This study was performed in the Licheng District of Jinan, the largest district containing both urban and suburban areas. In the center of Licheng District, Hongjialou Subdistrict (HS) is a typically residential and commercial area characterized by convenient traffic, vast education resources, large apartment buildings, as well as a high population density of 18 thousand residents per square kilometer. Due to its unique representativeness, there have been several published papers in which the sampling sites were placed in HS to provide information about the exposure of the urban population to air pollution in Jinan [28,29,30]. According to the official land-use planning in Jinan, Zhonggong Town (ZT) is located in the suburb of Jinan [31]. Approximately 20 kM away from the urban areas, ZT, where many farmers live, is an area of tourism for outdoor activities and agricultural production with little urbanization and a low population density, and thus, it is able to reflect the air quality level in the suburban areas of Jinan.

2.2. Data on Emergency Room Visits and Air Pollutants

Data on hospital ERVs (from January 2013 to December 2014) were collected from medical record databases in two public general hospitals in Licheng, one of which is the Traditional Chinese Medical (TCM) Hospital of Licheng in HS, and the other is the People’s Hospital of Licheng in ZT. The study samples acquired from the hospitals are geographically representative because two hospitals have regular patients from the corresponding areas. Next, according to the tenth revision of International Classification of Diseases Codes (ICD-10), the ERVs data for respiratory diseases were extracted, including pneumonia (ICD-10: J12–18), asthma (ICD-10: J45–J46), upper respiratory tract infection (ICD-10: J00–06), and chronic obstructive pulmonary disease (ICD-10:J40–44).
Daily concentrations of PM2.5, SO2 and NO2 in HS were measured by one automated environmental monitoring station provided by the Environmental Protection Bureau of Jinan, and data on air pollutant concentrations in ZT were recorded by another station. Daily temperature (°C) and relative humidity during the study period were obtained from the China Meteorological Administration.

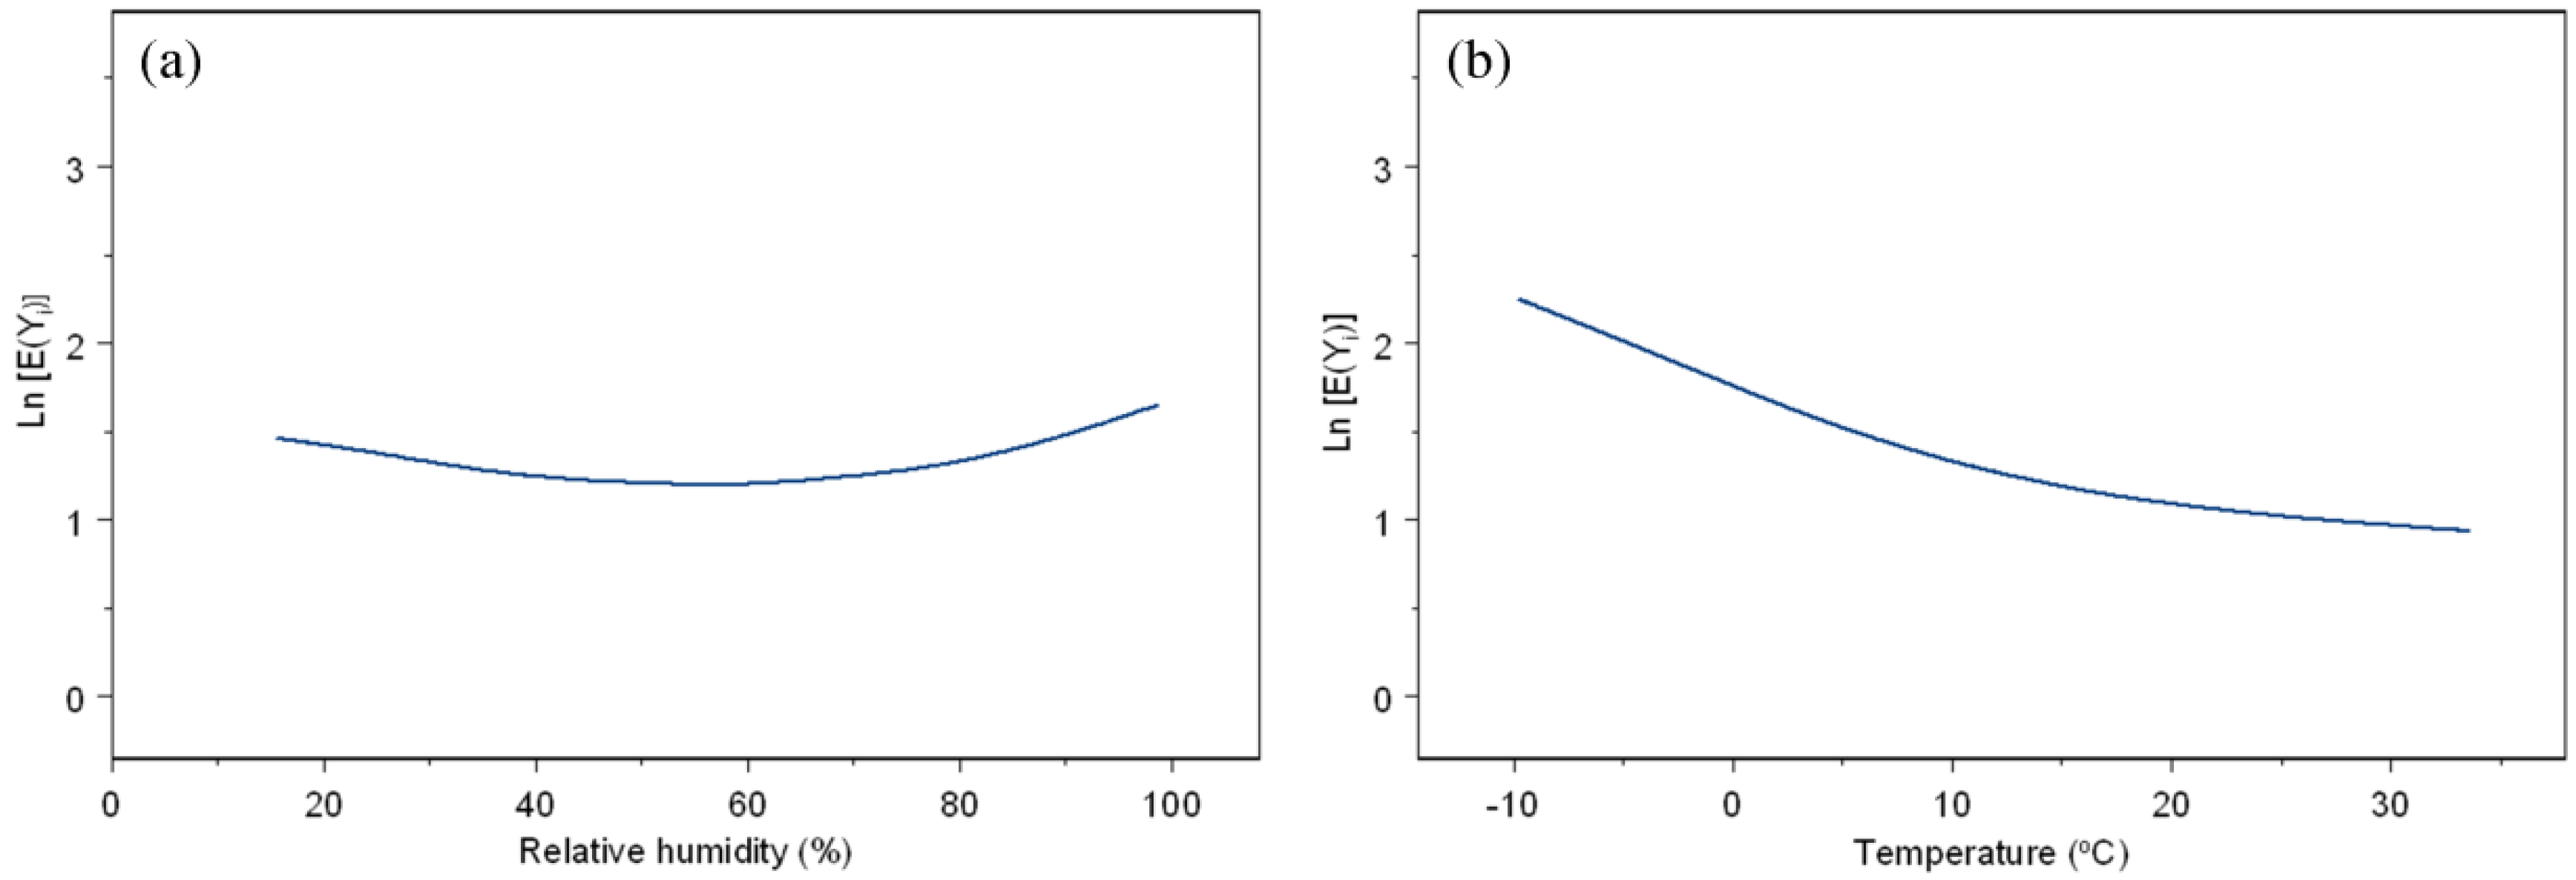
2.3. Statistical Analysis

Generalized additive models (GAM) with Poisson regression were constructed in R software with MGCV package to analyze the relationship between daily concentrations of air pollutants and the number of ERVs for respiratory diseases. Considering the confounding effects of long-term trends, seasonal patterns and meteorological parameters, the smoothing spline functions involved in calendar time, temperature and relative humidity were applied respectively. Using partial autocorrelation functions (PACF), the value of the degree of freedom (DF) for time trends was selected [32]. Based on Akaike’s information criterion (AIC), we specified the appropriate dfs in smoothing spline functions for weather conditions [19,33]. Further, the day of the week (DOW) was also introduced into the model. Before introducing the air pollutant factors, residuals of the models were examined in residual plots. Below was the final model:
Log [ E ( Yi ) ] = intercept + β Zi + DOW + s ( time , df ) + s ( temperature , df ) + s ( humidity , df )
where E(Yi) represents the expected number of daily ERVs for respiratory diseases on day i; β indicates the regression coefficient; Zi is the daily concentration of air pollutant on day i; DOW is a categorical variable; s(time, df) denotes a smoothed function of calendar time with 7 df per year to control seasonality and longer-term trends; s(temperature, df) is a smoothed function of temperature with 3 df; and s(humidity, df) is a smoothed function of humidity with 3 df (Figure A1).
In view of the lag effects of air pollutants on health outcomes, a lag period ranging from 0 to 4 days prior to the occurrences of hospital emergency room visits (current day (lag0) up to 4 days before (lag4)) was adopted. The relative risk (RR) and its 95% confidence interval (CI) for a 10 μg/m3 increase of each pollutant were calculated. Statistical significance was considered only when the p-value was smaller than 0.05 in two-sided tests.

3. Results and Discussion

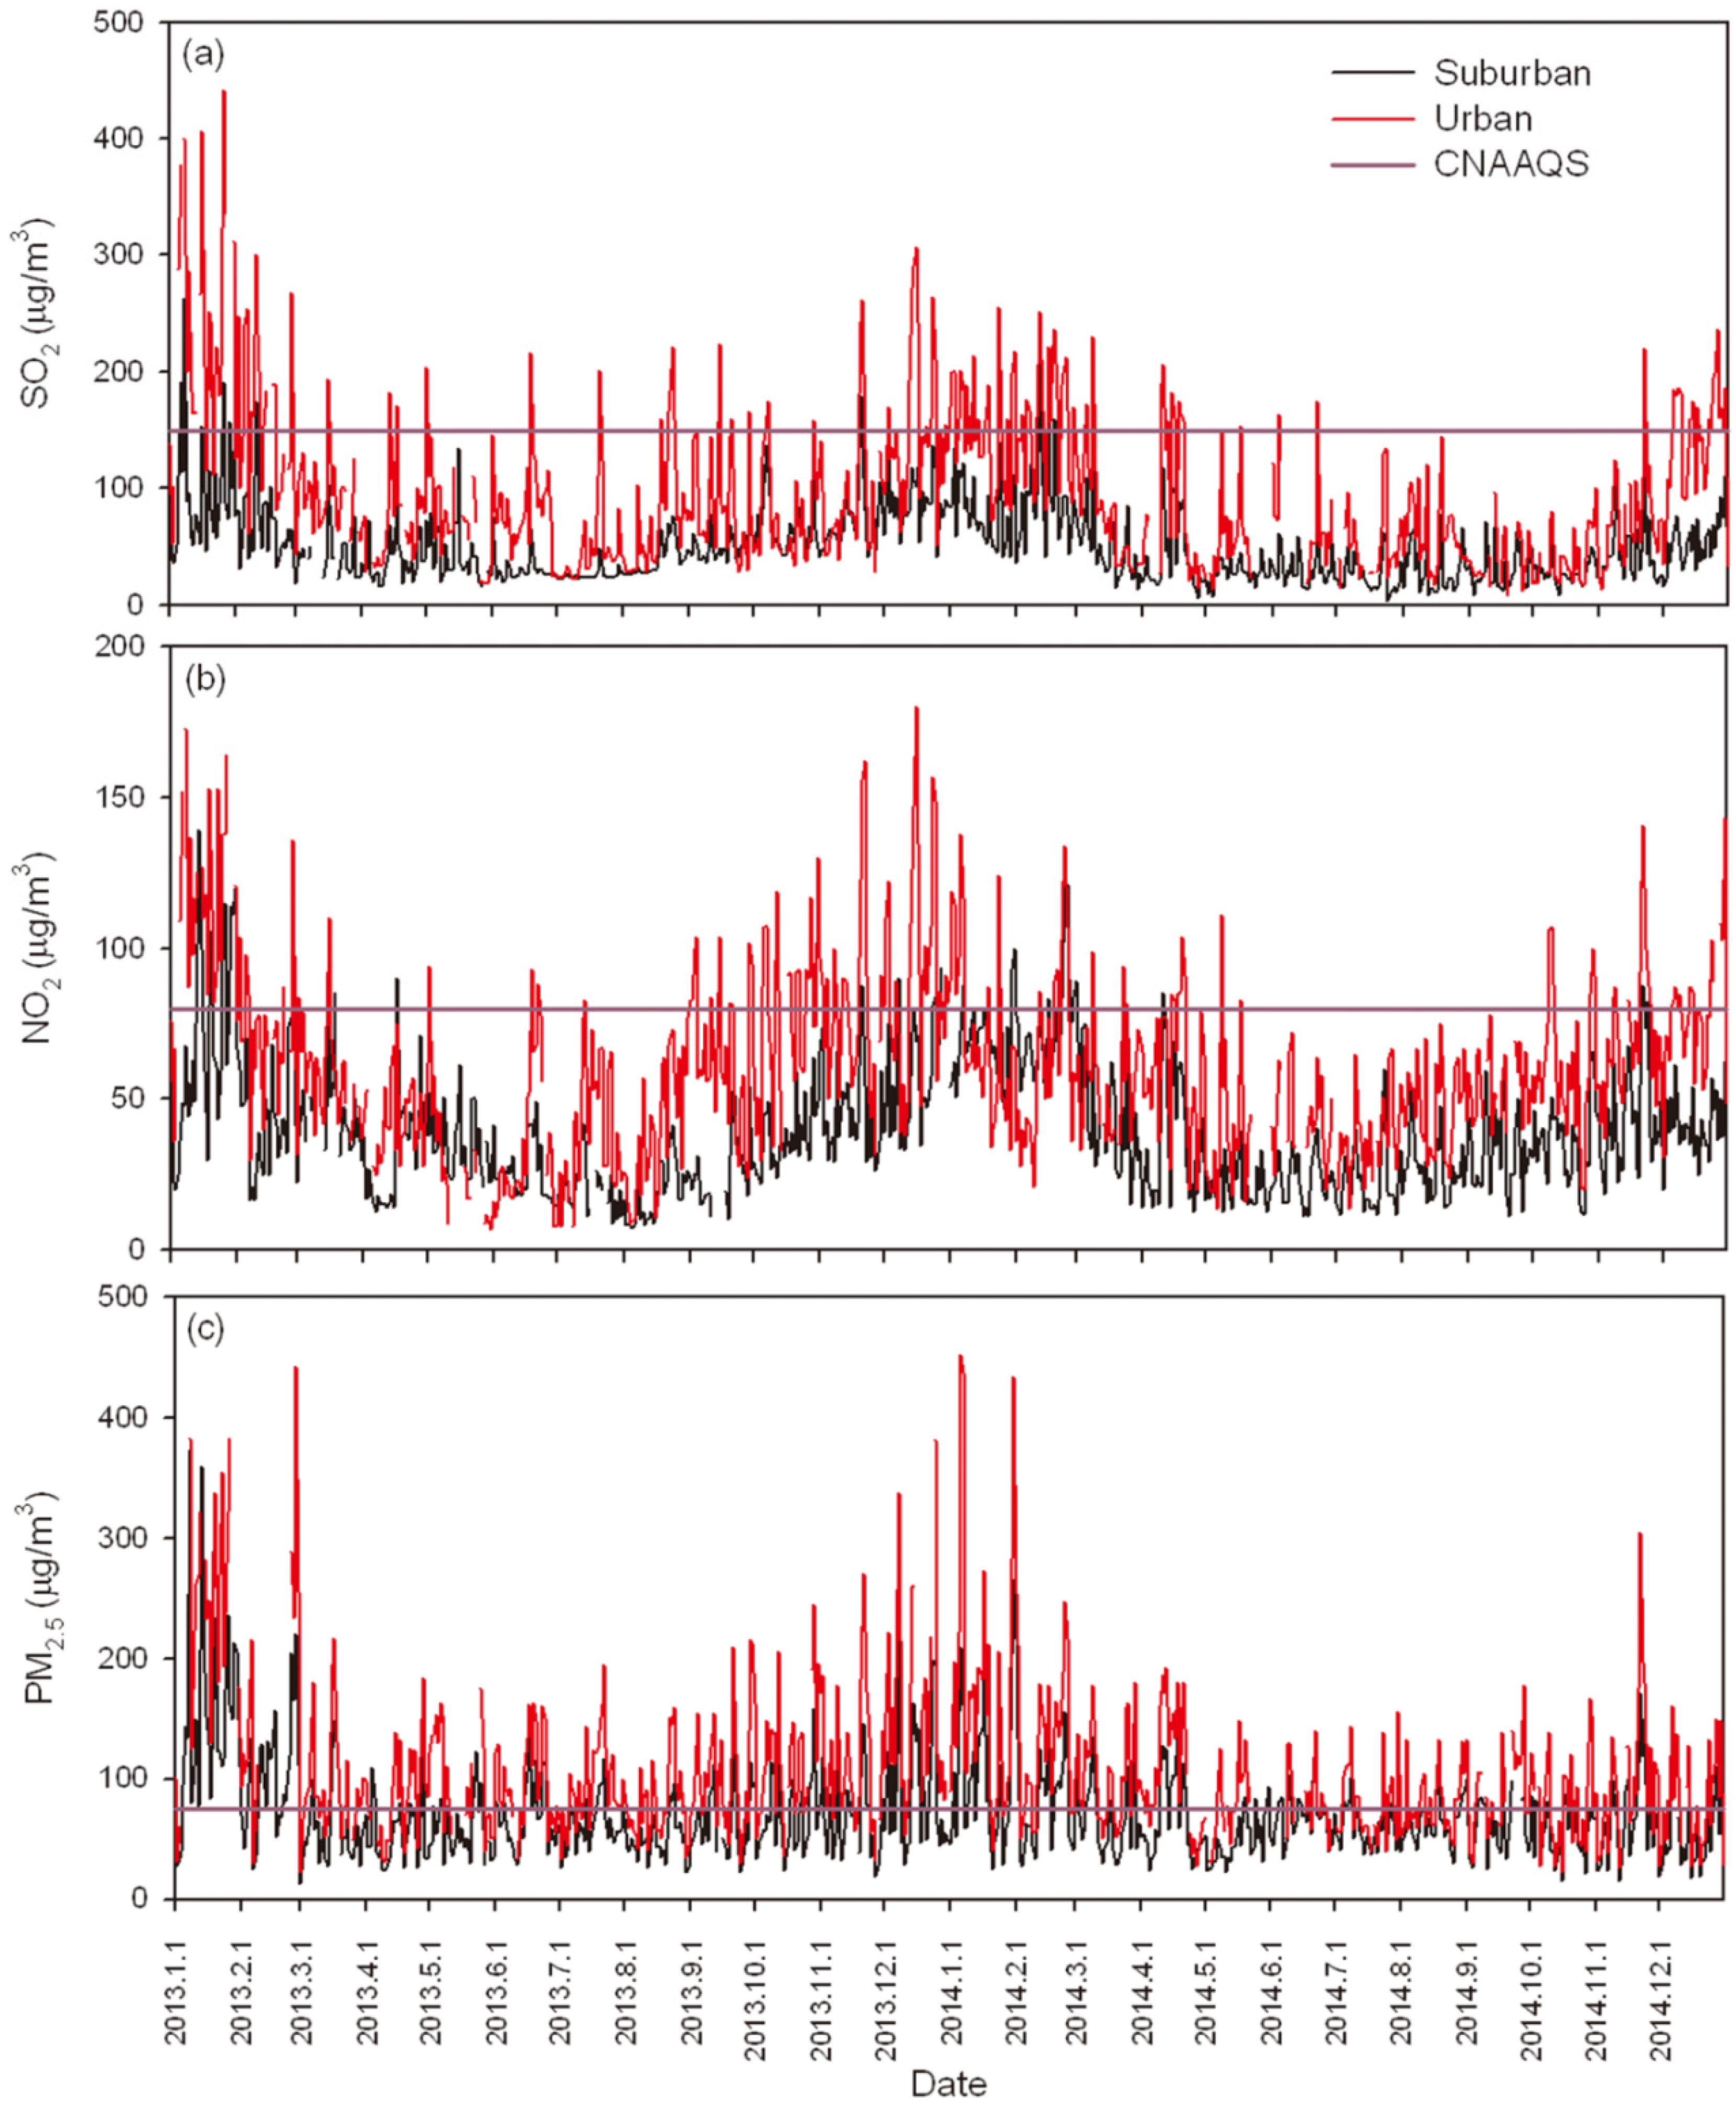
3.1. Descriptive Statistics

The variations of the three air pollutants in the urban and suburban areas are shown in Figure 1. The high levels of PM2.5 concentration warrant attention. Comparatively speaking, the values of the air pollutants in both areas slightly decreased from 2013 to 2014, while the suburban area was less polluted than the urban area.
During the study period, there were 2625 ERVs for respiratory diseases registered in the hospital of HS and 2420 in ZT. The mean daily average concentrations of SO2, NO2 and PM2.5 in HS and ZT were 95.4 μg/m3, 60.0 μg/m3, 108.0 μg/m3 and 49.9 μg/m3, 38.9 μg/m3, 70.7 μg/m3, respectively (Table 1). According to Class II of the Chinese National Ambient Air Quality Standards (CNAAQS) used in residential urban and rural areas (annual average value: 60 μg/m3 for SO2, 40 μg/m3 for NO2 and 35 μg/m3 for PM2.5), it was found that all three of the pollutants in the urban area were 0.5–2 times higher than the standard limits, while only PM2.5 exceeded the standard limit in the suburb, indicating that the urban population represents a group more exposed to ambient air pollution than the suburban population. Based on CNAAQS (daily mean concentrations: SO2 = 150 μg/m3, NO2 = 80 μg/m3, PM2.5 = 75 μg/m3), the exceeding standard ratio (ESR) of each pollutant was calculated during 2013 and 2014, that is, the ratio of the number of days when the daily concentration of the pollutant is above the standard value to the total number of study days (Table 1). The ESR of SO2 (20.3%) was nearly the same as NO2 (20.4%) in the urban area, while the value of SO2 (1.6%) was lower than NO2 (5.7%) in the suburban area. Among the three air pollutants, PM2.5 pollution was more serious than NO2 and SO2 in both areas, and the ESR in the urban area (67.2%) was nearly twice as much as that in the suburbs (33.9%). Obviously, air pollution in the urban area of Jinan was more severe than that in the suburban area, particularly PM2.5.
The correlations between air pollutants and meteorological parameters are shown in Table 2. In the urban area, SO2, NO2 and PM2.5 were moderately correlated with each other (r = 0.563–0.677), and inversely correlated with average temperature (r = −0.534, −0.626 and −0.251, respectively). Relative humidity was positively correlated with NO2 and PM2.5 (r = 0.123 and 0.354, respectively), and inversely correlated with SO2 (r = −0.059). In the suburban area, the extent of correlations among air pollutants and weather conditions showed a similar pattern to the urban area; however, the correlation coefficients between SO2, NO2 and PM2.5 were found to be higher, which indicated that the emission sources of air pollutants in the suburb trended to be more similar and concentrated than those in the urban area of Jinan.

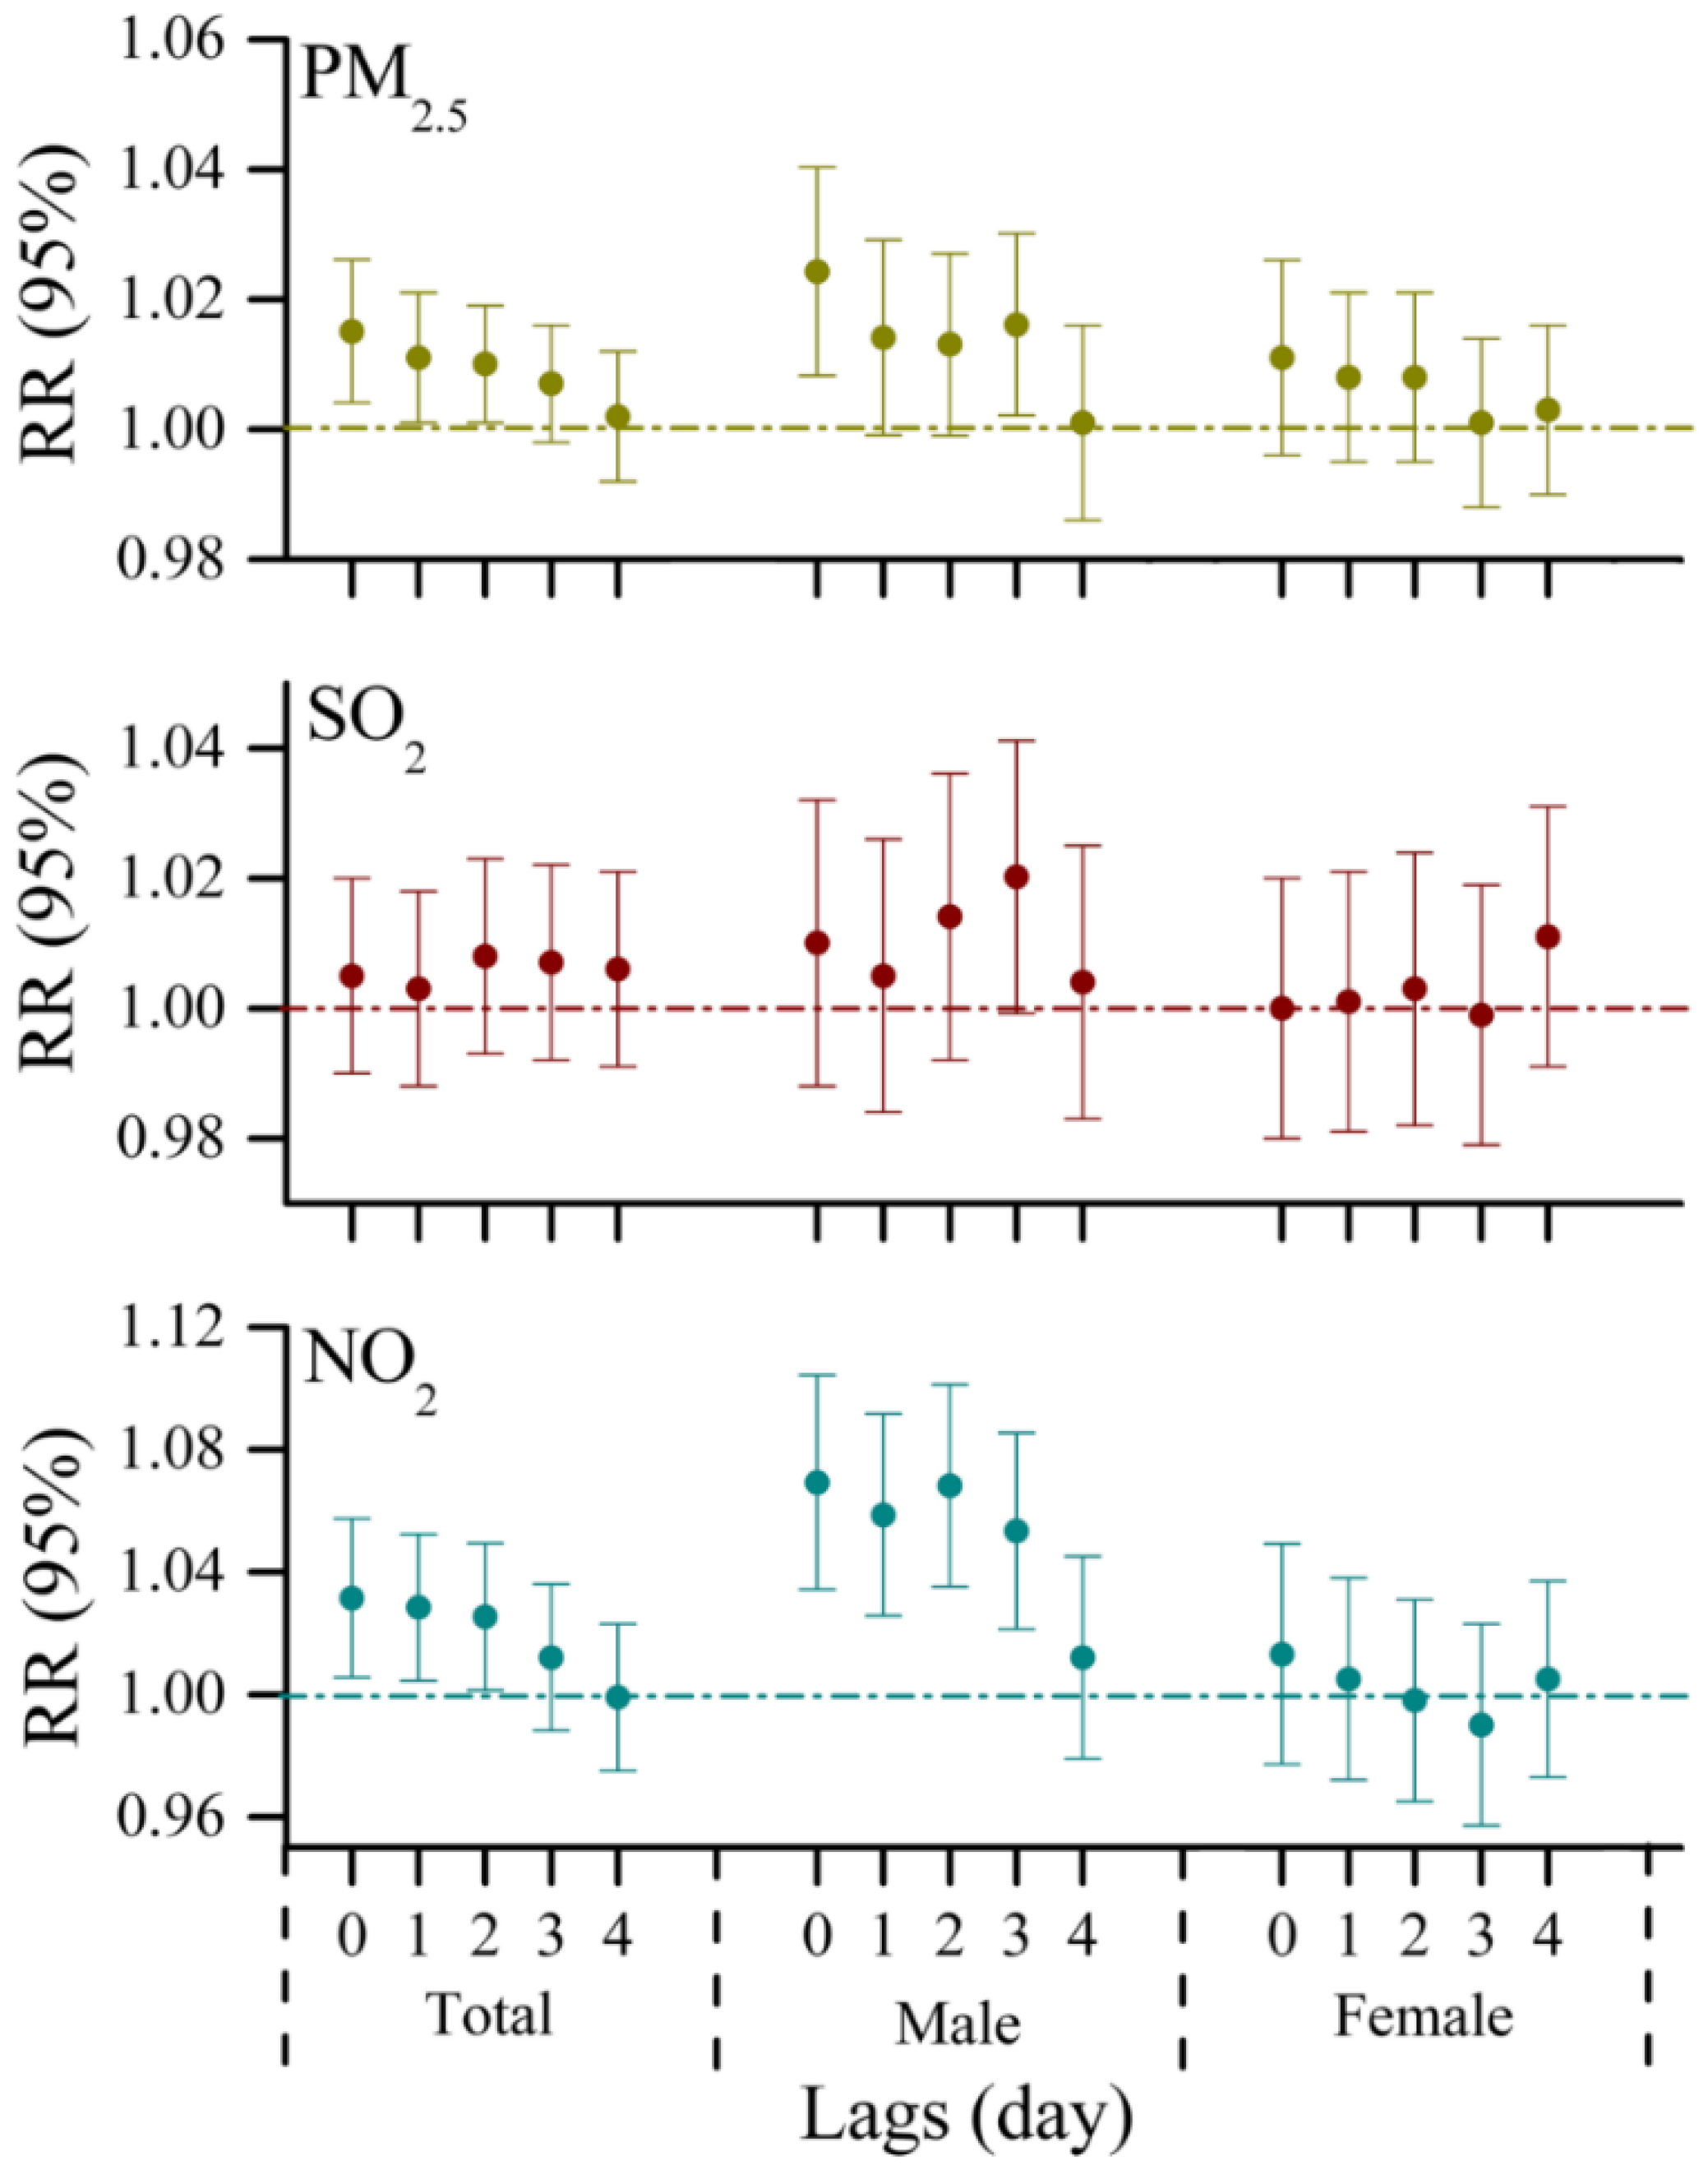
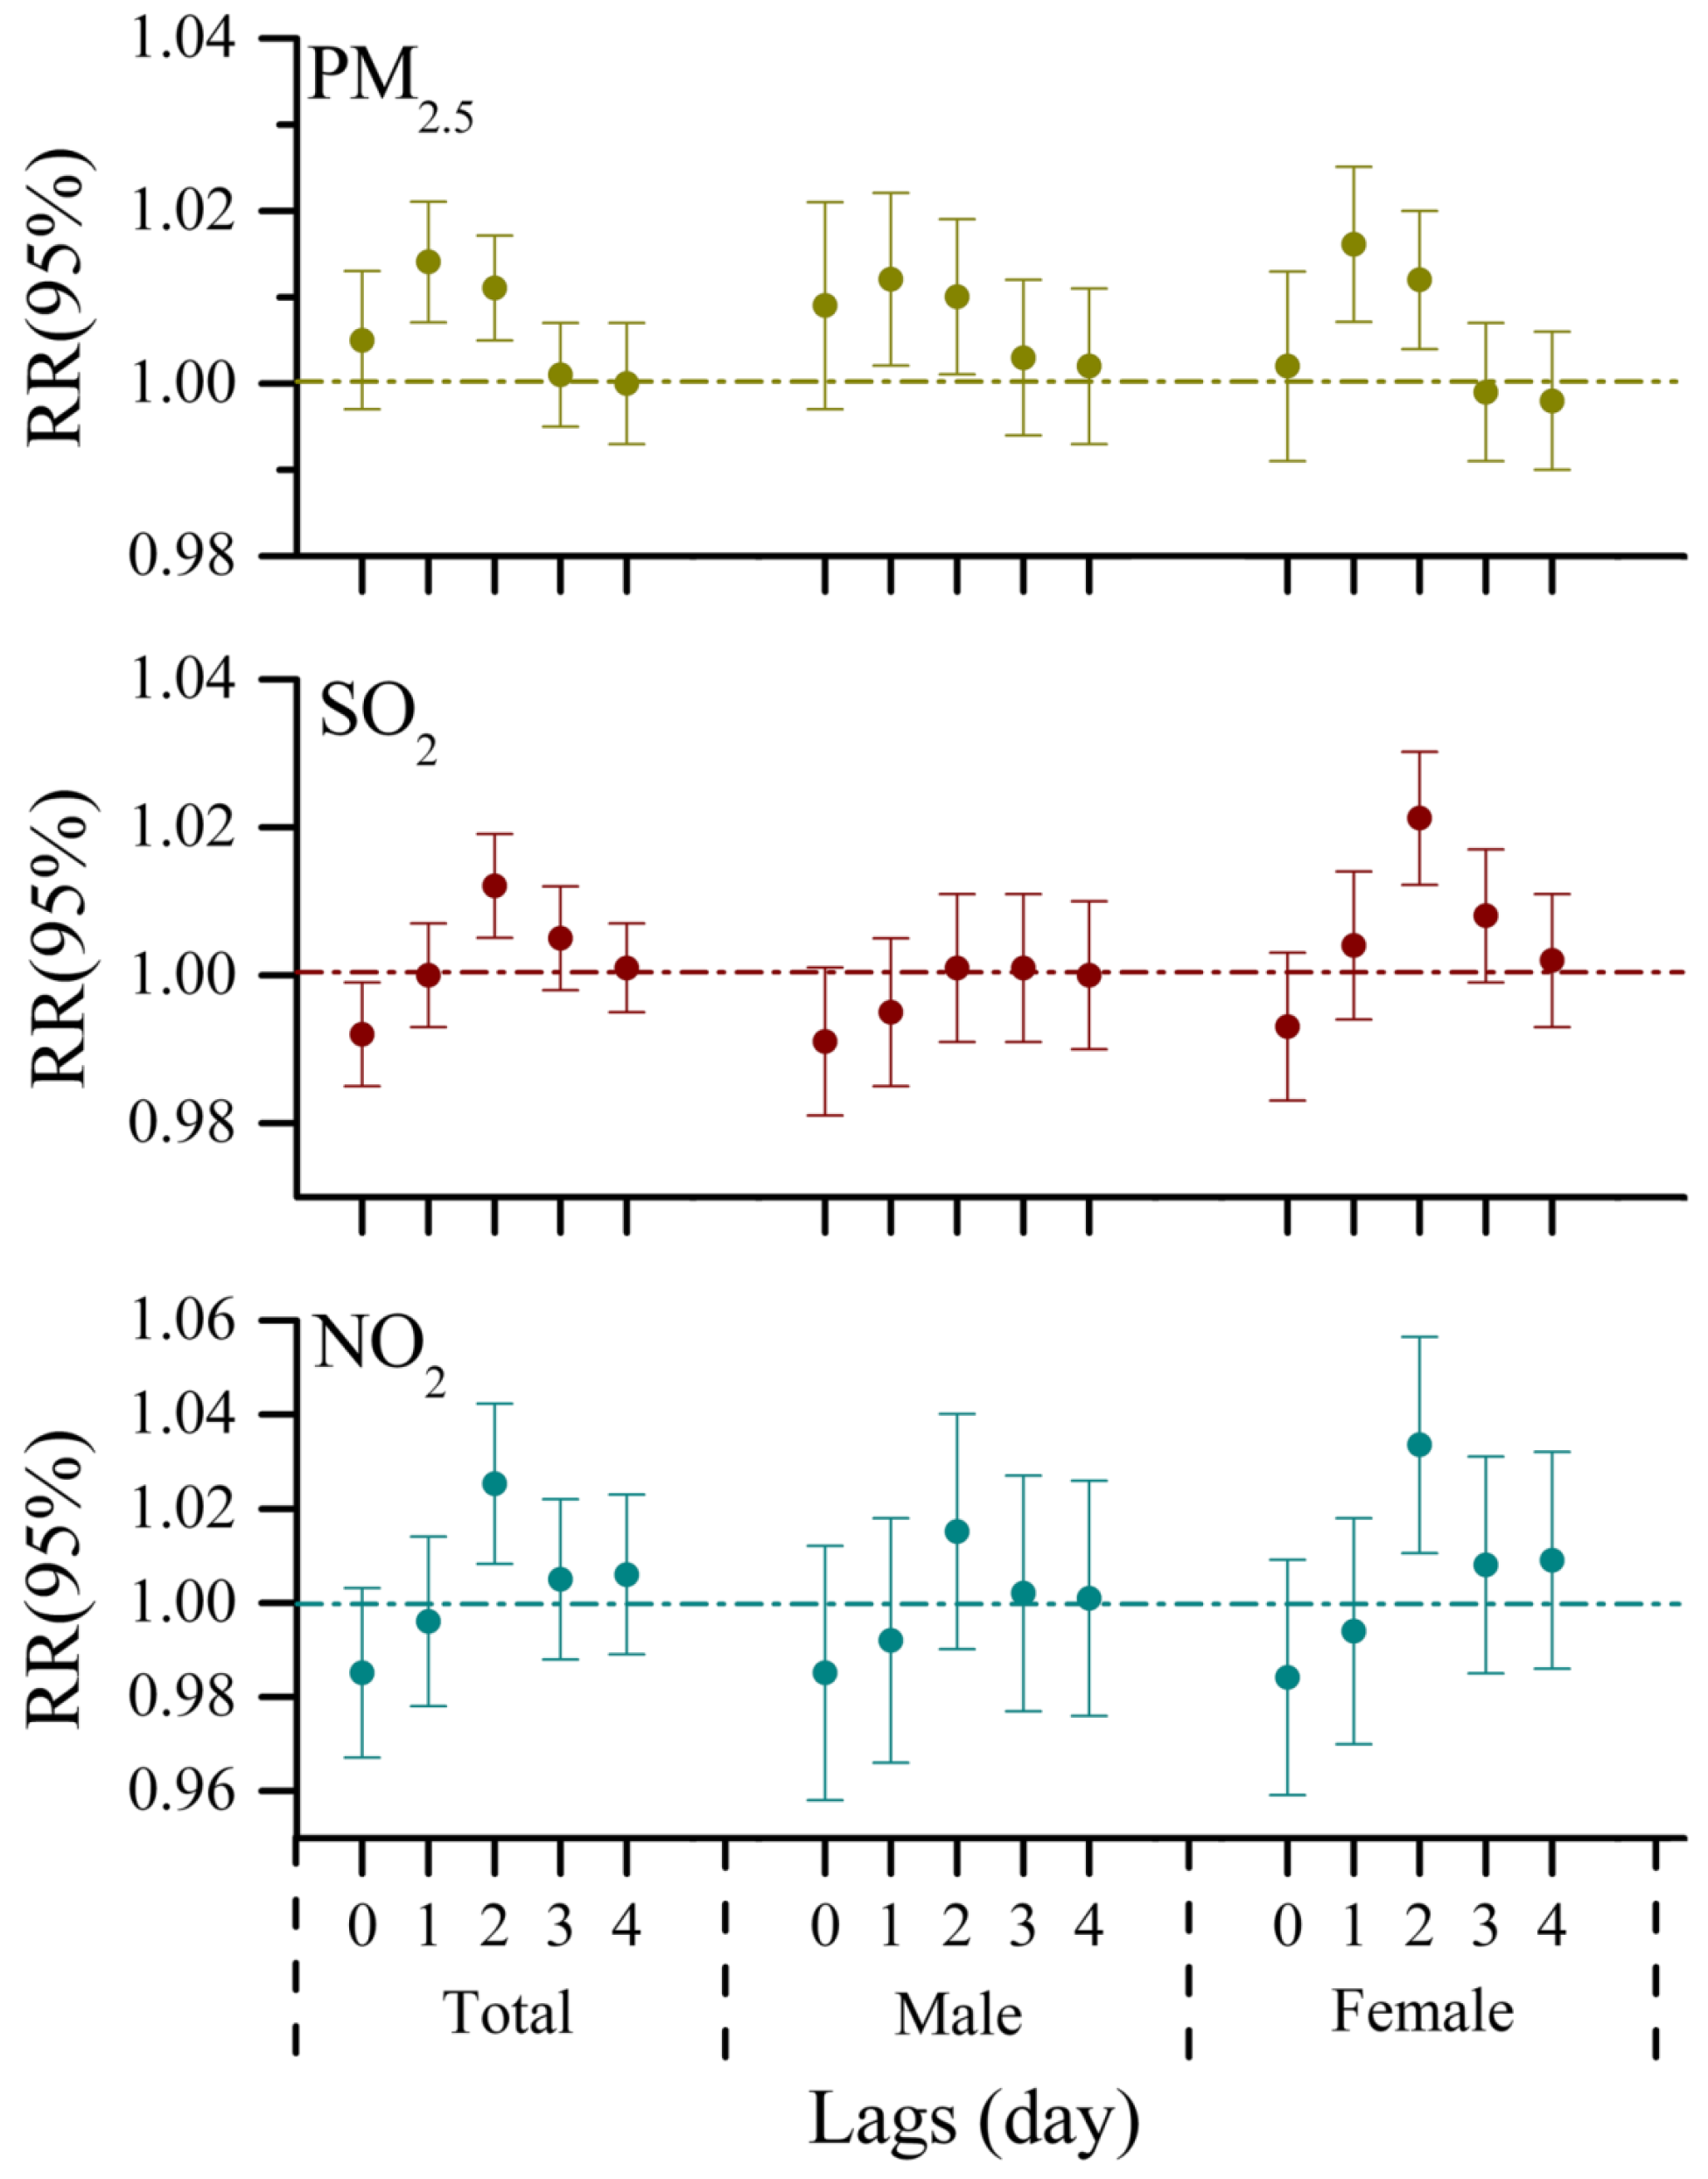
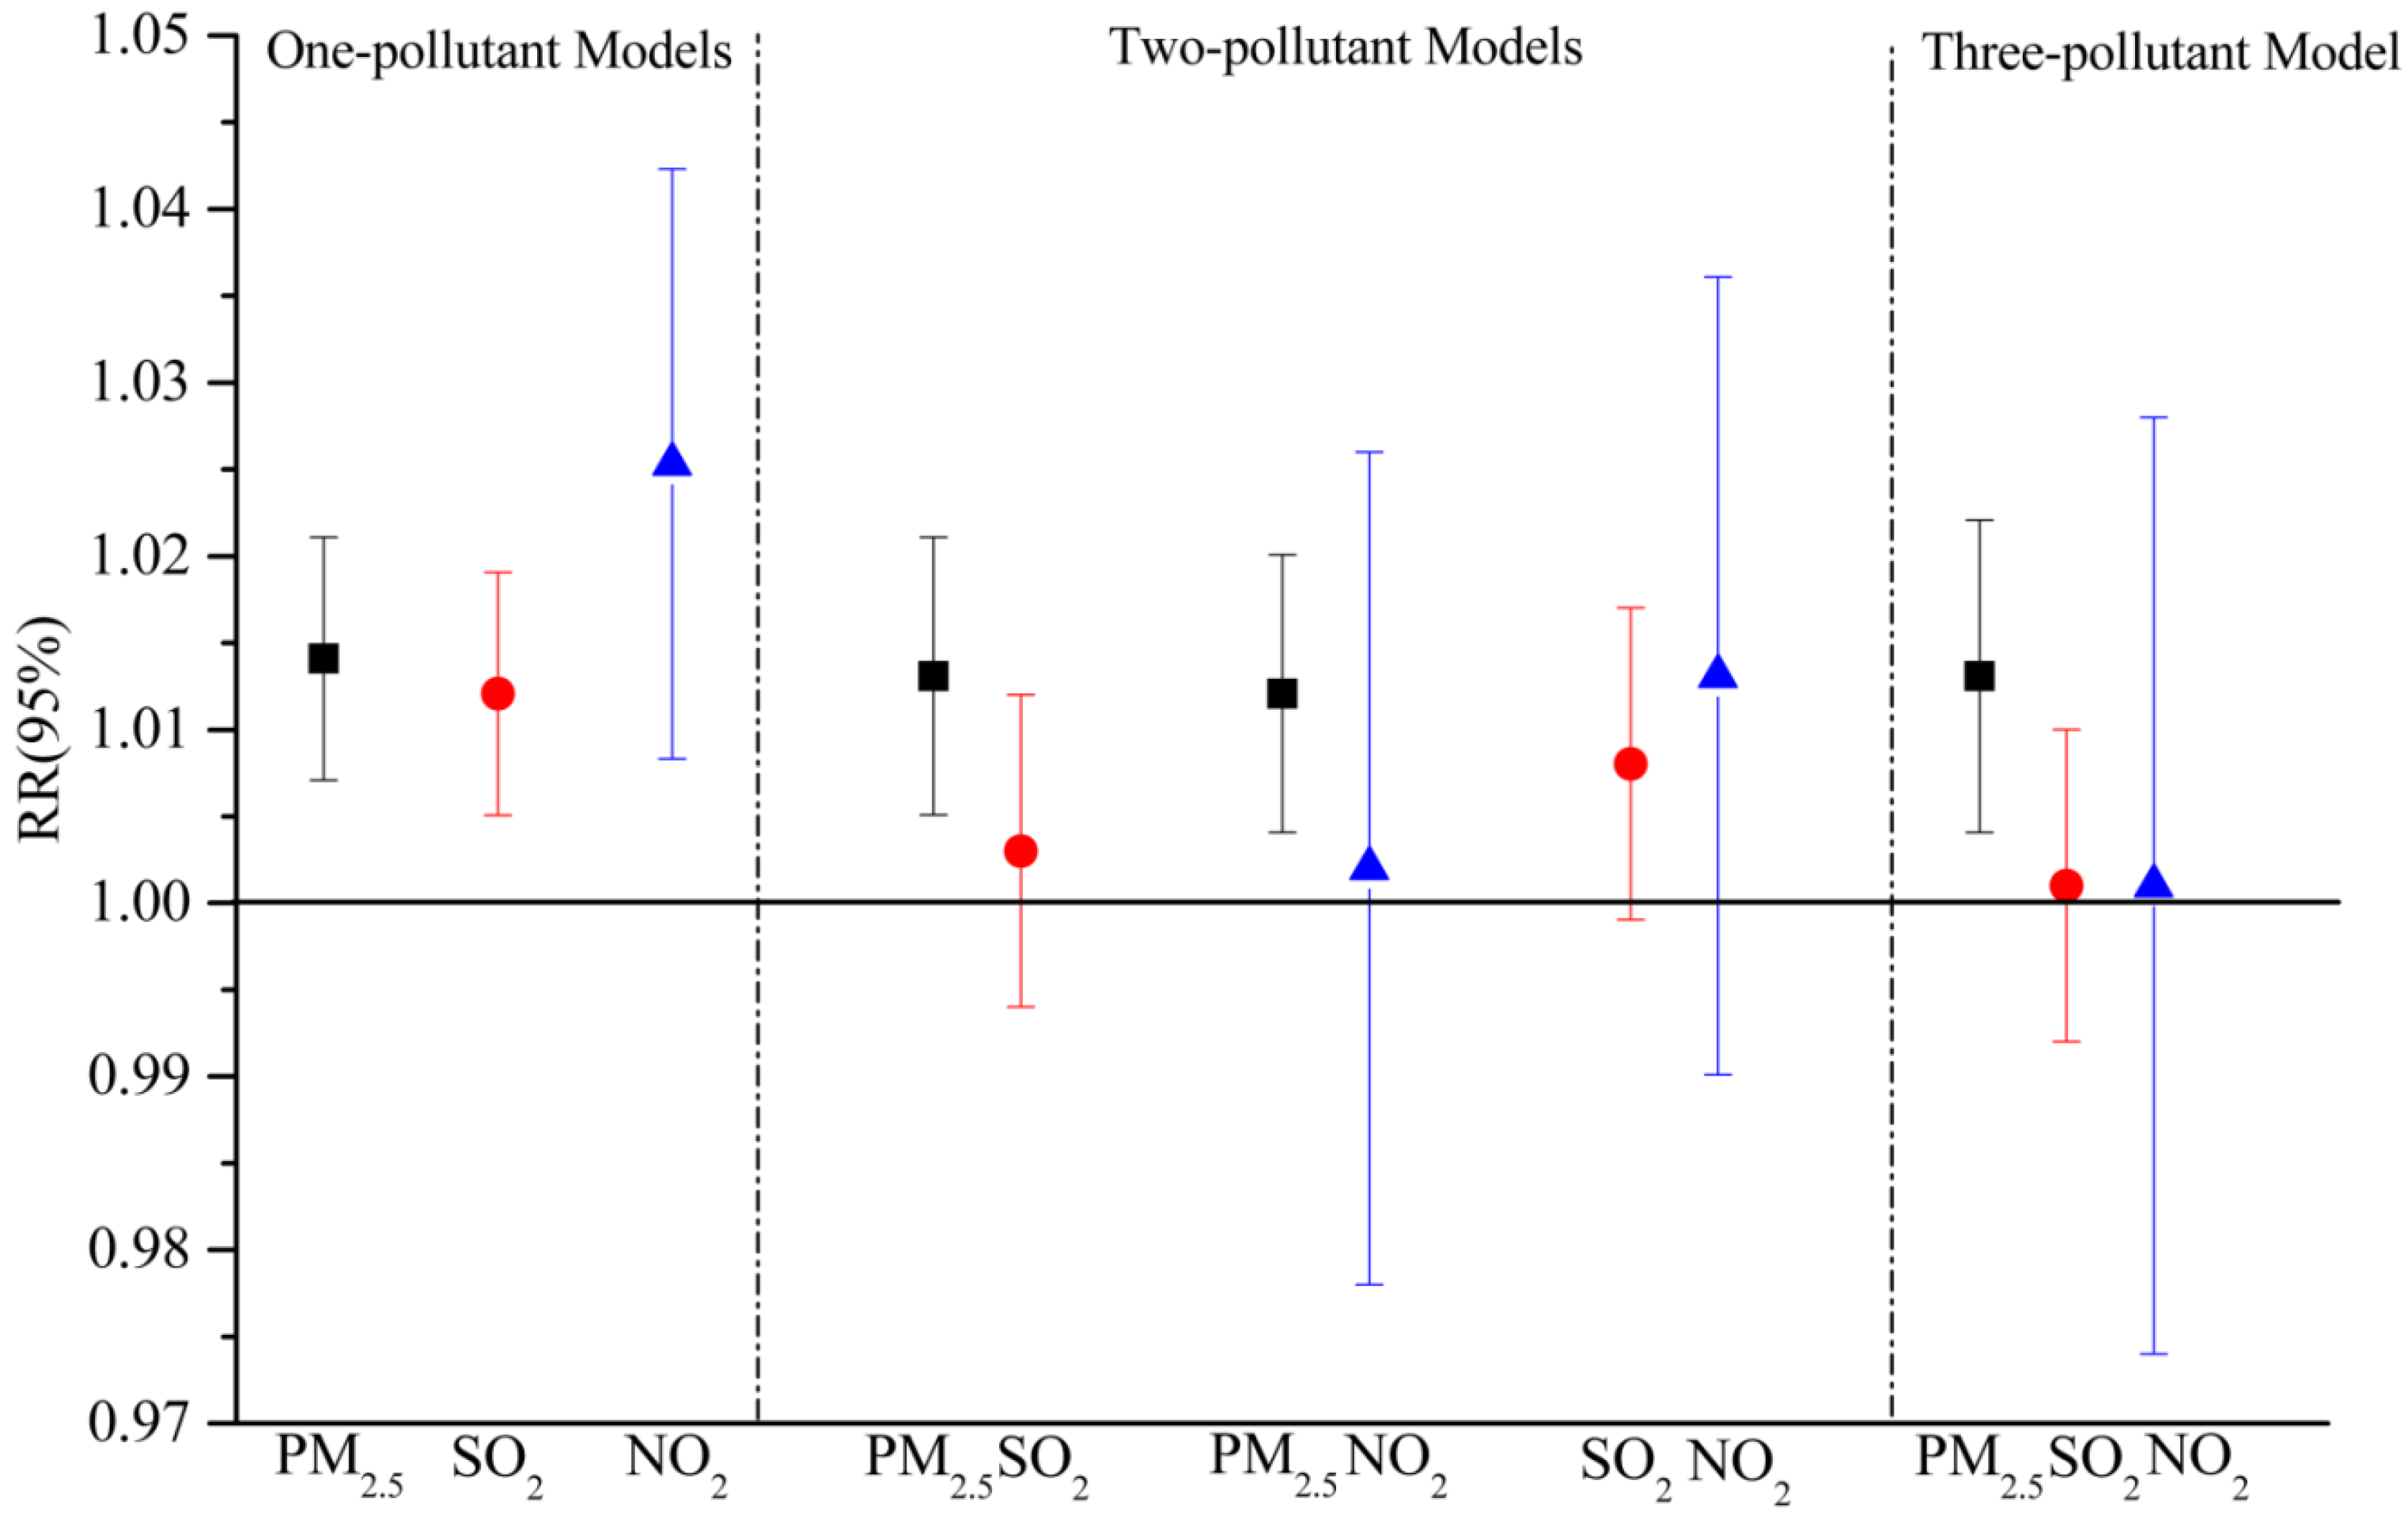
3.2. One-Pollutant Models

By adjusting for time trend, day of the week, temperature, and relative humidity in time-series analyses, the effects of three air pollutants on the daily number of ERVs at each lag day for the urban population were observed in Figure 2. For the total population, exposure to air pollutants on the current day did not contribute to the number of ERVs for respiratory diseases immediately, and the relative risks for ERVs were gradually weak with a lag of 3 and 4 days. PM2.5 was positively and significantly associated with ERVs at lag1 and lag2, and a 1.4% (95% CI: 0.7%, 2.1%) increased risk of ERVs due to respiratory complaints was associated with a 10 μg/m3 increment in PM2.5 one day before (Table 3). While the significant risk to ERVs for respiratory diseases was only strongly associated with 2-day lagged exposure to SO2 and NO2, an increase of 10 μg/m3 in SO2 and NO2 two days before predicted an increase of 1.2% (95% CI: 0.5%, 1.9%) and 2.5% (95% CI: 0.8%, 4.2%) in the number of ERVs for respiratory diseases, respectively. When the analysis was stratified by gender, the significant effects of PM2.5 on visits to hospital emergency rooms at lag1 were observed in both female and male groups (1.6%, 95% CI: 0.7%, 2.5%; 1.2%, 95% CI: 0.2%, 2.2%, respectively), whereas the strong influence of SO2 and NO2 existed in females but not in males, indicating that females in urban areas are more susceptible to air pollution than males, which is consistent with the results of other studies conducted in urban areas [19,34].
However, there are several differences in the lag effects of air pollutants in ZT. For the total population in ZT, PM2.5 and NO2 had similar lag patterns with a lag of 0, 1, and 2 days, and there was no evidence that SO2 was associated with visits to emergency rooms for respiratory diseases during the entire lag days examined (Figure 3). A 10 μg/m3 increase in PM2.5 and NO2 corresponded with an increase of 1.5% (95% CI: 0.4%, 2.6%) and 3.1% (95% CI: 0.5%, 5.7%) in ERVs for respiratory complaints, respectively (Table 3). Regarding the gender differences, we also stratified the analyses for associations between the variations of air pollutant levels and the daily number of ERVs. For males, remarkable increases in the risk of ERVs for respiratory diseases due to exposure to PM2.5 and NO2 in 0–3 days lag models, and the strongest positive associations were observed on the current day. An increase of 2.4% (95% CI: 0.8%, 4.0%) and 6.9% (95% CI: 3.4%, 10.4%) in the number of ERVs for respiratory complaints was associated with a 10 μg/m3 increase in PM2.5 and NO2, respectively. In contrast, no significant relationships between air pollutants and visits to emergency rooms for respiratory problems were found in females (Figure 3). Compared with the results obtained from the urban area, we observed some gender differences in the health effects of air pollution between the two populations. This finding could be attributed to different socioeconomic levels, as characterized by education, occupation and income, which are reported to be a factor for respiratory diseases [35,36]. In China, residents of suburban areas usually have lower socioeconomic levels, and spend more time in outdoor activities and less time in air conditioning than those in urban areas [37], and thus they are likely to have relatively high exposures to air pollution. In addition, cigarette smoking habit and body mass index (BMI) also have a prevalence of respiratory symptoms [38,39]. However, due to a lack of information, the reasons for this discrepancy are not completely clear and warrant further investigation.
In this study, it was found that estimated effects of PM2.5 on the ERVs for respiratory diseases in the urban and suburban populations were very similar in one-pollutant models. Regarding gaseous pollutants, NO2 appeared to have a stronger effect on the ERVs for respiratory diseases than SO2 in both areas. This finding was also observed by some epidemiological and biological studies [16,40,41]. Inhalation of sulfur dioxide (SO2) leads to rapid-onset bronchoconstriction, and a greater decrease in pulmonary function in asthmatic subjects than healthy subjects [42], potentially resulting from a TNF-α promoter polymorphism identified in asthmatic patients [43]. Personal exposure to nitrogen dioxide (NO2) has also been found to increase the severity of an asthma exacerbation [44], and induce inflammation in the airways as indicated by neutrophil influx and reduced lymphocyte subpopulations [45]. In addition, NO2 might increase the effects of an inhaled allergen as a sensitizing agent [46].

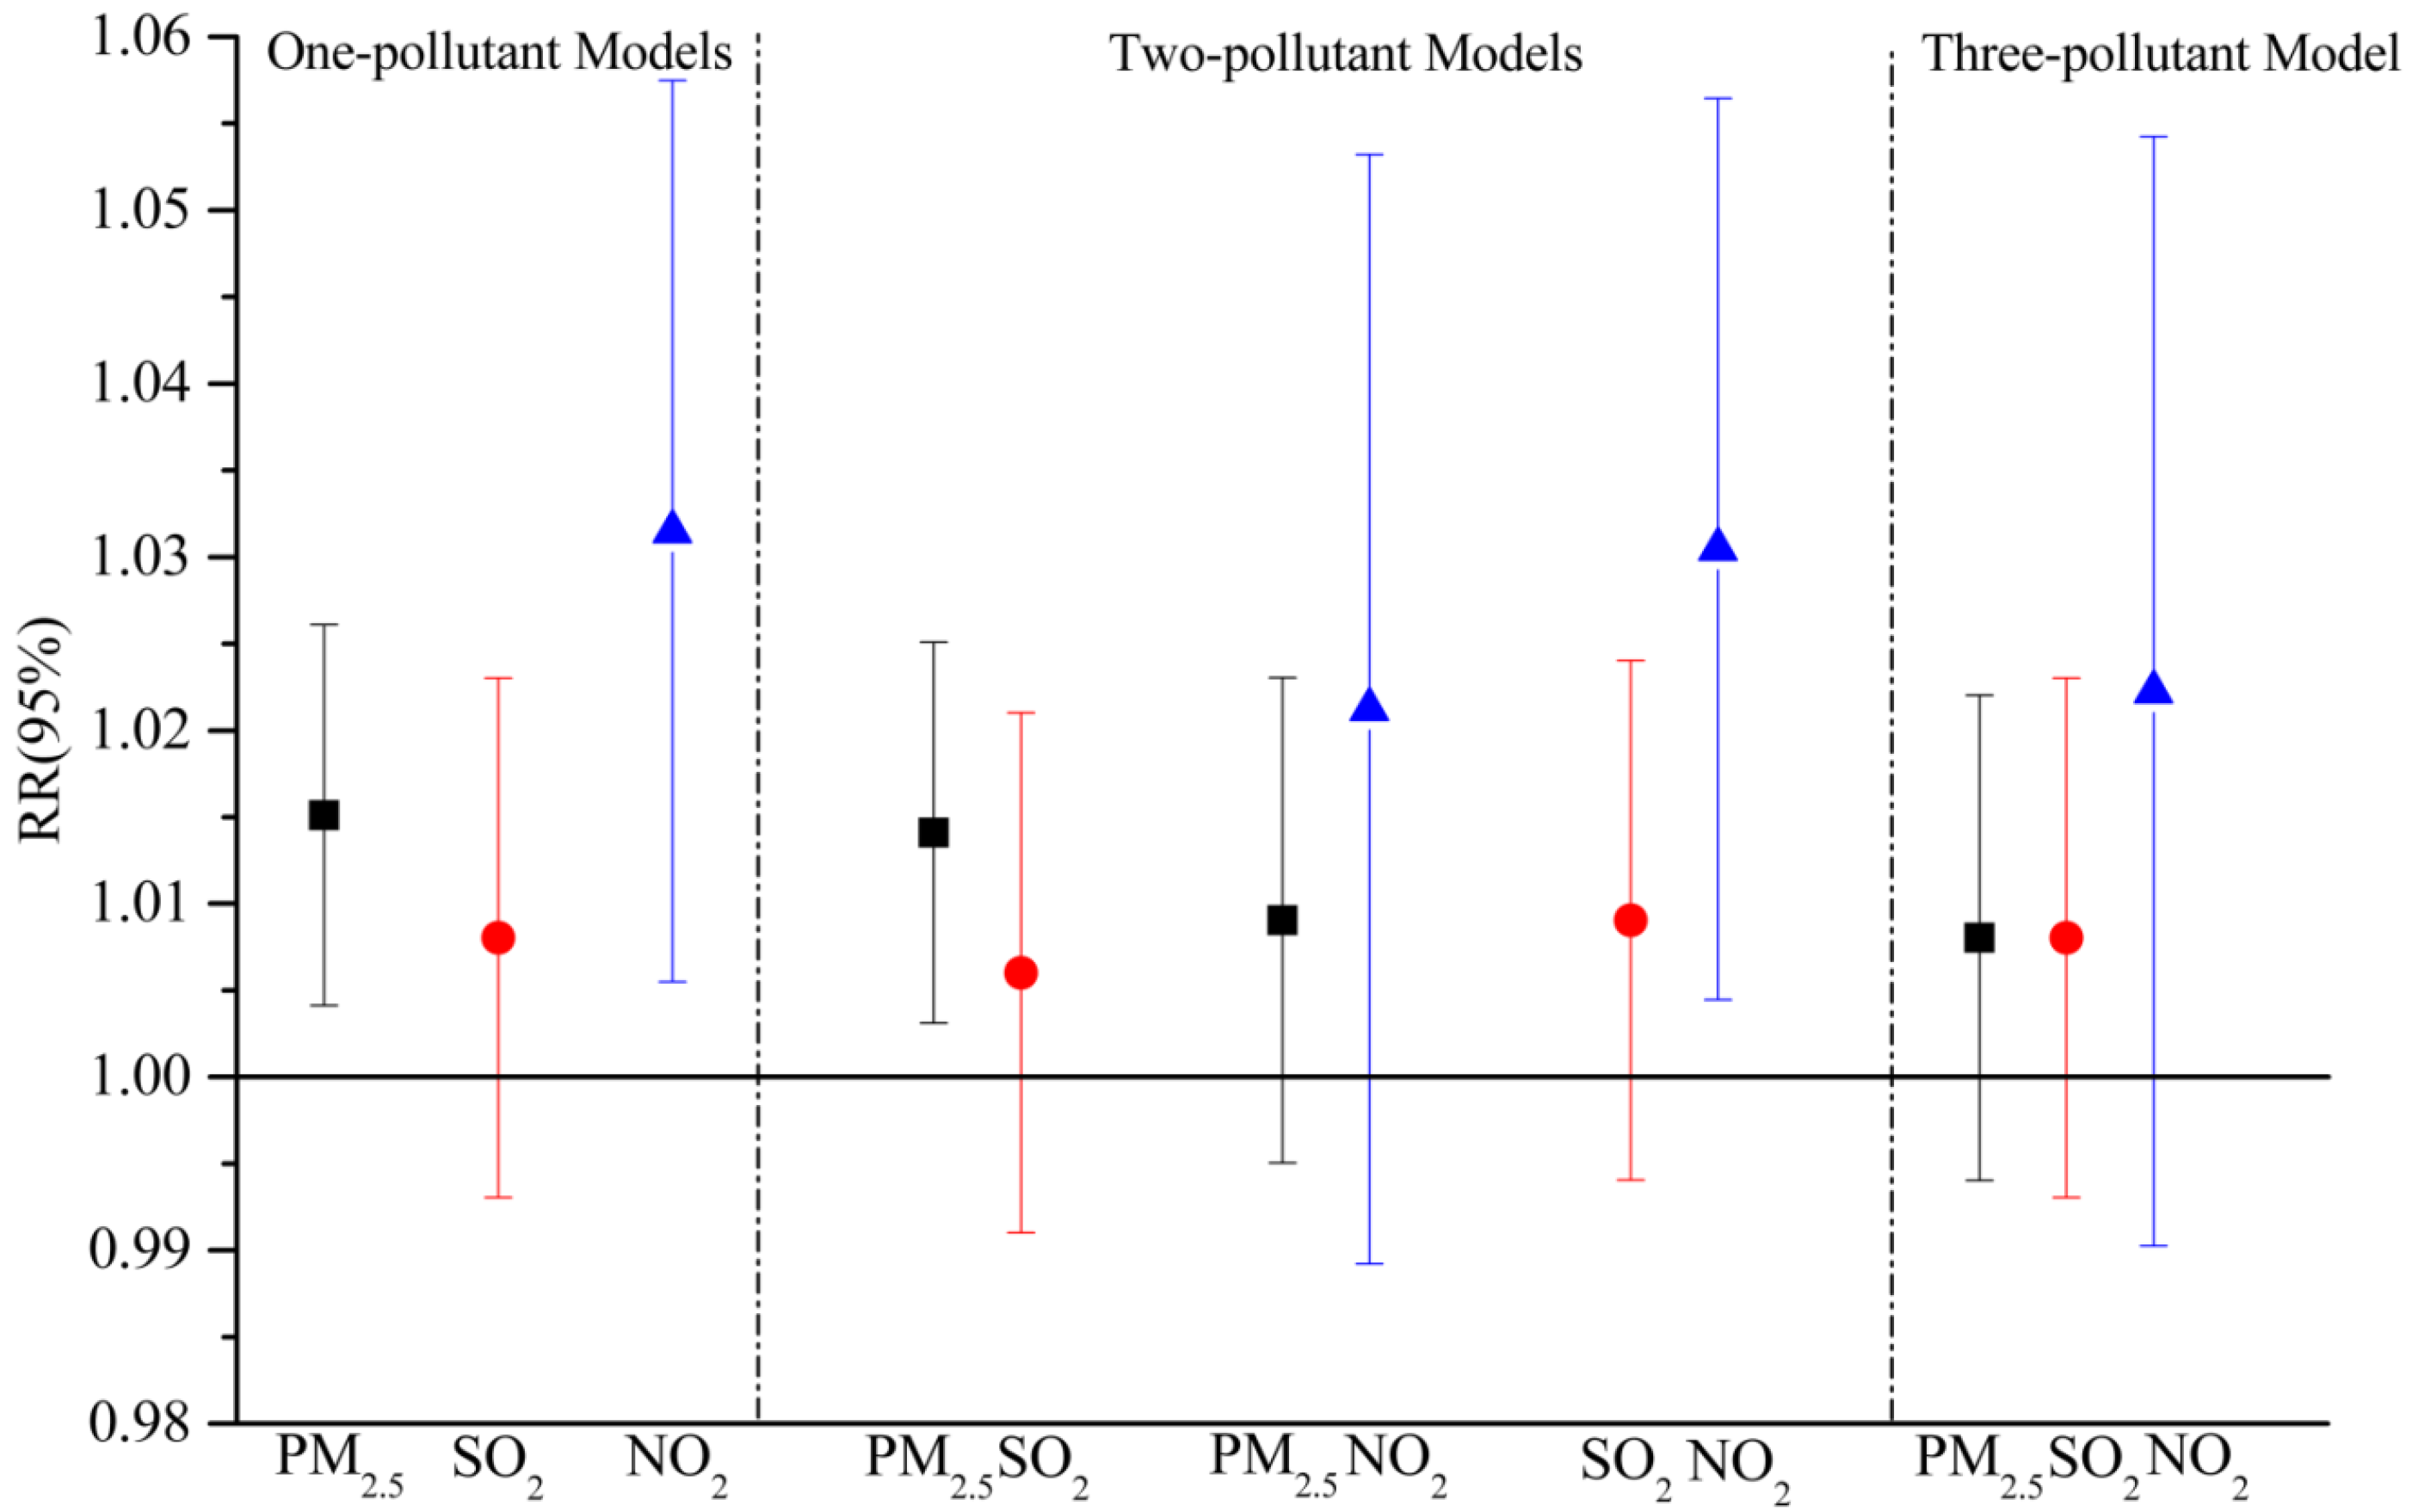
3.3. Muti-Pollutant Models

In one-pollutant models, strong associations with the daily number of ERVs were found in the total population of both areas. Considering the colinearity among air pollutants, we examined the relationships in multi-pollutant models with combinations of SO2, NO2 and PM2.5.
The results of multi-pollutant models for the urban population are shown in Figure 4. After the adjustment for PM2.5, the associations between gaseous pollutants and daily ERVs were not statistically significant, whereas the estimated effects of PM2.5 observed for respiratory emergency room visits were not substantially attenuated when SO2 and (or) NO2 were included in the models. Similar to other studies on urban air pollution, our findings showed that PM2.5 remained a significant association with the morbidity of respiratory diseases after controlling for confounding factors, such as long-term trend and weather conditions as well as other gaseous pollutants. This finding indicated that PM2.5 could be a strong predictor of hospital emergency room visits for respiratory diseases in urban areas, and similar results were reported in other cities [47,48].
However, some different results were found in the suburban area (Figure 5). After adjusting for SO2 in the two-pollutant model, PM2.5 had a significant relationship with ERVs for respiratory diseases, while the estimated effect of PM2.5 was no longer statistically significant by the addition of NO2. Similarly, the relative risk of NO2 evaluated in the two-pollutant models with SO2 was 1.030 (95% CI: 1.004, 1.056), while a positive but insignificant association with NO2 were observed after an adjustment for PM2.5 [1.022, 95% CI (0.990, 1.054)]. In addition, in the three-pollutant model, there was no evidence observed that PM2.5, SO2 or NO2 had significant effects on the daily number of ERVs for respiratory diseases, which was also found in some other studies [49,50]. One potential explanation is the correlation coefficients between SO2, NO2 and PM2.5 in the suburban area were relatively higher than those in the urban area (Table 2), and those air pollutants could have more combined effects.

4. Conclusions

On the basis of a time series analysis of the relationship between air pollution and hospital emergency room visits (ERVs) for respiratory diseases in the urban and suburban areas of Jinan from 2013 to 2014, we observed that ERVs for respiratory illnesses were significantly associated with the levels of air pollutants and further corroborated that ERVs for respiratory diseases can be used as a sensitive indicator for health outcomes of air pollution. Females were found to be more susceptible to air pollution than males in the urban area when the analysis was stratified by gender, and the reverse trend was observed in the suburban area. Furthermore, air pollutants in the suburban area could have more combined effects on ERVs for respiratory illnesses than those in the urban area. Our findings indicate that there may be some urban-suburban discrepancies in the health outcomes of air pollutant exposure. Further studies need to be conducted in suburban areas to determine these discrepancies.

Acknowledgments

This research was supported by the National Natural Science Foundation of China (41475115) and Science and Technology Development Project of Shandong Province (2014GGE27399).

Author Contributions

Peng Liu analyzed the data and wrote the paper. Yan Wang helped in experiment design. Xining Wang helped in gathering data. Jiayin Fan helped in data entry. Wenxin Xiao critically reviewed the manuscript.

Conflicts of Interest

The authors declare no conflict of interest.

Abbreviations

The following abbreviations are used in this manuscript:
PM2.5Particulate matter less than 2.5 μm in diameter
ERVsEmergency room visits
RRRelative risk
HSHongjialou Subdistrict
ZTZhonggong Town

Appendix

Figure A1. Smooth function curves of relative humidity and temperature: (a) relative humidity; (b) temperature.
Ijerph 13 00341 g006

References

  1. Lozano, R.; Naghavi, M.; Foreman, K.; Lim, S.; Shibuya, K.; Aboyans, V.; Abraham, J.; Adair, T.; Aggarwal, R.; Ahn, S.Y. Global and regional mortality from 235 causes of death for 20 age groups in 1990 and 2010: A systematic analysis for the global burden of disease study 2010. Lancet 2013, 380, 2095–2128. [Google Scholar] [CrossRef]
  2. Maheswaran, R.; Haining, R.P.; Brindley, P.; Law, J.; Pearson, T.; Fryers, P.R.; Wise, S.; Campbell, M.J. Outdoor air pollution, mortality, and hospital admissions from coronary heart disease in Sheffield, UK: A small-area level ecological study. Eur. Hear. J. 2005, 26, 2543–2549. [Google Scholar] [CrossRef] [PubMed]
  3. Medina-Ramón, M.; Zanobetti, A.; Schwartz, J. The effect of ozone and PM10 on hospital admissions for pneumonia and chronic obstructive pulmonary disease: A national multicity study. Am. J. Epidemiol. 2006, 163, 579–588. [Google Scholar] [CrossRef] [PubMed]
  4. Bell, M.L.; Davis, D.L. Reassessment of the lethal London fog of 1952: Novel indicators of acute and chronic consequences of acute exposure to air pollution. Environ. Health Perspect. 2001, 109, 389. [Google Scholar] [CrossRef] [PubMed]
  5. Schwartz, J.; Dockery, D.W. Increased mortality in Philadelphia associated with daily air pollution concentrations. Am. Rev. Respir. Dis. 1992, 145, 600–604. [Google Scholar] [CrossRef] [PubMed]
  6. Pope, C., 3rd. Respiratory disease associated with community air pollution and a steel mill, Utah valley. Am. J. Public Health 1989, 79, 623–628. [Google Scholar] [CrossRef] [PubMed]
  7. Wichmann, H.; Mueller, W.; Allhoff, P.; Beckmann, M.; Bocter, N.; Csicsaky, M.; Jung, M.; Molik, B.; Schoeneberg, G. Health effects during a smog episode in west Germany in 1985. Environ. Health Perspect. 1989, 79, 89. [Google Scholar] [CrossRef] [PubMed]
  8. Bates, D.; Sizto, R. The Ontario air pollution study: Identification of the causative agent. Environ. Health Perspect. 1989, 79, 69. [Google Scholar] [CrossRef] [PubMed]
  9. Clancy, L.; Goodman, P.; Sinclair, H.; Dockery, D.W. Effect of air-pollution control on death rates in Dublin, Ireland: An intervention study. Lancet 2002, 360, 1210–1214. [Google Scholar] [CrossRef]
  10. Pönkä, A. Asthma and low level air pollution in Helsinki. Arch. Environ. Health 1991, 46, 262–270. [Google Scholar] [CrossRef] [PubMed]
  11. Gouveia, N.; Fletcher, T. Respiratory diseases in children and outdoor air pollution in São Paulo, Brazil: A time series analysis. Occup. Environ. Med. 2000, 57, 477–483. [Google Scholar] [CrossRef] [PubMed]
  12. Alberini, A.; Cropper, M.; Simon, N.B.; Sharma, P.K. The Health Effects of Air Pollution in Delhi, India: Policy Research Working Paper; World Bank Group: Washington, DC, USA, 1997. [Google Scholar]
  13. Loomis, D.; Castillejos, M.; Gold, D.R.; McDonnell, W.; Borja-Aburto, V.H. Air pollution and infant mortality in Mexico City. Epidemiology 1999, 10, 118–123. [Google Scholar] [CrossRef] [PubMed]
  14. Vichit-Vadakan, N.; Ostro, B.D.; Chestnut, L.G.; Mills, D.M.; Aekplakorn, W.; Wangwongwatana, S.; Panich, N. Air pollution and respiratory symptoms: Results from three panel studies in Bangkok, Thailand. Environ. Health Perspect. 2001, 109, 381. [Google Scholar] [CrossRef] [PubMed]
  15. Wong, C.-M.; Vichit-Vadakan, N.; Kan, H.; Qian, Z. Public health and air pollution in Asia (PAPA): A multicity study of short-term effects of air pollution on mortality. Environ. Health Perspect. 2008, 116, 1195. [Google Scholar] [CrossRef] [PubMed] [Green Version]
  16. Yang, Q.; Chen, Y.; Krewski, D.; Burnett, R.T.; Shi, Y.; McGrail, K.M. Effect of short-term exposure to low levels of gaseous pollutants on chronic obstructive pulmonary disease hospitalizations. Environ. Res. 2005, 99, 99–105. [Google Scholar] [CrossRef] [PubMed]
  17. Atkinson, R.; Anderson, H.; Strachan, D.; Bland, J.; Bremmer, S.; Ponce de Leon, A. Short-term associations between outdoor air pollution and visits to accident and emergency departments in London for respiratory complaints. Eur. Respir. J. 1999, 13, 257–265. [Google Scholar] [CrossRef] [PubMed]
  18. Wang, Y.; Zhang, Y.-S. Air quality assessment by contingent valuation in Jinan, China. J. Environ. Manag. 2009, 90, 1022–1029. [Google Scholar] [CrossRef] [PubMed]
  19. Tao, Y.; Mi, S.; Zhou, S.; Wang, S.; Xie, X. Air pollution and hospital admissions for respiratory diseases in Lanzhou, China. Environ. Pollut. 2014, 185, 196–201. [Google Scholar] [CrossRef] [PubMed]
  20. Zhou, M.; He, G.; Fan, M.; Wang, Z.; Liu, Y.; Ma, J.; Ma, Z.; Liu, J.; Liu, Y.; Wang, L. Smog episodes, fine particulate pollution and mortality in China. Environ. Res. 2015, 136, 396–404. [Google Scholar] [CrossRef] [PubMed]
  21. Liu, L.; Breitner, S.; Schneider, A.; Cyrys, J.; Brüske, I.; Franck, U.; Schlink, U.; Leitte, A.M.; Herbarth, O.; Wiedensohler, A. Size-fractioned particulate air pollution and cardiovascular emergency room visits in Beijing, China. Environ. Res. 2013, 121, 52–63. [Google Scholar] [CrossRef] [PubMed]
  22. Baldasano, J.; Valera, E.; Jimenez, P. Air quality data from large cities. Sci. Total. Environ. 2003, 307, 141–165. [Google Scholar] [CrossRef]
  23. Gao, X.; Yang, L.; Cheng, S.; Gao, R.; Zhou, Y.; Xue, L.; Shou, Y.; Wang, J.; Wang, X.; Nie, W. Semi-continuous measurement of water-soluble ions in PM2.5 in Jinan, China: Temporal variations and source apportionments. Atmos. Environ. 2011, 45, 6048–6056. [Google Scholar] [CrossRef]
  24. Zhu, Y.; Yang, L.; Meng, C.; Yuan, Q.; Yan, C.; Dong, C.; Sui, X.; Yao, L.; Yang, F.; Lu, Y.; et al. Indoor/outdoor relationships and diurnal/nocturnal variations in water-soluble ion and PAH concentrations in the atmospheric PM2.5 of a business office area in Jinan, a heavily polluted city in China. Atmos. Res. 2015, 153, 276–285. [Google Scholar] [CrossRef]
  25. Shi, L.; Zanobetti, A.; Kloog, I.; Coull, B.A.; Koutrakis, P.; Melly, S.J.; Schwartz, J.D. Low-concentration PM2.5 and mortality: Estimating acute and chronic effects in a population-based study. Environ. Health Perspect. 2015, 124, 46–52. [Google Scholar] [CrossRef] [PubMed]
  26. Symons, J.; Wang, L.; Guallar, E.; Howell, E.; Dominici, F.; Schwab, M.; Ange, B.; Samet, J.; Ondov, J.; Harrison, D. A case-crossover study of fine particulate matter air pollution and onset of congestive heart failure symptom exacerbation leading to hospitalization. Am. J. Epidemiol. 2006, 164, 421–433. [Google Scholar] [CrossRef] [PubMed]
  27. Guo, J.-B.; Sun, X.-L.; Ming, L.; Yu, J.-M.; Yi, S.-Y.; Ji, Q.; Li, Z.-L.; Xu, L.; Xing, L.-H.; Qiao, S.; et al. Jinan Statistical Yearbook 2013; China Statistics Press: Beijing, China, 2013. [Google Scholar]
  28. Wang, L.; Wen, L.; Xu, C.; Chen, J.; Wang, X.; Yang, L.; Wang, W.; Yang, X.; Sui, X.; Yao, L. HONO and its potential source particulate nitrite at an urban site in north China during the cold season. Sci. Total. Environ. 2015, 538, 93–101. [Google Scholar] [CrossRef] [PubMed]
  29. Yang, L.; Cheng, S.; Wang, X.; Nie, W.; Xu, P.; Gao, X.; Yuan, C.; Wang, W. Source identification and health impact of PM2.5 in a heavily polluted urban atmosphere in China. Atmos. Environ. 2013, 75, 265–269. [Google Scholar] [CrossRef]
  30. Yang, L.; Zhou, X.; Wang, Z.; Zhou, Y.; Cheng, S.; Xu, P.; Gao, X.; Nie, W.; Wang, X.; Wang, W. Airborne fine particulate pollution in Jinan, China: Concentrations, chemical compositions and influence on visibility impairment. Atmos. Environ. 2012, 55, 506–514. [Google Scholar] [CrossRef]
  31. The Bureau of Land and Resources of Jinan. Available online: http://www.jndlr.gov.cn/tabid/62/InfoID/13159/frtid/123/Default.aspx (accessed on 12 October 2011).
  32. Kan, H.; London, S.J.; Chen, G.; Zhang, Y.; Song, G.; Zhao, N.; Jiang, L.; Chen, B. Season, sex, age, and education as modifiers of the effects of outdoor air pollution on daily mortality in Shanghai, China: The public health and air pollution in Asia (PAPA) study. Environ. Health Perspect. 2008, 116, 1183. [Google Scholar] [CrossRef] [PubMed]
  33. Akaike, H. Factor analysis and AIC. Psychometrika 1987, 52, 317–332. [Google Scholar] [CrossRef]
  34. Luginaah, I.N.; Fung, K.Y.; Gorey, K.M.; Webster, G.; Wills, C. Association of ambient air pollution with respiratory hospitalization in a government-designated “area of concern”: The case of Windsor, Ontario. Environ. Health. Perspect. 2005, 290–296. [Google Scholar] [CrossRef]
  35. Bakke, P.S.; Hanoa, R.; Gulsvik, A. Educational level and obstructive lung disease given smoking habits and occupational airborne exposure: A Norwegian community study. Am. J. Epidemiol. 1995, 141, 1080–1088. [Google Scholar] [PubMed]
  36. Prescott, E.; Vestbo, J. Socioeconomic status and chronic obstructive pulmonary disease. Thorax 1999, 54, 737–741. [Google Scholar] [CrossRef] [PubMed]
  37. Zhong, N.; Wang, C.; Yao, W.; Chen, P.; Kang, J.; Huang, S.; Chen, B.; Wang, C.; Ni, D.; Zhou, Y. Prevalence of chronic obstructive pulmonary disease in China: A large, population-based survey. Am. J. Respir. Crit. Care Med. 2007, 176, 753–760. [Google Scholar] [CrossRef] [PubMed]
  38. Schols, A.M.; Broekhuizen, R.; Weling-Scheepers, C.A.; Wouters, E.F. Body composition and mortality in chronic obstructive pulmonary disease. Am. J. Clin. Nutr. 2005, 82, 53–59. [Google Scholar] [CrossRef] [PubMed]
  39. Xu, F.; Yin, X.; Zhang, M.; Shen, H.; Lu, L.; Xu, Y. Prevalence of physician-diagnosed COPD and its association with smoking among urban and rural residents in regional mainland China. Chest 2005, 128, 2818–2823. [Google Scholar] [CrossRef] [PubMed]
  40. Peel, J.L.; Tolbert, P.E.; Klein, M.; Metzger, K.B.; Flanders, W.D.; Todd, K.; Mulholland, J.A.; Ryan, P.B.; Frumkin, H. Ambient air pollution and respiratory emergency department visits. Epidemiology 2005, 16, 164–174. [Google Scholar] [CrossRef] [PubMed]
  41. Steenland, K.; Savitz, D.A. Topics in environmental epidemiology. Epidemiology 1998, 9, 213–214. [Google Scholar] [CrossRef]
  42. Horstman, D.H.; Folinsbee, L.J. Sulfur dioxide-induced bronchoconstriction in asthmatics exposed for short durations under controlled conditions: A selected review. In Susceptibility to Inhaled Pollutants; ASTM International: West Conshohocken, PA, USA, 1989. [Google Scholar]
  43. Winterton, D.L.; Kaufman, J.; Keener, C.V.; Quigley, S.; Farin, F.M.; Williams, P.V.; Koenig, J.Q. Genetic polymorphisms as biomarkers of sensitivity to inhaled sulfur dioxide in subjects with asthma. Ann. Allergy Asthma Immunol. 2001, 86, 232–238. [Google Scholar] [CrossRef]
  44. Chauhan, A.; Inskip, H.M.; Linaker, C.H.; Smith, S.; Schreiber, J.; Johnston, S.L.; Holgate, S.T. Personal exposure to nitrogen dioxide (NO2) and the severity of virus-induced asthma in children. Lancet 2003, 361, 1939–1944. [Google Scholar] [CrossRef]
  45. Sandstrom, T.; Stjernberg, N.; Eklund, A.; Ledin, M.; Bjermer, L.; Kolmodin-Hedman, B.; Lindstrom, K.; Rosenhall, L.; Angstrom, T. Inflammatory cell response in bronchoalveolar lavage fluid after nitrogen dioxide exposure of healthy subjects: A dose-response study. Eur. Respir. J. 1991, 4, 332–339. [Google Scholar] [PubMed]
  46. Tunnicliffe, W.; Burge, P.; Ayres, J. Effect of domestic concentrations of nitrogen dioxide on airway responses to inhaled allergen in asthmatic patients. Lancet 1994, 344, 1733–1736. [Google Scholar] [CrossRef]
  47. Tolbert, P.E.; Klein, M.; Peel, J.L.; Sarnat, S.E.; Sarnat, J.A. Multipollutant modeling issues in a study of ambient air quality and emergency department visits in Atlanta. J. Expo. Sci. Environ. Epidemiol. 2007, 17, S29–S35. [Google Scholar] [CrossRef] [PubMed]
  48. Halonen, J.I.; Lanki, T.; Yli-Tuomi, T.; Kulmala, M.; Tiittanen, P.; Pekkanen, J. Urban air pollution and asthma and COPD hospital emergency room visits. Thorax 2008, 63, 635–641. [Google Scholar] [CrossRef] [PubMed]
  49. Slaughter, J.C.; Kim, E.; Sheppard, L.; Sullivan, J.H.; Larson, T.V.; Claiborn, C. Association between particulate matter and emergency room visits, hospital admissions and mortality in Spokane, Washington. J. Expo. Sci. Environ. Epidemiol. 2005, 15, 153–159. [Google Scholar] [CrossRef] [PubMed]
  50. Xu, M.; Guo, Y.; Zhang, Y.; Westerdahl, D.; Mo, Y.; Liang, F.; Pan, X. Spatiotemporal analysis of particulate air pollution and ischemic heart disease mortality in Beijing, China. Environ. Health 2014, 13, 1–12. [Google Scholar] [CrossRef] [PubMed]
Figure 1. Time series distributions of SO2, NO2 and PM2.5 in Jinan during 2013 to 2014. The horizontal lines in (a); (b) and (c) represent the standard daily average limits of SO2 (150 μg/m3), NO2 (80 μg/m3) and PM2.5 (75 μg/m3) in Chinese National Ambient Air Quality Standards (CNAAQS), respectively.
Ijerph 13 00341 g001
Figure 2. Relative risks (RRs with 95% CI) of hospital emergency room visits for respiratory complaints in association with per 10μg/m3 increase in PM2.5, SO2 and NO2 for the urban population of Jinan at different lags (lag0, lag1, lag2, lag3, lag4).
Ijerph 13 00341 g002
Figure 3. Relative risks (RRs with 95% CI) of hospital emergency room visits for respiratory complaints in association with per 10 μg/m3 increase in PM2.5, SO2 and NO2 for the suburban population of Jinan at different lags (lag0, lag1, lag2, lag3, lag4).
Ijerph 13 00341 g003
Figure 4. Adjusted estimated relative risks (RRs with 95% CI) of emergency room visits due to respiratory complaints with per 10 μg/m3 increase in PM2.5, SO2 and NO2 in multi-pollutant models for the urban population in Jinan.
Ijerph 13 00341 g004
Figure 5. Adjusted estimated relative risk (RRs with 95% CI) of emergency room visits due to respiratory complaints with per 10 μg/m3 increase in PM2.5, SO2 and NO2 in muti-pollutant models for the suburban population in Jinan.
Ijerph 13 00341 g005
Table 1. Summary of daily air pollutants during 2013–2014 (μg/m3).
AreaPollutantMean ± SDMin25%th50%th75%thMaxESR 1 (%)
UrbanSO295.4 ± 67.39.045.076.0129.0456.020.3
NO260.0 ± 29.67.039.057.076.0180.020.4
PM2.5108.0 ± 64.621.067.091.0132.0452.067.2
SuburbanSO249.9 ± 32.44.026.041.066.0263.01.6
NO238.9 ± 21.58.022.034.049.0140.05.7
PM2.570.7 ± 41.213.044.060.084.0373.033.9
1 ESR: exceeding standard ratio.
Table 2. Pearson correlation coefficients between outdoor air pollutants and meteorology parameters in the urban and suburban areas of Jinan.
PollutantSO2NO2PM2.5Temperature
NO20.677 * (0.706 *) 1
PM2.50.563 * (0.656 *)0.628 * (0.659 *)
Temperature−0.534 * (−0.534 *)−0.626 * (−0.466 *)−0.251 * (−0.289 *)
Relative humidity−0.059 (0.008)0.123 * (−0.001)0.354 * (0.259 *)0.129 * (0.129 *)
1 The correlation coefficients in the suburb are in parentheses; * p < 0.05.
Table 3. Percent increase (95% CI) of hospital emergency room visits for respiratory diseases with a 10 μg/m3 increase in PM2.5, SO2 and NO2 in one-pollutant models for the urban and suburban populations in Jinan.
AreaPollutantTotal (%)Female (%)Male (%)
UrbanPM2.51.4 (0.7, 2.1)1.6 (0.7, 2.5)1.2 (0.2, 2.2)
SO21.2 (0.5,1.9)2.1 (1.2, 3.0)0.1 (−0.9, 1.1)
NO22.5 (0.8, 4.2)3.4 (1.1, 5.7)1.5 (−1.0, 4.0)
SuburbanPM2.51.5 (0.4, 2.6)1.1 (−0.4, 2.6)2.4 (0.8, 4.0)
SO20.8 (−0.7, 2.3)1.1 (−0.9, 3.1)2.0 (−0.1, 4.1)
NO23.1 (0.5, 5.7)1.3 (−2.3, 4.9)6.9 (3.4, 10.4)

