
Toxicity of Smokeless Tobacco Extract after 184-Day Repeated Oral Administration in Rats

 ,
,
Abstract
:1. Introduction
2. Materials and Methods
2.1. Experimental Animals and Housing Conditions
2.2. Sample Preparation Procedures
2.3. Experimental Design
2.4. Clinical Observations
2.5. Clinical Test Parameters
2.5.1. Hematology
2.5.2. Serum Biochemistry
2.6. Necropsy and Histopathology
2.7. Statistical Analysis
3. Results
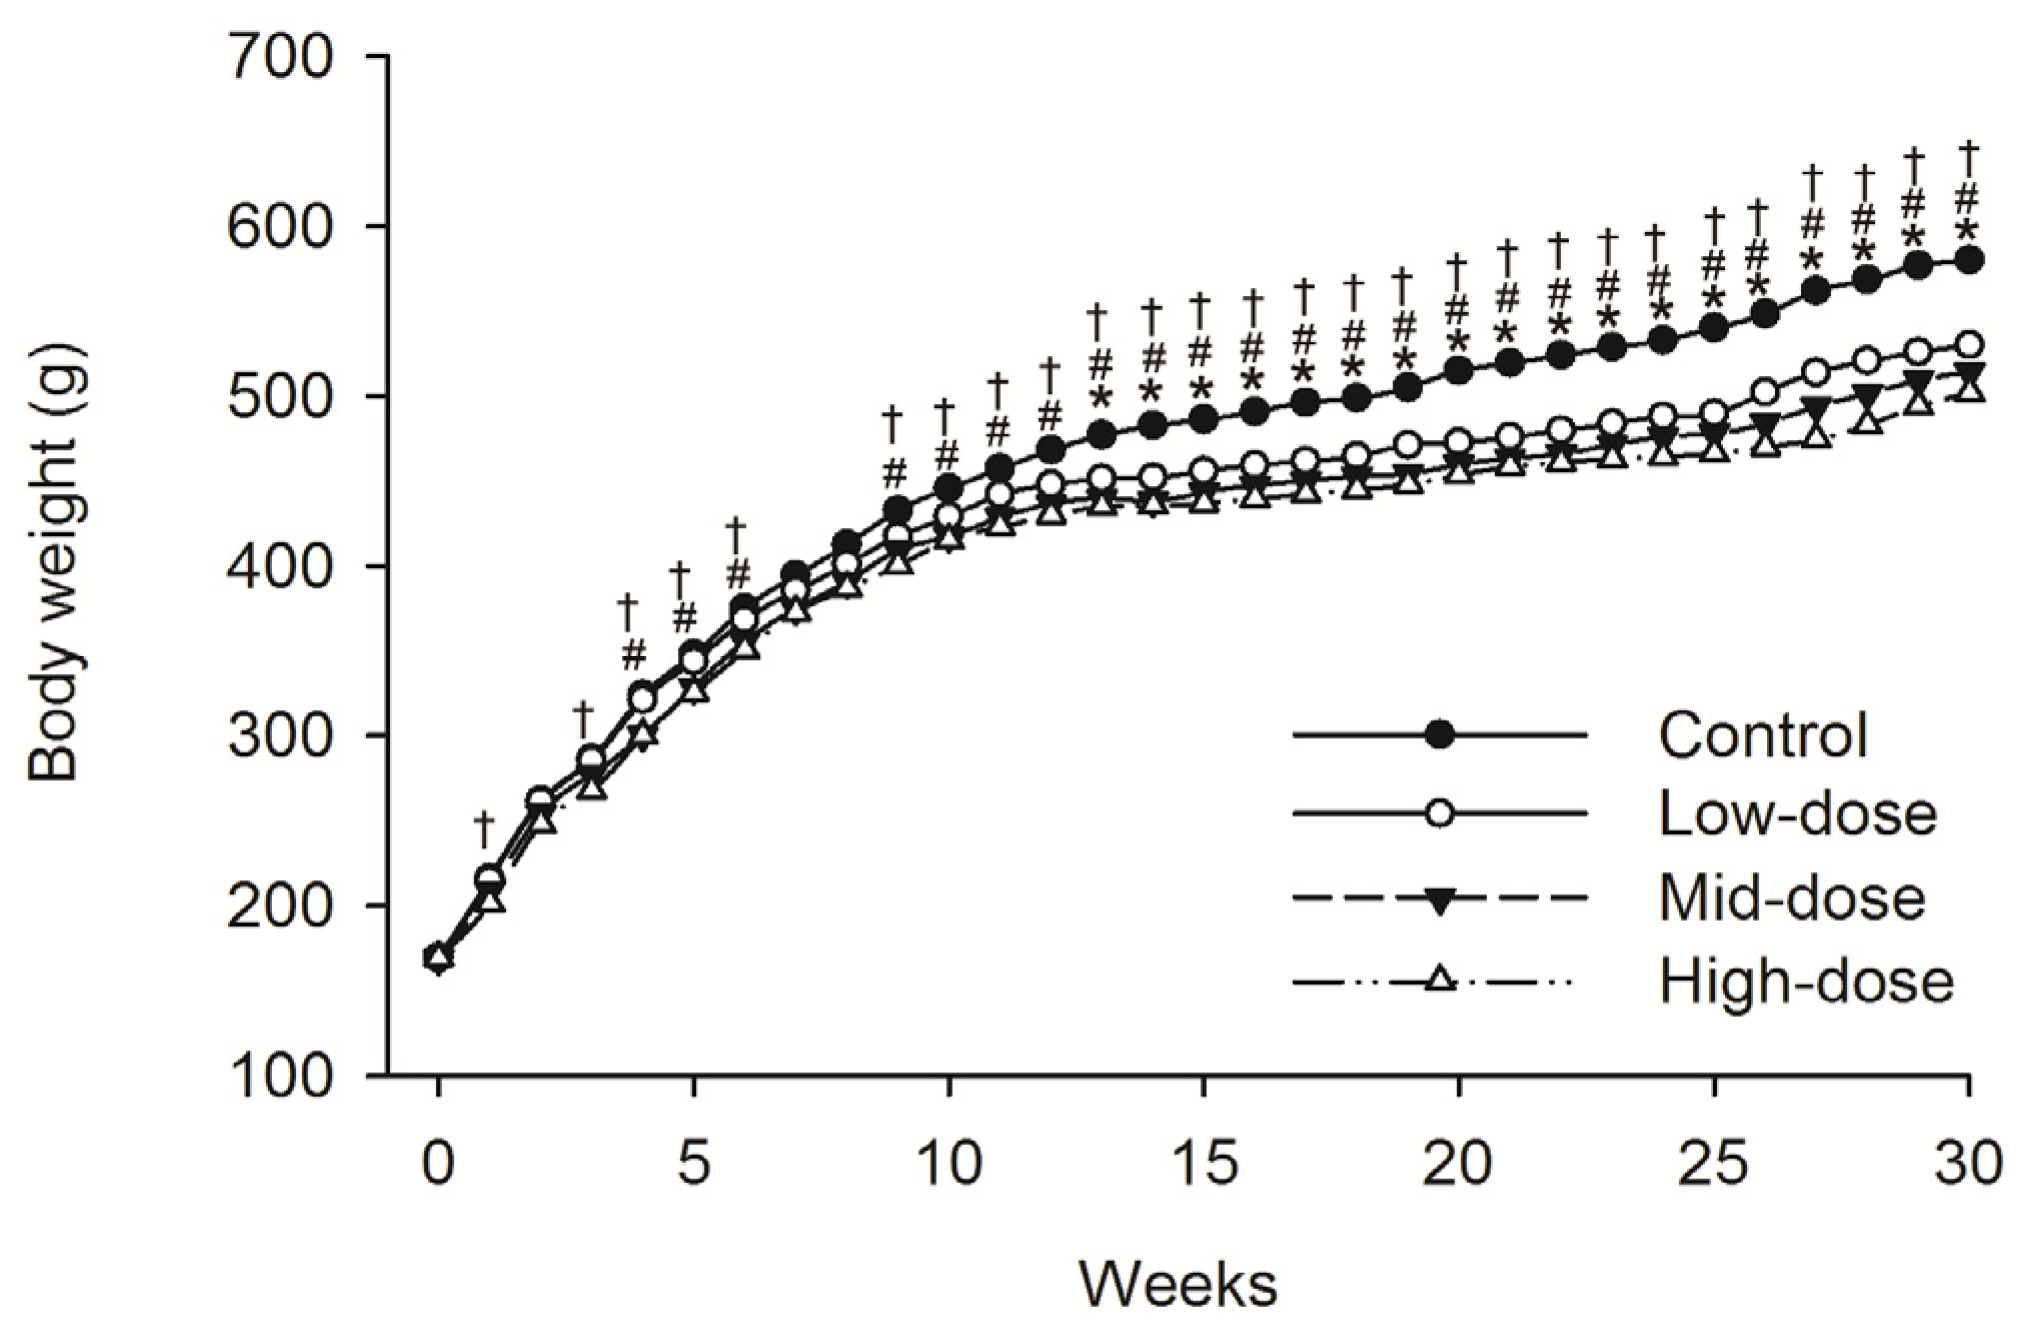
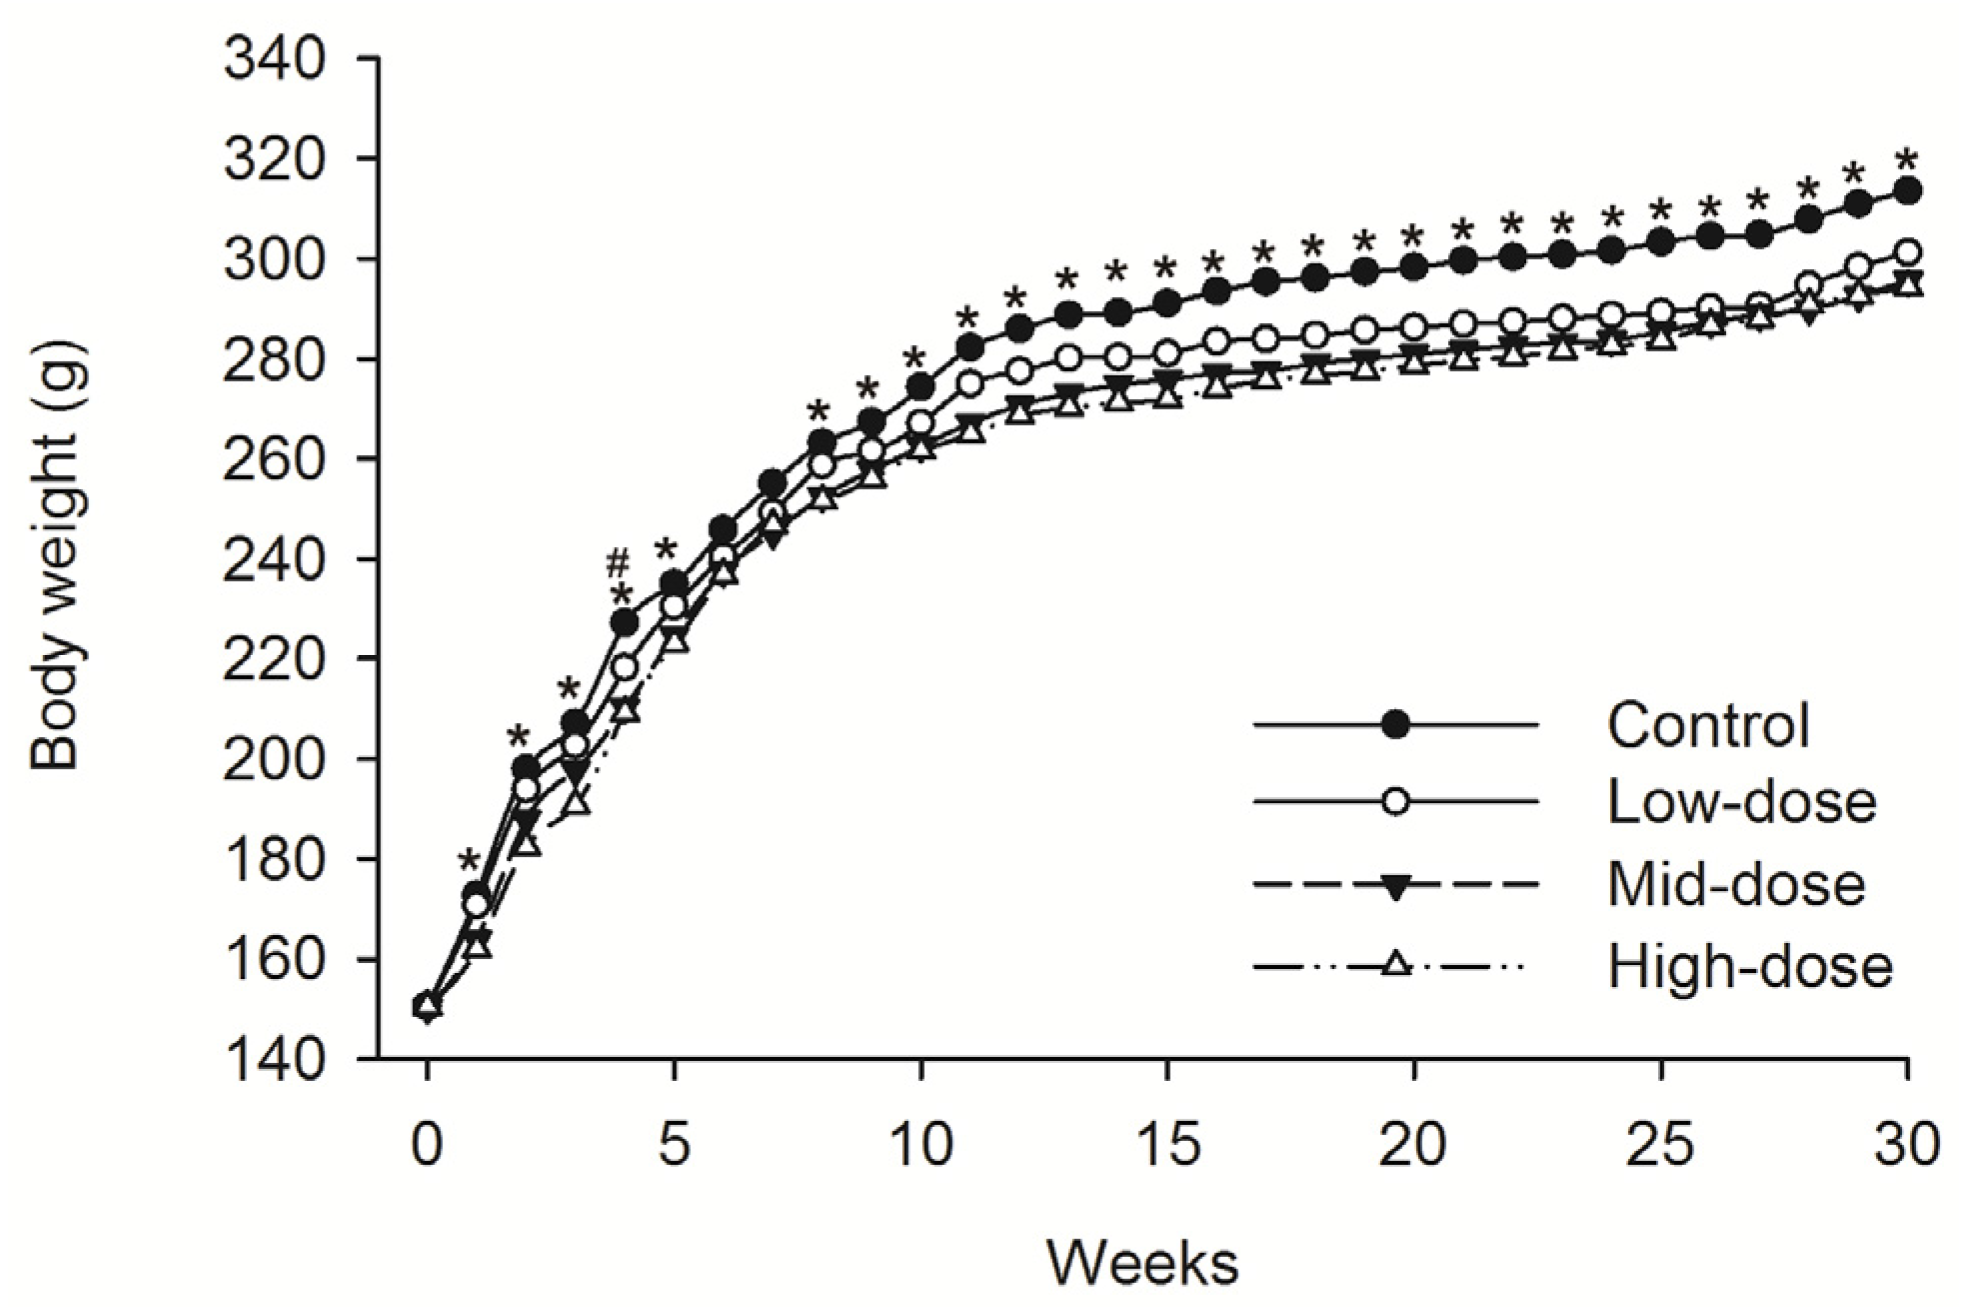
3.1. Clinical Observations
3.2. Clinical Test Parameters
3.2.1. Hematology
3.2.2. Serum Biochemistry
3.3. Necropsy and Histopathlolgoy
3.3.1. Organ Weights
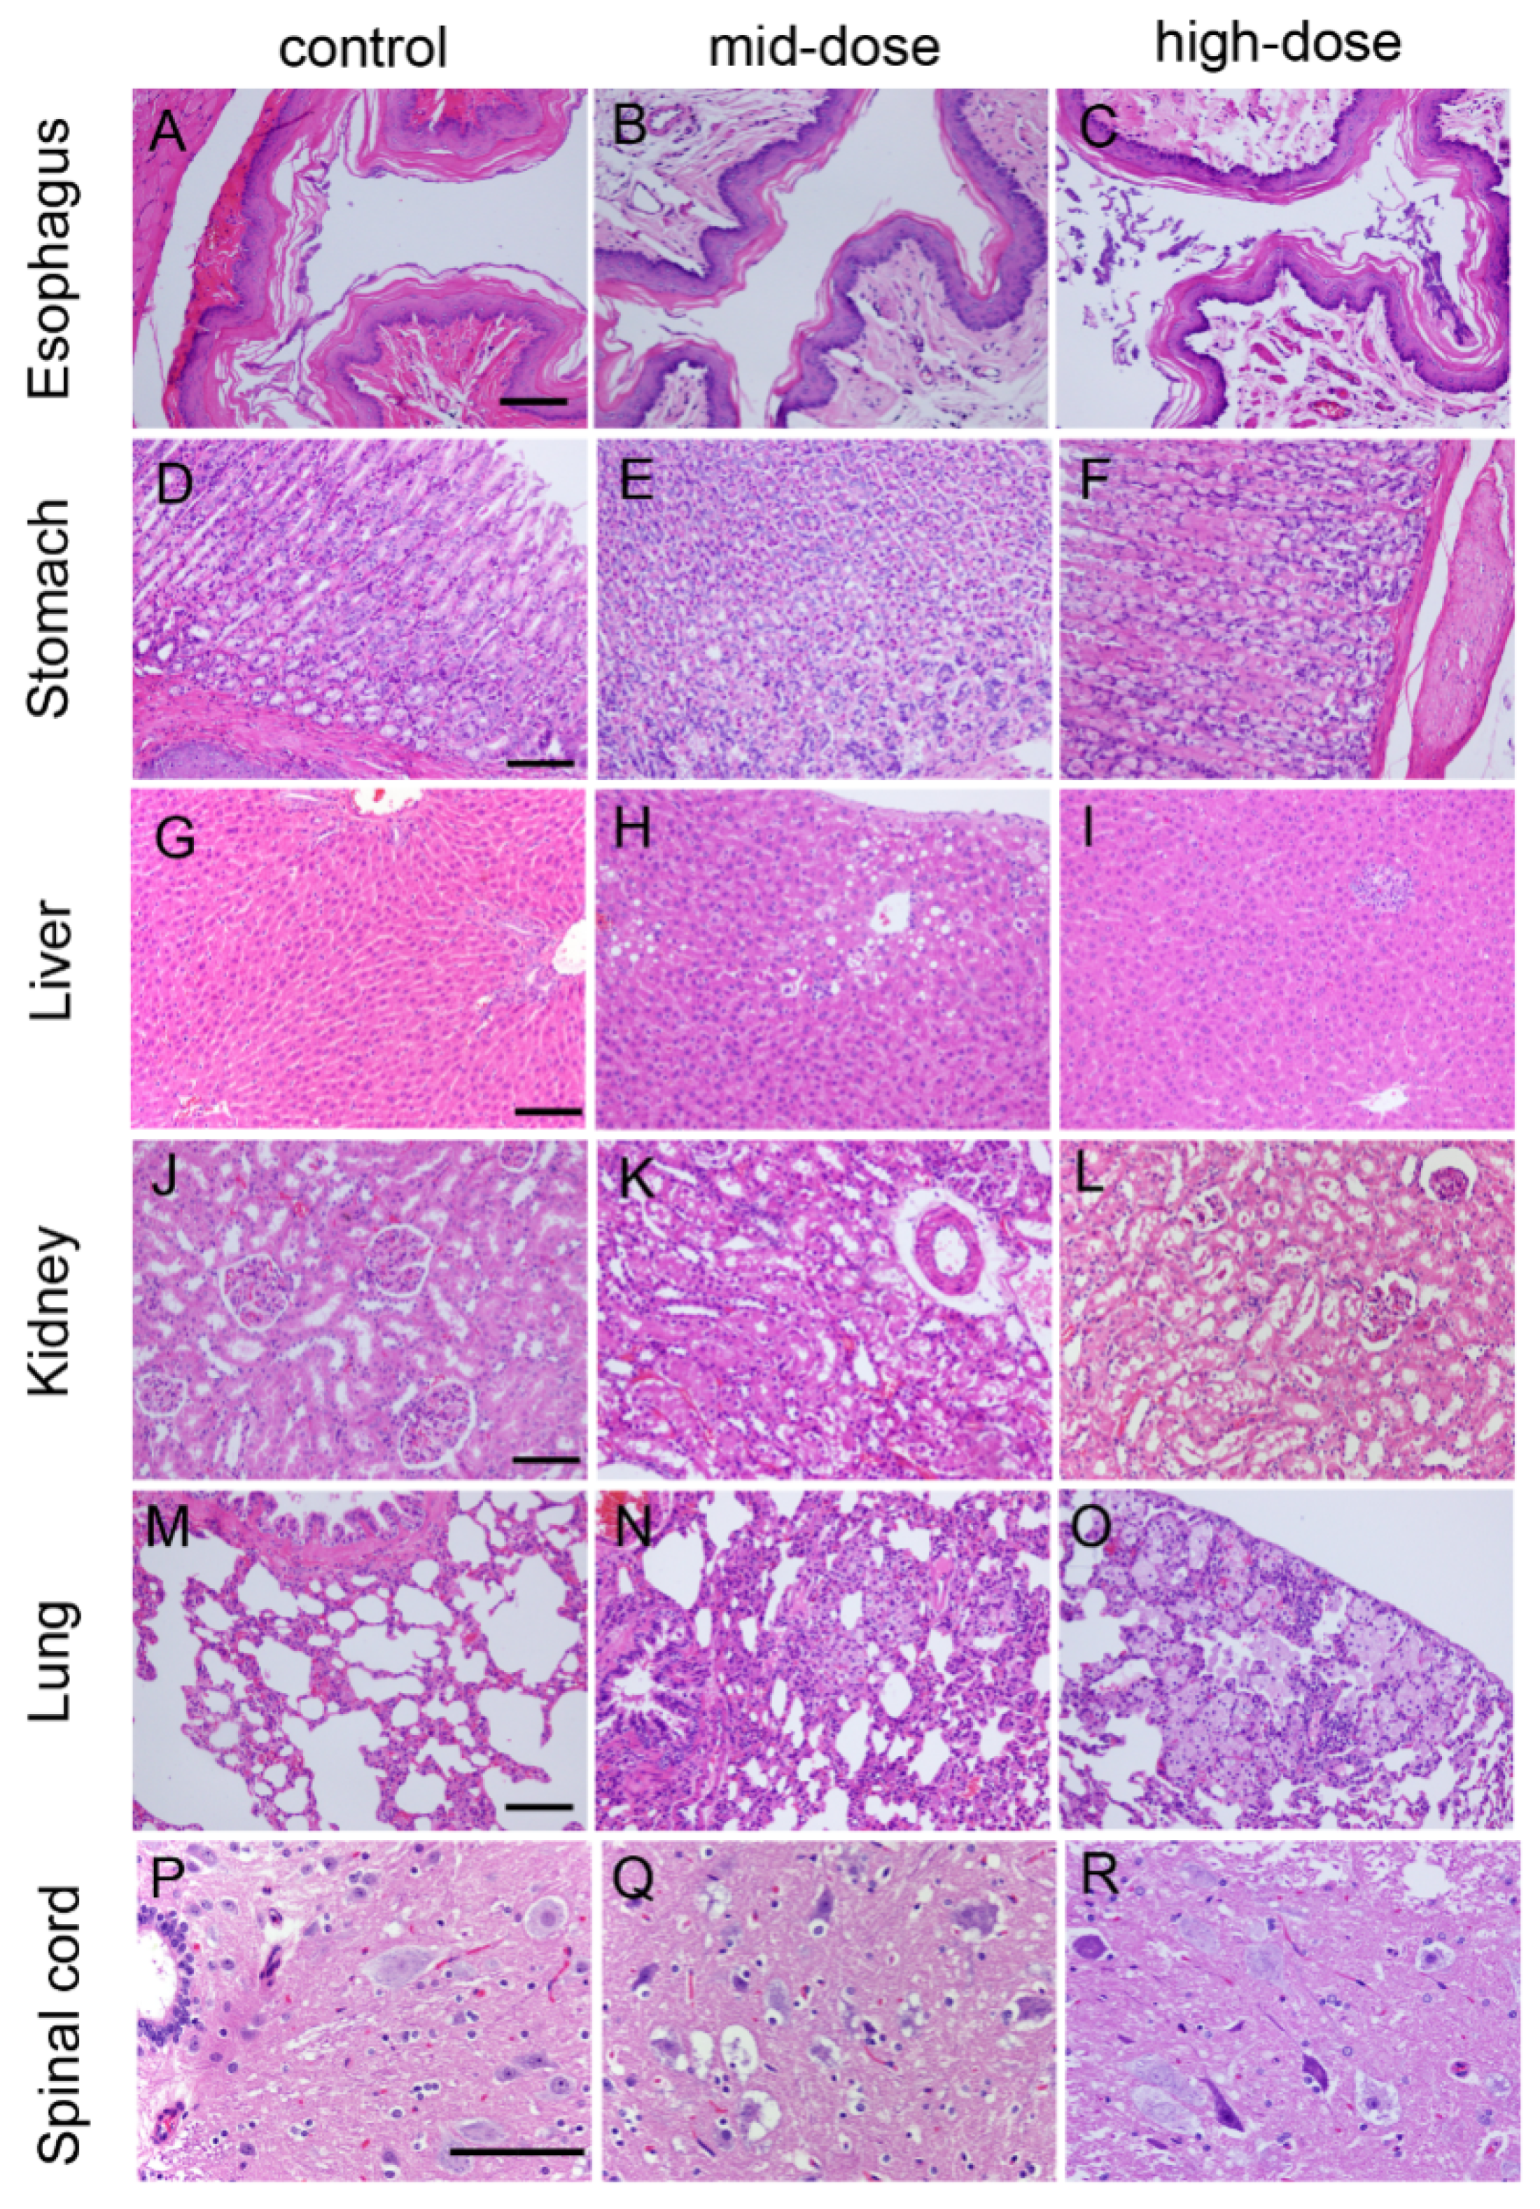
3.3.2. Histopathologic Findings
4. Discussion
5. Conclusions
Acknowledgments
Author Contributions
Conflicts of Interest
References
- Begum, S.; Schensul, J.J.; Nair, S.; Donta, B. Initiating smokeless tobacco use across reproductive stages. Asian Pac. J. Cancer Prev. 2015, 16, 7547–7554. [Google Scholar] [CrossRef] [PubMed]
- Bartal, M. Health effects of tobacco use and exposure. Monaldi Arch. Chest Dis. 2001, 56, 545–554. [Google Scholar] [PubMed]
- Giovino, G.A.; Mirza, S.A.; Samet, J.M.; Gupta, P.C.; Jarvis, M.J.; Bhala, N.; Peto, R.; Zatonski, W.; Hsia, J.; Morton, J.; et al. GATS Collaborative Group. Tobacco use in 3 billion individuals from 16 countries: An analysis of nationally representative cross-sectional household surveys. Lancet 2012, 380, 668–679. [Google Scholar] [CrossRef]
- World Health Organization. Tobacco: Leading Cause of Death, Illness and Impoverishment. Available online: http://www.who.int/mediacentre/factsheets/fs339/en/ (accessed on 9 January 2016).
- Ezzati, M.; Lopez, A.D. Regional, disease specific patterns of smoking-attributable mortality in 2000. Tob. Control 2004, 13, 388–395. [Google Scholar] [CrossRef] [PubMed]
- Tobacco Free Initiative. Tobacco: Deadly in Any Form or Disguise; World Health Organization: Geneva, Switzerland, 2006. [Google Scholar]
- Mejia, A.B.; Ling, P.M. Tobacco industry consumer research on smokeless tobacco users and product development. Am. J. Public Health 2010, 100, 78–87. [Google Scholar] [CrossRef] [PubMed]
- World Health Organization. 2012 Global Progress Report on Implementation of the WHO Framework Convention on Tobacco Control; World Health Organization Framework Convention on Tobacco Control (WHO FCTC). Available online: http://www.who.int/fctc/reporting/summaryreport.pdf (accessed on 9 January 2016).
- Bahreinifar, S.; Sheon, N.M.; Ling, P.M. Is Snus the same as dip? Smokers’ perceptions of new smokeless tobacco advertising. Tob. Control 2013, 22, 84–90. [Google Scholar] [CrossRef] [PubMed]
- Willis, D.N.; Popovech, M.A.; Gany, F.; Hoffman, C.; Blum, J.L.; Zelikoff, J.T. Toxicity of gutkha, a smokeless tobacco product gone global: Is there more to the toxicity than nicotine? Int. J. Environ. Res. Public Health 2014, 11, 919–933. [Google Scholar] [CrossRef] [PubMed]
- Bagchi, M.; Balmoori, J.; Bagchi, D.; Ray, S.D.; Kuszynski, C.; Stohs, S.J. Smokeless tobacco, oxidative stress, apoptosis, and antioxidants in human oral keratinocytes. Free Radic. Biol. Med. 1999, 26, 992–1000. [Google Scholar] [CrossRef]
- Gupta, P.C.; Ray, C.S. Smokeless tobacco and health in India and South Asia. Respirology 2003, 8, 419–431. [Google Scholar] [CrossRef] [PubMed]
- Prabhakar, V.; Jayakrishnan, G.; Nair, S.V.; Ranganathan, B. Determination of trace metals, moisture, pH and assessment of potential toxicity of selected smokeless tobacco products. Indian J. Pharm. Sci. 2013, 75, 262–269. [Google Scholar] [PubMed]
- Krautter, G.R.; Potts, R.J.; Mould, A.P. Comparative toxicity of nicotine and a tobacco pellet to Sprague-Dawley rats in a 90-day feeding study. In Proceedings of the American College of Toxicology Annual Meeting, Tucson, AZ, America, 9 November 2008.
- Theophilus, E.H.; Hayes, J.R.; Ayres, P.H.; Morgan, W.T.; Potts, R.J.; Garner, C.D.; Fallacara, D.M.; Hejtmancik, M.R.; Singer, A.W. Toxicological evaluation of smokeless tobacco: 2-Year chronic toxicity and carcinogenicity feeding study in Wistar Han rats. Exp. Toxicol. Pathol. 2015, 67, 539–550. [Google Scholar] [CrossRef] [PubMed]
- Theophilus, E.H.; Hayes, J.R.; Potts, R.J.; Ayres, P.H.; Williams, C.D.; Garner, C.D. Toxicological evaluation of smokeless tobacco: 90-Day rodent feeding studies. Exp. Toxicol. Pathol. 2012, 64, 15–24. [Google Scholar] [CrossRef] [PubMed]
- Avti, P.K.; Kumar, S.; Pathak, C.M.; Vaiphei, K.; Khanduja, K.L. Smokeless tobacco impairs the antioxidant defense in liver, lung, and kidney of rats. Toxicol. Sci. 2006, 89, 547–553. [Google Scholar] [CrossRef] [PubMed]
- Sinusas, K.; Coroso, J.G. A 10-Year study of smokeless tobacco use in a professional baseball organization. Med. Sci. Sports Exerc. 2006, 38, 1204–1207. [Google Scholar] [CrossRef] [PubMed]
- Sinusas, K.; Coroso, J.G.; Sopher, M.D.; Crabtree, B.F. Smokeless tobacco use and oral pathology in a professional baseball organization. J. Fam. Pract. 1992, 34, 713–718. [Google Scholar] [PubMed]
- Daniels, T.E.; Hansen, L.S.; Greenspan, J.S.; Grady, D.G.; Hauck, W.W.; Greene, J.C.; Ernster, V.L. Histopathology of smokeless tobacco lesions in professional baseball players. Associations with different types of tobacco. Oral Surg. Oral Med. Oral Pathol. 1992, 73, 720–725. [Google Scholar] [CrossRef]
- Ernster, V.L.; Grady, D.G.; Greene, J.C.; Walsh, M.; Robertson, P.; Daniels, T.E.; Benowitz, N.; Siegel, D.; Gerbert, B.; Hauck, W.W. Smokeless tobacco use and health effects among baseball players. JAMA 1990, 264, 218–224. [Google Scholar] [CrossRef] [PubMed]
- Robertson, P.B.; Walsh, M.M.; Greene, J.C. Oral effects of smokeless tobacco use by professional baseball players. Adv. Dent. Res. 1997, 11, 307–312. [Google Scholar] [CrossRef] [PubMed]
- Kikendall, J.W.; Evaul, J.; Johnson, L.F. Effect of cigarette smoking on gastrointestinal physiology and non-neoplastic digestive disease. J. Clin. Gastroenterol. 1984, 6, 65–79. [Google Scholar] [PubMed]
- Endoh, K.; Leung, F.W. Effects of smoking and nicotine on the gastric mucosa: A review of clinical and experimental evidence. Gastroenterology 1994, 107, 864–878. [Google Scholar] [CrossRef]
- Kurata, J.H.; Nogawa, A.N. Meta-analysis of risk factors for peptic ulcer. Nonsteroidal antiinflammatory drugs, Helicobacter pylori, and smoking. J. Clin. Gastroenterol. 1997, 24, 2–17. [Google Scholar] [CrossRef] [PubMed]
- Wu, W.K.; Cho, C.H. The pharmacological actions of nicotine on the gastrointestinal tract. J. Pharmacol. Sci. 2004, 94, 348–358. [Google Scholar] [CrossRef] [PubMed]
- Aro, P.; Storskrubb, T.; Ronkainen, J.; Bolling-Sternevald, E.; Engstrand, L.; Vieth, M.; Stolte, M.; Talley, N.J.; Agréus, L. Peptic ulcer disease in a general adult population: The Kalixanda study: A random population-based study. Am. J. Epidemiol. 2006, 163, 1025–1034. [Google Scholar] [CrossRef] [PubMed]
- Henley, S.J.; Thun, M.J.; Connell, C.; Calle, E.E. Two large prospective studies of mortality among men who use snuff or chewing tobacco (United States). Cancer Causes Control 2005, 16, 347–358. [Google Scholar] [CrossRef] [PubMed]
- Kim, T.W.; Lim, J.H.; Song, I.B.; Park, S.J.; Yang, J.W.; Shin, J.C.; Suh, J.W.; Son, H.Y.; Cho, E.S.; Kim, M.S.; et al. Hepatoprotective and anti-hepatitis C viral activity of Platycodon grandiflorum extract on carbon tetrachloride-induced acute hepatic injury in mice. J. Nutr. Sci. Vitaminol. 2012, 58, 187–194. [Google Scholar] [CrossRef] [PubMed]
- Chen, M.; Wang, T.; Jiang, Z.Z.; Shan, C.; Wang, H.; Wu, M.J.; Zhang, S.; Zhang, Y.; Zhang, L.Y. Anti-inflammatory and hepatoprotective effects of total flavonoid C-glycosides from Abrus mollis extracts. Chin. J. Nat. Med. 2014, 12, 590–598. [Google Scholar] [PubMed]
- Han, J.H.; Chang, I.H.; Ahn, S.H.; Kwon, O.J.; Bang, S.H.; Choi, N.Y.; Park, S.W.; Myung, S.C.; Kim, H.W. Association between serum prostate-specific antigen level, liver function tests and lipid profile in healthy men. BJU Int. 2008, 102, 1097–1101. [Google Scholar] [CrossRef] [PubMed]
- Arimilli, S.; Damratoski, B.E.; Bombick, B.; Borgerding, M.F.; Prasad, G.L. Evaluation of cytotoxicity of different tobacco product preparations. Regul. Toxicol. Pharmacol. 2012, 64, 350–360. [Google Scholar] [CrossRef] [PubMed]
- Dygert, H.P. Snuff—A source of pathogenic bacteria in chronic bronchitis. N. Engl. J. Med. 1957, 257, 311–313. [Google Scholar] [CrossRef] [PubMed]
- Leslie, K.O. Pathology of interstitial lung disease. Clin. Chest Med. 2004, 25, 657–703. [Google Scholar] [CrossRef] [PubMed]
- Dollah, M.A.; Parhizkar, S.; Izwan, M. Effect of Nigella sativa on the kidney function in rats. Avicenna J. Phytomed. 2013, 3, 152–158. [Google Scholar] [PubMed]
- Treasure, J. Urtica semen reduces serum creatinine levels. J. Am. Herbal. Guild 2003, 4, 22–25. [Google Scholar]
- Walmsley, S.J.; Broeckling, C.; Hess, A.; Prenni, J.; Curthoys, N.P. Proteomic analysis of brush-border membrane vesicles isolated from purified proximal convoluted tubules. Am. J. Physiol. Renal. Physiol. 2010, 298, F1323–F1331. [Google Scholar] [CrossRef] [PubMed]


| Number | Group | Dose Group Abbreviations | Target Dosage of Nicotine (mg/kg/Day) | Number Animals/Group | |||||
|---|---|---|---|---|---|---|---|---|---|
| 92 Days | 184 Days | 214 Days | |||||||
| M | F | M | F | M | F | ||||
| 1 | Control | C | 0 | 5 | 5 | 10 | 10 | 5 | 5 |
| 2 | Aqueous extract of smokeless tobacco in low dose | L | 3.75 | 5 | 5 | 10 | 10 | 5 | 5 |
| 3 | Aqueous extract of smokeless tobacco in medium dose | M | 7.50 | 5 | 5 | 10 | 10 | 5 | 5 |
| 4 | Aqueous extract of smokeless tobacco in high dose | H | 15.00 | 5 | 5 | 10 | 10 | 5 | 5 |
| Hematology | Serum Chemistry |
|---|---|
| Erythrocyte count (RBC) | Alanine aminotransferase (ALT) |
| Hemoglobin concentration (HB) | Aspartate aminotransferase (AST) |
| Hematocrit (HCT) | Alkaline phosphatase (ALP) |
| Mean corpuscular volume (MCV) | Glucose (GLU) |
| Mean corpuscular hemoglobin (MCH) | Total protein (TP) |
| Mean corpuscular hemoglobin concentration (MCHC) | Albumin (ALB) |
| Platelet (PLT) | Urea nitrogen (BU) |
| Total leukocyte count (WBC) | Creatinine (CREA) |
| Lymphocytes (LYMPH) | Triglyceride (TG) |
| Monocytes (MONO) | Total cholesterol (TCH) |
| Eosinophils (EOS) | Total bilirubin (TBIL) |
| Basophils (BASO) | Gamma-glutamyltransferase (GGT) |
| Neutrophils (NEUT) | Calcium (CA) |
| Reticulocyte count (RETIC) | Phosphorus (P) |
| Prothrombin time (PT) | Creatine phosphokinase (CK) |
| Activated partial thromboplastin time (APTT) | Lactate dehydrogenase (LDH) |
| Thromboplastin time (TT) | Amylase (AMY) |
| Fibrinogen (FIB) | Lipase (LIP) |
| K+, Na+, Cl− |
| Items | Days | C | L | M | H |
|---|---|---|---|---|---|
| RBC (×1012 L−1) | d92 | 8.47 ± 0.34 | 8.25 ± 0.44 | 8.19 ± 0.21 | 8.30 ± 0.35 |
| d184 | 8.63 ± 0.55 | 8.30 ± 0.44 | 8.39 ± 0.38 | 8.16 ± 0.54 | |
| d214 | 8.00 ± 0.97 | 8.80 ± 0.41 | 8.91 ± 0.31 | 8.33 ± 0.55 | |
| HGB (g·L−1) | d92 | 147 ± 4 | 154 ± 6 | 144 ± 4 | 144 ± 5 |
| d184 | 142 ± 5 | 139 ± 5 | 143 ± 4 | 140 ± 6 | |
| d214 | 142 ± 8 | 142 ± 5 | 144 ± 3 | 143 ± 9 | |
| HCT (%) | d92 | 45.5 ± 3.4 | 49.1 ± 1.5 | 46.1 ± 1.4 | 44.2 ± 3.6 |
| d184 | 43.8 ± 1.7 | 43.1 ± 1.5 | 44.1 ± 1.2 | 42.4 ± 2.1 | |
| d214 | 41.4 ± 4.8 | 45.5 ± 0.6 | 45.5 ± 2.5 | 44.1 ± 4.4 | |
| MCV (fl) | d92 | 53.8 ± 4.4 | 54.4 ± 1.7 | 56.2 ± 0.7 | 53.4 ± 5.1 |
| d184 | 50.9 ± 1.7 | 52.0 ± 1.7 | 52.6 ± 1.9 | 52.1 ± 2.0 | |
| d214 | 51.8 ± 0.8 | 51.7 ± 1.8 | 51.0 ± 1.1 | 52.9 ± 2.5 | |
| MCH (pg) | d92 | 17.4 ± 0.4 | 17.0 ± 0.5 | 17.6 ± 0.2 | 17.3 ± 0.4 |
| d184 | 16.5 ± 0.6 | 16.8 ± 0.7 | 17.1 ± 0.6 | 16.8 ± 0.7 | |
| d214 | 17.9 ± 2.7 | 16.1 ± 0.8 | 16.1 ± 0.5 | 17.2 ± 0.6 | |
| MCHC (g·L−1) | d92 | 325 ± 26 | 314 ± 5 | 313 ± 4 | 327 ± 31 |
| d184 | 324 ± 4 | 324 ± 4 | 324 ± 4 | 322 ± 4 | |
| d214 | 346 ± 49 | 312 ± 14 | 316 ± 17 | 326 ± 24 | |
| PLT (×109 L−1) | d92 | 1041 ± 115 | 988 ± 107 | 1023 ± 57 | 1150 ± 166 |
| d184 | 1097 ± 63 | 1056 ± 60 | 1041 ± 107 | 1057 ± 161 | |
| d214 | 1066 ± 163 | 1000 ± 98 | 1050 ± 91 | 997 ± 74 | |
| WBC (×109 L−1) | d92 | 4.83 ± 2.09 | 5.63 ± 1.51 | 4.69 ± 0.88 | 5.25 ± 0.69 |
| d184 | 5.19 ± 1.02 | 5.13 ± 1.34 | 4.72 ± 1.25 | 4.65 ± 1.06 | |
| d214 | 4.24 ± 0.43 | 3.88 ± 1.11 | 4.00 ± 0.44 | 4.81 ± 1.73 | |
| NEUT (%) | d92 | 22.3 ± 4.5 | 33.1 ± 12 | 27.1 ± 6.7 | 21.8 ± 4.9 |
| d184 | 27.5 ± 8.1 | 37.6 ± 8.5 * | 31.8 ± 10.7 | 27.7 ± 5.8 | |
| d214 | 27.2 ± 6.3 | 28.0 ± 10.8 | 30.5 ± 7.2 | 27.4 ± 9.5 | |
| LYMPH (%) | d92 | 73.1 ± 5.0 | 61.8 ± 10.9 | 68.9 ± 6.9 | 74.1 ± 5.0 |
| d184 | 68.6 ± 7.8 | 58.7 ± 8.6 * | 64.9 ± 10.5 | 68.8 ± 6.2 | |
| d214 | 67.6 ± 6.2 | 66.8 ± 11.2 | 64.4 ± 7.3 | 68.2 ± 10.3 | |
| MONO (%) | d92 | 1.9 ± 0.2 | 3.1 ± 1.3 | 2.0 ± 0.7 | 2.4 ± 0.8 |
| d184 | 2.0 ± 0.8 | 2.2 ± 0.7 | 2.0 ± 0.7 | 2.0 ± 0.7 | |
| d214 | 2.6 ± 0.5 | 2.6 ± 0.4 | 2.9 ± 0.7 | 2.4 ± 0.6 | |
| EOS (%) | d92 | 2.3 ± 0.6 | 2.0 ± 0.2 * | 1.8 ± 0.4 * | 1.6 ± 0.3 * |
| d184 | 1.7 ± 0.7 | 1.6 ± 0.7 | 1.5 ± 0.4 * | 1.4 ± 0.8 * | |
| d214 | 2.4 ± 0.5 | 2.3 ± 0.6 | 1.9 ± 0.4 * | 1.7 ± 0.6 * | |
| BASO (%) | d92 | 0.1 ± 0.1 | 0.2 ± 0.1 | 0.1 ± 0.1 | 0.2 ± 0.1 |
| d184 | 0.1 ± 0.1 | 0.1 ± 0.1 | 0.1 ± 0.1 | 0.1 ± 0.1 | |
| d214 | 0.1 ± 0.1 | 0.1 ± 0.0 | 0.1 ± 0.0 | 0.0 ± 0.1 | |
| RETIC (%) | d92 | 2.36 ± 0.50 | 2.26 ± 0.44 | 1.80 ± 0.19 | 2.44 ± 0.25 |
| d184 | 1.97 ± 0.34 | 2.14 ± 0.43 | 1.97 ± 0.23 | 1.72 ± 0.48 | |
| d214 | 1.53 ± 0.16 | 1.43 ± 0.31 | 1.43 ± 0.31 | 1.71 ± 0.17 | |
| PT (s) | d92 | 14.7 ± 0.8 | 14.3 ± 0.3 | 14.6 ± 0.6 | 14.7 ± 0.3 |
| d184 | 13.6 ± 3.2 | 13.4 ± 2.9 | 13.8 ± 1.9 | 14.6 ± 0.7 | |
| d214 | 15.7 ± 1.2 | 15.6 ± 1.1 | 14.7 ± 0.9 | 15.2 ± 0.5 | |
| APTT (s) | d92 | 19.0 ± 1.3 | 18.9 ± 1.6 | 19.2 ± 2.1 | 18.2 ± 1.7 |
| d184 | 17.7 ± 2.7 | 16.3 ± 2.4 | 16.1 ± 3.0 | 14.5 ± 1.8 | |
| d214 | 15.8 ± 1.5 | 18.7 ± 2.7 | 14.2 ± 3.5 | 13.9 ± 2.2 | |
| TT (s) | d92 | 22.3 ± 1.9 | 21.9 ± 1.6 | 21.5 ± 2.4 | 20.2 ± 0.8 |
| d184 | 19.3 ± 0.7 | 19.2 ± 0.7 | 19.2 ± 0.5 | 18.8 ± 0.6 | |
| d214 | 21.6 ± 0.7 | 21.7 ± 1.7 | 21.9 ± 1.0 | 21.5 ± 1.3 | |
| FIB (mg/dL) | d92 | 2.20 ± 0.20 | 2.30 ± 0.30 | 2.10 ± 0.10 | 2.00 ± 0.10 |
| d184 | 2.25 ± 0.26 | 2.28 ± 0.13 | 2.29 ± 0.40 | 2.44 ± 1.19 | |
| d214 | 2.18 ± 0.22 | 2.27 ± 0.20 | 2.15 ± 0.12 | 2.04 ± 0.15 |
| Items | Days | C | L | M | H |
|---|---|---|---|---|---|
| RBC (×1012 L−1) | d92 | 8.03 ± 0.53 | 7.24 ± 0.54 | 7.32 ± 0.40 | 7.49 ± 0.52 |
| d184 | 7.50 ± 0.49 | 7.20 ± 0.26 | 7.56 ± 0.48 | 7.60 ± 0.56 | |
| d214 | 7.73 ± 0.20 | 7.34 ± 0.34 | 7.30 ± 1.05 | 6.98 ± 0.89 | |
| HGB (g·L−1) | d92 | 145 ± 8 | 138 ± 5 | 136 ± 6 | 138 ± 5 |
| d184 | 134 ± 6 | 130 ± 6 | 131 ± 6 | 131 ± 7 | |
| d214 | 129 ± 9 | 129 ± 5 | 127 ± 7 | 131 ± 5 | |
| HCT (%) | d92 | 46.1 ± 2.7 | 42.0 ± 3.2 | 41.5 ± 3.8 | 43.5 ± 1.0 |
| d184 | 41.1 ± 1.9 | 39.9 ± 1.9 | 40.3 ± 2.0 | 40.7 ± 2.1 | |
| d214 | 42.7 ± 1.2 | 40.8 ± 1.8 | 39.6 ± 5.3 | 38.2 ± 4.5 | |
| MCV (fl) | d92 | 57.6 ± 2.1 | 58.1 ± 2.4 | 56.8 ± 5.5 | 58.4 ± 4.1 |
| d184 | 54.9 ± 2.1 | 55.5 ± 1.4 | 53.4 ± 1.6 | 53.7 ± 1.6 | |
| d214 | 55.2 ± 0.8 | 55.6 ± 1.9 | 54.3 ± 1.2 | 54.7 ± 1.2 | |
| MCH (pg) | d92 | 18.0 ± 0.5 | 19.0 ± 0.9 | 18.6 ± 0.5 | 18.5 ± 0.8 |
| d184 | 17.8 ± 0.6 | 18.0 ± 0.4 | 17.3 ± 0.5 | 17.3 ± 0.5 | |
| d214 | 16.6 ± 1.1 | 17.6 ± 1.2 | 17.8 ± 3.7 | 19.1 ± 2.7 | |
| MCHC (g·L−1) | d92 | 314 ± 5 | 328 ± 21 | 330 ± 37 | 317 ± 13 |
| d184 | 325 ± 5 | 324 ± 3 | 325 ± 3 | 323 ± 4 | |
| d214 | 302 ± 19 | 317 ± 24 | 326 ± 63 | 348 ± 49 | |
| PLT (×109 L−1) | d92 | 1127 ± 95 | 1225 ± 218 | 1048 ± 278 | 1019 ± 95 |
| d184 | 1104 ± 133 | 1056 ± 102 | 1098 ± 90 | 1106 ± 87 | |
| d214 | 1153 ± 173 | 1106 ± 170 | 1128 ± 145 | 1102 ± 106 | |
| WBC (×109 L−1) | d92 | 3.21 ± 0.76 | 3.83 ± 0.85 | 4.33 ± 0.97 | 5.30 ± 0.98 * |
| d184 | 2.54 ± 0.66 | 3.03 ± 0.89 | 3.58 ± 2.13 | 4.81 ± 2.48 | |
| d214 | 3.65 ± 1.43 | 2.94 ± 1.10 | 2.53 ± 0.74 | 2.39 ± 0.53 | |
| NEUT (%) | d92 | 14.9 ± 5.8 | 11.8 ± 2.9 | 16.2 ± 3.4 | 15.2 ± 6.3 |
| d184 | 17.7 ± 7.3 | 20.2 ± 14.0 | 15.0 ± 4.5 | 18.2 ± 7.9 | |
| d214 | 22.0 ± 7.7 | 17.1 ± 3.2 | 19.5 ± 7.6 | 15.3 ± 5.7 | |
| LYMPH (%) | d92 | 81.1 ± 5.6 | 83.8 ± 3.3 | 80.2 ± 2.8 | 81.6 ± 6.5 |
| d184 | 78.3 ± 8.7 | 76.0 ± 14.5 | 81.3 ± 4.9 | 78.3 ± 7.7 | |
| d214 | 73.4 ± 8.3 | 77.8 ± 3.8 | 75.0 ± 6.8 | 80.9 ± 6.7 | |
| MONO (%) | d92 | 1.4 ± 0.3 | 2.1 ± 0.8 | 1.9 ± 0.8 | 1.7 ± 0.2 |
| d184 | 1.8 ± 1.3 | 2.0 ± 0.9 | 1.7 ± 0.4 | 2.1 ± 0.8 | |
| d214 | 2.3 ± 0.4 | 2.5 ± 1.0 | 2.5 ± 0.9 | 1.5 ± 0.6 | |
| EOS (%) | d92 | 2.1 ± 0.7 | 1.8 ± 0.5 * | 1.6 ± 0.3 * | 1.5 ± 0.2 * |
| d184 | 1.8 ± 0.6 | 1.5 ± 0.6 * | 1.4 ± 0.6 * | 1.3 ± 0.4 * | |
| d214 | 2.0 ± 0.6 | 2.3 ± 0.5 | 2.4 ± 0.7 | 2.0 ± 0.5 | |
| BASO (%) | d92 | 0.3 ± 0.1 | 0.2 ± 0.1 | 0.2 ± 0.1 | 0.2 ± 0.1 |
| d184 | 0.1 ± 0.1 | 0.0 ± 0.1 | 0.1 ± 0.1 | 0.1 ± 0.1 | |
| d214 | 0.1 ± 0.0 | 0.1 ± 0.1 | 0.1 ± 0.1 | 0.1 ± 0.0 | |
| RETIC (%) | d92 | 2.28 ± 0.47 | 2.12 ± 0.22 | 2.50 ± 0.16 | 2.80 ± 0.79 |
| d184 | 1.72 ± 0.43 | 1.89 ± 0.18 | 1.62 ± 0.36 | 1.60 ± 0.35 | |
| d214 | 1.53 ± 0.38 | 1.40 ± 0.21 | 1.75 ± 0.24 | 1.53 ± 0.25 | |
| PT (s) | d92 | 13.9 ± 0.5 | 13.8 ± 0.3 | 14.1 ± 0.1 | 14.4 ± 0.5 |
| d184 | 14.0 ± 0.4 | 13.8 ± 0.4 | 13.9 ± 0.7 | 14.6 ± 1.0 | |
| d214 | 14.3 ± 0.7 | 14.6 ± 0.8 | 14.6 ± 0.9 | 14.9 ± 0.8 | |
| APTT (s) | d92 | 17.8 ± 0.6 | 17.5 ± 0.7 | 17.5 ± 0.7 | 17.4 ± 1.0 |
| d184 | 15.8 ± 2.6 | 15.5 ± 2.0 | 15.6 ± 1.6 * | 14.5 ± 2.4 * | |
| d214 | 12.4 ± 1.4 | 12.9 ± 1.6 | 13.0 ± 1.7 | 11.8 ± 1.1 | |
| TT (s) | d92 | 21.8 ± 1.2 | 22.0 ± 1.5 | 21.3 ± 1.3 | 20.5 ± 1.8 |
| d184 | 19.1 ± 0.6 | 19.1 ± 1.0 | 19.2 ± 0.9 | 18.9 ± 0.5 | |
| d214 | 21.5 ± 1.4 | 22.5 ± 2.6 | 21.5 ± 0.8 | 21.8 ± 1.1 | |
| FIB (mg/dL) | d92 | 1.71 ± 0.08 | 1.80 ± 0.27 | 1.89 ± 0.16 | 1.86 ± 0.21 |
| d184 | 1.67 ± 0.12 | 1.69 ± 0.12 | 1.83 ± 0.43 | 1.72 ± 0.20 | |
| d214 | 1.74 ± 0.22 | 1.55 ± 0.19 | 1.71 ± 0.26 | 1.67 ± 0.09 |
| Items | Days | C | L | M | H |
|---|---|---|---|---|---|
| ALT (nmol·s−1·L−1) | d92 | 912 ± 111 | 1030 ± 290 | 941 ± 96 | 1004 ± 92 |
| d184 | 866 ± 134 | 841 ± 95 | 931 ± 105 | 2040 ± 1832 * | |
| d214 | 794 ± 65 | 759 ± 36 | 900 ± 261 | 978 ± 162 | |
| AST (nmol·s−1·L−1) | d92 | 2325 ± 535 | 2235 ± 197 | 2356 ± 407 | 2072 ± 273 |
| d184 | 2559 ± 458 | 2226 ± 223 | 2226 ± 213 | 3101 ± 1692 | |
| d214 | 1907 ± 238 | 2107 ± 567 | 2176 ± 566 | 2392 ± 224 | |
| TP (g·L−1) | d92 | 59.6 ± 2.6 | 59.2 ± 2.6 | 57.1 ± 2.0 | 56.9 ± 1.3 |
| d184 | 60.7 ± 1.6 | 57.1 ± 1.7 * | 58.2 ± 2.1 * | 56.3 ± 3.2 * | |
| d214 | 58.5 ± 1.7 | 57.5 ± 2.1 | 57.3 ± 1.8 | 57.4 ± 2.8 | |
| ALB (g·L−1) | d92 | 34.8 ± 1.3 | 34.3 ± 1.0 | 34.4 ± 1.0 | 34.7 ± 0.9 |
| d184 | 37.0 ± 0.6 | 35.2 ± 0.9 * | 36.4 ± 1.1 | 35.8 ± 1.5 * | |
| d214 | 36.0 ± 0.9 | 35.7 ± 1.5 | 35.9 ± 0.6 | 36.0 ± 1.4 | |
| TBIL (μmol·L−1) | d92 | 1.76 ± 0.50 | 2.05 ± 0.83 | 2.42 ± 1.06 | 2.95 ± 1.24 |
| d184 | 1.99 ± 0.74 | 2.72 ± 0.89 | 2.89 ± 1.20 | 3.17 ± 1.87 * | |
| d214 | 2.06 ± 0.46 | 2.16 ± 0.96 | 2.06 ± 1.05 | 2.54 ± 1.06 | |
| GLU (mmol·L−1) | d92 | 7.26 ± 0.86 | 6.88 ± 1.09 | 6.70 ± 1.11 | 6.94 ± 0.39 |
| d184 | 7.32 ± 0.68 | 6.75 ± 0.64 | 6.99 ± 0.57 | 6.87 ± 0.84 | |
| d214 | 7.70 ± 0.46 | 7.33 ± 1.03 | 7.08 ± 0.99 | 6.85 ± 0.43 | |
| BU (mmol·L−1) | d92 | 5.89 ± 0.50 | 6.73 ± 0.82 * | 6.61 ± 0.63 | 7.75 ± 0.25 * |
| d184 | 6.16 ± 0.68 | 6.48 ± 0.79 | 6.76 ± 1.03 | 8.97 ± 1.26 * | |
| d214 | 6.01 ± 0.81 | 6.69 ± 0.89 | 6.55 ± 0.76 | 8.24 ± 1.15 * | |
| CREA (μmol·L−1) | d92 | 30.6 ± 2.8 | 34.0 ± 5.4 | 29.6 ± 4.8 | 31.8 ± 4.8 |
| d184 | 33.3 ± 3.0 | 32.3 ± 4.0 | 30.1 ± 3.7 | 33.0 ± 3.5 | |
| d214 | 28.0 ± 3.1 | 34.2 ± 6.2 | 29.2 ± 6.4 | 34.1 ± 4.3 | |
| Ca (mmol·L−1) | d92 | 2.2 ± 0.1 | 2.3 ± 0.1 | 2.2 ± 0.0 | 2.3 ± 0.1 |
| d184 | 2.4 ± 0.1 | 2.3 ± 0.0 | 2.4 ± 0.1 | 2.4 ± 0.1 | |
| d214 | 2.7 ± 0.1 | 2.6 ± 0.1 | 2.6 ± 0.0 | 2.6 ± 0.1 | |
| P (mmol·L−1) | d92 | 1.90 ± 0.18 | 1.87 ± 0.17 | 2.02 ± 0.14 | 2.01 ± 0.10 |
| d184 | 1.77 ± 0.18 | 1.80 ± 0.10 | 1.90 ± 0.12 | 2.07 ± 0.31 * | |
| d214 | 1.79 ± 0.14 | 1.71 ± 0.07 | 1.81 ± 0.10 | 1.82 ± 0.18 | |
| TCH (mmo·L−1) | d92 | 1.36 ± 0.27 | 1.43 ± 0.42 | 1.17 ± 0.16 | 1.23 ± 0.37 |
| d184 | 1.54 ± 0.37 | 1.61 ± 0.51 | 1.45 ± 0.26 | 1.31 ± 0.36 | |
| d214 | 1.47 ± 0.13 | 1.37 ± 0.29 | 1.30 ± 0.13 | 1.21 ± 0.26 | |
| TG (mmol·L−1) | d92 | 0.43 ± 0.16 | 0.54 ± 0.33 | 0.31 ± 0.08 | 0.27 ± 0.07 |
| d184 | 0.61 ± 0.16 | 0.51 ± 0.10 | 0.51 ± 0.07 | 0.47 ± 0.20 | |
| d214 | 0.61 ± 0.16 | 0.59 ± 0.15 | 0.66 ± 0.13 | 0.52 ± 0.11 | |
| CK (μmol·s−1·L−1) | d92 | 7.03 ± 2.27 | 6.15 ± 2.43 | 6.7 ± 2.45 | 5.45 ± 1.70 |
| d184 | 10.09 ± 2.81 | 8.73 ± 1.94 | 8.67 ± 2.10 | 8.59 ± 2.24 | |
| d214 | 7.17 ± 2.34 | 8.76 ± 3.98 | 8.57 ± 3.87 | 9.82 ± 2.75 | |
| LDH (μmol·s−1·L−1) | d92 | 24.33 ± 9.21 | 20.74 ± 8.24 | 23.91 ± 8.56 | 20.92 ± 5.99 |
| d184 | 28.69 ± 7.39 | 24.69 ± 4.93 | 23.63 ± 5.14 | 23.23 ± 6.91 | |
| d214 | 17.83 ± 6.86 | 22.15 ± 9.67 | 21.25 ± 8.60 | 23.13 ± 4.54 | |
| ALP (μmol·s−1·L−1) | d92 | 1.36 ± 0.30 | 1.48 ± 0.32 | 1.81 ± 0.18 | 2.13 ± 0.62 |
| d184 | 1.27 ± 0.21 | 1.31 ± 0.40 | 1.49 ± 0.31 | 2.03 ± 0.52 | |
| d214 | 1.27 ± 0.31 | 1.31 ± 0.09 | 1.53 ± 0.30 | 1.31 ± 0.20 | |
| K (mmol·L−1) | d92 | 4.62 ± 0.31 | 4.69 ± 0.19 | 4.86 ± 0.46 | 4.72 ± 0.18 |
| d184 | 4.59 ± 0.16 | 4.52 ± 0.18 | 4.57 ± 0.19 | 5.03 ± 1.32 | |
| d214 | 4.40 ± 0.14 | 4.35 ± 0.14 | 4.43 ± 0.03 | 4.29 ± 0.13 | |
| Na (mmol·L−1) | d92 | 145.4 ± 1.2 | 147.0 ± 1.9 | 145.0 ± 1.6 | 143.1 ± 3.5 |
| d184 | 144.6 ± 2.1 | 144.3 ± 1.4 | 144.2 ± 1.8 | 142.7 ± 2.4 | |
| d214 | 145.3 ± 1.2 | 144.0 ± 2.5 | 144.8 ± 3.0 | 144.1 ± 3.6 | |
| Cl (mmol·L−1) | d92 | 105.2 ± 1.8 | 103.4 ± 2.1 | 103.4 ± 2.0 | 100.1 ± 3.5 * |
| d184 | 103.5 ± 1.1 | 102.2 ± 0.8 * | 102.3 ± 1.8 * | 99.8 ± 1.6 * | |
| d214 | 103.9 ± 0.6 | 104.8 ± 0.4 | 102.4 ± 0.9 | 104.9 ± 2.6 |
| Items | Days | C | L | M | H |
|---|---|---|---|---|---|
| ALT (nmol·s−1·L−1) | d92 | 614 ± 49 | 656 ± 87 | 796 ± 250 | 1093 ± 357 * |
| d184 | 631 ± 71 | 619 ± 115 | 879 ± 254 * | 1304 ± 441 * | |
| d214 | 688 ± 163 | 740 ± 136 | 583 ± 121 | 621 ± 32 | |
| AST (nmol·s−1·L−1) | d92 | 2466 ± 375 | 2099 ± 300 | 2520 ± 392 | 2422 ± 345 |
| d184 | 2529 ± 268 | 2287 ± 276 | 2276 ± 486 | 2478 ± 319 | |
| d214 | 2329 ± 466 | 2168 ± 424 | 2150 ± 307 | 2262 ± 327 | |
| TP (g·L−1) | d92 | 63.2 ± 4.8 | 59.8 ± 3.5 | 59.3 ± 3.4 | 58.2 ± 3.2 |
| d184 | 59.7 ± 3.0 | 58.4 ± 3.0 | 59.0 ± 2.6 | 56.8 ± 3.2 | |
| d214 | 60.8 ± 4.3 | 60.7 ± 4.4 | 60.4 ± 4.8 | 58.4 ± 1.6 | |
| ALB (g·L−1) | d92 | 37.7 ± 2.3 | 35.7 ± 1.5 | 35.7 ± 1.5 | 35.4 ± 2.1 |
| d184 | 37.6 ± 1.8 | 36.9 ± 2.0 | 37.4 ± 2.0 | 37.0 ± 1.6 | |
| d214 | 39.3 ± 2.4 | 37.6 ± 3.1 | 38.3 ± 3.3 | 36.6 ± 1.0 | |
| TBIL (μmol·L−1) | d92 | 1.49 ± 0.76 | 1.89 ± 0.83 | 1.91 ± 0.64 | 3.27 ± 2.12 |
| d184 | 2.88 ± 1.07 | 3.35 ± 1.10 | 2.24 ± 1.43 | 4.24 ± 2.76 | |
| d214 | 3.02 ± 0.71 | 2.91 ± 0.57 | 2.81 ± 0.97 | 2.22 ± 0.74 | |
| GLU (mmol·L−1) | d92 | 6.66 ± 0.39 | 6.41 ± 0.10 | 6.69 ± 0.57 | 6.85 ± 0.84 |
| d184 | 7.22 ± 0.42 | 7.14 ± 0.51 | 6.99 ± 0.87 | 6.96 ± 0.52 | |
| d214 | 7.68 ± 0.64 | 7.11 ± 0.66 | 7.40 ± 0.53 | 7.57 ± 0.78 | |
| BU (mmol·L−1) | d92 | 5.94 ± 1.37 | 7.99 ± 1.18 | 6.79 ± 0.55 | 11.05 ± 3.31 |
| d184 | 6.30 ± 0.70 | 6.05 ± 0.60 | 7.16 ± 1.19 | 8.52 ± 2.76 | |
| d214 | 7.06 ± 0.96 | 7.32 ± 1.27 | 7.42 ± 0.90 | 8.39 ± 1.24 | |
| CREA (μmol·L−1) | d92 | 33.2 ± 3.7 | 39.1 ± 6.3 | 33.8 ± 2.9 | 42.7 ± 7.0 * |
| d184 | 36.6 ± 3.6 | 34.2 ± 3.2 | 33.1 ± 3.6 | 32.4 ± 5.2 | |
| d214 | 37.4 ± 2.7 | 39.1 ± 6.2 | 38.5 ± 4.5 | 41.2 ± 5.5 | |
| Ca (mmol·L−1) | d92 | 2.3 ± 0.1 | 2.3 ± 0.1 | 2.3 ± 0.1 | 2.3 ± 0.1 |
| d184 | 2.4 ± 0.1 | 2.4 ± 0.1 | 2.5 ± 0.1 | 2.5 ± 0.1 | |
| d214 | 2.7 ± 0.1 | 2.7 ± 0.1 | 2.8 ± 0.1 | 2.7 ± 0.1 | |
| P (mmol·L−1) | d92 | 1.75 ± 0.14 | 1.70 ± 0.08 | 1.92 ± 0.15 | 1.80 ± 0.12 |
| d184 | 1.70 ± 0.23 | 1.66 ± 0.19 | 1.76 ± 0.17 | 1.78 ± 0.19 | |
| d214 | 1.36 ± 0.10 | 1.55 ± 0.14 | 1.43 ± 0.23 | 1.57 ± 0.25 | |
| TCH (mmol·L−1) | d92 | 1.49 ± 0.18 | 1.80 ± 0.51 | 1.79 ± 0.36 | 1.90 ± 0.24 |
| d184 | 1.07 ± 0.26 | 1.77 ± 0.41 * | 2.10 ± 0.46 * | 1.73 ± 0.21 * | |
| d214 | 0.90 ± 0.31 | 1.68 ± 0.42 * | 1.40 ± 0.47 | 1.24 ± 0.35 | |
| TG (mmol·L−1) | d92 | 0.31 ± 0.03 | 0.31 ± 0.14 | 0.37 ± 0.08 | 0.34 ± 0.08 |
| d184 | 0.42 ± 0.05 | 0.43 ± 0.07 | 0.50 ± 0.12 | 0.44 ± 0.06 | |
| d214 | 0.46 ± 0.06 | 0.46 ± 0.09 | 0.48 ± 0.07 | 0.52 ± 0.22 | |
| CK (μmol·s−1·L−1) | d92 | 9.43 ± 1.70 | 6.34 ± 2.10 | 8.37 ± 2.68 | 7.16 ± 1.61 |
| d184 | 10.00 ± 2.51 | 8.14 ± 1.76 | 8.10 ± 3.42 | 8.83 ± 1.56 | |
| d214 | 9.89 ± 3.99 | 8.34 ± 2.17 | 9.97 ± 3.21 | 9.47 ± 2.48 | |
| LDH (μmol·s−1·L−1) | d92 | 29.81 ± 6.15 | 22.42 ± 6.68 | 30.52 ± 6.71 | 27.71 ± 5.51 |
| d184 | 27.96 ± 3.17 | 24.72 ± 4.43 | 24.15 ± 7.25 | 25.33 ± 4.21 | |
| d214 | 25.11 ± 8.58 | 21.92 ± 4.72 | 23.70 ± 5.79 | 24.99 ± 5.70 | |
| ALP (μmol·s−1·L−1) | d92 | 0.67 ± 0.20 | 0.66 ± 0.14 | 0.80 ± 0.34 | 1.40 ± 0.68 |
| d184 | 0.79 ± 0.24 | 0.69 ± 0.25 | 0.89 ± 0.42 | 1.43 ± 0.65 | |
| d214 | 0.71 ± 0.13 | 0.77 ± 0.19 | 0.68 ± 0.12 | 0.95 ± 0.30 | |
| K (mmol·L−1) | d92 | 4.72 ± 0.34 | 4.59 ± 0.34 | 4.61 ± 0.28 | 4.80 ± 0.24 |
| d184 | 4.14 ± 0.17 | 4.18 ± 0.27 | 4.23 ± 0.18 | 4.51 ± 0.29 * | |
| d214 | 4.15 ± 0.23 | 4.11 ± 0.21 | 4.18 ± 0.25 | 4.17 ± 0.12 | |
| Na (mmol·L−1) | d92 | 145.7 ± 0.6 | 144.4 ± 1.9 | 145.2 ± 1.3 | 143.1 ± 4.5 |
| d184 | 145.0 ± 1.2 | 144.3 ± 1.5 | 144.4 ± 0.9 | 142.6 ± 3.0 * | |
| d214 | 143.5 ± 2.2 | 144.2 ± 1.9 | 145.7 ± 2.8 | 145.0 ± 2.2 | |
| Cl (mmol·L−1) | d92 | 107.2 ± 1.4 | 103.4 ± 0.7 | 105.2 ± 1.8 | 101.3 ± 5.2 * |
| d184 | 105.6 ± 1.6 | 104.8 ± 1.2 | 103.1 ± 1.5 * | 102.3 ± 3.0 * | |
| d214 | 107.6 ± 1.4 | 104.5 ± 0.9 * | 104.8 ± 2.3 | 105.4 ± 0.8 |
| Organ | Days | C | L | M | H |
|---|---|---|---|---|---|
| Heart | d92 | 1.42 ± 0.18 | 1.36 ± 0.08 | 1.31 ± 0.18 | 1.22 ± 0.16 * |
| d184 | 1.58 ± 0.22 | 1.47 ± 0.20 | 1.44 ± 0.14 | 1.33 ± 0.12 * | |
| d214 | 1.71 ± 0.22 | 1.54 ± 0.10 | 1.57 ± 0.17 | 1.45 ± 0.12 | |
| Liver | d92 | 10.82 ± 1.28 | 9.74 ± 0.91 | 9.40 ± 0.70 | 6.78 ± 1.09 * |
| d184 | 11.73 ± 2.17 | 10.78 ± 1.21 | 10.36 ± 1.30 | 7.16 ± 1.20 * | |
| d214 | 12.75 ± 1.71 | 11.02 ± 0.94 | 12.30 ± 3.35 | 10.14 ± 0.58 | |
| Spleen | d92 | 0.80 ± 0.10 | 0.68 ± 0.09 | 0.66 ± 0.08 | 0.70 ± 0.11 |
| d184 | 0.79 ± 0.07 | 0.76 ± 0.12 | 0.69 ± 0.11 * | 0.62 ± 0.06 * | |
| d214 | 0.83 ± 0.16 | 0.76 ± 0.04 | 0.85 ± 0.25 | 0.74 ± 0.10 | |
| Lung | d92 | 1.35 ± 0.08 | 1.33 ± 0.17 | 1.30 ± 0.12 | 1.28 ± 0.20 |
| d184 | 1.40 ± 0.15 | 1.43 ± 0.10 | 1.38 ± 0.13 | 1.38 ± 0.14 | |
| d214 | 1.57 ± 0.13 | 1.42 ± 0.13 | 1.45 ± 0.19 | 1.48 ± 0.10 | |
| Kidney | d92 | 2.69 ± 0.24 | 2.59 ± 0.27 | 2.47 ± 0.18 | 2.24 ± 0.38 * |
| d184 | 2.90 ± 0.53 | 2.81 ± 0.68 | 2.75 ± 0.32 | 2.44 ± 0.21 * | |
| d214 | 3.36 ± 0.07 | 2.99 ± 0.54 | 2.84 ± 0.29 | 2.67 ± 0.09 | |
| Brain | d92 | 2.09 ± 0.14 | 2.04 ± 0.08 | 2.09 ± 0.09 | 1.96 ± 0.07 |
| d184 | 2.19 ± 0.16 | 2.16 ± 0.09 | 2.19 ± 0.07 | 2.05 ± 0.06 * | |
| d214 | 2.16 ± 0.04 | 2.18 ± 0.06 | 2.22 ± 0.20 | 2.08 ± 0.11 | |
| Adrenal gland | d92 | 0.07 ± 0.01 | 0.06 ± 0.01 | 0.06 ± 0.01 | 0.06 ± 0.01 |
| d184 | 0.05 ± 0.01 | 0.06 ± 0.01 | 0.06 ± 0.01 | 0.05 ± 0.01 | |
| d214 | 0.05 ± 0.01 | 0.05 ± 0.01 | 0.04 ± 0.01 | 0.06 ± 0.01 | |
| Thymus | d92 | 0.35 ± 0.10 | 0.35 ± 0.06 | 0.26 ± 0.05 | 0.24 ± 0.02 |
| d184 | 0.29 ± 0.14 | 0.25 ± 0.07 | 0.22 ± 0.09 | 0.18 ± 0.04 * | |
| d214 | 0.39 ± 0.09 | 0.22 ± 0.09 | 0.36 ± 0.07 | 0.38 ± 0.25 | |
| Testis | d92 | 2.96 ± 0.21 | 3.01 ± 0.19 | 3.04 ± 0.15 | 2.91 ± 0.30 |
| d184 | 2.71 ± 0.83 | 3.07 ± 0.24 | 3.06 ± 0.24 | 2.96 ± 0.24 | |
| d214 | 3.12 ± 0.16 | 2.96 ± 0.22 | 3.02 ± 0.19 | 3.04 ± 0.27 | |
| Epididymis | d92 | 1.37 ± 0.23 | 1.35 ± 0.16 | 1.24 ± 0.09 | 1.31 ± 0.24 |
| d184 | 1.21 ± 0.34 | 1.22 ± 0.15 | 1.23 ± 0.15 | 1.22 ± 0.11 | |
| d214 | 1.30 ± 0.10 | 1.19 ± 0.17 | 1.45 ± 0.19 | 1.24 ± 0.05 |
| Organ | Days | C | L | M | H |
|---|---|---|---|---|---|
| Heart | d92 | 1.00 ± 0.12 | 1.00 ± 0.10 | 0.87 ± 0.10 | 0.67 ± 0.12 * |
| d184 | 0.99 ± 0.11 | 1.03 ± 0.10 | 0.89 ± 0.04 | 0.71 ± 0.10 * | |
| d214 | 1.00 ± 0.08 | 1.01 ± 0.07 | 1.01 ± 0.11 | 1.03 ± 0.08 | |
| Liver | d92 | 6.17 ± 0.23 | 6.28 ± 0.55 | 6.93 ± 0.44 * | 7.49 ± 0.62 * |
| d184 | 6.41 ± 0.58 | 6.76 ± 0.66 | 7.71 ± 1.30 * | 8.16 ± 0.91 * | |
| d214 | 6.34 ± 0.17 | 6.58 ± 0.32 | 6.91 ± 0.52 | 6.70 ± 0.61 | |
| Spleen | d92 | 0.52 ± 0.07 | 0.52 ± 0.09 | 0.50 ± 0.03 | 0.47 ± 0.04 |
| d184 | 0.54 ± 0.06 | 0.57 ± 0.10 | 0.55 ± 0.11 | 0.49 ± 0.04 | |
| d214 | 0.59 ± 0.14 | 0.52 ± 0.09 | 0.51 ± 0.04 | 0.51 ± 0.09 | |
| Lung | d92 | 1.19 ± 0.30 | 1.11 ± 0.11 | 1.05 ± 0.11 | 1.10 ± 0.25 |
| d184 | 1.14 ± 0.11 | 1.14 ± 0.08 | 1.20 ± 0.09 | 1.11 ± 0.07 | |
| d214 | 1.11 ± 0.05 | 1.17 ± 0.14 | 1.16 ± 0.10 | 1.13 ± 0.13 | |
| Kidney | d92 | 1.83 ± 0.15 | 1.67 ± 0.14 | 1.73 ± 0.18 | 1.60 ± 0.21 * |
| d184 | 1.92 ± 0.20 | 1.91 ± 0.16 | 1.88 ± 0.16 | 1.78 ± 0.12 * | |
| d214 | 1.86 ± 0.13 | 1.86 ± 0.08 | 1.87 ± 0.04 | 1.88 ± 0.09 | |
| Brain | d92 | 1.91 ± 0.18 | 1.88 ± 0.08 | 1.93 ± 0.06 | 1.78 ± 0.36 |
| d184 | 2.02 ± 0.11 | 2.05 ± 0.06 | 2.02 ± 0.08 | 1.96 ± 0.08 | |
| d214 | 2.05 ± 0.08 | 2.02 ± 0.09 | 2.06 ± 0.06 | 2.03 ± 0.08 | |
| Adrenal gland | d92 | 0.08 ± 0.01 | 0.08 ± 0.01 | 0.08 ± 0.01 | 0.07 ± 0.02 |
| d184 | 0.07 ± 0.01 | 0.07 ± 0.01 | 0.08 ± 0.01 | 0.07 ± 0.01 | |
| d214 | 0.07 ± 0.01 | 0.07 ± 0.01 | 0.07 ± 0.01 | 0.08 ± 0.02 | |
| Thymus | d92 | 0.32 ± 0.02 | 0.29 ± 0.03 | 0.25 ± 0.06 | 0.29 ± 0.06 |
| d184 | 0.21 ± 0.06 | 0.23 ± 0.05 | 0.24 ± 0.06 | 0.18 ± 0.05 | |
| d214 | 0.24 ± 0.02 | 0.21 ± 0.04 | 0.21 ± 0.04 | 0.23 ± 0.04 | |
| Testis | d92 | 0.64 ± 0.18 | 0.56 ± 0.24 | 0.53 ± 0.12 | 0.57 ± 0.16 |
| d184 | 0.76 ± 0.20 | 0.69 ± 0.18 | 0.68 ± 0.15 | 0.62 ± 0.23 | |
| d214 | 0.67 ± 0.26 | 0.59 ± 0.11 | 0.74 ± 0.21 | 0.69 ± 0.12 | |
| Epididymis | d92 | 0.16 ± 0.07 | 0.12 ± 0.04 | 0.14 ± 0.04 | 0.11 ± 0.03 |
| d184 | 0.09 ± 0.01 | 0.11 ± 0.03 | 0.11 ± 0.02 | 0.11 ± 0.03 | |
| d214 | 0.12 ± 0.04 | 0.10 ± 0.03 | 0.11 ± 0.04 | 0.12 ± 0.02 |
| Abnormal Pathology | Day 92 (n = 10) | Day 184 (n = 20) | Day 214 (n = 10) | |||||||||
|---|---|---|---|---|---|---|---|---|---|---|---|---|
| C | L | M | H | C | L | M | H | C | L | M | H | |
| Esophagus keratinized stratified squamous epithelium | 1 | 5 | 5 | 6 | 2 | 5 | 8 | 10 | 1 | 2 | 4 | 5 |
| Stomach swelling or degeneration or atrophy | 0 | 0 | 2 | 3 | 0 | 0 | 0 | 12 | 0 | 0 | 0 | 2 |
| Liver inflammatory cell infiltrates or degeneration or necrosis | 0 | 7 | 6 | 10 | 0 | 10 | 11 | 15 | 0 | 3 | 4 | 2 |
| Lung foam cell foci | 0 | 1 | 3 | 4 | 0 | 4 | 6 | 9 | 0 | 1 | 1 | 3 |
| Kidney degeneration or swelling or atrophy or inflammatory cells infiltration | 0 | 2 | 1 | 7 | 0 | 6 | 5 | 9 | 0 | 0 | 0 | 1 |
| Spinal cord degeneration or swelling | 0 | 3 | 3 | 2 | 0 | 5 | 3 | 7 | 0 | 0 | 6 | 2 |
© 2016 by the authors; licensee MDPI, Basel, Switzerland. This article is an open access article distributed under the terms and conditions of the Creative Commons by Attribution (CC-BY) license (http://creativecommons.org/licenses/by/4.0/).
Share and Cite
Yu, C.; Zhang, Z.; Liu, Y.; Zong, Y.; Chen, Y.; Du, X.; Chen, J.; Feng, S.; Hu, J.; Cui, S.; et al. Toxicity of Smokeless Tobacco Extract after 184-Day Repeated Oral Administration in Rats. Int. J. Environ. Res. Public Health 2016, 13, 281. https://doi.org/10.3390/ijerph13030281
Yu C, Zhang Z, Liu Y, Zong Y, Chen Y, Du X, Chen J, Feng S, Hu J, Cui S, et al. Toxicity of Smokeless Tobacco Extract after 184-Day Repeated Oral Administration in Rats. International Journal of Environmental Research and Public Health. 2016; 13(3):281. https://doi.org/10.3390/ijerph13030281
Chicago/Turabian StyleYu, Chenlin, Ziteng Zhang, Yangang Liu, Ying Zong, Yongchun Chen, Xiuming Du, Jikuai Chen, Shijie Feng, Jinlian Hu, Shufang Cui, and et al. 2016. "Toxicity of Smokeless Tobacco Extract after 184-Day Repeated Oral Administration in Rats" International Journal of Environmental Research and Public Health 13, no. 3: 281. https://doi.org/10.3390/ijerph13030281
APA StyleYu, C., Zhang, Z., Liu, Y., Zong, Y., Chen, Y., Du, X., Chen, J., Feng, S., Hu, J., Cui, S., & Lu, G. (2016). Toxicity of Smokeless Tobacco Extract after 184-Day Repeated Oral Administration in Rats. International Journal of Environmental Research and Public Health, 13(3), 281. https://doi.org/10.3390/ijerph13030281