
Evaluating the Appropriateness of Downscaled Climate Information for Projecting Risks of Salmonella


Abstract
:1. Introduction
2. Experimental Section
2.1. Study Details
2.2. Details about the Datasets
2.2.1. Downscaled Data
2.2.2. Baseline Observed Data
2.2.3. Global Climate Model Data
2.3. Geographical Areas of Investigation
2.4. Calculation Details and Summary Statistics
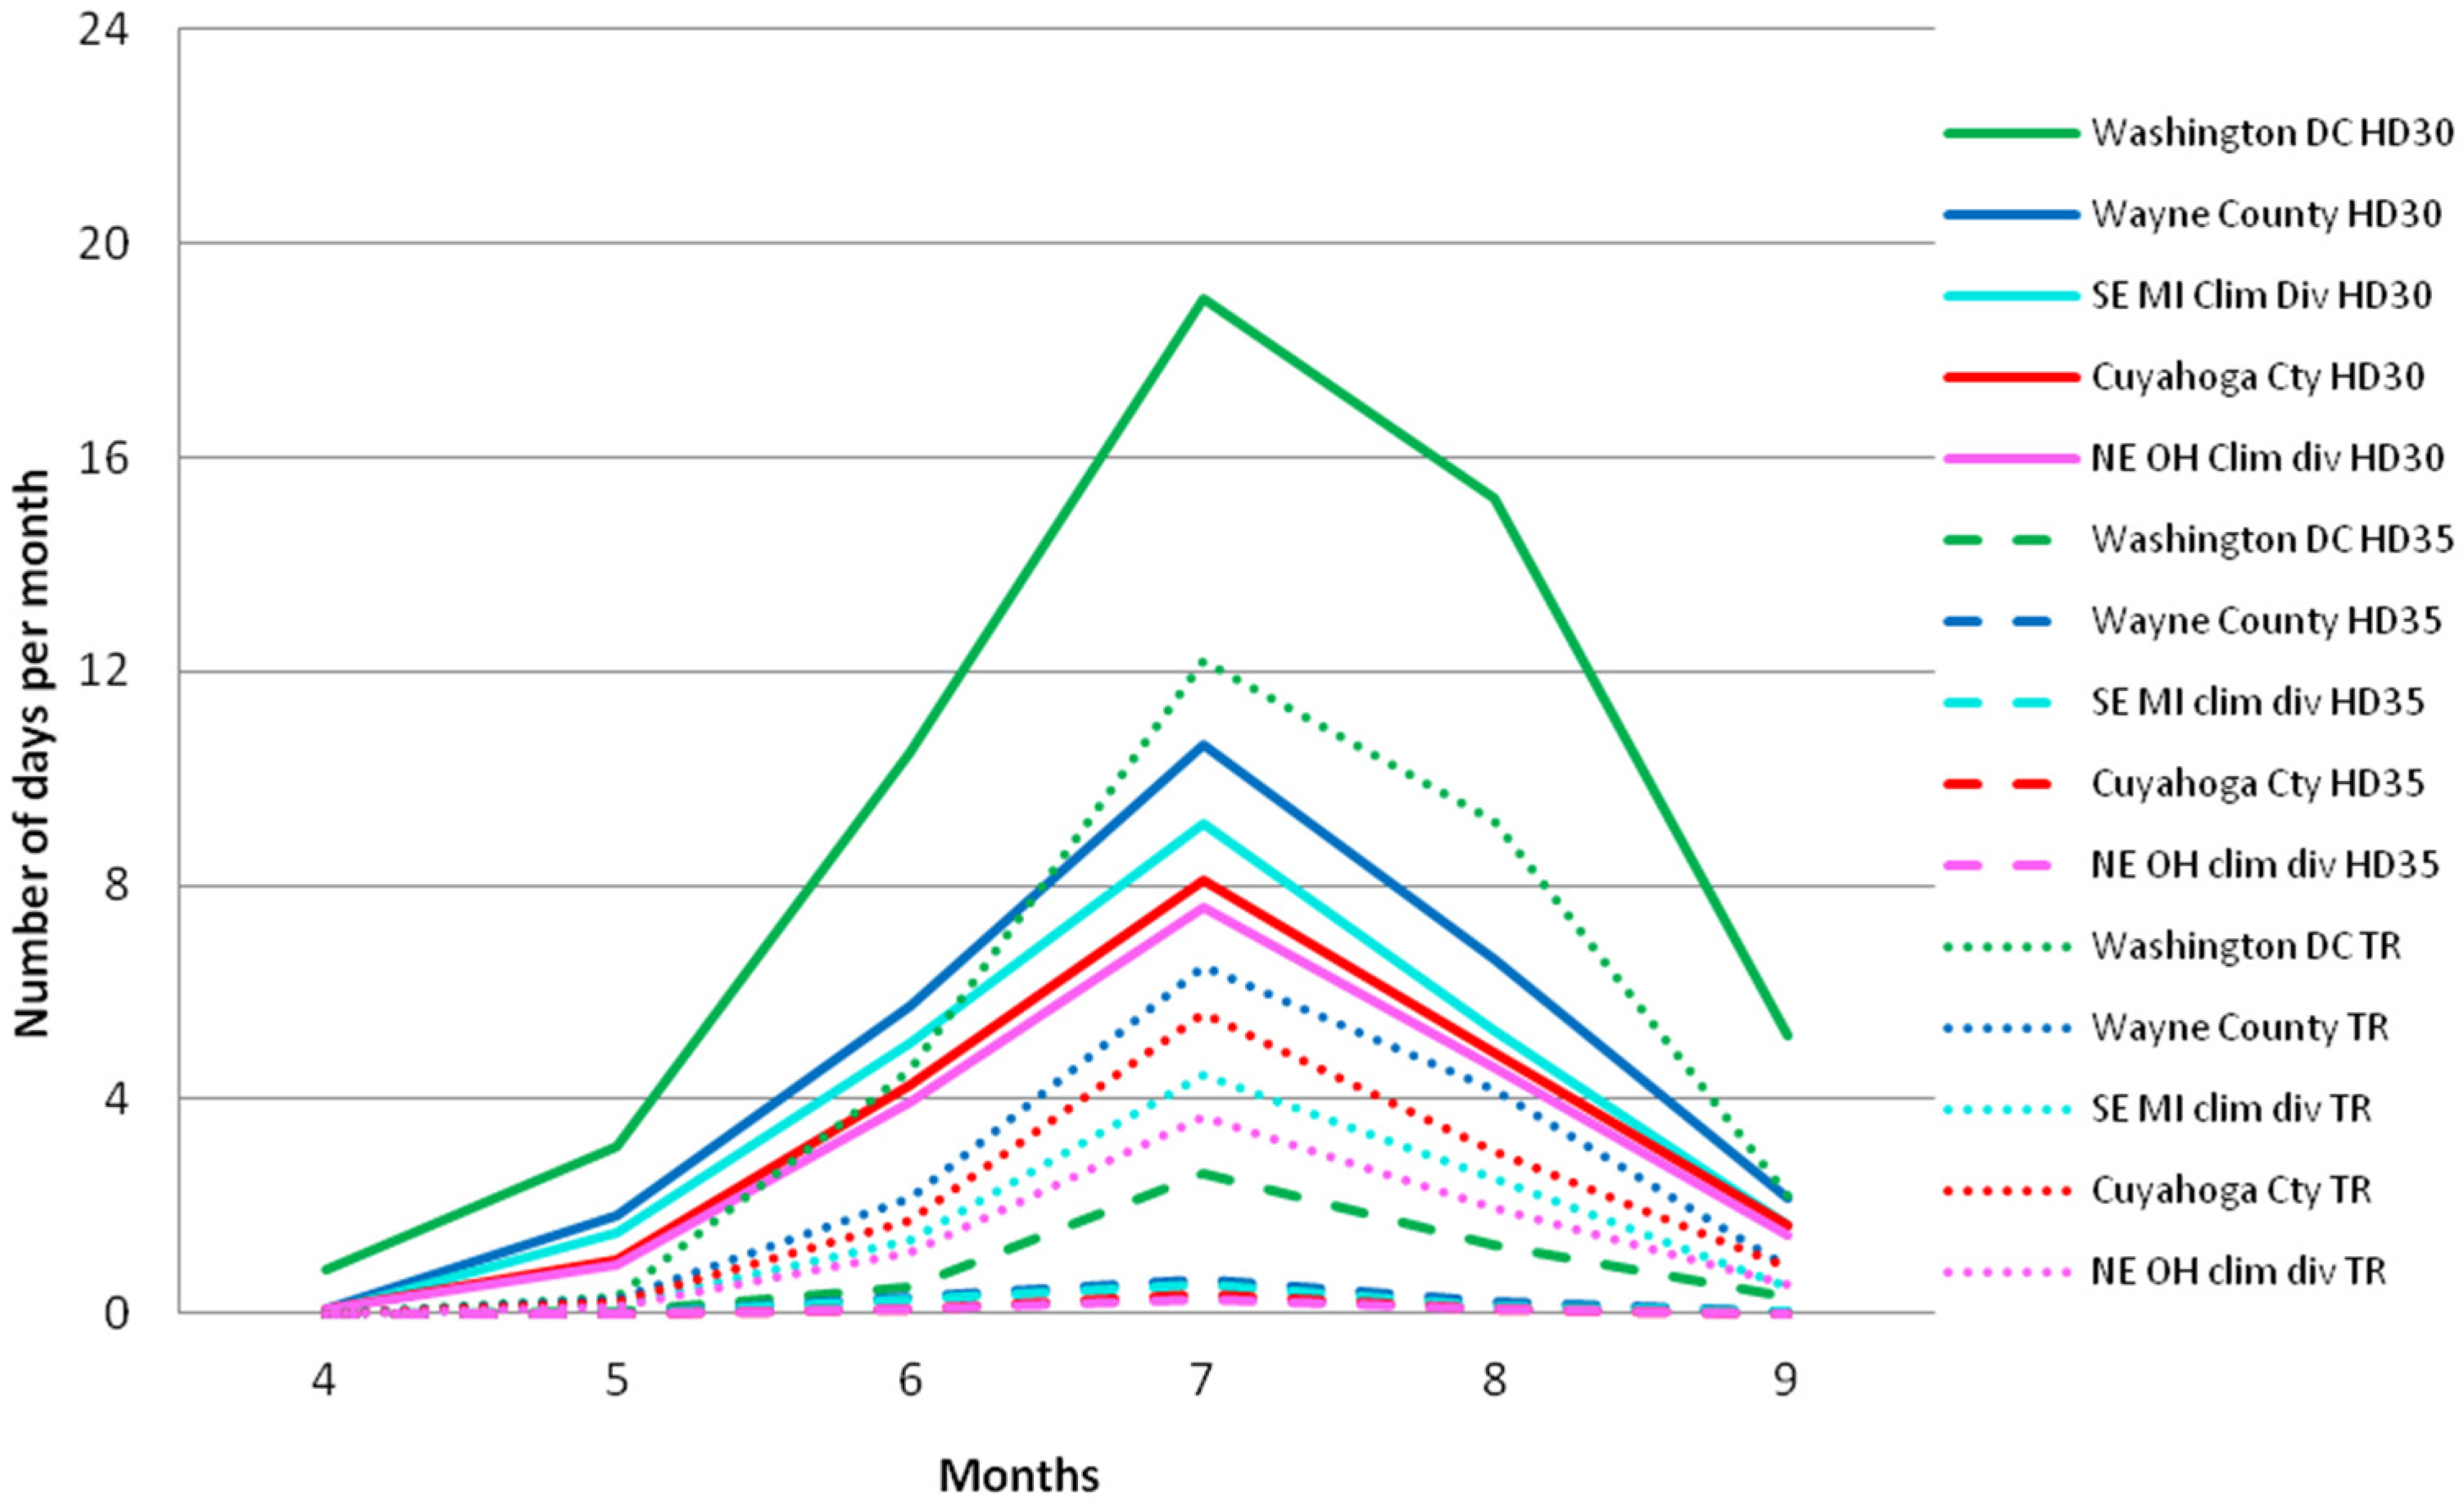
2.4.1. Baseline Characteristics of the Monthly Temperature Based Heat Indices for the Areas of Interest
2.4.2. Frequency of Hot Days (HD30)
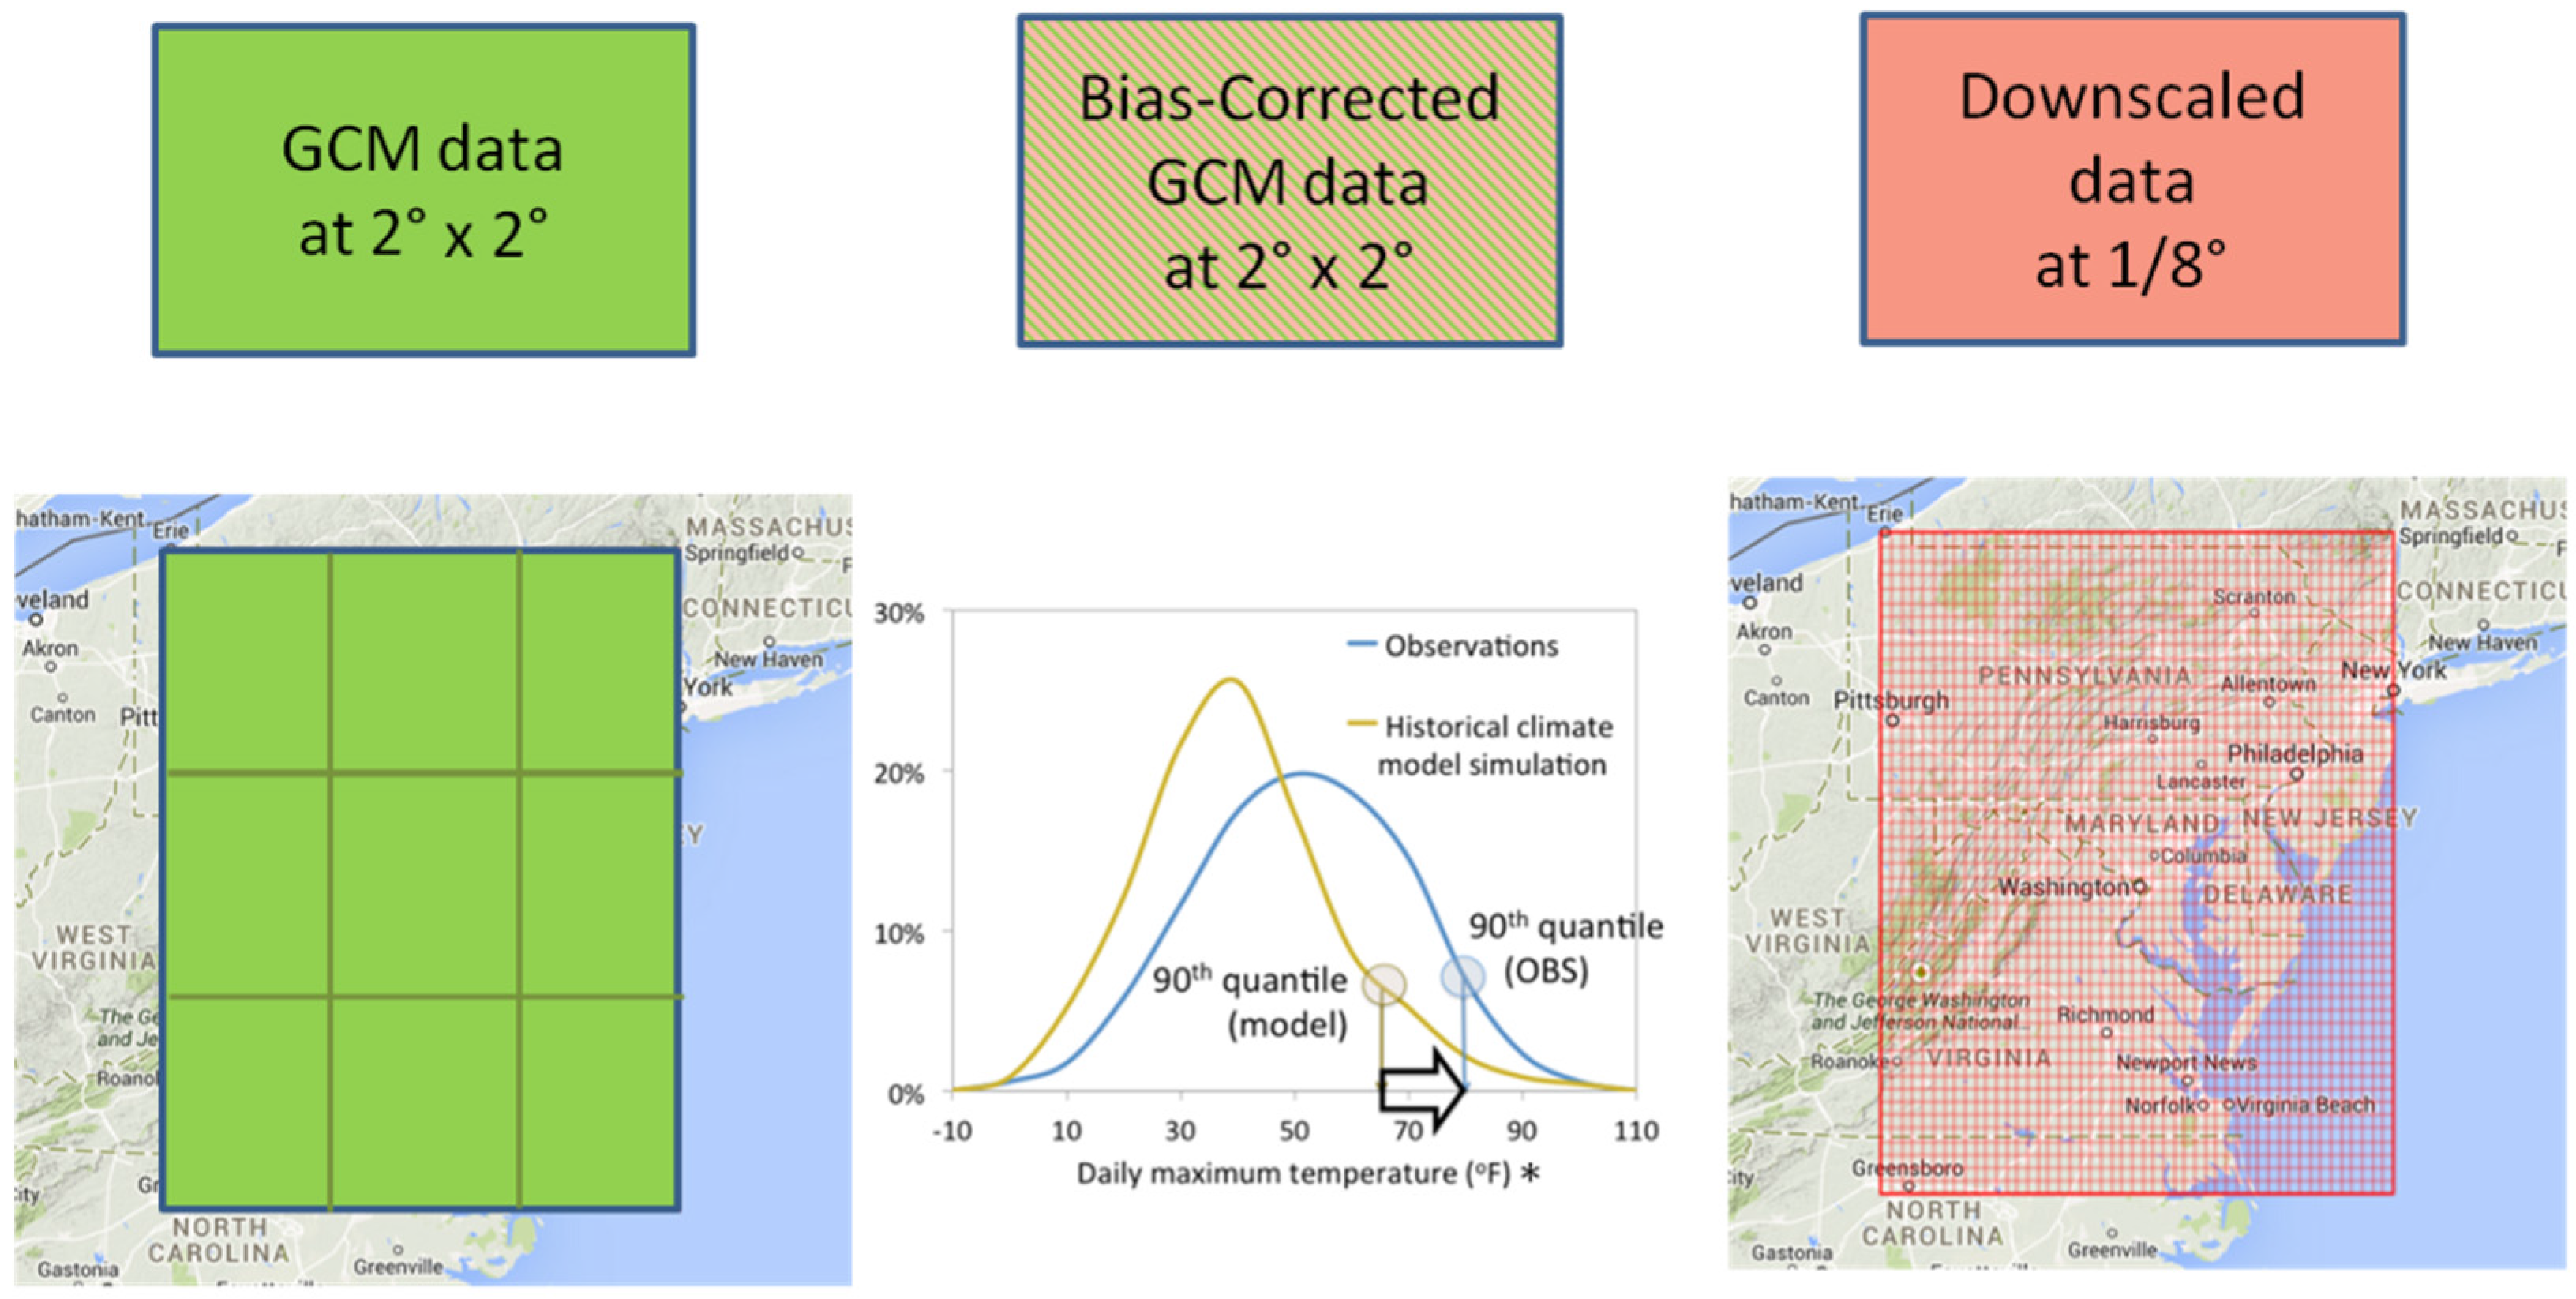
2.5. Description of the Statistical Downscaling Methods
3. Results and Discussion
3.1. Observed Thermal Characteristics Based on Maurer02v2 Data
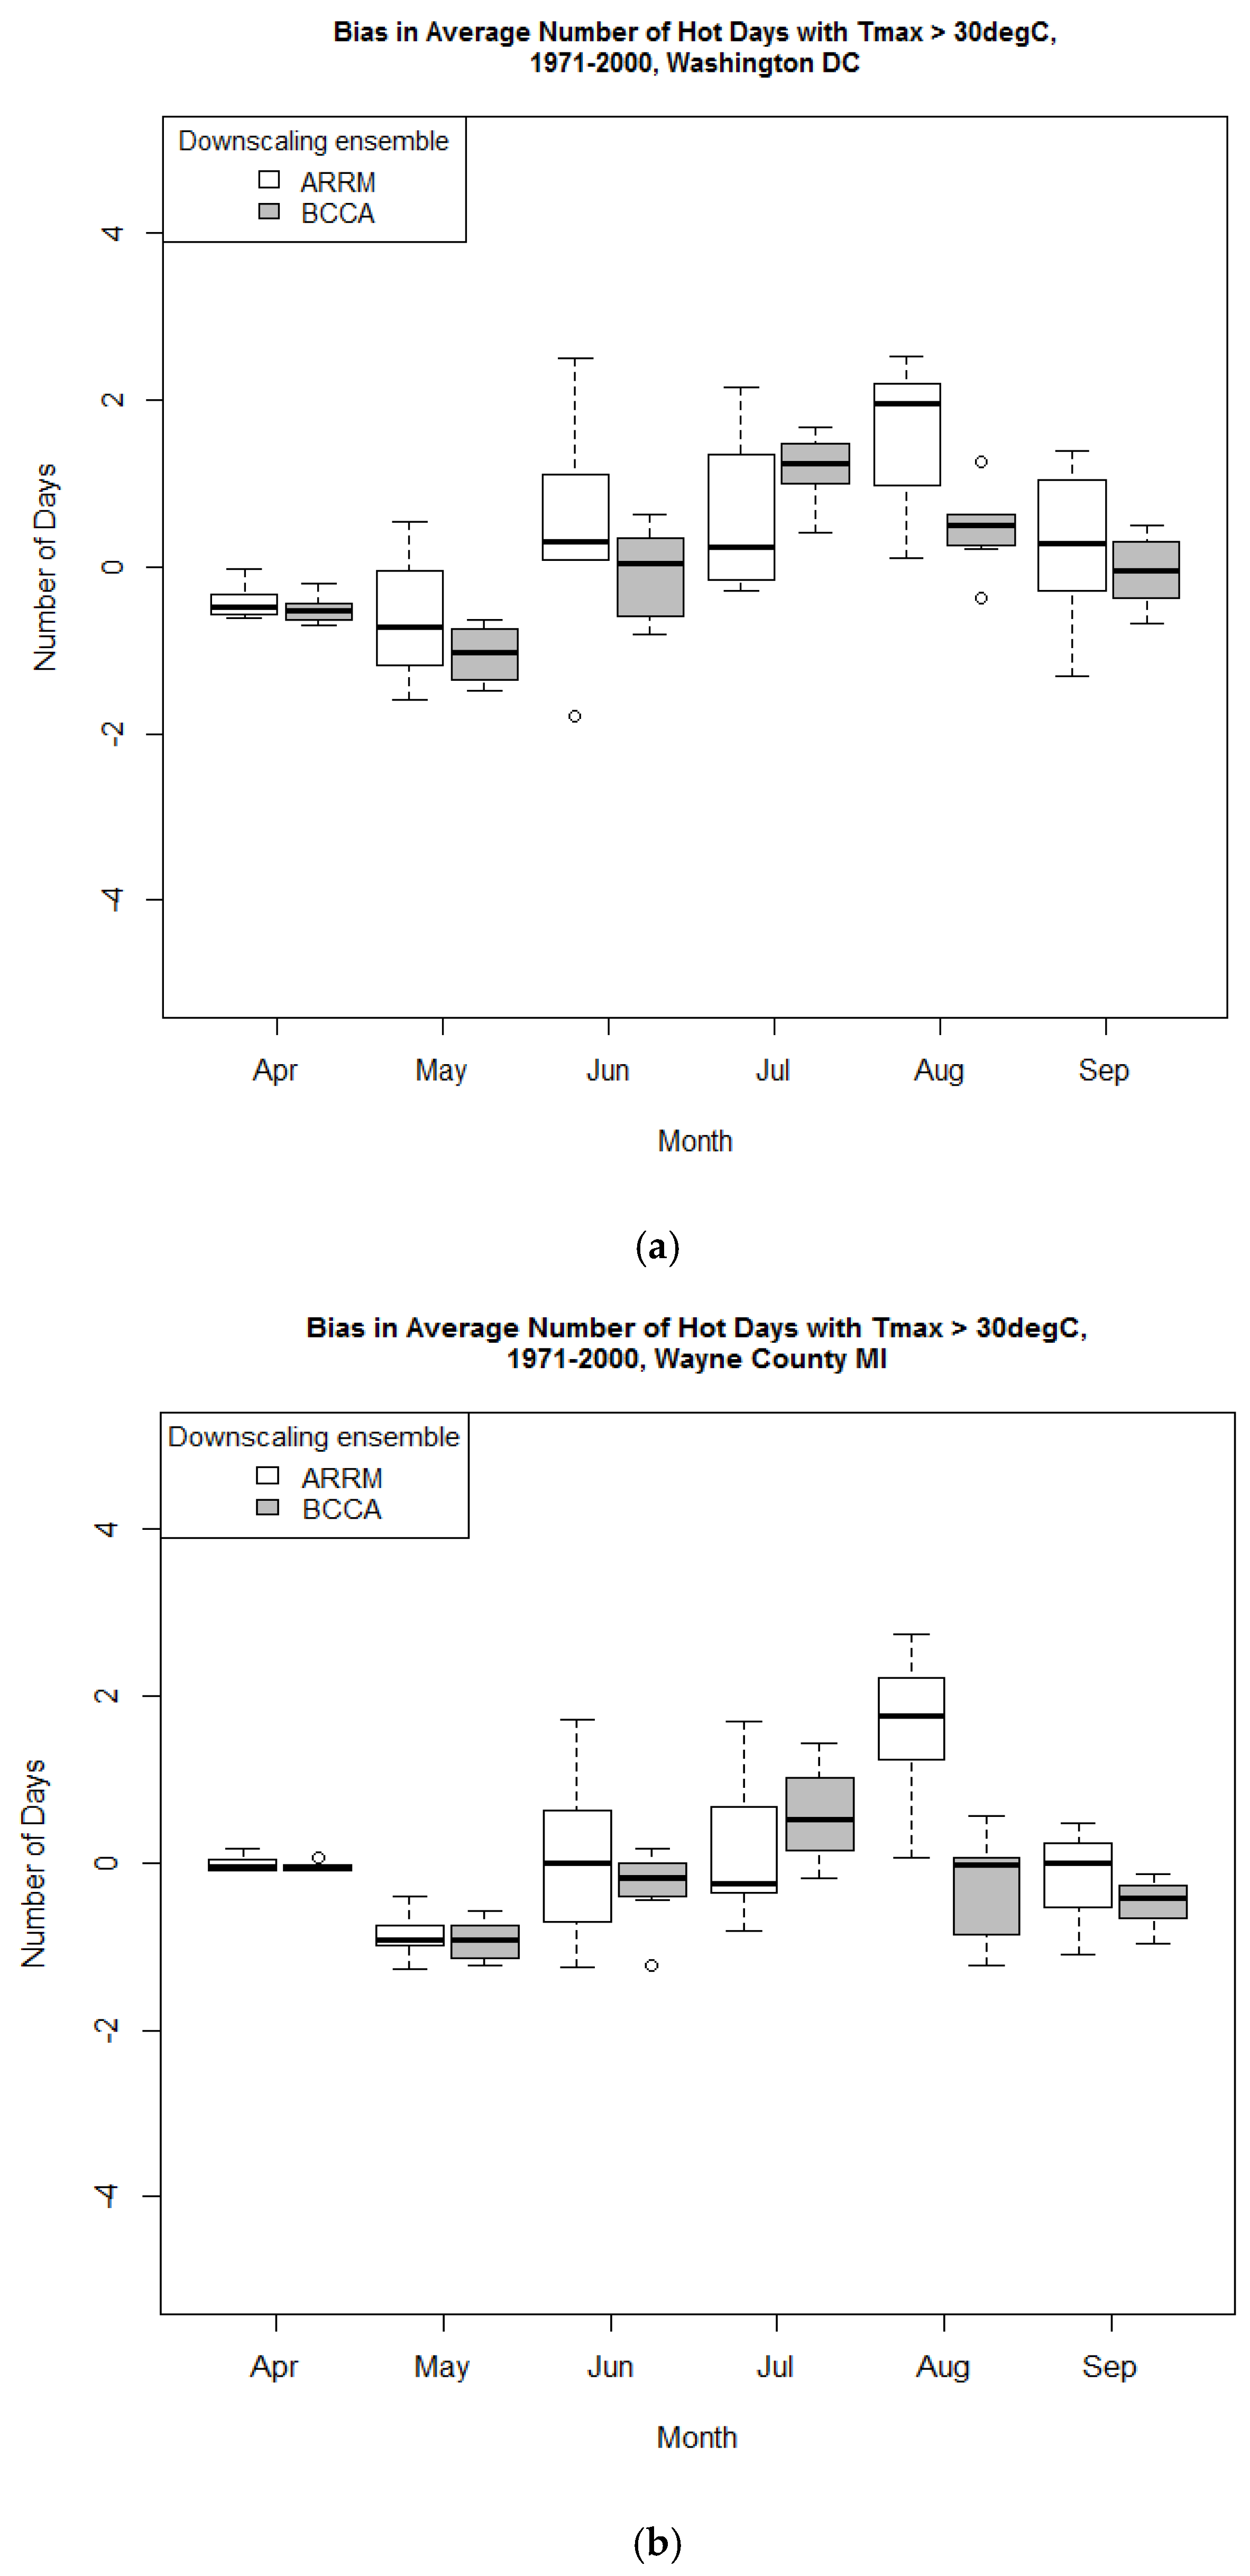
3.2. Comparison of the Period Mean of the Indices Calculated from Observed Data and the ARRM and BCCA Downscaled Ensembles
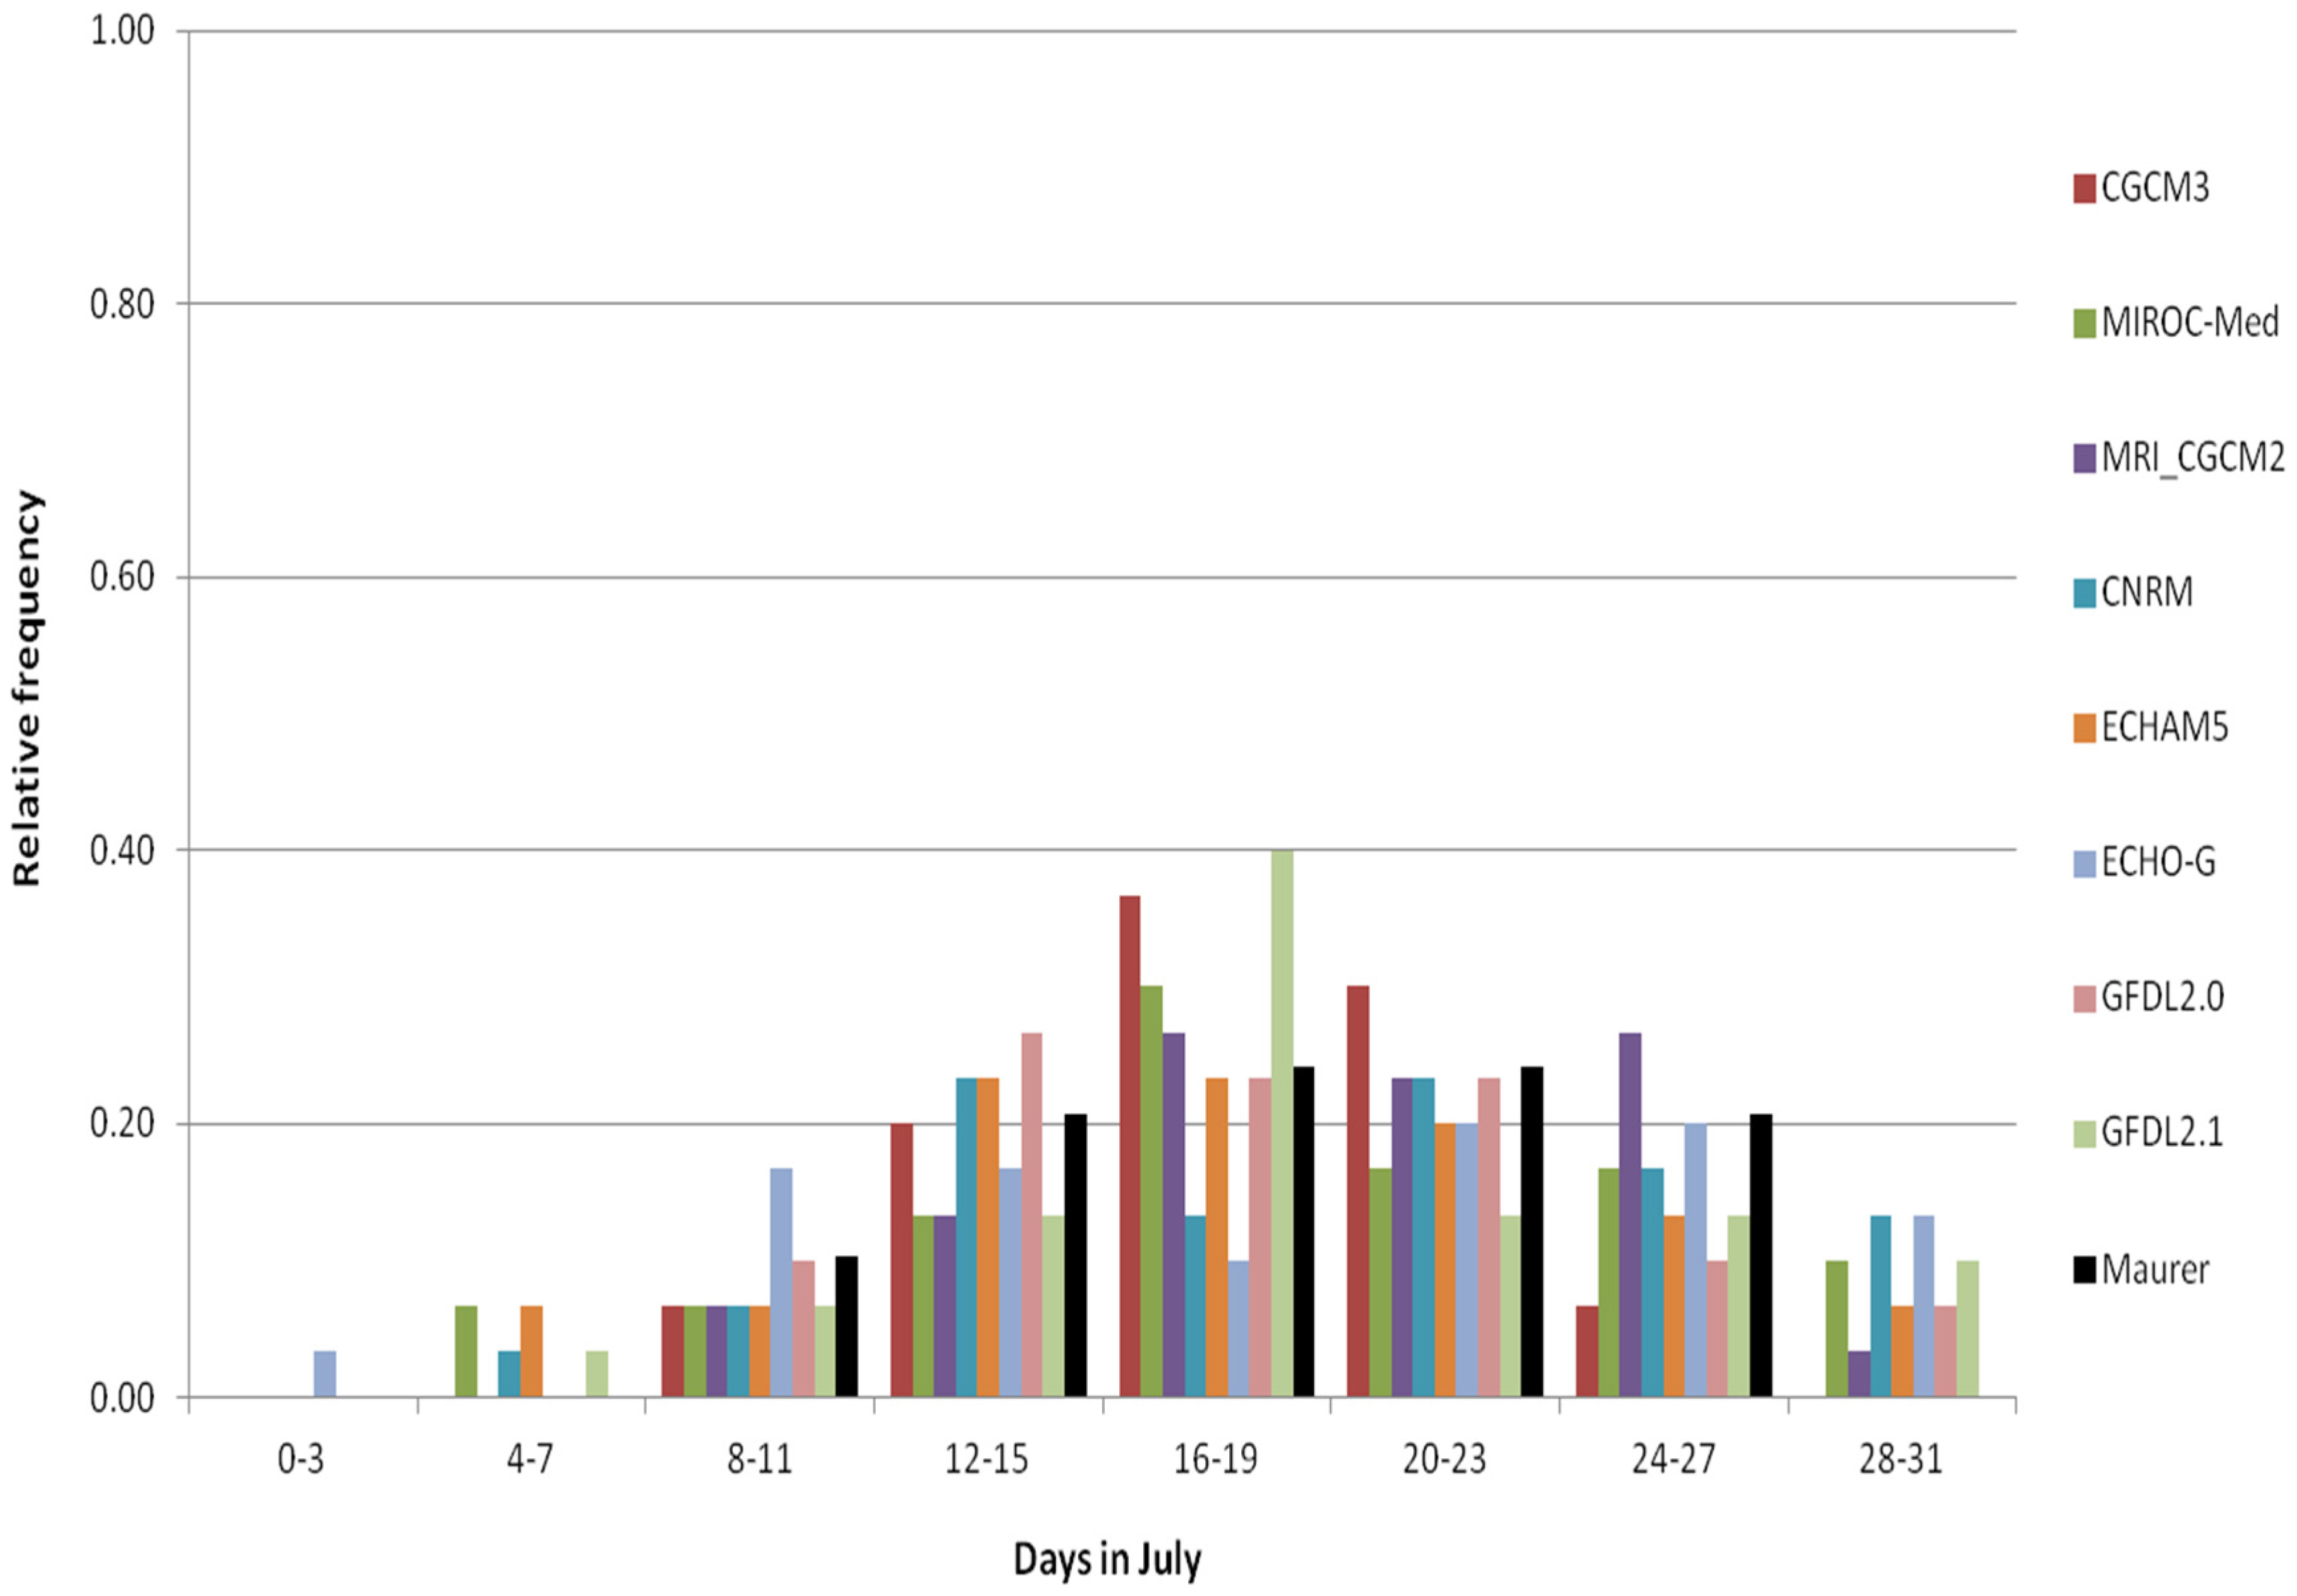
3.3. Analyses of the Representation of the Frequency of High Temperatures by Observed and Downscaled Data and Relation to Salmonella Occurrences
3.4. Association of Salmonella Occurrences with High Temperatures
4. Conclusions
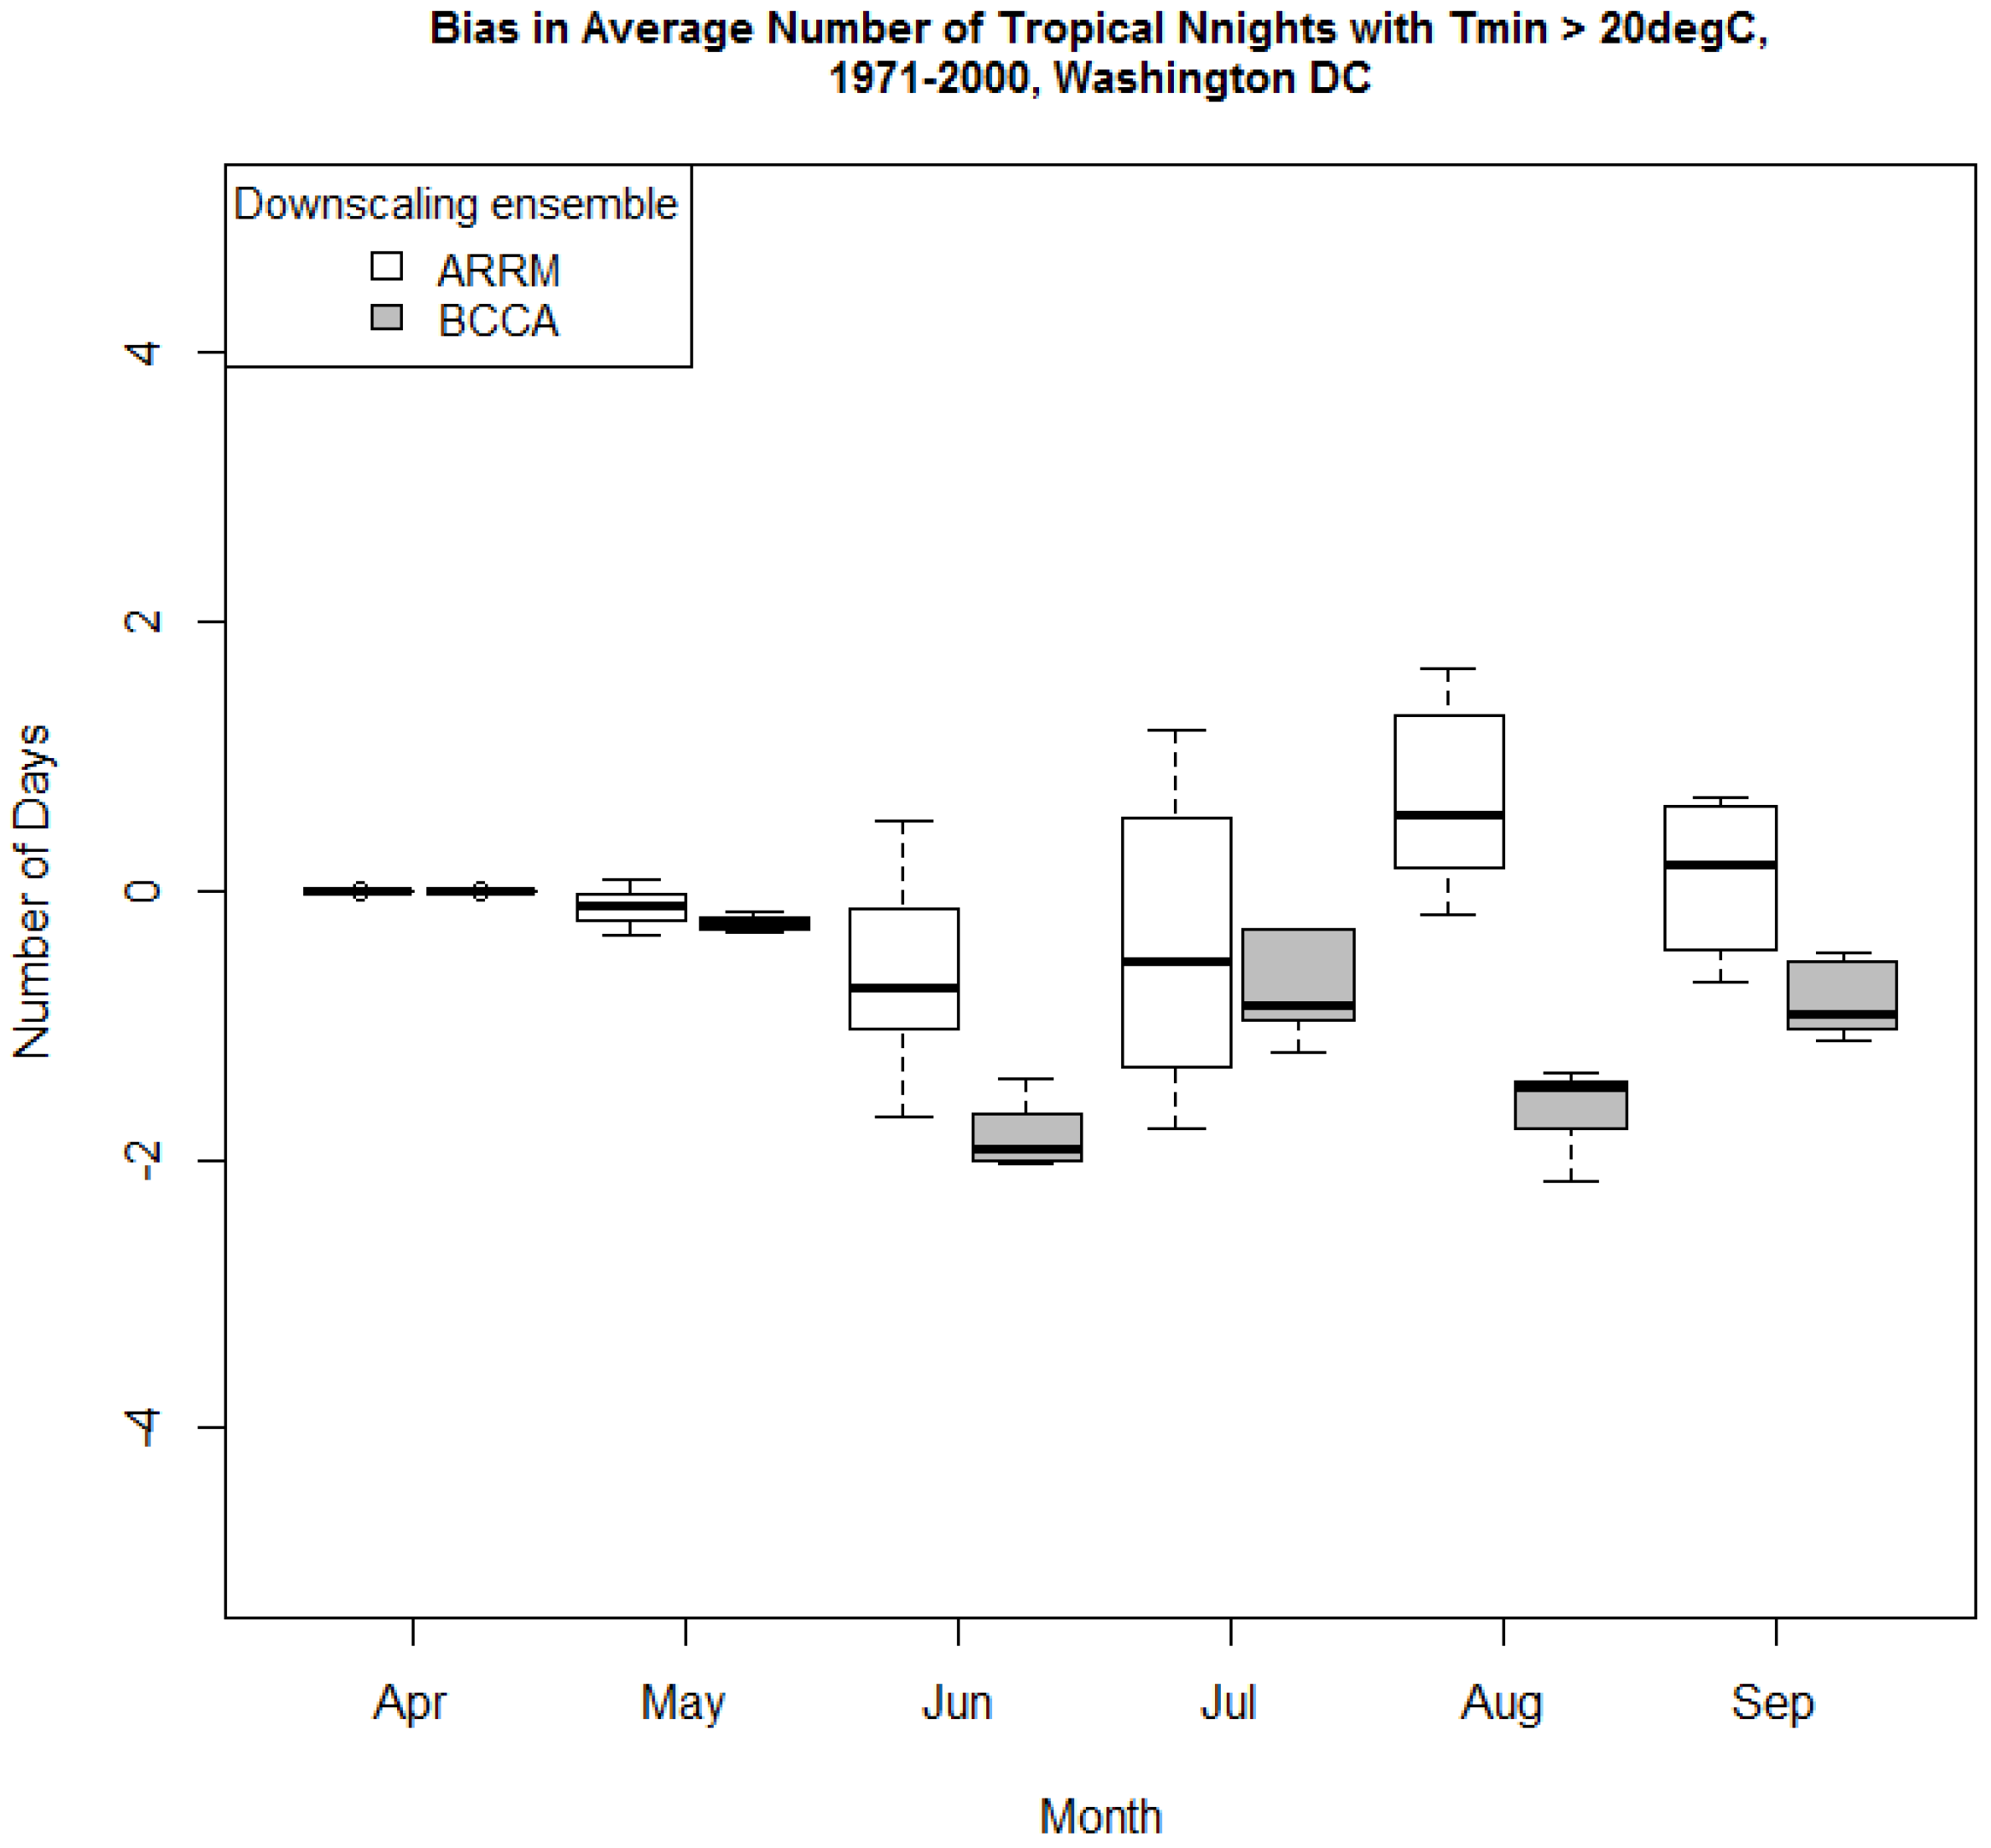
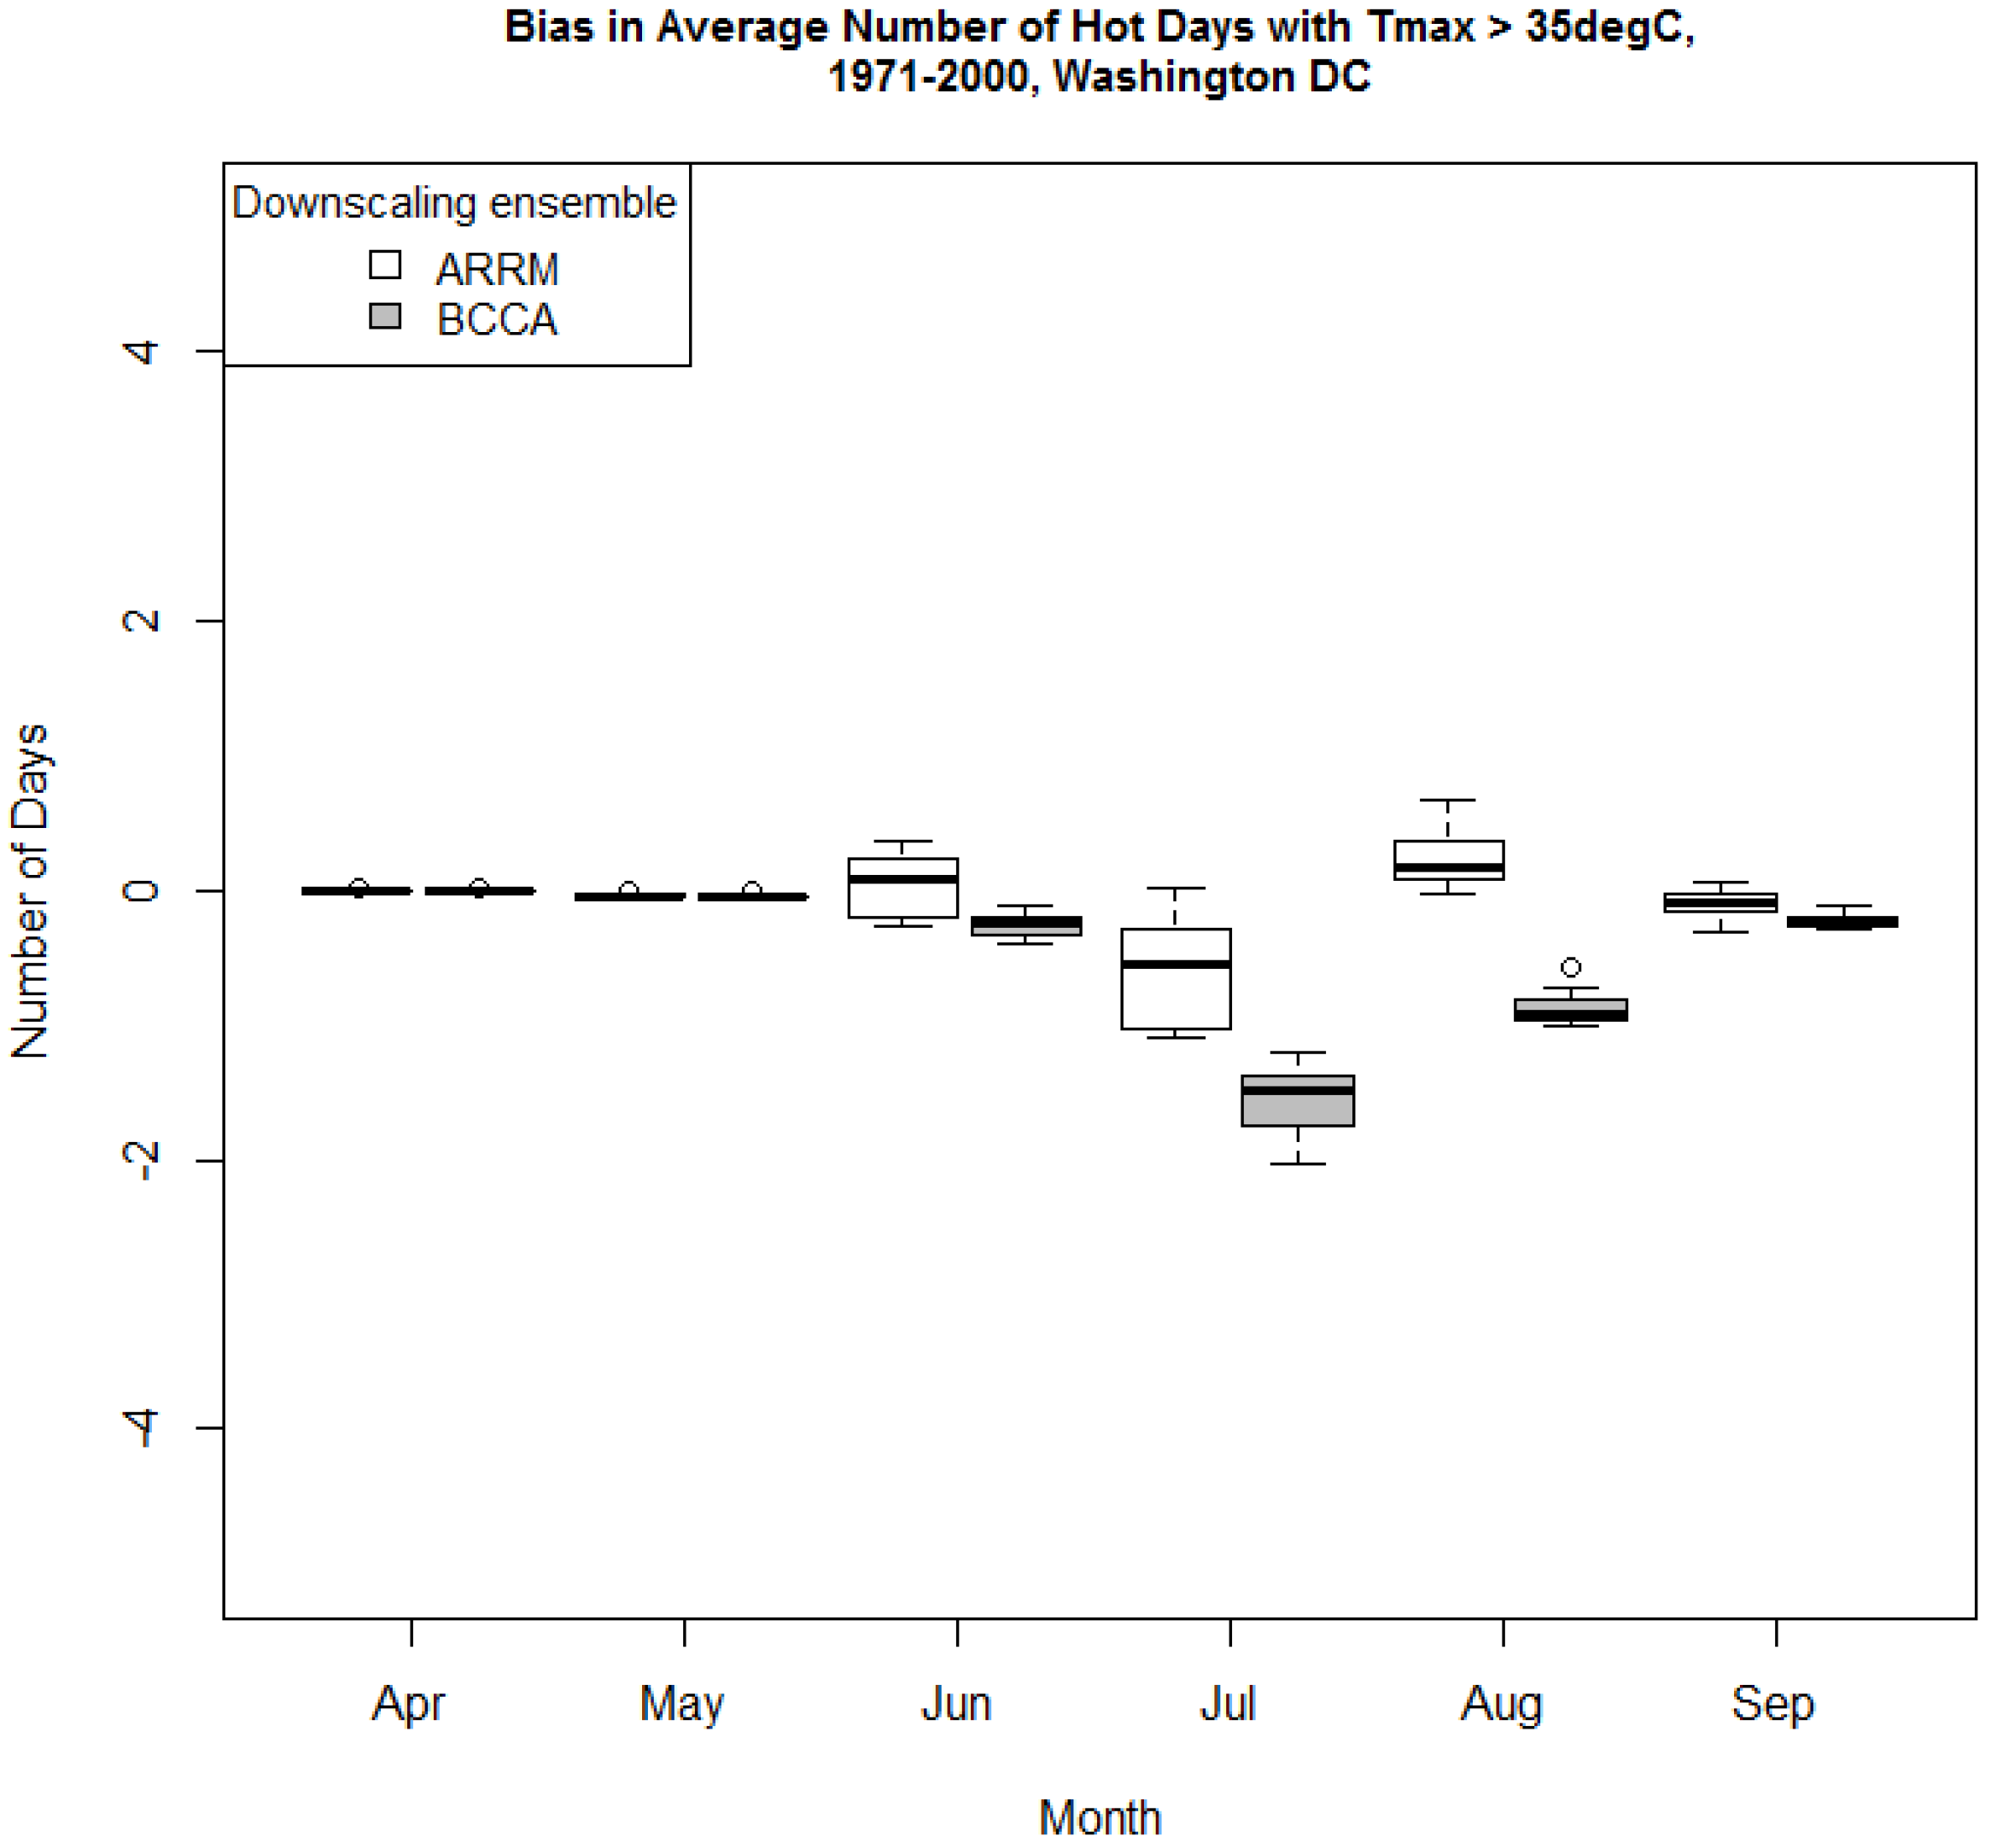
- The ARRM and BCCA downscaling methods represented the period means of the number of hot days and hot nights for 1971–2000 well overall. This is expected since these downscaling methods are developed to adjust and bias-correct the means and the quantiles of the GCM data distributions to match the observed quantiles of daily tasmax or tasmin, in our case.
- The greatest differences between ARRM and BCCA are found in the peak of the summer season, July and August, when ARRM overestimated and BCCA often underestimated the observed 30-year period means of some indices, however, these differences are not evaluated for statistical significance.
- There is minimal difference in the results when counties or climate divisions, standard aggregation units of several counties, are used in our analyses.
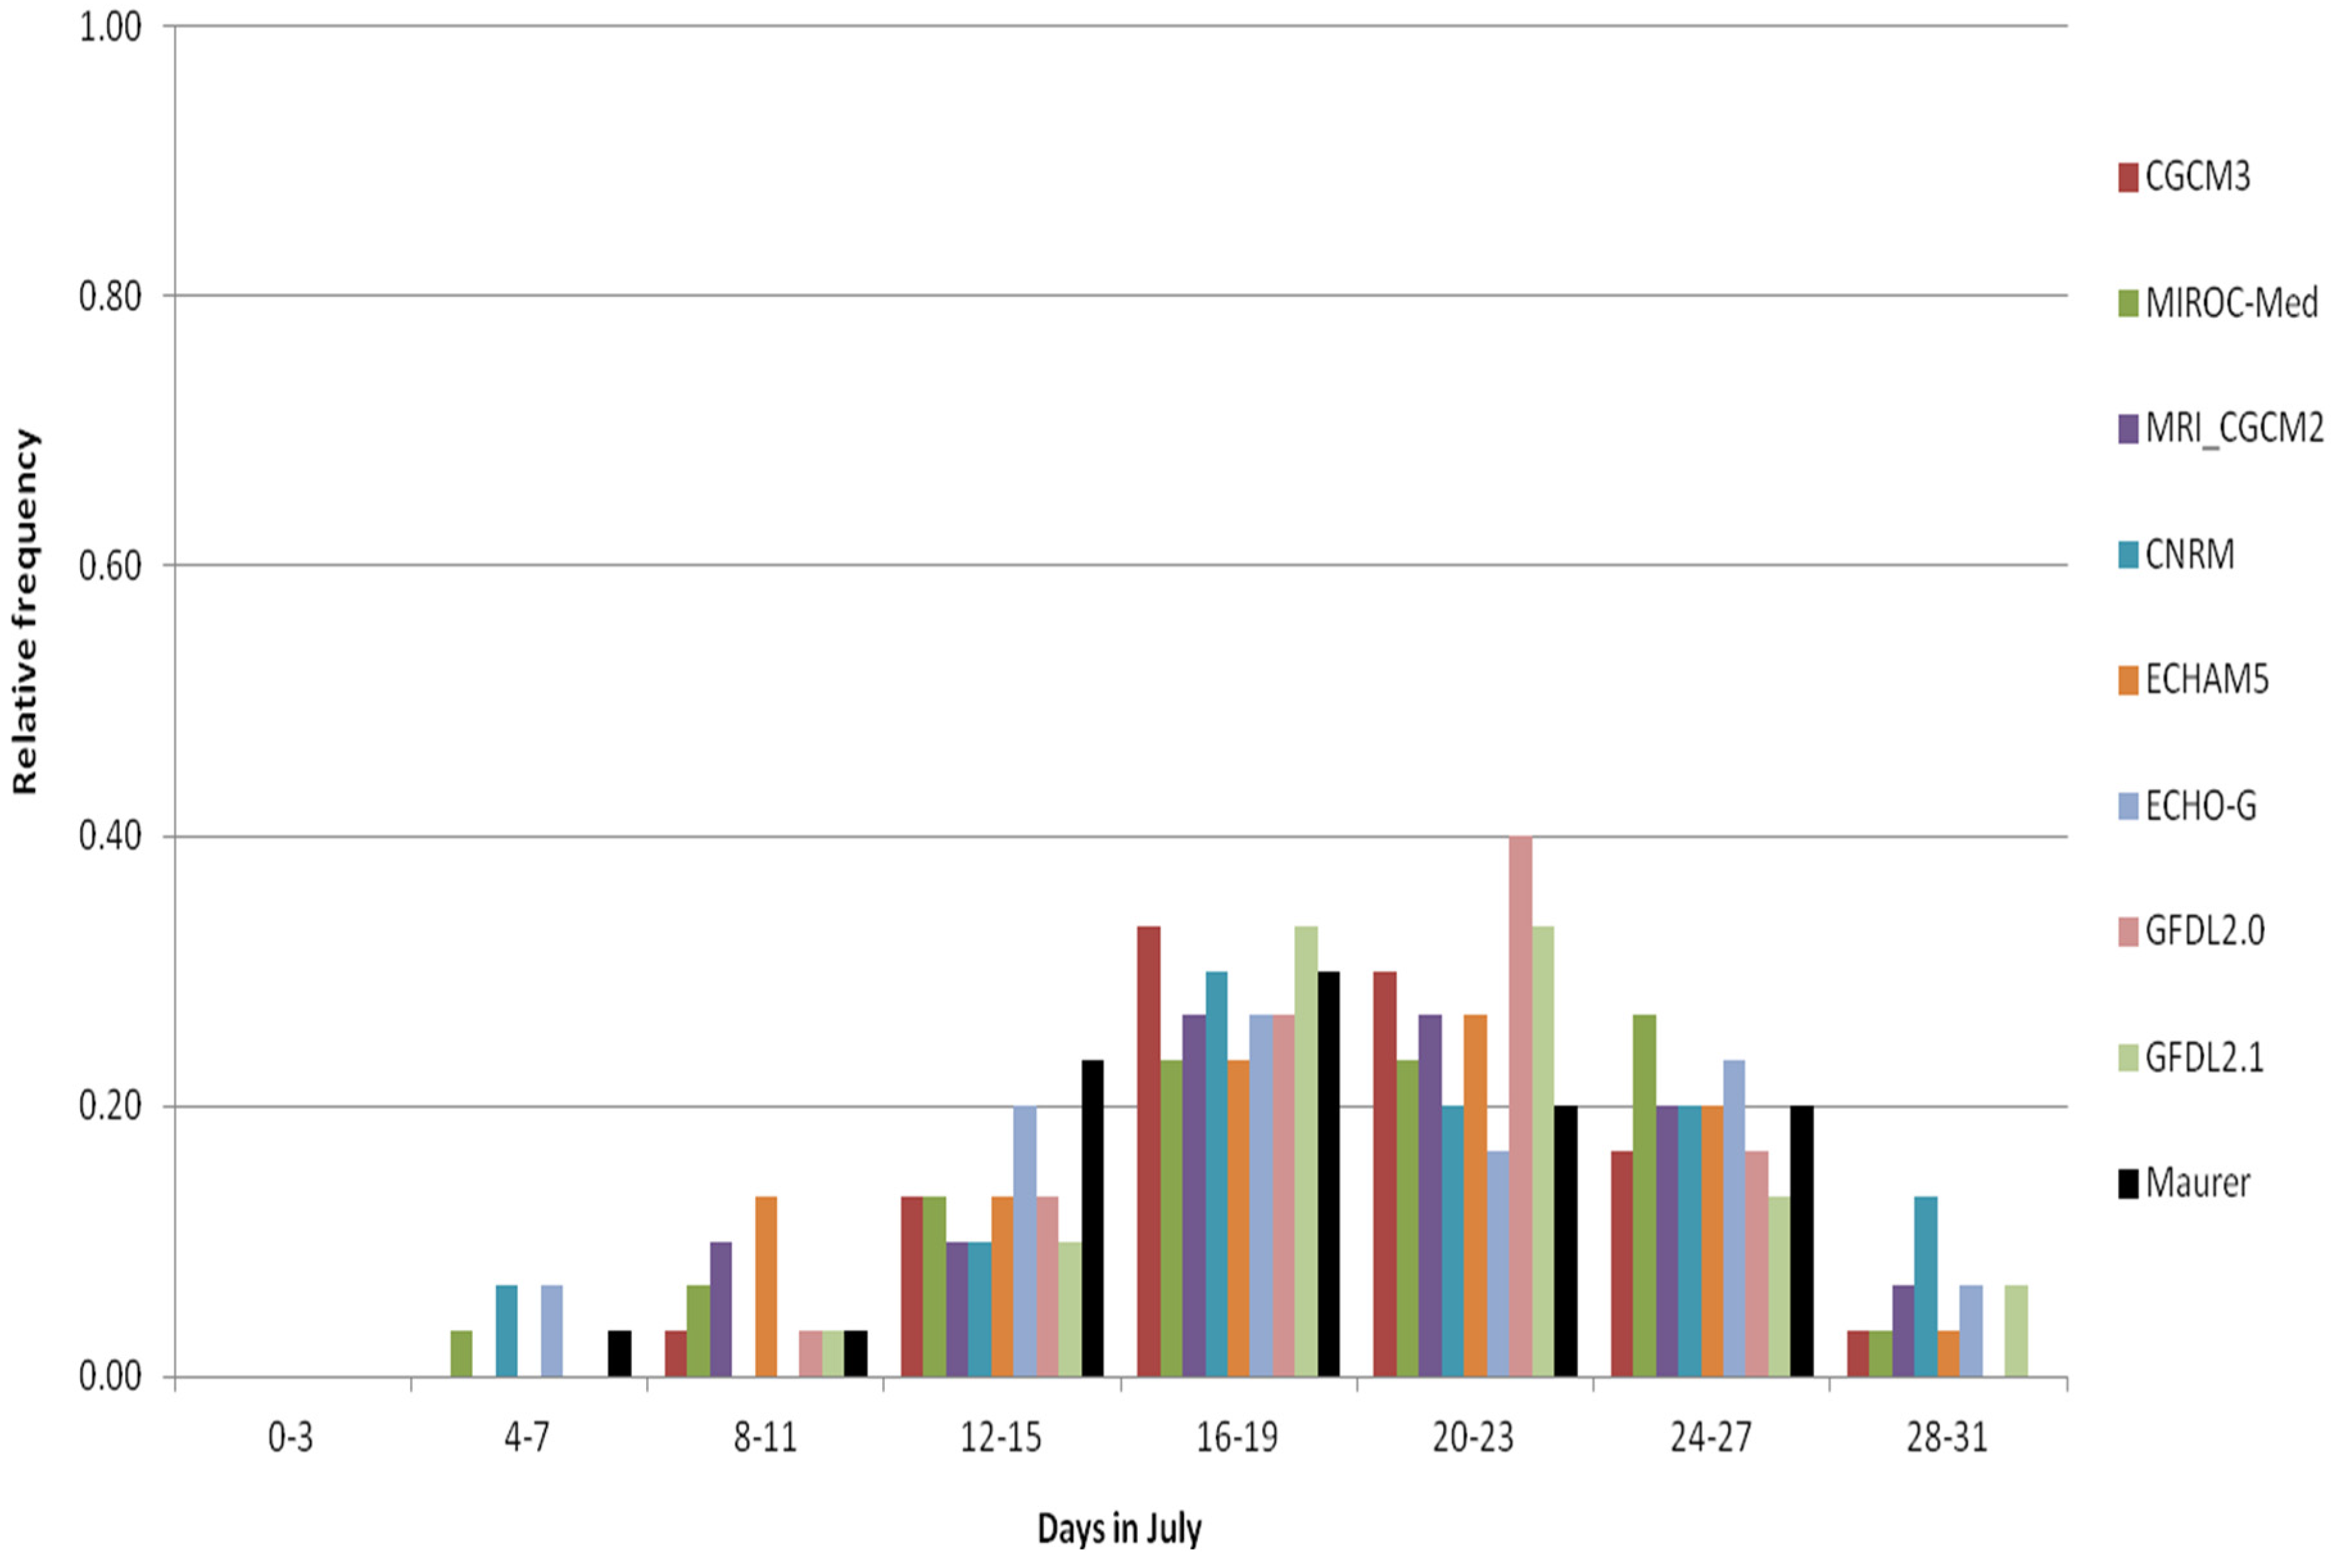
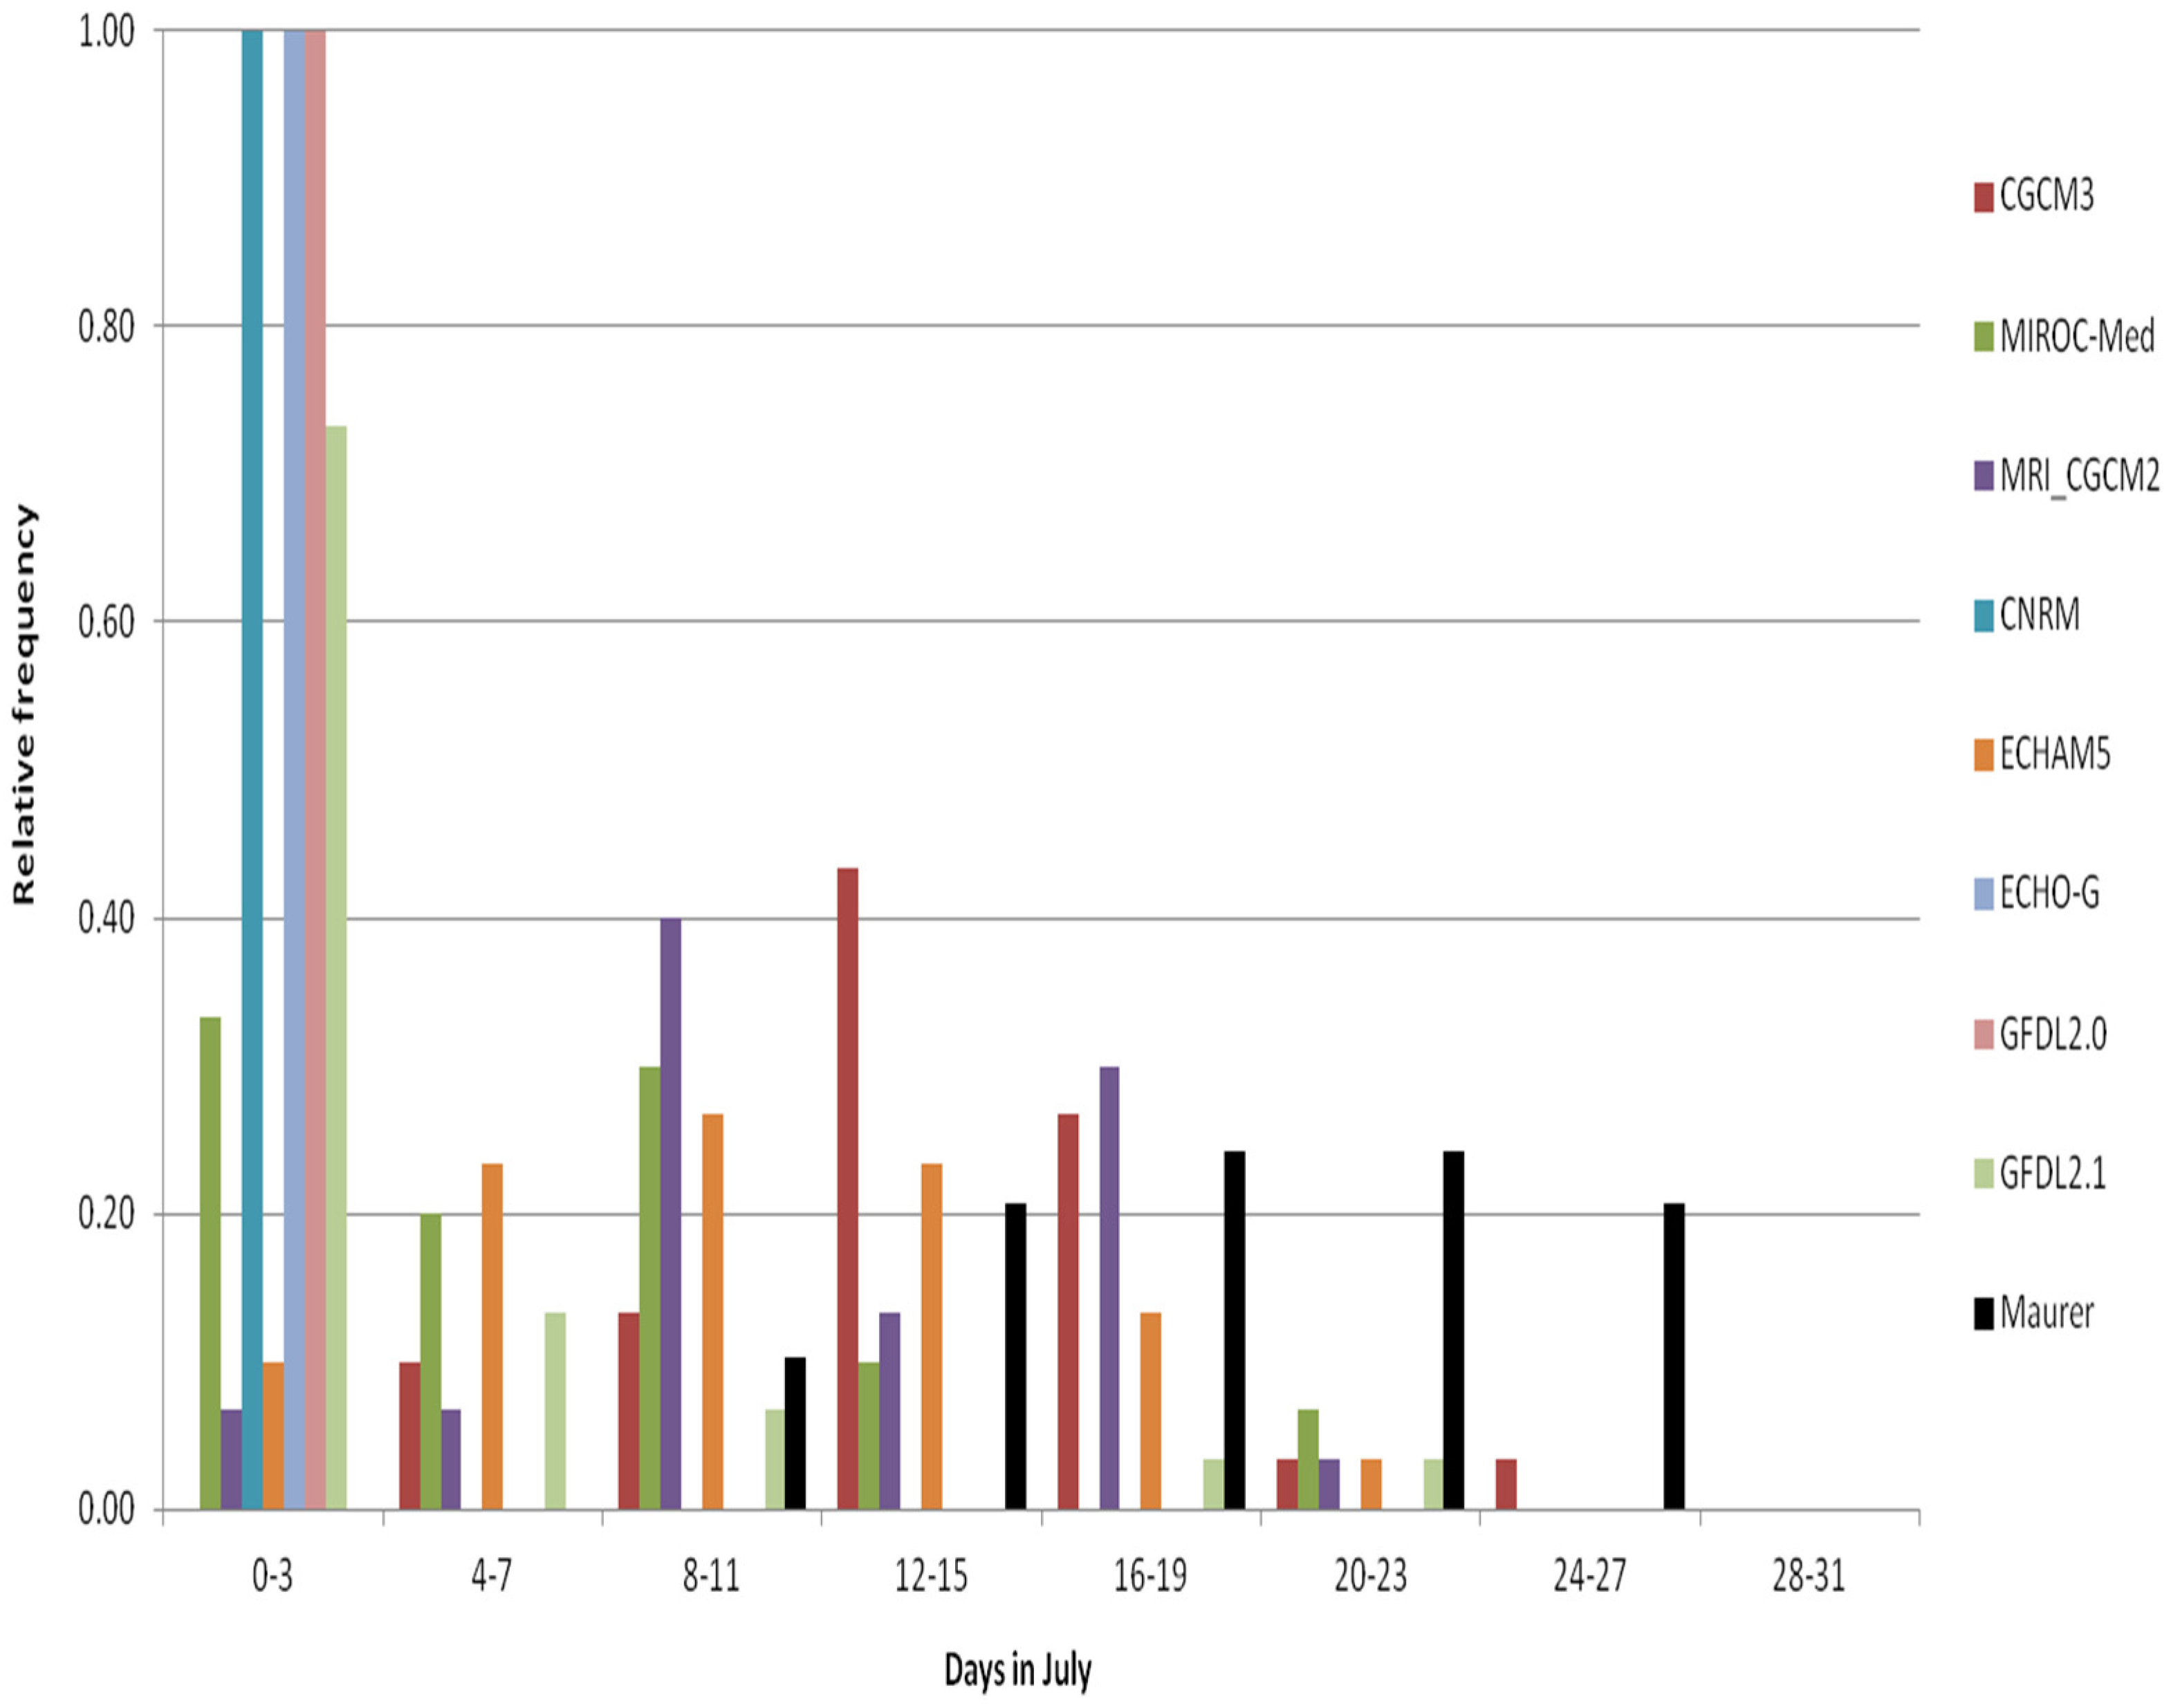
- In April and May some of the CMIP3 bias-corrected and downscaled using both downscaling methods GCMs miss the increase in HD30 towards the summer months.
- The application of the BCCA complete downscaling methodology introduces additional uncertainty for some of the models during April and May (CNRM, MIROC-med, GFDL21).
- In light of this, the use of downscaled data from the significantly different GCMs to project future changes in the occurrence of Salmonella infections in April and May may lead to erroneous conclusions.
- The bias-correction corrects the large biases of the re-gridded GCM data and renders the temperature simulations viable for the evaluation of potential for Salmonella occurrences.
- The direct application of 2-degree re-gridded climate-model based indices is not advisable. The bias correction and downscaling obscure the knowledge on uncertainty in the GCM simulations.
- The characteristics of the variability of the statistically downscaled data and indices are inherited from the daily weather variability of the GCMs. The downscaling methods discussed here are not developed to correct for this variability. The sequences of weather patterns in global climate models are closely related to their abilities to represent various physical processes, such as blocking, that may bring about extended periods with high temperatures. Therefore, we draw attention to climate-model processes that need to be well represented to improve the salience of their application by practitioners.
Supplementary Materials
Acknowledgments
Author Contributions
Conflicts of Interest
References
- Ebi, K.L.; Mills, D.M.; Smith, J.B.; Grambsch, A. Review: Climate Change and Human Health Impacts in the United States: An Update on the Results of the U.S. National Assessment. Environ. Health Perspect. 2006, 114, 1318–1324. [Google Scholar] [CrossRef] [PubMed]
- Field, C.B.; Barros, V.R.; Dokken, D.J.; Mach, K.J.; Mastrandrea, M.D.; Bilir, T.E.; Chatterjee, M.; Ebi, K.L.; Estrada, Y.O.; Genova, R.C.; et al. (Eds.) Contribution of Working Group II to the Fifth Assessment Report of the Intergovernmental Panel on Climate Change. In IPCC, 2014: Climate Change 2014: Impacts, Adaptation, and Vulnerability. Part A: Global and Sectoral Aspects; Cambridge University Press: Cambridge, UK; New York, NY, USA, 2014.
- Singh, R.B.; Hales, S.; de Wet, N.; Raj, R.; Hearnden, M.; Weinstein, P. The influence of climate variation and change on diarrheal disease in the Pacific Islands. Environ. Health Perspect. 2001, 109, 155–159. [Google Scholar] [CrossRef] [PubMed]
- Checkley, W.; Epstein, L.D.; Gilman, R.H.; Figueroa, D.; Cama, R.I.; Patz, J.A.; Black, R.E. Effects of EI Niño and ambient temperature on hospital admissions for diarrhoeal diseases in Peruvian children. Lancet 2000, 355, 442–450. [Google Scholar] [CrossRef]
- Lama, J.R.; Seas, C.R.; León-Barúa, R.; Gotuzzo, E.; Sack, R.B. Environmental temperature, cholera, and acute diarrhoea in adults in Lima, Peru. J. Health Popul. Nutr. 2004, 399–403. [Google Scholar]
- Bentham, G.; Langford, I.H. Environmental temperatures and the incidence of food poisoning in England and Wales. Int. J. Biometeorol. 2001, 45, 22–26. [Google Scholar] [CrossRef] [PubMed]
- Louis, V.R.; Gillespie, I.A.; O’Brien, S.J.; Russek-Cohen, E.; Pearson, A.D.; Colwell, R.R. Temperature_driven Campylobacter seasonality in England and Wales. Appl. Environ. Microbiol. 2005, 71, 85–92. [Google Scholar] [CrossRef] [PubMed]
- Lake, I.R.; Gillespie, I.A.; Bentham, G.; Nichols, G.L.; Lane, C.; Adak, G.K.; Threlfall, E.J. A re-evaluation of the impact of temperature and climate change on foodborne illness. Epidemiol. Infect. 2009, 137, 1538–1547. [Google Scholar] [CrossRef] [PubMed]
- Kovats, R.S.; Edwards, S.J.; Hajat, S.; Armstrong, B.G.; Ebi, K.L.; Menne, B. The effect of temperature on food poisoning: A Time Series Analysis of Salmonellosis in Ten European Countries. Epidemiol. Infect. 2004, 132, 443–453. [Google Scholar] [CrossRef] [PubMed]
- Fleury, M.; Charron, D.F.; Holt, J.D.; Allen, O.B.; Maarouf, A.R. A time series analysis of the relationship of ambient temperature and common bacterial enteric infections in two Canadian provinces. Int. J. Biometeorol. 2006, 50, 385–391. [Google Scholar] [CrossRef] [PubMed]
- Bi, P.; Zhang, Y.; Hiller, J.; Cameron, S. Climate variability and Salmonella infection in an Australian temperate climate city. Epidemiology 2009. [Google Scholar] [CrossRef]
- D’Souza, R.M.; Becker, N.G.; Hall, G.; Moodie, K.B. Dose ambient temperature affect foodborne disease? Epidemiology 2004, 15, 86–92. [Google Scholar] [CrossRef]
- Zhang, Y.; Bi, P.; Hiller, J. Climate variations and salmonellosis transmission in Adelaide, South Australia: A comparison between regression models. Int. J. Biometeor. 2008, 52, 197–187. [Google Scholar]
- Zhang, Y.; Bi, P.; Hiller, J. Climate variations and Salmonella infection in Australian subtropical and tropical regions. Sci. Tot. Environ. 2010, 408, 524–530. [Google Scholar] [CrossRef] [PubMed]
- Zhang, Y.; Bi, P.; Hiller, J.E.; Sun, Y.; Ryan, P. Climate variations and bacillary dysentery in northern and southern cities of China. J. Infect. 2007, 55, 194–200. [Google Scholar] [CrossRef] [PubMed]
- Naumova, E.N. Seasonality in six enterically transmitted diseases and ambient temperature. Epidemiol. Infect. 2007, 135, 281–292. [Google Scholar] [CrossRef] [PubMed]
- Lal, A.; Ikeda, T.; French, N.; Baker, M.G.; Hales, S. Climate Variability, Weather and Enteric Disease Incidence in New Zealand: Time Series Analysis. PLoS ONE 2013. [Google Scholar] [CrossRef] [PubMed]
- Grjibovski, A.M.; Bushueva, V.; Boltenkov, V.P.; Buzinov, R.V.; Degteva, G.N.; Yurasova, E.D.; Nurse, J. Climate variations and salmonellosis in northwest Russia: A Time Series Analysis. Epidemiol. Infect. 2013, 141, 269–276. [Google Scholar] [CrossRef] [PubMed]
- Hu, W.; Mengersen, K.; Fu, S.Y.; Tong, S. The use of ZIP and CART to model cryptosporidiosis in relation to climatic variables. Int. J. Biometeor. 2010, 54, 433–440. [Google Scholar] [CrossRef] [PubMed]
- Baird-Parker, A.C. Fred Griffith Review Lecture. Foods and microbiological risks. Microbiology 1994, 140, 687–695. [Google Scholar] [CrossRef] [PubMed]
- Schaechter, M.; Maaloe, O.; Kjeldgaard, N.O. Dependency on medium and temperature of cell size and chemical composition during balanced grown of Salmonella typhimurium. J. Gen. Microbiol. 1958, 19, 592–606. [Google Scholar] [CrossRef] [PubMed]
- Febriani, Y.; Levallois, P.; Gingras, S.; Gosselin, P.; Majowicz, S.E.; Fleury, M.D. The association between farming activities, precipitation, and the risk of acute gastrointestinal illness in rural municipalities of Quebec, Canada: A cross-sectional study. BMC Public Health 2010. [Google Scholar] [CrossRef] [PubMed]
- US Centers for Disease Control and Prevention (CDC). Estimating Foodborne Illness: An Overview. Available online: http://www.cdc.gov/foodborneburden/estimates-overview.html (accessed on 25 September 2014).
- Scharff, R.L. Economic burden from health losses due to foodborne illness in the United States. J. Food Prot. 2012, 75, 123–131. [Google Scholar] [CrossRef] [PubMed]
- Tang, S.; Dessai, S. Usable science? The UK Climate Projections 2009 and decision support for adaptation planning. Weather Clim. Soc. 2012, 4, 300–313. [Google Scholar] [CrossRef]
- USGS Geo Data Portal. Available online: http://cida.usgs.gov/gdp/ (accessed on 25 September 2014).
- Worldclim. Available online: http://www.worldclim.org (accessed on 25 September 2014).
- Climate Wizard. Available online: http://climatewizard.org (accessed on 25 September 2014).
- NASA NEX DCP30 Portal. Available online: https://cds.nccs.nasa.gov/nex/ (accessed on 25 September 2014).
- Chalmers, S.; Esterman, A.; Eston, R.; Bowering, K.J.; Norton, K. Short-term heat acclimation training improves physical performance: A Systematic Review, and Exploration of Physiological Adaptations and Application for Team Sports. Sports Med. 2014, 44, 971–988. [Google Scholar] [CrossRef] [PubMed]
- Anderson, G.B.; Bell, M.L. Heat waves in the United States: Mortality Risk during Heat Waves and Effect Modification by Heat Wave Characteristics in 43 U.S. Communities. Environ. Health Perspect. 2011, 119, 210–218. [Google Scholar] [CrossRef] [PubMed]
- Brugge, R. The record-breaking heatwave of 1–4 August 1990 over England and Wales. Weather 1991, 46, 2–10. [Google Scholar] [CrossRef]
- Black, E.; Blackburn, M.; Harrison, G.; Hoskins, B.; Methven, J. Factors contributing to the summer 2003 European heatwave. Weather 2004, 59, 217–223. [Google Scholar] [CrossRef]
- Dole, R.; Hoerling, M.; Perlwitz, J.; Eischeid, J.; Pegion, P.; Zhang, T.; Quan, X.; Xu, T.; Murray, D. Was there a basis for anticipating the 2010 Russian heat wave? Geophys. Res. Lett. 2011. [Google Scholar] [CrossRef]
- Pfahl, S.; Wernli, H. Quantifying the relevance of atmospheric blocking for co-located temperature extremes in the Northern Hemisphere on (sub-)daily time scales. Geophys. Res. Let. 2012. [Google Scholar] [CrossRef]
- Tibaldi, S.; Tosi, E.; Navarra, A.; Pedulli, L. Northern and Southern Hemisphere seasonal variability of blocking frequency and predictability. Mon. Wea. Rev. 1994, 122, 1971–2003. [Google Scholar] [CrossRef]
- Dilling, L.; Lemos, M.C. Creating usable science: Opportunities and Constraints for Climate Knowledge Use and Their Implications for Science Policy. Glob. Environ. Change 2011, 21, 680–689. [Google Scholar] [CrossRef]
- Barsugli, J.J.; Guentchev, G.; Horton, R.M.; Wood, A.; Mearns, L.O.; Liang, X.Z.; Ammann, C. The Practitioner’s Dilemma: How to Assess the Credibility of Downscaled Climate Projections. Eos Trans. Am. Geophys. Union 2013, 94, 424–425. [Google Scholar] [CrossRef]
- Maurer, E.P.; Wood, A.W.; Adam, J.C.; Lettenmaier, D.P.; Nijssen, B. A Long-term hydrologically-based data set of land surface fluxes and States for the Conterminous United States. J. Clim. 2002, 15, 3237–3251. [Google Scholar] [CrossRef]
- Kendall, M.G. Rank Correlation Methods, 4th ed.; Charles Griffin & Co. Ltd.: London, UK, 1976. [Google Scholar]
- Stoner, A.M.K.; Hayhoe, K.; Dixon, K.; Lanzante, J.; Radhakrishnan, A. Comparing Statistical Downscaling Methods: From Simple to Complex. In Presentation at the NCPP Workshop on Quantitative Evaluation of Downscaling, NCAR, Boulder, CO, USA, 12–16 August 2013; Available online: http://earthsystemcog.org/site_media/projects/downscaling-2013/20130813QED2013AStonerHowtoAccessandUsePMD.pptx (accessed on 25 September 2014).
- Stoner, A.M.K.; Hayhoe, K.; Yang, X.; Wuebbles, D. An asynchronous regional regression model for statistical downscaling of daily climate variables. Int. J. Climatol. 2012. [Google Scholar] [CrossRef]
- Maurer, E.P.; Hidalgo, H.G.; Das, T.; Dettinger, M.D.; Cayan, D.R. The utility of daily large-scale climate data in the assessment of climate change impacts on daily streamflow in California. Hydrol. Earth Sys. Sci. 2010, 14, 1125–1138. [Google Scholar] [CrossRef]
- Meehl, G.A.; Covey, C.; Taylor, K.E.; Delworth, T.; Stouffer, R.J.; Latif, M.; McAvaney, B.; Mitchell, J.F.B. The WCRP CMIP3 multimodel dataset: A new era in climate change research. Bull. Amer. Meteor. Soc. 2007, 88, 1383–1394. [Google Scholar] [CrossRef]
- Gleckler, P.J.; Taylor, K.E.; Doutriaux, C. Performance metrics for climate models. J. Geophys. Res. 2008. [Google Scholar] [CrossRef]
- Reichler, T.; Kim, J. How Well Do Coupled Models Simulate Today’s Climate? BAMS 2008. [Google Scholar] [CrossRef]
- Downscaled CMIP3 and CMIP5 Climate and Hydrology Projections archive. Available online: http://gdo-dcp.ucllnl.org/downscaled_cmip_projections/ (accessed on 25 September 2014).
- Maurer, E.P.; Brekke, L.; Pruitt, T.; Duffy, P.B. Fine-resolution climate projections enhance regional climate change impact studies. Eos Trans. 2007. [Google Scholar] [CrossRef]
- Guttman, N.; Quayle, R. A historical perspective of U.S. climate divisions. Bull. AMS 1996, 77, 293–303. [Google Scholar] [CrossRef]
- Open Climate GIS (OCGIS) Tool. Open Climate GIS Overview. Available online: https://earthsystemcog.org/projects/openclimategis/ (accessed on 2 July 2014).
- R Development Core Team. R: A Language and Environment for Statistical Computing; R Foundation for Statistical Computing: Vienna, Austria, 2013. [Google Scholar]
- Panofsky, H.A.; Brier, G.W. Some Applications of Statistics to Meteorology; Pennsylvania State University: State College, PA, USA, 1958. [Google Scholar]
- Brunner, E.; Munzel, U. The Nonparametric Behrens-Fisher Problem: Asymptotic Theory and a Small-Sample Approximation. Biom. J. 2000, 42, 17–25. [Google Scholar] [CrossRef]
- Hidalgo, H.G.; Dettinger, M.D.; Cayan, D.R. Downscaling with Constructed Analogues: Daily Precipitation and Temperature Fields over the United States: California Energy Commission; California Energy Commission Report: Sacramento, CA, USA, 2008; p. 62.
- Dixon, K.W.; Lanzante, J.R.; Nath, M.J.; Hayhoe, K.; Stoner, A.; Radhakrishnan, A.; Balaji, V.; Gaitán, C.F. Evaluating the stationarity assumption in statistically downscaled climate projections: Is past performance an indicator of future results? Climatic Change 2016. [Google Scholar] [CrossRef]


| Index | Description |
|---|---|
| HD30 | Number of “hot” days with daily maximum temperature (tasmax) >30 °C |
| HD35 | Number of “hot” days with tasmax >35 °C |
| TR (tropical nights) | Number of “tropical” nights with daily minimum temperature (tasmin) >20 °C |
| Data | Abbreviation | Resolution |
|---|---|---|
| ARRM downscaled GCMs tasmax, tasmin 20C3M experiment | ARRM_ensemble_1/8 | 1/8° lat × 1/8° lon (approx.12 km) |
| BCCA downscaled GCMs tasmax, tasmin 20C3M experiment | BCCA_ensemble_1/8 | same |
| Observed—Maurer02v2 tasmax, tasmin | Maurer02v2_1/8 | same |
| Re-gridded GCM tasmax 20C3M experiment | GCM_2deg | 2° lat × 2° lon |
| Bias-Corrected Re-gridded GCM tasmax 20C3M experiment | BC GCM_2deg | same |
| Re-gridded Observed—Maurer02v1 tasmax | Maurer02v1_2deg | same |
| Dataset | Maurer02v2_1/8 | Maurer02v1_2deg |
|---|---|---|
| ARRM_ensemble_1/8 | X | |
| BCCA_ensemble_1/8 | X | |
| GCM_2deg | X | |
| BC GCM_2deg | X |
| CMIP3 Model i.d. | Country | Atmosphere Model Component—Horizontal Resolution lat × lon |
|---|---|---|
| CGCM3.1(T47) | Canada | 3.75° × 3.75° |
| CNRM-CM3 | France | 2.8° × 2.8° |
| ECHAM5/MPI-OM | Germany | 1.9° × 1.9° |
| ECHO-G | Germany/Korea | 3.75° × 3.75° |
| GFDL-CM2.0 | USA | 2.0° × 2.5° |
| GFDL-CM2.1 | USA | 2.0° × 2.5° |
| MIROC3.2(medres) | Japan | approx. 2.8° × 2.8° |
| MRI-CGCM2.3.2 | Japan | approx. 2.8° × 2.8° |
© 2016 by the authors; licensee MDPI, Basel, Switzerland. This article is an open access article distributed under the terms and conditions of the Creative Commons by Attribution (CC-BY) license (http://creativecommons.org/licenses/by/4.0/).
Share and Cite
Guentchev, G.S.; Rood, R.B.; Ammann, C.M.; Barsugli, J.J.; Ebi, K.; Berrocal, V.; O’Neill, M.S.; Gronlund, C.J.; Vigh, J.L.; Koziol, B.; et al. Evaluating the Appropriateness of Downscaled Climate Information for Projecting Risks of Salmonella. Int. J. Environ. Res. Public Health 2016, 13, 267. https://doi.org/10.3390/ijerph13030267
Guentchev GS, Rood RB, Ammann CM, Barsugli JJ, Ebi K, Berrocal V, O’Neill MS, Gronlund CJ, Vigh JL, Koziol B, et al. Evaluating the Appropriateness of Downscaled Climate Information for Projecting Risks of Salmonella. International Journal of Environmental Research and Public Health. 2016; 13(3):267. https://doi.org/10.3390/ijerph13030267
Chicago/Turabian StyleGuentchev, Galina S., Richard B. Rood, Caspar M. Ammann, Joseph J. Barsugli, Kristie Ebi, Veronica Berrocal, Marie S. O’Neill, Carina J. Gronlund, Jonathan L. Vigh, Ben Koziol, and et al. 2016. "Evaluating the Appropriateness of Downscaled Climate Information for Projecting Risks of Salmonella" International Journal of Environmental Research and Public Health 13, no. 3: 267. https://doi.org/10.3390/ijerph13030267