
Using an External Exposome Framework to Examine Pregnancy-Related Morbidities and Mortalities: Implications for Health Disparities Research

 ,
,
Abstract
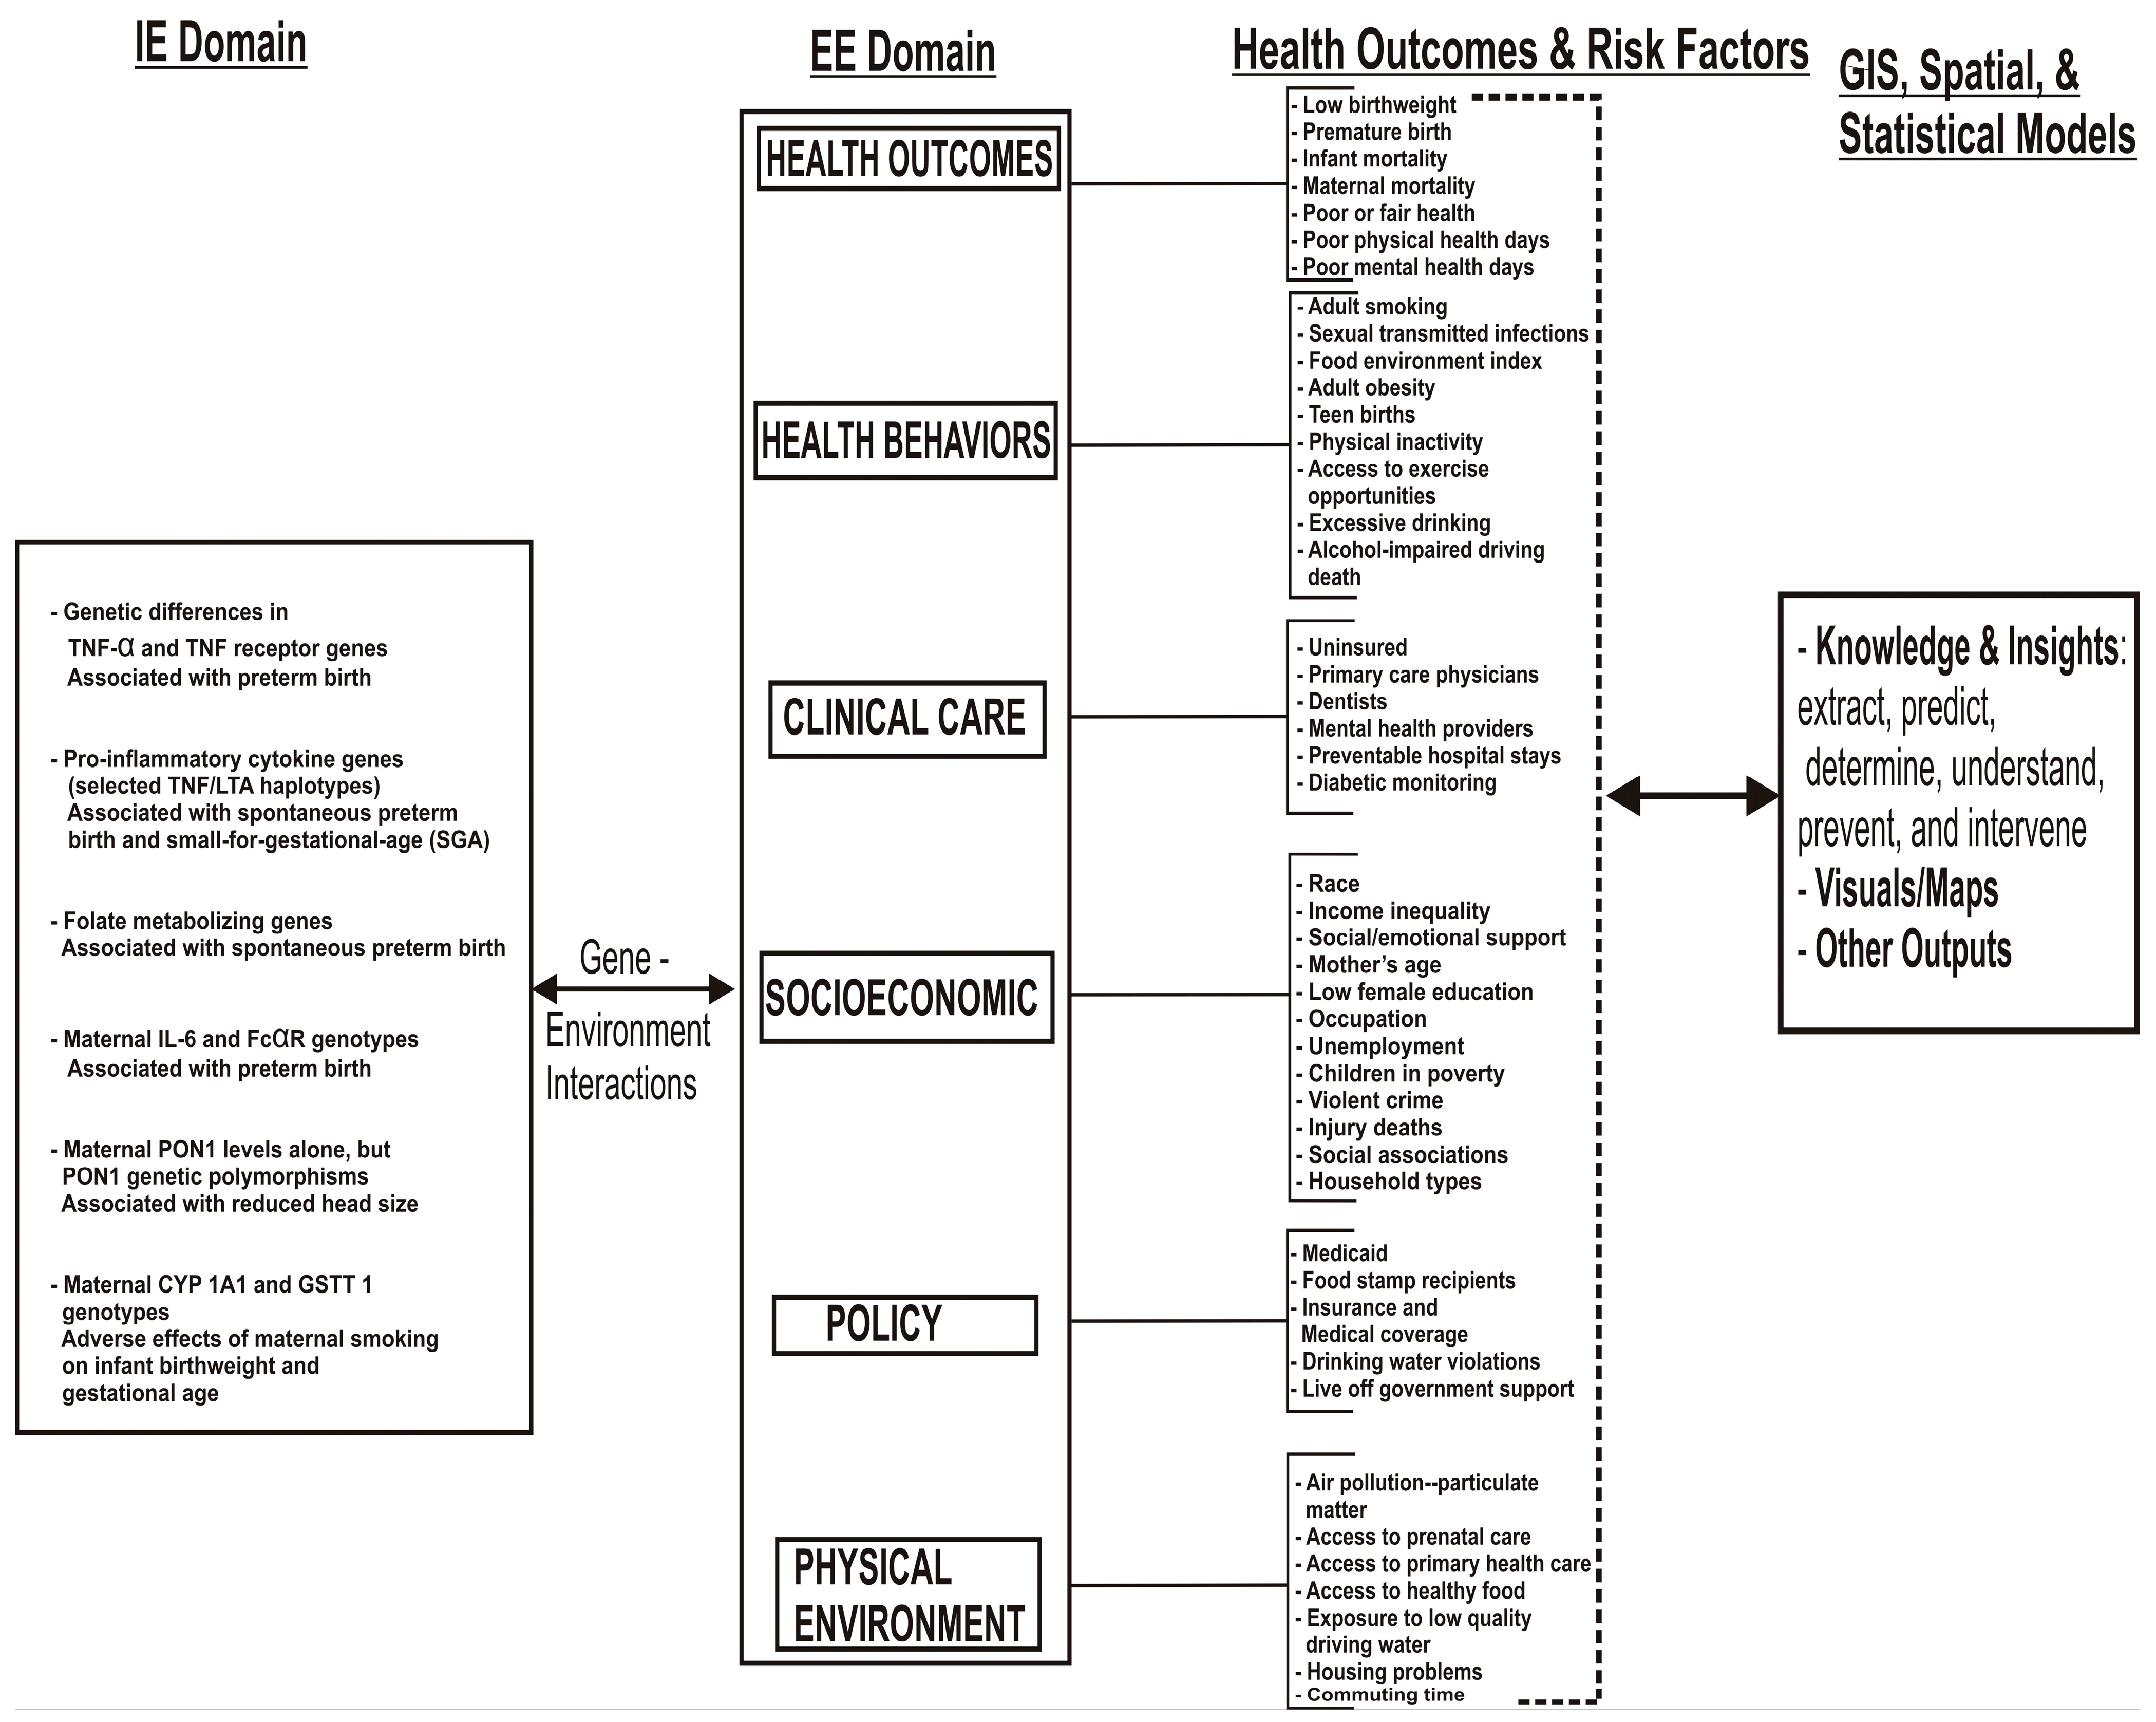
:1. Introduction
1.1. Background
1.2. Infant Mortality, Premature Birth, Low Birthweight, and Maternal Morbidities
2. Methods
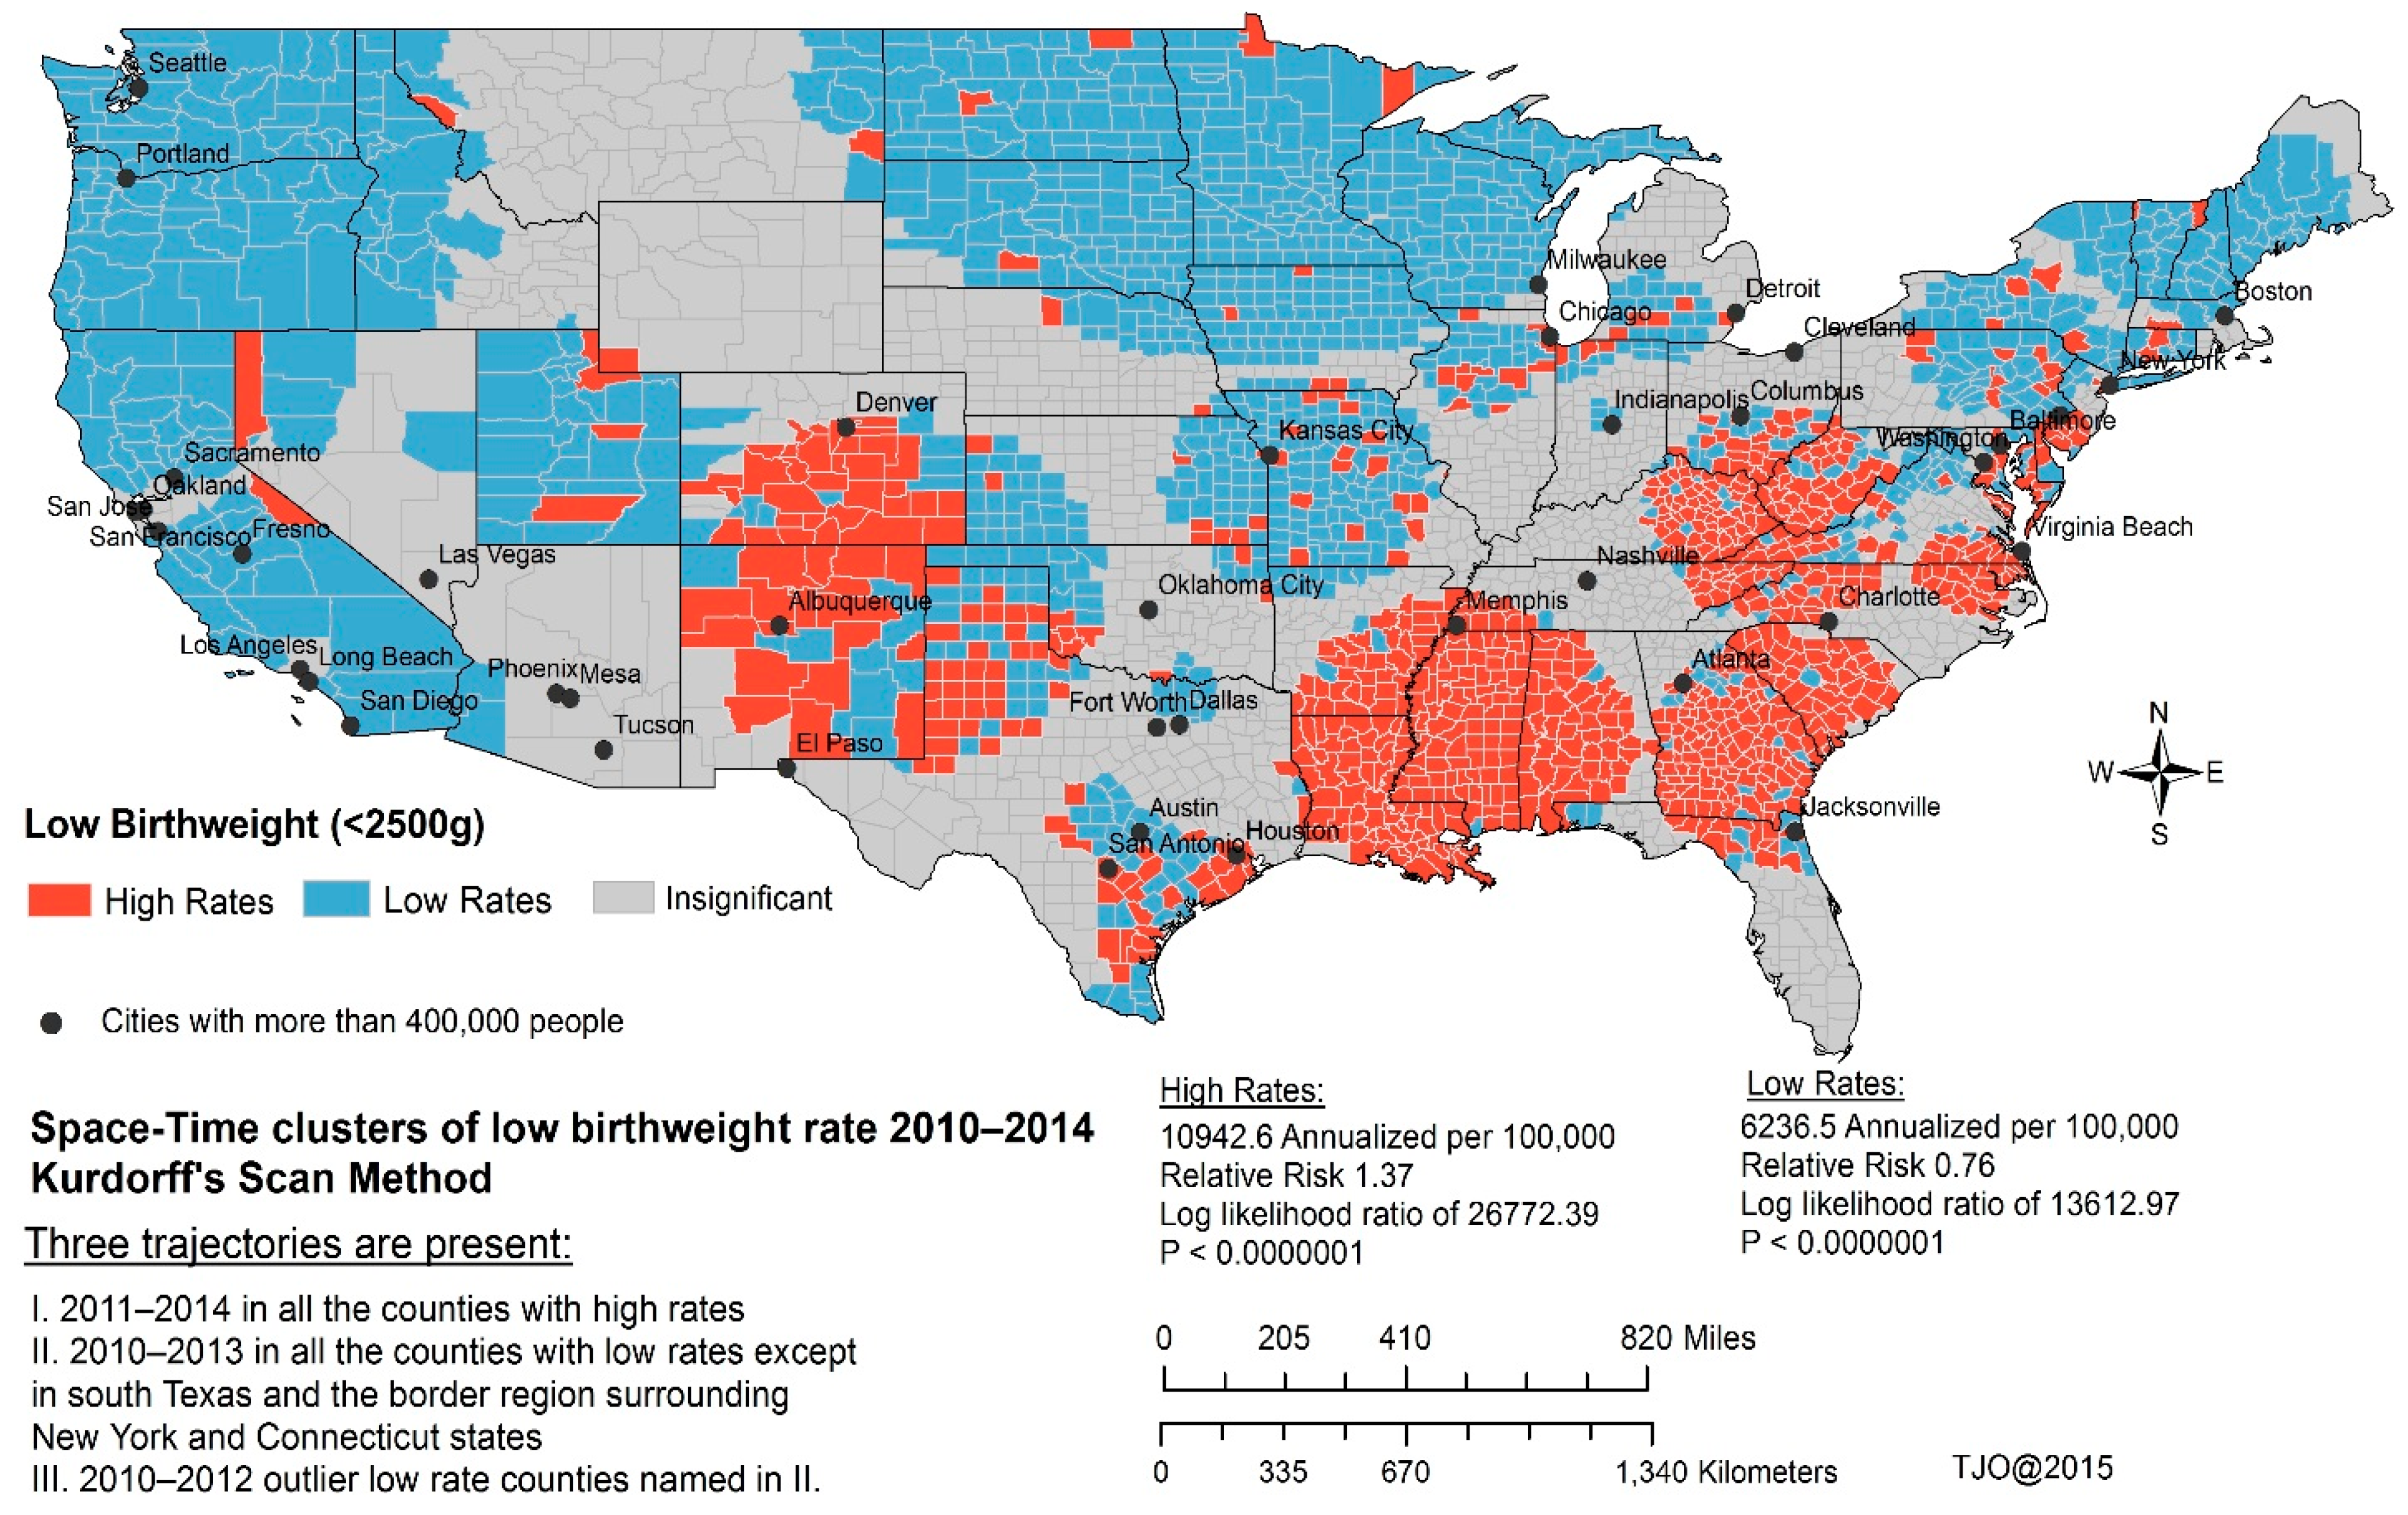
Exploring Low Birthweight Variations Using Powerful Spatiotemporal Models
3. Results

| Measure | Description | Data Source | Years of Data |
|---|---|---|---|
| HEALTH OUTCOMES | |||
| Premature death | Years of potential life lost before age 75 per 100,000 (age-adjusted) | National Center for Health Statistics—Mortality files | 2010–2012 |
| Poor or fair health | % of adults that report fair or poor health (age-adjusted) | Behavioral Risk Factor Surveillance System | 2006–2012 |
| Poor physical health days | Average # of reported physically unhealthy days per month | Behavioral Risk Factor Surveillance System | 2006–2012 |
| Poor mental health days | Average # of reported mentally unhealthy days per month | Behavioral Risk Factor Surveillance System | 2006–2012 |
| Low birthweight | % of births with low birth weight (<2500 g) | Behavioral Risk Factor Surveillance System | 2006–2012 |
| HEALTH FACTORS | |||
| HEALTH BEHAVIORS | |||
| Adult smoking | % of adults that reported currently smoking | Behavioral Risk Factor Surveillance System | 2006–2012 |
| Adult obesity | % of adults that report BMI ≥ 30 | CDC Diabetes Interactive Atlas | 2011 |
| Food environment index | Indicator of access to healthy foods—0 is worst, 10 is best | USDA Food Environment Atlas, Map the Meal Gap | 2012 |
| Physical inactivity | % of adults that report no leisure-time physical activity | CDC Diabetes Interactive Atlas | 2011 |
| Access to exercise opportunities | % of the population with access to places for physical activity | Business Analyst, Delorme map data, ESRI & US Census Tigerline Files | 2010 & 2013 |
| Access to recreational facilities | % of recreational facility access per 100,000 | USDA Food Environment Atlas, Map the Meal Gap | 2008 |
| Limited access to healthy foods | % of people with limited access to health foods | USDA Food Environment Atlas, Map the Meal Gap | 2008 |
| Fast food restaurants | % of restaurants that are fast food restaurants | USDA Food Environment Atlas, Map the Meal Gap | 2008 |
| Binge drinking | % of adults that report binge drinking | Behavioral Risk Factor Surveillance System | 2006–2012 |
| Alcohol-impaired driving deaths | % of driving deaths with alcohol involvement | Fatality Analysis Reporting System | 2009–2013 |
| Sexually transmitted infections | # of Chlamydia cases per 100,000 | National Center for HIV/AIDS, Viral Hepatitis, STD, and TB Prevention | 2012 |
| Teen birth rate | # of births per 1000 female population ages 15–19 | National Center for Health Statistics—Mortality files | 2006–2012 |
| CLINICAL CARE | |||
| Uninsured adults | % of adults ages 18–64 without insurance | Small Area Health Insurance Estimates | 2012 |
| Primary care provider rate | # of primary care physicians per 100,000 | Area Health Resource File/American Medical Association | 2012 |
| Mental health providers | Ratio of population to mental health providers | CMS, National Provider Identification File | 2014 |
| Preventable hospital stays | # of hospital stays for ambulatory-sensitive conditions per 1000 Medicare enrollees | Dartmouth Atlas of Health Care | 2012 |
| Diabetic screening | % of Diabetic Medicare enrollees receiving HbA1c test | Dartmouth Atlas of Health Care | 2012 |
| Mammography screening | % of female Medicare enrollees ages 67–69 having at least 1 mammogram in 2 years | Dartmouth Atlas of Health Care | 2012 |
| SOCIAL AND ECONOMIC FACTORS | |||
| High school graduation | Calculated averaged freshman graduation rate | data.gov, supplemented w/National Center for Education Statistics | 2011–2012 |
| High school graduation | Graduation rate (Cohort or Averaged Freshman) | data.gov, supplemented w/National Center for Education Statistics | 2011–2013 |
| College degrees | % of adults ages 25–44 with some post-secondary education | American Community Survey | 2009–2013 |
| Unemployment | % of population age 16+ unemployed and looking for work | Bureau of Labor Statistics | 2013 |
| Children in poverty | % of children under age 18 living in poverty | Small Area Income and Poverty Estimates | 2013 |
| Income inequality | Gini coefficient of household income inequality | American Community Survey | 2009–2013 |
| Inadequate social support | % of adults that report not getting social/emotional support | Behavioral Risk Factor Surveillance System | 2006–2012 |
| Single-parent households | % of households that are single-parent households | American Community Survey | 2009–2014 |
| Violent crime rate | # of violent crimes per 100,000 | Uniform Crime Reporting—FBI | 2010–2012 |
| Homicide rate | # of homicides per 100,000 (age-adjusted) | Uniform Crime Reporting—FBI | 2000–2006 |
| Injury deaths | # of deaths due to injury per 100,000 | CDC WONDER mortality data | 2008–2012 |
| Age | Different Mother Age intervals | U.S Census Bureau | 2010 |
| Race | Different Racial/Ethnic groups | U.S Census Bureau | 2010 |
| PHYSICAL ENVIRONMENT | |||
| Air pollution-particulate matter days | # of days that air quality was unhealthy due to fine particulate matter | CDC WONDER environmental data | 2011 |
| Air pollution-ozone days | # of days that air quality was unhealthy due to ozone | CDC WONDER environmental data | 2011 |
| Daily fine particulate matter | Average daily PM2.5 | CDC WONDER environmental data | 2011 |
| Drinking water safety | % of population in violations | Safe Drinking Water Information System | 2013–2014 |
| Severe housing problems | Calculated averaged freshman graduation rate | Comprehensive Housing Affordability Strategy (CHAS) data | 2007–2011 |
| Driving alone to work | % of people who drive alone to work | American Community Survey | 2009–2013 |
| Long commute-driving alone | Among workers who commute in their car alone, the percentage that commute more than 30 min | American Community Survey | 2009–2013 |
| Variable | 2010 | 2011 | 2012 | 2013 | 2014 | Overall Model 2010–2014 |
|---|---|---|---|---|---|---|
| Coefficient | Coefficient | Coefficient | Coefficient | Coefficient | ||
| Percent of low birthweight | 8.255 | 6.115 | 10.28 | 12.009 | 8.974 | 9.745 |
| (16.702) ** | (9.753) ** | (17.224) ** | (18.45) ** | (21.42) ** | (23.107) ** | |
| Ambulatory care sensitive conditions discharge rate | 0.004 | 0.004 | 0.006 | 0.004 | 0.009 | 0.005 |
| (3.871) ** | (2.746) * | (5.832) ** | (3.333) ** | (7.322) ** | (4.867) ** | |
| Teen births rate | 0.041 | 0.042 | 0.030 | 0.039 | 0.026 | 0.029 |
| (17.743) ** | (13.496) ** | (13.007) ** | (14.556) ** | (9.843) ** | (11.877) ** | |
| Percent of adults 18–64 without insurance | −0.071 | −0.044 | −0.086 | −0.103 | −0.074 | −0.083 |
| (−11.137) ** | (−5.107) ** | (−12.926) ** | (−14.393) ** | (−9.343) ** | (−11.167) ** | |
| Percent of adults that report BMI ≥ 30 | −0.091 | −0.071 | −0.039 | −0.049 | −0.042 | −0.066 |
| (−7.985) ** | (−4.558) ** | (−4.295) ** | (−5.063) ** | (−4.274) * | (−6.826) ** | |
| Mentally unhealthy days per month | 0.092 | 0.125 | 0.075 | 0.133 | 0.051 | 0.139 |
| (2.505) * | (2.28) * | (2.914) ** | (5.321) ** | (2.09) ** | (5.402) ** | |
| Age-adjusted years of potential life lost rate | 0 | 0.000 | 0.000 | 0.000 | 0.000 | 0.000 |
| (13.171) ** | (9.648) ** | (21.889) ** | (13.398) ** | (19.507) ** | (22.248) ** | |
| Percent of White | −0.024 | −0.019 | −0.042 | −0.051 | −0.054 | −0.048 |
| (−6.914) ** | (−3.98) ** | (−16.492) ** | (−20.026) ** | (−20.41) ** | (−19.113) ** | |
| Percent of Native Americans | −0.058 | −0.027 | −0.116 | −0.139 | −0.136 | −0.122 |
| (−8.285) ** | (−2.837) ** | (−19.505) ** | (−21.984) ** | (−22.855) ** | (−23.033) ** | |
| Percent of Hawaiian or Pacific Islander | −2.274 | −2.265 | −1.929 | −1.831 | −1.943 | −2.008 |
| (−5.37) ** | (−3.715) ** | (−4.361) ** | (−3.93) ** | (−4.109) ** | (−4.957) ** | |
| Percent of Diabetic receiving HbA1c test | 0.008 | 0.021 | −0.018 | 0.024 | ||
| (3.396) ** | (7.894) ** | (−3.294) ** | (−4.156) ** | |||
| Crude motor-vehicle related mortality rate | −0.025 | −0.031 | −0.007 | 0.016 | −0.019 | |
| (−7.981) ** | (−7.01) ** | (−2.356) * | (4.443) ** | (−5.508) ** | ||
| Percent of single-parent households | 0.022 | 0.030 | 0.032 | 0.026 | ||
| (5.042) ** | (6.165) ** | (6.544) ** | (4.154) ** | |||
| Chlamydia (STD) rate | 0.001 | 0.001 | 0.001 | 0.001 | ||
| (4.083) ** | (3.194) ** | (4.681) ** | (5.143) ** | |||
| Percent of multi race | −0.137 | −0.110 | −0.111 | −0.104 | ||
| (−3.695) ** | (−2.66) ** | (−2.794) ** | (−2.763) ** | |||
| Percent of children living in poverty | −0.014 | −0.020 | −0.019 | |||
| (−2.447) * | (−2.427) * | (−3.147) ** | ||||
| Percent of black | 0.053 | 0.067 | ||||
| (11.355) ** | (10.718) ** | |||||
| Physically unhealthy days per month | 0.114 | 0.160 | ||||
| (3.319) ** | (3.097) ** | |||||
| Age-adjusted homicide rate | 0.033 | −0.037 | ||||
| (3.707) ** | (−2.366) * | |||||
| Percent of other race | −0.05 | −0.080 | −0.058 | |||
| (−3.072) ** | (−4.163) ** | (−3.843) ** | ||||
| Percent of Hispanic | 0.016 | 0.020 | 0.024 | |||
| (2.371) * | (2.901) ** | (4.025) ** | ||||
| Freshman graduation rate | 0.004 | |||||
| (2.271) * | ||||||
| Percent ZIP Code with a healthy food outlet | −0.004 | −0.003 | ||||
| (−2.764) ** | (−1.938) * | |||||
| Days with unhealthy Fine particulate matter | −0.024 | |||||
| (−2.012) * | ||||||
| Days with unhealthy ozone | −0.014 | −0.013 | ||||
| (−2.889) ** | (−2.284) * | |||||
| Percent of adult who smoke | 0.012 | |||||
| (2.679) ** | ||||||
| Primary Care Physicians rate | 0.003 | |||||
| (2.802) ** | ||||||
| Violent crimes rate | 0.000 | −0.001 | ||||
| (−2.014) * | (−3.803) ** |

Summary of the Most Influential Predictors Presented in Table 2. The Predictors Explain Low Birthweight Outcomes and Were Consistently Present in the Following Time Points.
- Predictive variables present in all five time points: Ambulatory care sensitive conditions discharge rate, Teen births rate, Percent of adults 18–64 without insurance, Percent of adults that report BMI ≥ 30, Mentally unhealthy days per month, Age-adjusted years of potential life lost rate, Percent of white, Percent of Native Americans, and Percent of Hawaiian or Pacific Islander. Each of this variable was statistically significant at each time point.
- Predictive variables present in four of the time points: Percent of Diabetic receiving HbA1c test and Crude motor-vehicle related mortality rate.
- Predictive variables present in three of the time points: Percent of single-parent households, Chlamydia (STD) rate, and Percent of multi race.
- Predictive variables present in two of the time points: Percent of children living in poverty, Percent of black, Percent of other race, Percent of Hispanic, physically unhealthy days per month, and Age-adjusted homicide rate.
- Predictive variables only present in one time point: Freshman graduation rate, Percent ZIP Code with a healthy food outlet, Days with unhealthy Fine particulate matter, Days with unhealthy ozone, Percent of adult who smoke, Primary Care Physicians rate, and Violent crimes rate.
4. Discussion
5. Conclusions and Implications
Future Directions
Acknowledgments
Author Contributions
Conflicts of Interest
References
- Juarez, P.; Matthews-Juarez, P.; Hood, D.; Im, W.; Levine, R.; Kilbourne, B.; Langston, M.; Al-Hamdan, M.; Crosson, W.; Estes, M.; et al. The Public Health Exposome: A Population-Based, Exposure Science Approach to Health Disparities Research. Int. J. Environ. Res. Public Health 2014, 11, 1112866–1112895. [Google Scholar] [CrossRef] [PubMed]
- Wild, C. Complementing the genome with an “exposome”: The outstanding challenge of environmental exposure measurement in molecular epidemiology. Cancer Epidemiol. Biomark. Prev. 2005, 14, 1847–1850. [Google Scholar] [CrossRef] [PubMed]
- Wild, C. The exposome: From concept to utility. Int. J. Epidemiol. 2012, 41, 24–32. [Google Scholar] [CrossRef] [PubMed]
- Payne-Sturges, D.; Gee, C. National environmental health measures for minority and low-income populations: Tracking social disparities in environmental health. Environ. Res. 2006, 102, 154–171. [Google Scholar] [CrossRef] [PubMed]
- Dehlendorf, C.; Rodriguez, M.; Levy, K.; Borrero, S.; Steinauer, J. Disparities in family planning. Am. J. Obstet. Gynecol. 2010, 202, 214–220. [Google Scholar] [CrossRef] [PubMed]
- Canady, R.; Tiedje, L.; Lauber, C. Preconception care & pregnancy planning: Voices of African American women. MCN Am. J. Matern. Child Nurs. 2008, 33, 90–97. [Google Scholar] [PubMed]
- Harelick, L.; Viola, D.; Tahara, D. Preconception health of low socioeconomic status women: Assessing knowledge and behaviors. Women’s Health Issues 2011, 21, 272–276. [Google Scholar] [CrossRef] [PubMed]
- Coffey, K.; Shorten, A. The challenge of preconception counseling: Using reproductive life planning in primary care. J. Am. Assoc. Nurse Pract. 2014, 26, 255–262. [Google Scholar] [CrossRef] [PubMed]
- Levis, D.; Westbrook, K. A content analysis of preconception health education materials: Characteristics, strategies, and clinical-behavioral components. Am. J. Health Promot. 2013, 27, S36–S42. [Google Scholar] [CrossRef] [PubMed]
- D’Angelo, D.; Williams, L.; Morrow, B.; Cox, S.; Harris, N.; Harrison, L.; Posner, S.F.; Hood, J.R.; Zapata, L. Preconception and interconception health status of women who recently gave birth to a live-born infant: A pregnancy risk assessment monitoring system (PRAMS), United States, 26 reporting areas, 2004. MMWR Surveil. Summ. 2007, 56, 1–35. [Google Scholar]
- Tucker, M.; Berg, C.; Callaghan, W.; Hsia, J. The black-white disparity in pregnancy-related mortality from 5 conditions: Differences in prevalence and case-fatality rates. Am. J. Public Health 2007, 97, 247–251. [Google Scholar] [CrossRef] [PubMed]
- Coeytaux, F.; Bingham, D.; Langer, A. Reducing maternal mortality: A global imperative. Contraception 2011, 83, 95–98. [Google Scholar] [CrossRef] [PubMed]
- King, J. Maternal mortality in the United States-why is it important and what are we doing about it? Semin. Perinatol. 2012, 36, 14–18. [Google Scholar] [CrossRef]
- Edwards, J.; Hanke, J. An update on maternal mortality and morbidity in the United States. Nurs. Women’s Health 2013, 17, 376–388. [Google Scholar] [CrossRef] [PubMed]
- Bryant, A.; Worjoloh, A.; Caughey, A.; Washington, A. Racial/ethnic disparities in obstetric outcomes and care: Prevalence and determinants. Am. J. Obstet. Gynecol. 2010, 202, 335–343. [Google Scholar] [CrossRef] [PubMed]
- National Center for Health Statistics. Health, United States, 2008 with Chartbook; Centers for Disease Control and Prevention, U.S. Department of Health and Human Services: Hyattsville, MD, USA, 2009.
- Callaghan, W.; MacKay, A.; Berg, C. Identification of severe maternal morbidity during delivery hospitalizations, United States, 1991–2003. Am. J. Obstet. Gynecol. 2008, 199, 133–133. [Google Scholar] [CrossRef] [PubMed]
- Creanga, A.; Bateman, B.; Kuklina, E.; Callaghan, W. Racial and ethnic disparities in severe maternal morbidity: A multistate analysis, 2008–2010. Am. J. Obstet. Gynecol. 2014, 210, 435–435. [Google Scholar] [CrossRef] [PubMed]
- Marshall, N.; Guild, C.; Cheng, Y.; Caughey, A.; Halloran, D. Racial disparities in pregnancy outcomes in obese women. J. Matern. Fetal Med. 2013, 27, 122–126. [Google Scholar] [CrossRef] [PubMed]
- English, P.B.; Kharrazi, M.; Davies, S.; Scalf, R.; Waller, L.; Neutra, R. Changes in the spatial pattern of low birth weight in a southern California county: the role of individual and neighborhood level factors. Soc. Sci. Med. 2002, 56, 2073–2088. [Google Scholar]
- Valdez, R.; Athens, M.A.; Thompson, G.H.; Bradshaw, B.S.; Stern, M.P. Birthweights and adult health outcomes in a biethnic population in the USA. Diabetologia 1994, 37, 624–631. [Google Scholar] [CrossRef] [PubMed]
- Curhan, G.C.; Willett, W.C.; Rimm, E.B.; Spiegelman, D.; Ascherio, A.L.; Stampfer, M.J. Birth weight and adult hypertension, diabetes mellitus, and obesity in U.S. men. Circulation 1996, 94, 3246–3250. [Google Scholar] [CrossRef] [PubMed]
- Baker, J.L.; Olsen, L.W.; Sorensen, T.I.A. Weight at birth and all-cause mortality in adulthood. Epidemiology 2008, 19, 197–203. [Google Scholar] [CrossRef] [PubMed]
- Partington, S.N.; Steber, D.L.; Blair, K.A.; Cisler, R.A. Second births to teenage mothers: Risk factors for low birth weight and preterm birth. Perspect. Sex. Reprod. Health 2009, 41, 101–109. [Google Scholar] [CrossRef] [PubMed]
- Pearl, M.; Braveman, P.; Adams, B. The relationship of neighborhood socioeconomic characteristics to birthweight among 5 ethnic groups in California. Am. J. Public Health 2001, 91, 1808–1814. [Google Scholar] [CrossRef] [PubMed]
- Kershenbaum, A.D.; Langston, M.A.; Levine, R.S.; Saxton, A.M.; Oyana, T.J.; Kilbourne, B.J.; Rogers, G.L.; Gittner, L.S.; Baktash, S.H.; Matthews-Juarez, P.; et al. Exploration of preterm birth rates using the public health exposome database and computational analysis methods. Int. J. Environ. Res. Public Health 2014, 11, 12346–12366. [Google Scholar] [CrossRef] [PubMed]
- Morton, C. The problem of increasing maternal morbidity: Integrating normality and risk in maternity care in the United States. Birth 2014, 41, 119–121. [Google Scholar] [CrossRef] [PubMed]
- Bruce, F.; Berg, C.; Hornbrook, M.; Whitlock, E.; Callaghan, W.; Bachman, D.; Gold, R.; Dietz, P. Maternal morbidity rates in a managed care population. Obstet. Gynecol. 2008, 111, 1089–1095. [Google Scholar] [CrossRef] [PubMed]
- Robinson, S.; Basagaña, X.; Agier, L.; de Castro, M.; Hernandez-Ferrer, C.; Gonzalez, J.R.; Grimalt, J.G.; Nieuwenhuijsen, M.; Sunyer, S.; Slama, R.; et al. The pregnancy exposome: Multiple environmental exposures in the INMA-Sabadell birth cohort. Environ. Sci. Technol. 2015, 49, 10632–10641. [Google Scholar] [CrossRef] [PubMed]
- Berkman, L.F. Role of Social-Relations in Health Promotion. Psychosom. Med. 1995, 57, 245–254. [Google Scholar] [CrossRef] [PubMed]
- Rauh, V.A.; Andrews, H.F.; Garfinkel, R.S. The contribution of maternal age to racial disparities in birthweight: A multilevel perspective. Am. J. Public Health 2001, 91, 1815–1824. [Google Scholar] [CrossRef] [PubMed]
- Buka, S.L.; Brennan, R.T.; Rich-Edwards, J.W.; Raudenush, S.W.; Earls, F. Neighborhood support and the birth weight of urban infants. Am. J. Epidemiol. 2003, 157, 1–8. [Google Scholar] [CrossRef] [PubMed]
- Reagan, P.B.; Salsberry, P.J. Race and ethnic differences in determinants of preterm birth in the USA: Broadening the social context. Soc. Sci. Med. 2004, 60, 2217–2228. [Google Scholar] [CrossRef] [PubMed]
- Acevedo-Garcia, D.; Soobader, M.J.; Berkman, L.F. Low birthweight among US Hispanic/Latino subgroups: The effect of maternal foreign-born status and education. Soc. Sci. Med. 2007, 65, 2503–2516. [Google Scholar] [CrossRef] [PubMed]
- Russell, R.B.; Green, N.S.; Steiner, C.A.; Meikle, S.F.; Howse, J.L.; Poschman, K.; Dias, T.; Potetz, L.; Davidoff, M.J.; Damus, K.; et al. Cost of hospitalization for preterm and low birth weight infants in the United States. Pediatrics 2007, 120, e1–e9. [Google Scholar] [CrossRef] [PubMed]
- Kirby, R.S.; Liu, J.; Lawson, A.B.; Choi, J.; Cai, B.; Hossain, M. Spatio-temporal patterning of small area low birth weight incidence and its correlates: A latent spatial structure approach. Spatial Spatio-Temporal Epidemiol. 2011, 2, 265–271. [Google Scholar] [CrossRef] [PubMed]
- Hille, E.T.M.; den Ouden, A.L.; Saigal, S.; Wolke, D.; Lambert, M.; Whitaker, A.; Pinto-Martin, J.A.; Hoult, L.; Meyer, R.; Feldman, J.F. Behavioral problems in children who weigh 1000 g or less at birth in four countries. Lancet 2001, 357, 1641–1643. [Google Scholar] [CrossRef]
- Allen, M.C. Neurodevelopmental outcomes of preterm infants. Curr. Opin. Neurol. 2008, 21, 123–128. [Google Scholar] [CrossRef] [PubMed]
- Bobak, M. Outdoor air pollution, low birthweight, and prematurity. Environ. Health Perspect. 2000, 108, 173–176. [Google Scholar] [CrossRef] [PubMed]
- Chen, L.; Yang, W.; Jennison, B.L.; Goodrich, A.; Omaye, S.T. Air pollution and birth weight in northern Nevada, 1991–1999. Inhal. Toxicol. 2002, 14, 141–157. [Google Scholar] [CrossRef] [PubMed]
- Englert, N. Fine particles and human health—A review of epidemiological studies. Toxicol. Lett. 2003, 149, 235–242. [Google Scholar] [CrossRef] [PubMed]
- Wilhelm, M.; Ritz, B. Local variations in CO and particulate air pollution and adverse birth outcomes in Los Angeles County, California, USA. Environ. Health Perspect. 2005, 113, 1212–1221. [Google Scholar] [CrossRef] [PubMed]
- Porter, T.R.; Kent, S.T.; Su, W.; Beck, H.M.; Gohlke, J.M. Spatiotemporal association between birth outcomes and coke production and steel making facilities in Alabama, USA: A cross sectional study. Environ. Health 2014. [Google Scholar] [CrossRef] [PubMed]
© 2015 by the authors; licensee MDPI, Basel, Switzerland. This article is an open access article distributed under the terms and conditions of the Creative Commons by Attribution (CC-BY) license (http://creativecommons.org/licenses/by/4.0/).
Share and Cite
Oyana, T.J.; Matthews-Juarez, P.; Cormier, S.A.; Xu, X.; Juarez, P.D. Using an External Exposome Framework to Examine Pregnancy-Related Morbidities and Mortalities: Implications for Health Disparities Research. Int. J. Environ. Res. Public Health 2016, 13, 13. https://doi.org/10.3390/ijerph13010013
Oyana TJ, Matthews-Juarez P, Cormier SA, Xu X, Juarez PD. Using an External Exposome Framework to Examine Pregnancy-Related Morbidities and Mortalities: Implications for Health Disparities Research. International Journal of Environmental Research and Public Health. 2016; 13(1):13. https://doi.org/10.3390/ijerph13010013
Chicago/Turabian StyleOyana, Tonny J., Patricia Matthews-Juarez, Stephania A. Cormier, Xiaoran Xu, and Paul D. Juarez. 2016. "Using an External Exposome Framework to Examine Pregnancy-Related Morbidities and Mortalities: Implications for Health Disparities Research" International Journal of Environmental Research and Public Health 13, no. 1: 13. https://doi.org/10.3390/ijerph13010013