3.1. Concentrations of Heavy Metals and a Metalloid in Soils
Table 1 shows the mean (±SD) concentrations of As, Cd, Co, Cr, Cu, Hg, Ni, Pb, and Zn in soil in 19 communities in Tarkwa. From
Table 1, the mean concentrations of eight heavy metals and a metalloid decreased in order of Zn ˃ Cr ˃ Pb ˃ Cu ˃ As ˃ Ni ˃ Co ˃ Hg ˃ Cd. The high variability in concentration was illustrated by the Shapiro-Wilks and Kolmogorov-Smirnov (K-S) tests, showing an abnormal distribution of raw data for all the heavy metals (
Table 1;
p < 0.0001). This variability could be due to the large sampling area of 19 communities. Industrial activities including mining could be associated with heavy metals discharge in some areas and could explain this variability.
The average concentrations of metals in the 19 communities were generally below the corresponding ecological-soil screening levels (ECO-SSL) for plants, soil invertebrates and mammalian wildlife established by the United States Environmental Protection Agency, USEPA [
19,
20] (
Table 1). However, some communities/sample sites showed higher values than the USEPA ECO-SSL [
19,
20] and Kabata-Pendias and Sadurski [
21] recommended levels (
Table 1). For instance, two sites in Badukrom and Wangarakrom had higher Hg concentrations than the Maximum Allowable Concentrations (MAC) of 0.5–5 mg/kg in agricultural soils [
21]. These results indicated a possible influence of artisanal and small-scale gold mining activities in the study area since Hg is used to amalgamate gold from ore. Further, such influence is consistent with the high coefficients of variation (CV) found for most of the measured heavy metals, (CV values ranged from 50% [Cu]–147% [Ni];
Table 1) [
22,
23]. As shown in
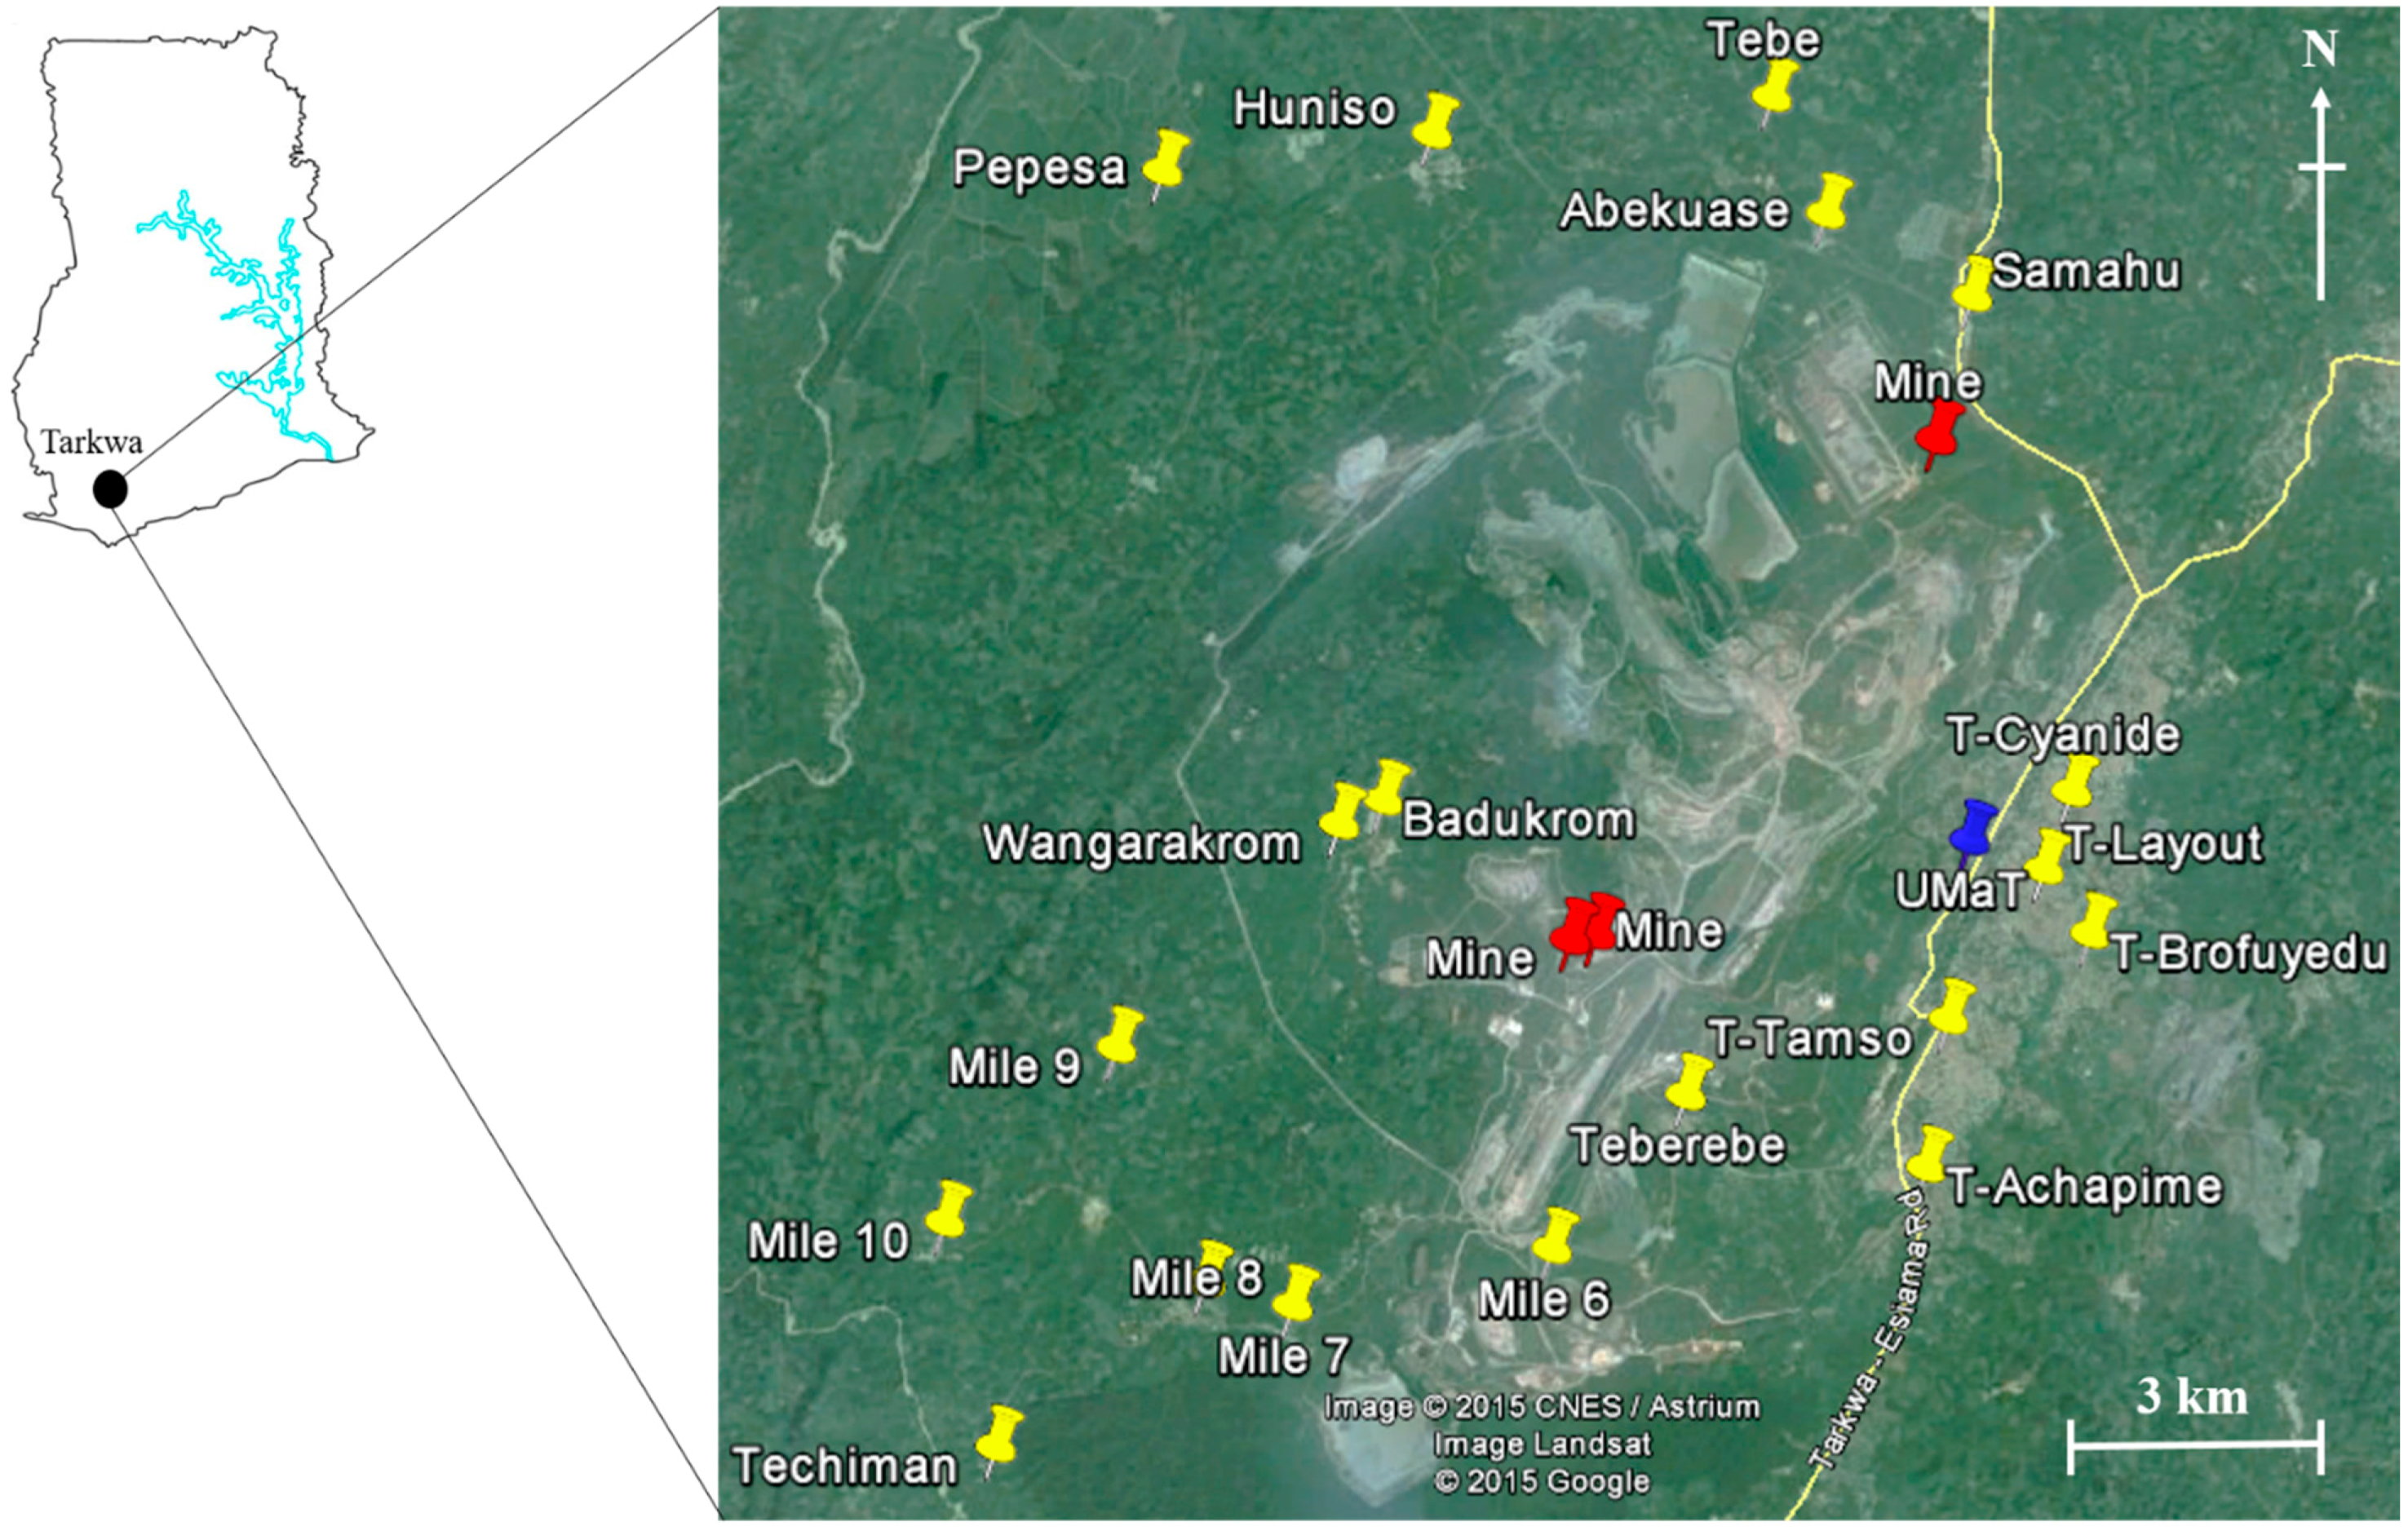
Table 1, the highest mean concentrations of Pb and Hg were in T–Layout and Badukrom, respectively, while highest mean concentrations of As, Cd, Co, Cr, Cu, Ni and Zn were in T–Tamso. The high levels of metals and a metalloid in soil in T-Tamso could be attributed to the proximity of some sample sites to the mines.
Table 1.
WC%, SOM%, soil pH and mean (±SD) concentrations (mg/kg dw)) of heavy metals and a metalloid in soils in Tarkwa.
Table 1.
WC%, SOM%, soil pH and mean (±SD) concentrations (mg/kg dw)) of heavy metals and a metalloid in soils in Tarkwa.
| Sample Sites | n | | WC | SOM | Soil pH | As | Cd | Co | Cr | Cu | Hg | Ni | Pb | Zn |
|---|
| Teberebe | 8 | Mean | 1.1 | 2.5 | 7.6 | 2.6 | 0.038 | 3.0 | 35 | 8.9 | 0.072 | 4.5 | 6.1 | 39 |
| SD | 0.48 | 1.5 | 0.11 | 1.2 | 0.017 | 2.4 | 20 | 6.5 | 0.044 | 2.9 | 1.7 | 17 |
| Mile 6 | 7 | Mean | 0.94 | 2.2 | 7.5 | 2.2 | 0.020 | 2.1 | 30 | 9.3 | 0.018 | 2.6 | 3.2 | 12 |
| SD | 0.65 | 1.9 | 1.1 | 1.2 | 0.010 | 1.1 | 16 | 6.8 | 0.018 | 1.2 | 1.7 | 11 |
| Mile 7 | 8 | Mean | 0.91 | 1.8 | 7.3 | 1.0 | 0.011 | 0.67 | 13 | 2.8 | 0.030 | 1.1 | 1.5 | 9.7 |
| SD | 0.31 | 1.1 | 1.1 | 0.51 | 0.010 | 0.45 | 17 | 1.4 | 0.011 | 0.64 | 0.81 | 3.3 |
| Mile 8 | 7 | Mean | 0.88 | 1.8 | 7.1 | 1.3 | 0.022 | 0.74 | 9.9 | 2.8 | 0.19 | 1.5 | 2.3 | 23 |
| SD | 0.53 | 0.72 | 1.0 | 0.72 | 0.011 | 0.68 | 4.2 | 1.6 | 0.26 | 0.91 | 0.75 | 13 |
| Techiman | 8 | Mean | 0.66 | 1.8 | 6.2 | 1.0 | 0.020 | 1.6 | 11 | 5.5 | 0.17 | 3.1 | 2.7 | 32 |
| SD | 0.78 | 1.0 | 1.2 | 0.44 | 0.021 | 1.7 | 5.0 | 4.0 | 0.14 | 3.0 | 1.6 | 45 |
| Mile 9 | 8 | Mean | 0.50 | 2.1 | 5.8 | 1.8 | 0.011 | 0.80 | 15 | 2.5 | 0.033 | 1.6 | 2.0 | 11 |
| SD | 0.19 | 2.0 | 0.31 | 1.5 | 0.010 | 0.64 | 15 | 1.9 | 0.025 | 1.1 | 1.0 | 7.8 |
| Mile 10 | 8 | Mean | 0.44 | 1.3 | 7.1 | 0.96 | 0.020 | 0.72 | 27 | 2.2 | 0.13 | 1.0 | 2.1 | 29 |
| SD | 0.19 | 0.34 | 0.051 | 0.43 | 0.016 | 0.53 | 34 | 1.0 | 0.090 | 0.21 | 0.23 | 25 |
| Wangarakrom | 8 | Mean | 0.66 | 2.8 | 6.9 | 5.4 | 0.021 | 1.4 | 15 | 3.7 | 1.9 | 3.2 | 2.5 | 19 |
| SD | 0.33 | 1.0 | 0.021 | 6.3 | 0.018 | 1.6 | 5.6 | 2.2 | 1.1 | 3.0 | 0.90 | 11 |
| Badukrom | 8 | Mean | 2.5 | 2.0 | 6.9 | 12 | 0.013 | 0.37 | 9.6 | 5.9 | 2.4 | 1.3 | 2.4 | 27 |
| SD | 3.7 | 1.2 | 0.030 | 10 | 0.010 | 0.12 | 4.9 | 8.2 | 1.7 | 0.57 | 0.98 | 30 |
| Samahu | 7 | Mean | 2.1 | 2.4 | 7.1 | 4.5 | 0.030 | 1.2 | 38 | 5.8 | 0.11 | 2.4 | 8.3 | 36 |
| SD | 2.3 | 1.7 | 0.049 | 4.3 | 0.026 | 0.84 | 39 | 5.0 | 0.12 | 1.8 | 11 | 29 |
| Abekuase | 9 | Mean | 2.1 | 2.5 | 7.0 | 3.2 | 0.024 | 1.2 | 9.2 | 3.8 | 0.050 | 1.8 | 3.8 | 38 |
| SD | 1.1 | 1.1 | 0.084 | 1.0 | 0.023 | 1.2 | 4.8 | 4.2 | 0.021 | 1.2 | 2.7 | 47 |
| Tebe | 9 | Mean | 1.9 | 2.9 | 6.9 | 2.8 | 0.011 | 1.8 | 12 | 5.6 | 0.051 | 2.1 | 4.1 | 18 |
| SD | 1.2 | 1.7 | 0.074 | 1.4 | 0.010 | 3.2 | 9.3 | 5.5 | 0.035 | 1.9 | 2.0 | 18 |
| Huniso | 7 | Mean | 0.99 | 1.5 | 7.2 | 1.5 | 0.052 | 0.76 | 8.0 | 4.1 | 0.13 | 1.3 | 13 | 86 |
| SD | 0.85 | 0.84 | 0.11 | 0.79 | 0.034 | 0.32 | 3.7 | 2.8 | 0.12 | 0.53 | 15 | 69 |
| Pepesa | 10 | Mean | 1.9 | 1.9 | 7.3 | 4.9 | 0.042 | 0.89 | 12 | 6.9 | 0.20 | 1.9 | 5.5 | 78 |
| SD | 0.79 | 0.81 | 0.10 | 8.1 | 0.034 | 0.69 | 4.2 | 7.6 | 0.24 | 1.2 | 3.3 | 73 |
| T-Cyanide | 7 | Mean | 1.2 | 2.4 | 7.5 | 2.7 | 0.081 | 1.4 | 23 | 8.6 | 0.18 | 3.2 | 16 | 49 |
| SD | 0.75 | 0.24 | 0.087 | 1.2 | 0.014 | 0.81 | 16 | 5.0 | 0.036 | 1.3 | 4.6 | 21 |
| T–Layout | 6 | Mean | 1.4 | 1.1 | 7.4 | 2.7 | 0.11 | 1.4 | 16 | 7.1 | 0.11 | 3.0 | 27 | 78 |
| SD | 1.1 | 0.78 | 0.062 | 1.4 | 0.14 | 0.70 | 10 | 7.4 | 0.10 | 1.7 | 37 | 108 |
| T–Brofuyedu | 5 | Mean | 0.95 | 1.9 | 7.3 | 8.6 | 0.058 | 1.3 | 18 | 7.7 | 0.061 | 2.9 | 6.0 | 32 |
| SD | 0.03 | 1.8 | 0.021 | 10 | 0.027 | 1.4 | 14 | 7.2 | 0.034 | 2.7 | 2.2 | 11 |
| T–Achapime | 6 | Mean | 1.5 | 1.9 | 7.2 | 1.4 | 0.046 | 0.66 | 12 | 4.9 | 0.73 | 1.9 | 6.4 | 45 |
| SD | 0.94 | 0.37 | 0.056 | 0.13 | 0.0012 | 0.04 | 0.01 | 0.63 | 0.59 | 0.17 | 0.68 | 1.8 |
| T–Tamso | 6 | Mean | 1.2 | 3.2 | 7.5 | 27 | 0.43 | 9.2 | 77 | 16 | 0.42 | 28 | 14 | 118 |
| SD | 0.42 | 1.3 | 0.23 | 13 | 0.20 | 4.4 | 46 | 9.2 | 0.014 | 14 | 3.8 | 85 |
| Minimum | | | 0.44 | 1.1 | 5.8 | 0.96 | 0.010 | 0.37 | 8.0 | 2.2 | 0.018 | 1.0 | 1.5 | 9.7 |
| Maximum | | | 2.5 | 3.7 | 7.6 | 27 | 0.43 | 9.2 | 77 | 16 | 2.4 | 28 | 27 | 118 |
| Median | | | 1.1 | 2.2 | 7.3 | 2.7 | 0.024 | 1.3 | 15 | 5.8 | 0.11 | 2.5 | 5.5 | 32 |
| Average | | | 1.3 | 2.4 | 7.2 | 4.4 | 0.052 | 1.8 | 21 | 6.2 | 0.32 | 3.7 | 7.2 | 39 |
| SD | | | 0.61 | 0.69 | 0.42 | 5.1 | 0.067 | 1.8 | 15 | 3.1 | 0.36 | 5.5 | 6.2 | 27 |
| CV | | | 47 | 29 | 5.8 | 116 | 111 | 101 | 73 | 50 | 113 | 147 | 85 | 70 |
| Tarkwa (
n = 142) | | | 0.0–11 | 0.0–10 | 4.3–8.8 | 0.3–37 | nd–0.58 | 0.11–14 | 2.0–199 | 0.5–44 | nd–6.7 | 0.3–38 | 0.4–78 | 1.1–232 |
| Skewness | | | 3.4 | 1.3 | –1.6 | 4.1 | 5.6 | 2.4 | 4.00 | 2.3 | 8.0 | 4.1 | 4.3 | 2.6 |
| Kurtosis | | | 16 | 2.4 | 6.8 | 19 | 37 | 6.8 | 19 | 9.3 | 67 | 21 | 21 | 7.8 |
| K–S/Shapiro–Wilk
p | | | ˂0.0001 | ˂0.0001 | ˂0.0001 | ˂0.0001 | ˂0.0001 | ˂0.0001 | ˂0.0001 | ˂0.0001 | ˂0.0001 | ˂0.0001 | ˂0.0001 | ˂0.0001 |
| Reference values # | | | 1.2 | 6.8 | 7.3 | 5.8 | 0.39 | 3.6 | 33.18 | 21 | 0.24 | 6.7 | 52 | 72 |
| USEPA b | | | | | | 18–46 | 0.36–140 | 13–230 | – | 49–80 | 0.5-5 * | 38–280 | 56–120 | 79–160 |
| World range c | | | | | | 1.0–15 | 0.07–1.1 | 0.1–20 | 5–120 | 6.0–60 | | 1–200 | 10.0–70 | 17–125 |
3.2. Correlation between Heavy Metals and Soil Properties
Correlation between heavy metals and selected soil properties was analyzed by Pearson’s correlation matrix (
Table 2). Soil properties play an important role in the mobility and bioavailability of heavy metals, thus influencing their distribution in soils [
12,
25]. This role is generally illustrated by good correlations between heavy metal concentrations and pH, as well as SOM [
26,
27]. However, only weak correlations were found in some studies [
22]. In the present study, significant correlations were observed between As, Cd, Co, Cr, Cu, Ni, Pb and SOM (r = 0.18–0.51,
p < 0.0001–0.05), indicating that SOM has substantial influence on the total contents of these metals in soil. Similar result was reported by Gjoka
et al. [
26]. However, no significant correlations were found between pH and heavy metals, which is similar to the results by Manta
et al. [
22] and Al–Khashman and Shawabkeh [
28].
Lack of significant correlation between soil properties and heavy metals could be attributed to a continuous input [
27,
29] since the release and transport of heavy metals are complex processes [
30]. Another possible explanation could be variations in soil type, fertilizer use, and cultivation system within the sampling area [
27,
30]. No significant correlation was found between Hg and the other metals (
p ˃ 0.05) except for As, indicating a specific source for As and Hg. The sources for Hg could be geochemical and/or anthropogenic [
31], since it is used in the amalgamation of gold [
32]. On the other hand, significant positive relationships (
p < 0.0001) were observed between As and Cd (r = 0.48), Cd and Zn (r = 0.62), Cd and Pb (r = 0.44), Ni and Cr (r = 0.57), and Pb and Zn (r = 0.39). In addition, significantly weak relationships (
p < 0.05 or 0.01) were found between Zn and As (r = 0.23), and Zn and Ni (r = 0.25) (
Table 2). The significantly positive correlations among these elements suggested, to some extent, a common source [
28].
3.3. Sources of Metals in Soil Identified by PCA
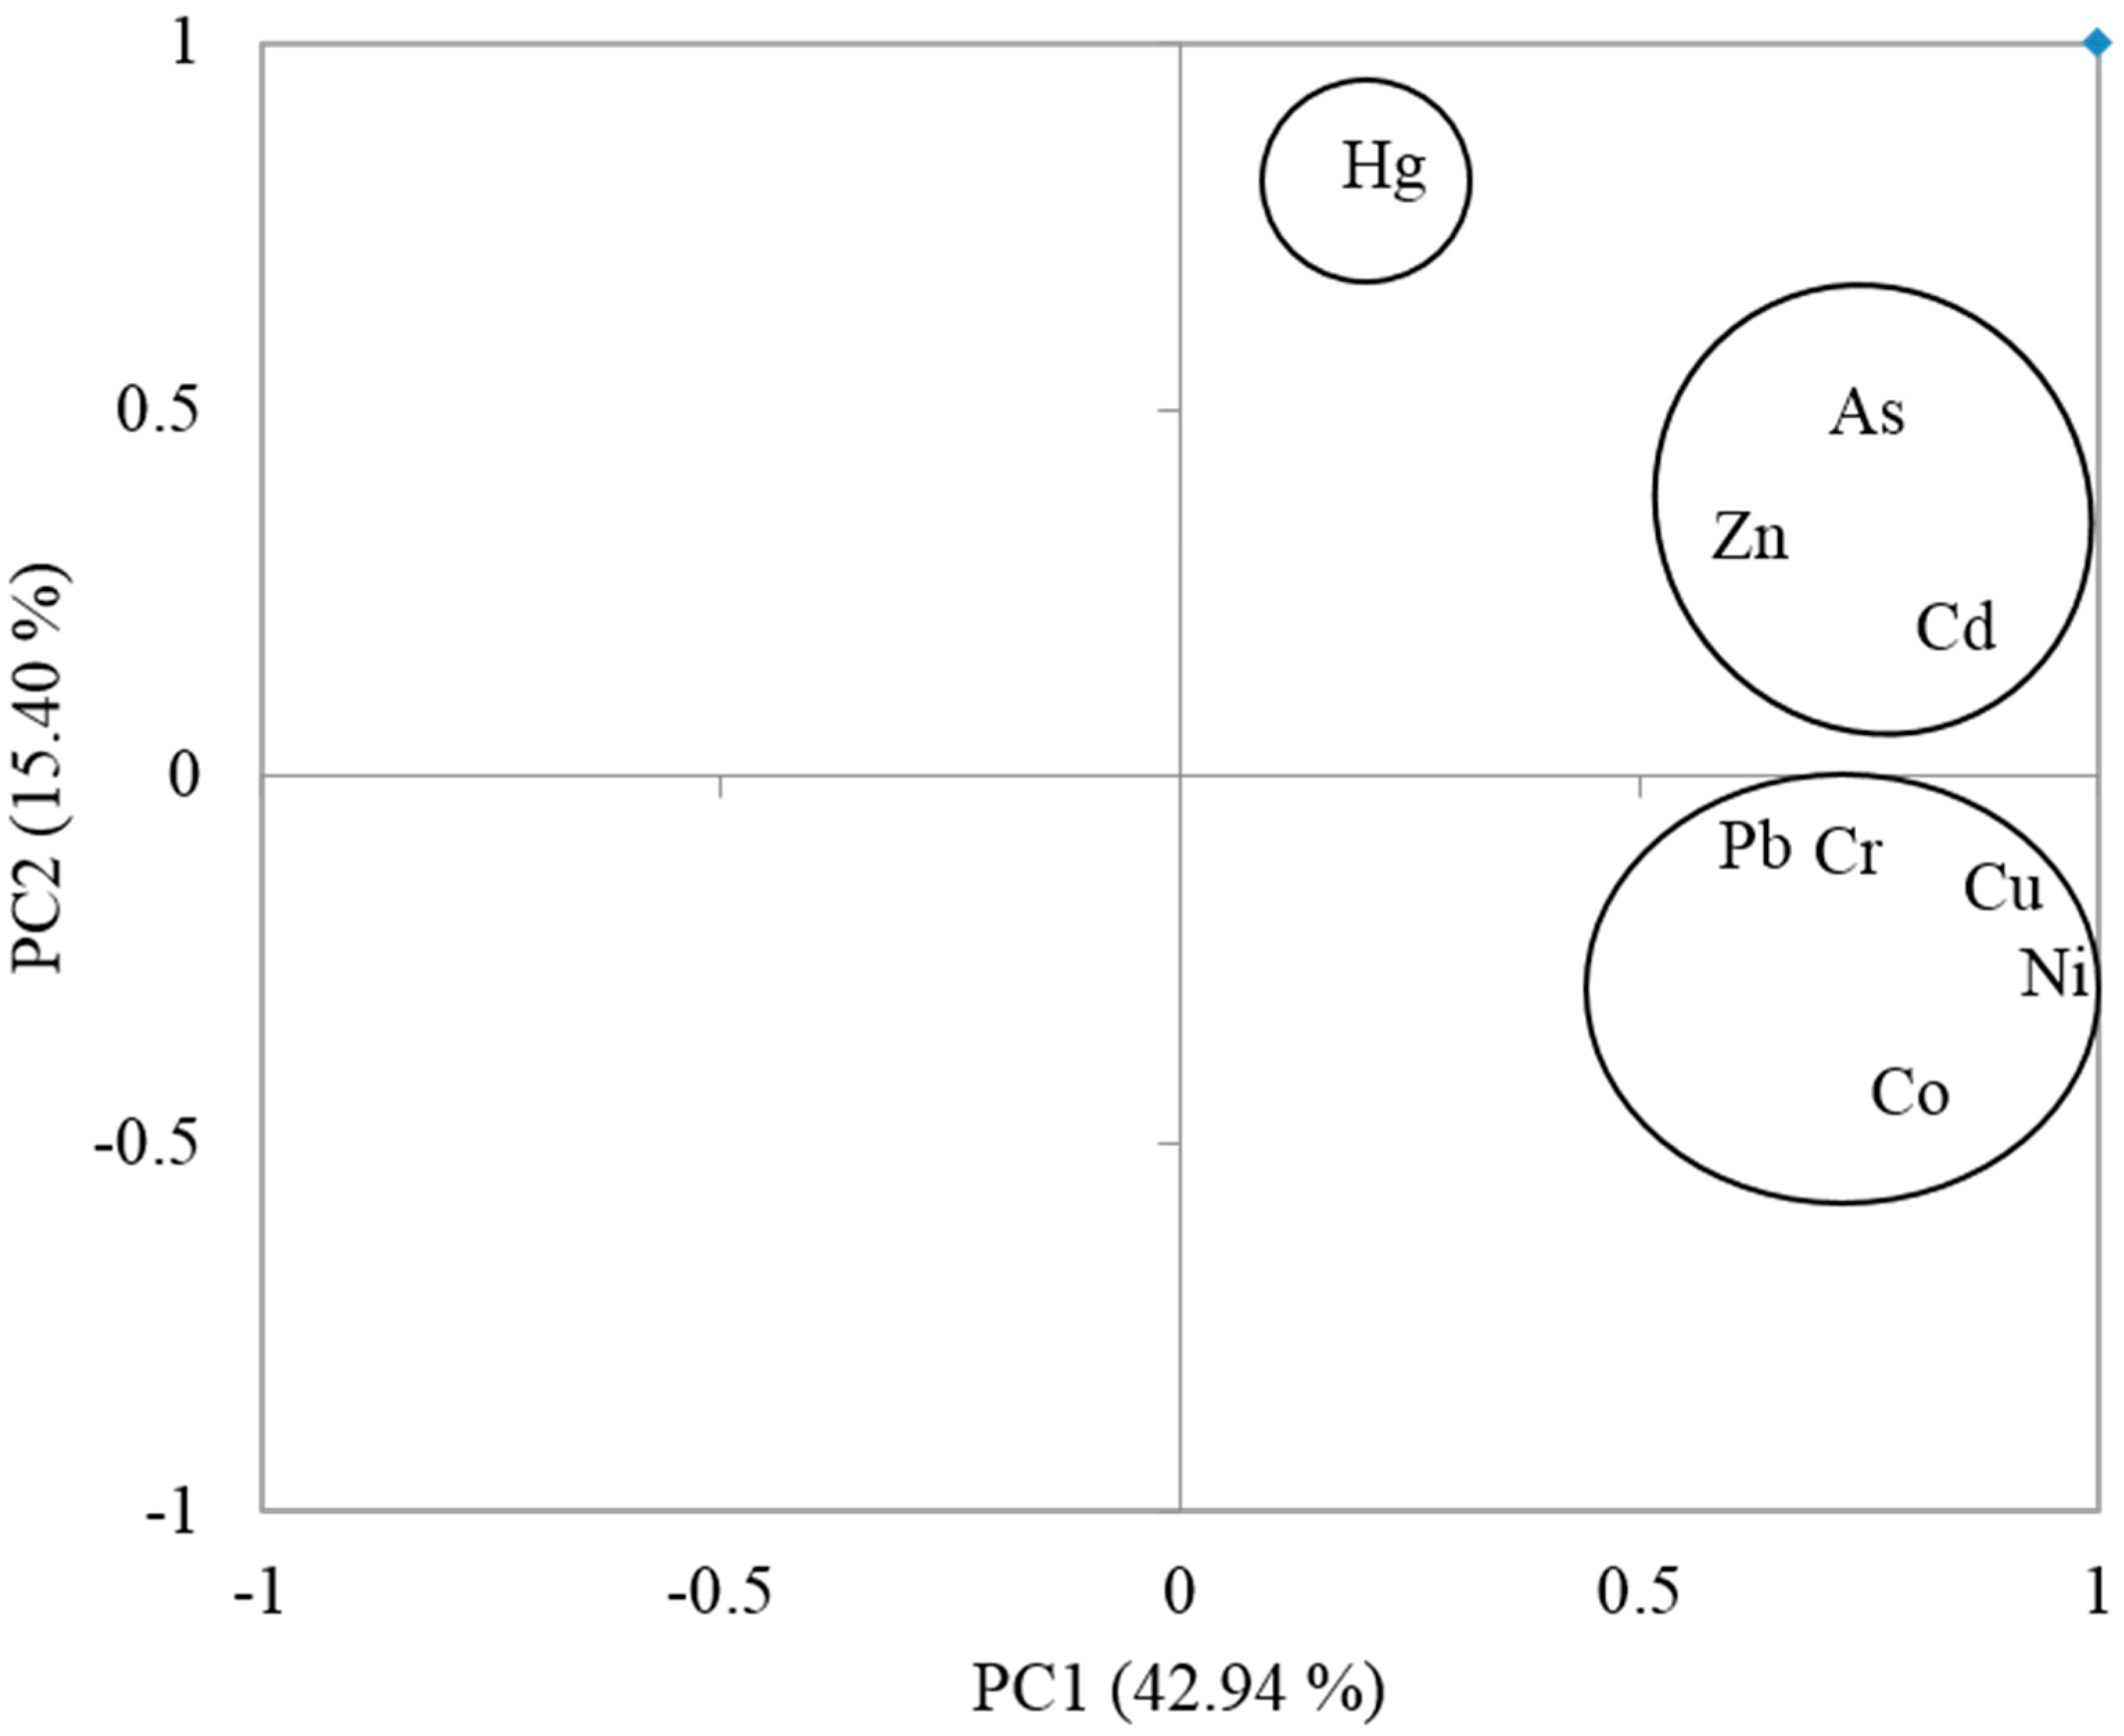
In this study, three principal components (PC1, PC2, and PC3) were extracted (with eigenvalues >1) accounting for 72.8% of the total variances. As shown in
Figure 2, PC1, the most important component, explained 42.9% of the total variance and was characterized by high loadings of Co, Cu, Cr, Ni, and Pb. The input of these metals could mainly result from atmospheric deposition, as a consequence of an increase in industrial activities such as mining and smelting processes [
33,
34,
35]. The concentrations of Cr, Co and Pb in the study area could also be attributed to the weathering of the Tarkwanian rock system. The Tarkwanian rock system contains high concentration of Cr, Co and Pb. Other sources of Cr, Co and Pb in the study area is the occasional discharge of acid industrial wastes or mine drainage which increases Cr, Co and Pb levels in surface soils in the study area [
9].
Table 2.
Pearson’s correlation matrix of heavy metals and soils properties in Tarkwa.
Table 2.
Pearson’s correlation matrix of heavy metals and soils properties in Tarkwa.
| Metals/Soil Properties | WC% | SOM% | Soil pH | As | Cd | Co | Cr | Cu | Hg | Ni | Pb | Zn |
|---|
| WC% | 1 | | | | | | | | | | | |
| SOM% | 0.33 | 1 | | | | | | | | | | |
| soil pH | 0.04 | −0.06 | 1 | | | | | | | | | |
| As | 0.03 | 0.27 ** | −0.01 | 1 | | | | | | | | |
| Cd | −0.02 | 0.18 * | 0.09 | 0.48 *** | 1 | | | | | | | |
| Co | 0.06 | 0.40 *** | 0.11 | 0.27 ** | 0.35 *** | 1 | | | | | | |
| Cr | 0.08 | 0.51 *** | 0.03 | 0.54 *** | 0.27 *** | 0.31 *** | 1 | | | | | |
| Cu | 0.02 | 0.47 *** | 0.11 | 0.37 *** | 0.41 *** | 0.59 *** | 0.50 *** | 1 | | | | |
| Hg | −0.07 | −0.05 | −0.06 | 0.45 *** | 0.06 | −0.09 | −0.03 | 0.08 | 1 | | | |
| Ni | 0.01 | 0.49 *** | 0.06 | 0.50 *** | 0.56 *** | 0.76 *** | 0.57 *** | 0.68 *** | −0.03 | 1 | | |
| Pb | 0.04 | 0.34 *** | 0.05 | 0.09 | 0.44 *** | 0.28 ** | 0.16 * | 0.37 *** | −0.02 | 0.36 *** | 1 | |
| Zn | −0.00 | 0.07 | 0.03 | 0.23 * | 0.62 *** | 0.13 | 0.10 | 0.34 *** | 0.12 | 0.25 *** | 0.39 *** | 1 |
Figure 2.
Distribution pattern of metals in agricultural soils in Tarkwa characterized by PCA.
Figure 2.
Distribution pattern of metals in agricultural soils in Tarkwa characterized by PCA.
PC2 explained 15.4% of the total variances (
Figure 2) and was dominated by high loadings of As, Cd, and Zn. Similar to PC1, PC2 also represents anthropogenic contamination, probably resulting from irrigation with sewage water [
36,
37] and the use, and sometimes abuse, of phosphate fertilizers and organic manures [
23,
29,
38]. Huge amount of phosphate [
39] causes considerable additions of As and Cd. The use of livestock manure adds As and Cd to agricultural soils [
40]. In addition, blasting of the gold bearing rock is the most common method of obtaining the ore. The miners engage in surface and subsurface mining [
41,
42]. The levels of As in the soils could also be due to the nature of the gold bearing ore, which is mineralized pyrites and arsenopyrates. Processing of the ore involves roasting and this results in the production of arsenic trioxide gas which is distributed throughout the study area by air current. As is toxic and due to its non-biodegradable nature, it could accumulate in surface soil and water [
32].
Cd is soft, ductile and is obtained as a by-product from the smelting of Zn ores. It is also found in chalophile as a mineral called greenockite, CdS. Cd in soils from the study area may come from the mining and processing of Zn and chalophilic metals [
9]. The presence of Zn in the environment is associated with mining and smelting, which pollutes the air, water and soil, and ultimately undergoes oxidation to release Zn
2+ ions [
9]. Thus, PC2 could be regarded as representing mainly the contribution of mining and use of fertilizers/manure. This is in agreement with a study by Asante
et al., [
8] which indicated that there could be other sources of As contamination in Tarkwa other than mining activities.
PC3 explained 14.5% of the total variances and was totally dominated by high loading of Hg. The levels of Hg in soils from some sites could be problematic, as concentrations exceeded the maximum values permitted in agricultural soils [
21]. In Ghana, amalgamation using Hg (popularly known as "galamsey"), is the preferred gold recovery method employed by almost all artisanal gold miners because it is a very simple, inexpensive and an easier to use technique [
32]. The high levels of Hg in soils could therefore be due to contamination from the mining processes.
3.4. Assessment of Potential Ecological Risk
The potential ecological risk (RI) is a commonly used indicator to express a comprehensive assessment of the harmful effects of heavy metals and a metalloid in the environment, including soils and sediments. The RI was calculated using the following equations [
43,
44]:
Where
Cif is the pollution coefficient of a metal which can reflect the pollution character of the investigated region but cannot reveal the ecological effects.
Ci is the measured values of heavy metals in surface soils.
Cin is the reference values of the heavy metals in soil/sediments. The concentrations of metals (mg/kg dw) in soil samples collected from UMaT were used as reference (
Table 1). The
Cif of each metal was calculated and classified as either low (
Cif ≤ 1), middle (1 <
Cif ≤ 3) or high (
Cif > 3) [
45].
C
deg represents the integrated pollution level in the environment, and is expressed as the sum of
Cif for all examined metals. The four pollution levels may be distinguished as: C
deg < 5, low pollution; 5 ≤ C
deg < 10, medium pollution; 10 ≤ C
deg < 20, high pollution; and C
deg ≥ 20, very high pollution [
46].
Eir is the monomial potential ecological risk factor of the individual heavy metal and
Tir is the metal toxic factor (based on the standardized heavy metal toxic factor). Referring to Hakanson [
43], we used the following
Tir values: Hg = 40; Cd = 30; As = 10; Cu = Pb = Ni = 5, Cr = 2, and Zn = 1. RI is defined as the sum of
Eir for all heavy metals and has been grouped into four categories by Zhu
et al. [
44] as shown in
Table 3.
Table 3.
Categories of
Ei r and RI [
43,
44].
Table 3.
Categories of Ei r and RI [43,44].
| Ei r | Ecological Risk Level of Single Factor Pollution | RI Value | General Level of Potential Ecological Risk |
|---|
| Ei r ˂ 40 | Low risk | RI ≤ 50 | Low risk |
| 40 ≤ Ei r ˂ 80 | Moderate risk | 50 ˂ RI ≤100 | Moderate risk |
| 80 ≤ Ei r ˂ 160 | Considerable risk | 100 ˂ RI ≤ 200 | Considerable risk |
| Ei r ˂ 320 | High risk | RI ˃ 200 | High risk |
| Ei r ≥ 320 | Very high risk | | |
The
Cif values for the measured heavy metals and metalloid ranged from As (0.16–4.6), Cd (0.026–1.1), Cr (0.24–2.3), Cu (0.11–0.80), Hg (0.080–10), Ni (0.15–4.2), Pb (0.030–0.53) and Zn (0.13–1.6). This suggested a low to high pollution level (
Table 4; [
45]). The range of C
deg was 1.2–17, with an average of 4.5. From
Table 4, average C
deg (4.5) indicated low pollution for most soil samples (75%). However, the C
deg for Wangarakrom (11), Badukrom (13) and T-Tamso (17) indicated high pollution of toxic metals, especially from As and Hg (
Table 4).
Table 4.
Ci f and Cdeg of heavy metals and a metalloid in surface soils in Tarkwa.
Table 4.
Ci f and Cdeg of heavy metals and a metalloid in surface soils in Tarkwa.
| Sample Sites | As | Cd | Cr | Cu | Hg | Ni | Pb | Zn | Cdeg |
|---|
| Teberebe | 0.46 | 0.10 | 1.0 | 0.42 | 0.30 | 0.67 | 0.12 | 0.54 | 3.6 |
| Mile 6 | 0.39 | 0.044 | 0.91 | 0.44 | 0.08 | 0.40 | 0.063 | 0.18 | 2.5 |
| Mile 7 | 0.18 | 0.030 | 0.42 | 0.13 | 0.11 | 0.16 | 0.030 | 0.13 | 1.2 |
| Mile 8 | 0.22 | 0.060 | 0.30 | 0.13 | 0.78 | 0.23 | 0.044 | 0.33 | 2.0 |
| Techiman | 0.18 | 0.052 | 0.34 | 0.26 | 0.70 | 0.46 | 0.053 | 0.45 | 2.4 |
| Mile 9 | 0.32 | 0.030 | 0.46 | 0.12 | 0.14 | 0.24 | 0.040 | 0.16 | 1.5 |
| Mile 10 | 0.16 | 0.051 | 0.84 | 0.11 | 0.55 | 0.15 | 0.041 | 0.40 | 2.3 |
| Wangarakrom | 0.93 | 0.055 | 0.47 | 0.17 | 8.1 | 0.48 | 0.051 | 0.26 | 11 |
| Badukrom | 2.2 | 0.041 | 0.29 | 0.28 | 10 | 0.20 | 0.050 | 0.38 | 13 |
| Samahu | 0.79 | 0.064 | 1.1 | 0.28 | 0.44 | 0.36 | 0.16 | 0.50 | 3.7 |
| Abekuase | 0.55 | 0.062 | 0.28 | 0.18 | 0.19 | 0.27 | 0.074 | 0.53 | 2.1 |
| Tebe | 0.49 | 0.026 | 0.38 | 0.27 | 0.19 | 0.32 | 0.080 | 0.25 | 2.0 |
| Huniso | 0.26 | 0.13 | 0.24 | 0.20 | 0.56 | 0.20 | 0.26 | 1.2 | 3.0 |
| Pepesa | 0.84 | 0.11 | 0.37 | 0.33 | 0.84 | 0.28 | 0.11 | 1.0 | 3.9 |
| T–Cyanide | 0.47 | 0.21 | 0.72 | 0.41 | 0.73 | 0.47 | 0.31 | 0.69 | 4.0 |
| T–Layout | 0.47 | 0.28 | 0.49 | 0.34 | 0.48 | 0.46 | 0.53 | 1.08 | 4.1 |
| T–Brofuyedu | 1.4 | 0.15 | 0.56 | 0.36 | 0.25 | 0.43 | 0.12 | 0.45 | 3.8 |
| T–Achapime | 0.25 | 0.12 | 0.36 | 0.23 | 3.0 | 0.28 | 0.12 | 0.62 | 5.0 |
| T–Tamso | 4.6 | 1.1 | 2.3 | 0.80 | 1.7 | 4.2 | 0.27 | 1.6 | 17 |
| Minimum | 0.16 | 0.026 | 0.24 | 0.11 | 0.080 | 0.15 | 0.030 | 0.13 | 1.2 |
| Maximum | 4.6 | 1.1 | 2.3 | 0.80 | 10 | 4.2 | 0.53 | 1.6 | 17 |
| Average | 0.79 | 0.14 | 0.63 | 0.29 | 1.4 | 0.53 | 0.14 | 0.57 | 4.5 |
Hakanson [
43] and Zhu
et al. [
44] defined five categories of
Eir (
Table 3) and four categories of RI. As shown in
Table 5, the maximum
Eir values for As (46) and Hg (400) were higher than those of the other metals. This result suggested a moderate to very high risk of As (T–Tamso) and Hg (Badukrom), respectively, to the ecological system especially plants, soil invertebrates and/or mammalian wildlife. Similarly the
Eir of Hg from T–Achapime (120) and Wangarakrom (324) indicated considerable to high ecological risk (
Table 3 and
Table 5). The
Eir difference between As/Hg and the other metals resulted from their high toxic factors,
Tir [
31] and high concentration at some sites possibly due to their proximity to the mines (
Figure 1) or illegal mining activities. In fact, the CV of Hg from the sampling communities was 113% (
Table 1), indicating high Hg concentrations in some communities.
Table 5.
Ei r and RI of heavy metals and a metalloid in surface soils in Tarkwa.
Table 5.
Ei r and RI of heavy metals and a metalloid in surface soils in Tarkwa.
| Sample Sites | As | Cd | Cr | Cu | Hg | Ni | Pb | Zn | RI |
|---|
| Teberebe | 4.5 | 2.9 | 2.1 | 2.1 | 11 | 3.3 | 0.59 | 0.54 | 28 |
| Mile 6 | 3.8 | 1.3 | 1.8 | 2.2 | 3.1 | 1.9 | 0.31 | 0.18 | 14 |
| Mile 7 | 1.8 | 0.90 | 0.84 | 0.67 | 4.5 | 0.81 | 0.15 | 0.13 | 9.9 |
| Mile 8 | 2.2 | 1.6 | 0.60 | 0.67 | 31 | 1.1 | 0.22 | 0.33 | 37 |
| Techiman | 1.7 | 1.5 | 0.68 | 1.3 | 28 | 2.3 | 0.27 | 0.45 | 36 |
| Mile 9 | 3.2 | 0.89 | 0.92 | 0.59 | 5.5 | 1.2 | 0.20 | 0.16 | 12 |
| Mile 10 | 1.6 | 1.5 | 1.6 | 0.53 | 21 | 0.75 | 0.21 | 0.40 | 28 |
| Wangarakrom | 9.3 | 1.6 | 0.94 | 0.87 | 324 | 2.4 | 0.25 | 0.26 | 339 |
| Badukrom | 22 | 1.0 | 0.58 | 1.4 | 400 | 1.0 | 0.24 | 0.38 | 427 |
| Samahu | 7.8 | 1.9 | 2.3 | 1.3 | 17 | 1.8 | 0.80 | 0.50 | 34 |
| Abekuase | 5.4 | 1.8 | 0.56 | 0.92 | 7.5 | 1.3 | 0.37 | 0.53 | 18 |
| Tebe | 4.9 | 0.79 | 0.77 | 1.3 | 7.6 | 1.6 | 0.39 | 0.25 | 17 |
| Huniso | 2.5 | 3.9 | 0.49 | 0.99 | 22 | 0.98 | 1.3 | 1.2 | 33 |
| Pepesa | 8.4 | 3.1 | 0.73 | 1.6 | 33 | 1.4 | 0.53 | 1.0 | 51 |
| T–Cyanide | 4.7 | 6.1 | 1.4 | 2.0 | 29 | 2.3 | 1.5 | 0.69 | 48 |
| T–Layout | 4.7 | 8.3 | 0.98 | 1.7 | 19 | 2.2 | 2.6 | 1.0 | 40 |
| T–Brofuyedu | 14 | 4.4 | 1.1 | 1.8 | 10 | 2.1 | 0.58 | 0.45 | 35 |
| T–Achapime | 2.5 | 3.5 | 0.73 | 1.1 | 120 | 1.4 | 0.62 | 0.62 | 131 |
| T–Tamso | 46 | 33 | 4.7 | 4.0 | 69 | 21 | 1.3 | 1.6 | 182 |
| Minimum | 1.6 | 0.79 | 0.49 | 0.53 | 3.1 | 0.75 | 0.15 | 0.13 | 9.9 |
| Maximum | 46 | 33 | 4.7 | 4.0 | 400 | 21 | 2.6 | 1.6 | 427 |
| Average | 7.8 | 4.2 | 1.2 | 1.4 | 61 | 2.6 | 0.66 | 0.57 | 80 |
| Median | 4.7 | 1.9 | 0.92 | 1.3 | 21 | 1.8 | 0.39 | 0.50 | 35 |
The RI (range, 9.93–427; mean, 80.4) suggested a low to high risk of heavy metals in the ecological system (plants, soil invertebrates and/or mammalian wildlife) in Mile 7 and Badukrom, respectively. Referring to the classification suggested by Zhu
et al. [
44] (
Table 3), soil samples in 10% of the communities could be classified as causing high potential ecological risk to plants, soil invertebrates and/or mammalian wildlife, and another 10% causing considerable potential ecological risk. However soil samples in 5% of the communities could be classified as causing moderate potential ecological risk, while 75% could be classified as causing low potential ecological risk (
Table 3 and
Table 5). As and Hg, on average, made up 10 and 75% of the RI values, respectively. Overall, the RI of heavy metals in agricultural soils in Tarkwa represented moderate ecological risk. The concentrations of As, Cu, Ni and Pb from the sample sites negatively correlated (
p ˂ 0.05) with the average distance (km) from the mines (
Table 6). The results further suggested that mining activities have played significant roles in the levels, distribution and risk of metals within the study area, especially, the communities closer to the mines.
Table 6.
Pearson’s correlation matrix of heavy metal concentrations and average distance from the mines.
Table 6.
Pearson’s correlation matrix of heavy metal concentrations and average distance from the mines.
| Metals/Average Distance | Average Distance |
|---|
| average distance | 1.0 |
| As | −0.65 ** |
| Cd | −0.38 |
| Co | −0.26 |
| Cr | −0.36 |
| Cu | −0.57 ** |
| Hg | −0.19 |
| Ni | −0.49 * |
| Pb | −0.53 * |
| Zn | −0.28 |


