
Association of PNC, BC, and PM2.5 Measured at a Central Monitoring Site with Blood Pressure in a Predominantly Near Highway Population

 ,
, 

Abstract
:1. Introduction
2. Materials and Methods
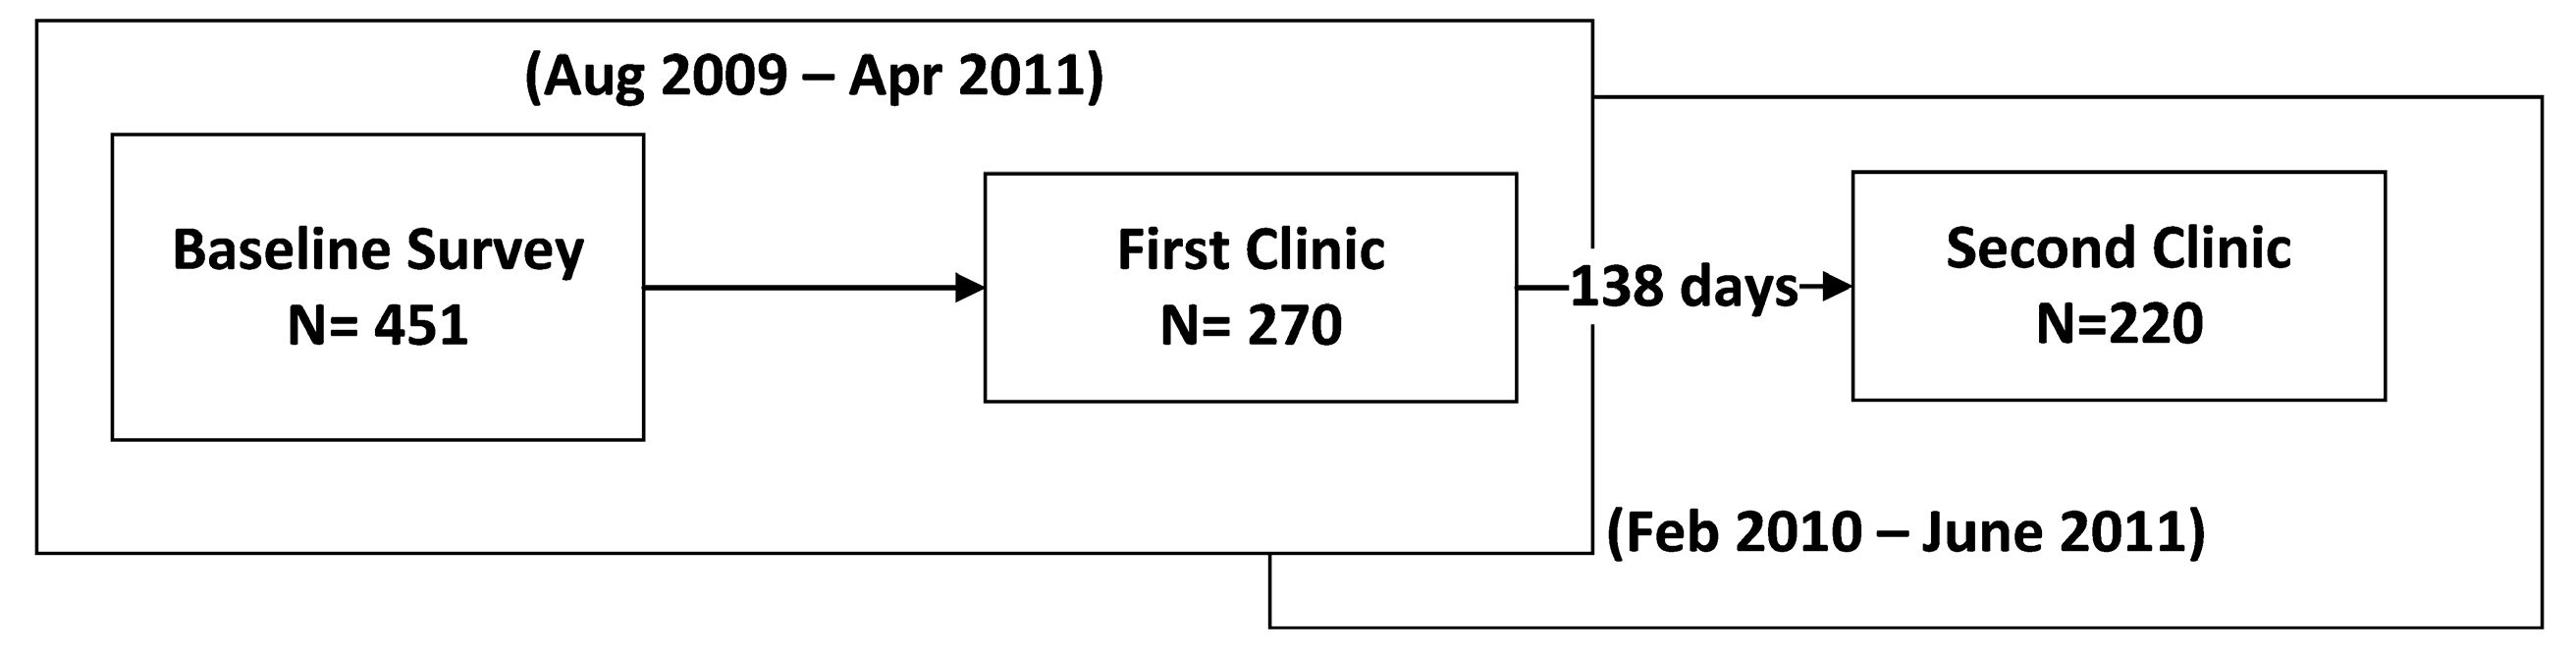
2.1. Study Design and Recruitment
2.2. Human Data
2.3. Air Pollution and Temperature Data
2.4. Statistical Methods
2.5. Dependent, Independent Variables, and Covariates
3. Results

| Demographic Characteristics | 1st Clinic Visit (n = 270) | 2nd Clinic Visit (n = 220) |
|---|---|---|
| Age (year) | 58.0 (11.7) | 58.5 (11.5) |
| Female | 164 (61%) | 135 (62%) |
| Race | ||
| White | 179 (66%) | 149 (68%) |
| Asian | 31 (11%) | 25 (11%) |
| Black | 16 (6%) | 10 (5%) |
| Other | 44 (16%) | 36 (16%) |
| Education | ||
| Less than high school | 57 (21%) | 40 (18%) |
| High school | 83 (31%) | 66 (30%) |
| Undergraduate | 79 (29%) | 69 (31%) |
| Graduate | 51 (19%) | 45 (20%) |
| Income | ||
| Less than $24,999 | 30 (11%) | 23 (10%) |
| $25,000–$74,999 | 99 (37%) | 78 (35%) |
| $75,000 or more | 87 (32%) | 71 (32%) |
| Don’t know/ refused | 54 (20%) | 48 (22%) |
| Random sample | 176 (65%) | 140 (64%) |
| Highway Proximity | ||
| <400 m | 216 (80%) | 175 (81%) |
| >1000 m | 53 (20%) | 40 (19%) |
| Smoking Status | ||
| Never smoked | 97 (37%) | 84 (40%) |
| Used to smoke | 102 (39%) | 79 (37%) |
| Current smoking | 63 (24%) | 46 (22%) |
| Body Mass Index (kg/m2) | 29.8 (7.3) | 29.6 (6.6) |
| Obese | 97 (36%) | 80 (36%) |
| Hypertension | 97 (36%) | 82 (37%) |
| Blood Pressure | Visit 1 | Visit 1 * | Visit 2 | |
|---|---|---|---|---|
| n = 270 | n = 220 | n = 220 | ||
| Systolic | Mean (SD) or n (%) | |||
| Average (mmHg) | 135.8 (19) | 135.8 (19) | 131.1 (19) | |
| Left arm (mmHg) | 132.8 (19) | 132.5 (18) | 129.0 (20) | |
| Right arm (mmHg) | 138.6 (21) | 138.9 (21) | 132.9 (20) | |
| Arm diff > 10 mmHg * | 105 (39%) | 92 (42%) | 79 (37%) | |
| Diastolic | ||||
| Average (mmHg) | 78.3 (11) | 78.0 (10) | 75.3 (11) | |
| Left arm (mmHg) | 77.9 (11) | 77.4 (11) | 75.0 (12) | |
| Right arm (mmHg) | 78.7 (12) | 78.5 (11) | 75.5 (13) | |
| Arm diff > 10 mmHg ** | 38 (14%) | 31 (14%) | 43 (20%) | |
| Air Pollutant | Visit 1 | Visit 2 | ||||||
|---|---|---|---|---|---|---|---|---|
| n | Mean (SD) | min | max | n | Mean (SD) | min | max | |
| PNC (number/cm3) * | 209 | 17,000 (5800) | 4700 | 29,000 | 126 * | 8300 (5100) | 3900 | 27,000 |
| PM2.5 (µg/m3) | 270 | 7.30 (4.3) | 0.78 | 20.4 | 222 | 7.80 (3.7) | 2.38 | 20.9 |
| BC (µg/m3) | 261 | 0.68 (0.4) | 0.25 | 1.62 | 203 | 0.62 (0.3) | 0.18 | 1.59 |
3.1. PNC Model
| Dependent variable: SBP, DBP, or PPPNC Model | SBP | DBP | PP | ||||||
|---|---|---|---|---|---|---|---|---|---|
| R | Robust SE | P | R | Robust SE | P | R | Robust SE | P | |
| Predictor: 24 h PNC (10,000 particles/cm3) † | 2.19 | 1.82 | 0.23 | 2.40 | 1.11 | 0.03 * | −0.16 | 1.34 | 0.91 |
| Quad-center transformed measure—24 h avg temp (°C) | −0.01 | 0.01 | 0.43 | −0.01 | 0.01 | 0.24 | −0.001 | 0.01 | 0.88 |
| Random vs. Convenience Sample | 2.77 | 3.18 | 0.38 | −0.04 | 1.96 | 0.98 | 2.89 | 2.17 | 0.18 |
| Highway proximity (≤400 vs. ≥1000 m) | −1.49 | 2.65 | 0.57 | 0.98 | 1.86 | 0.60 | −2.42 | 2.14 | 0.26 |
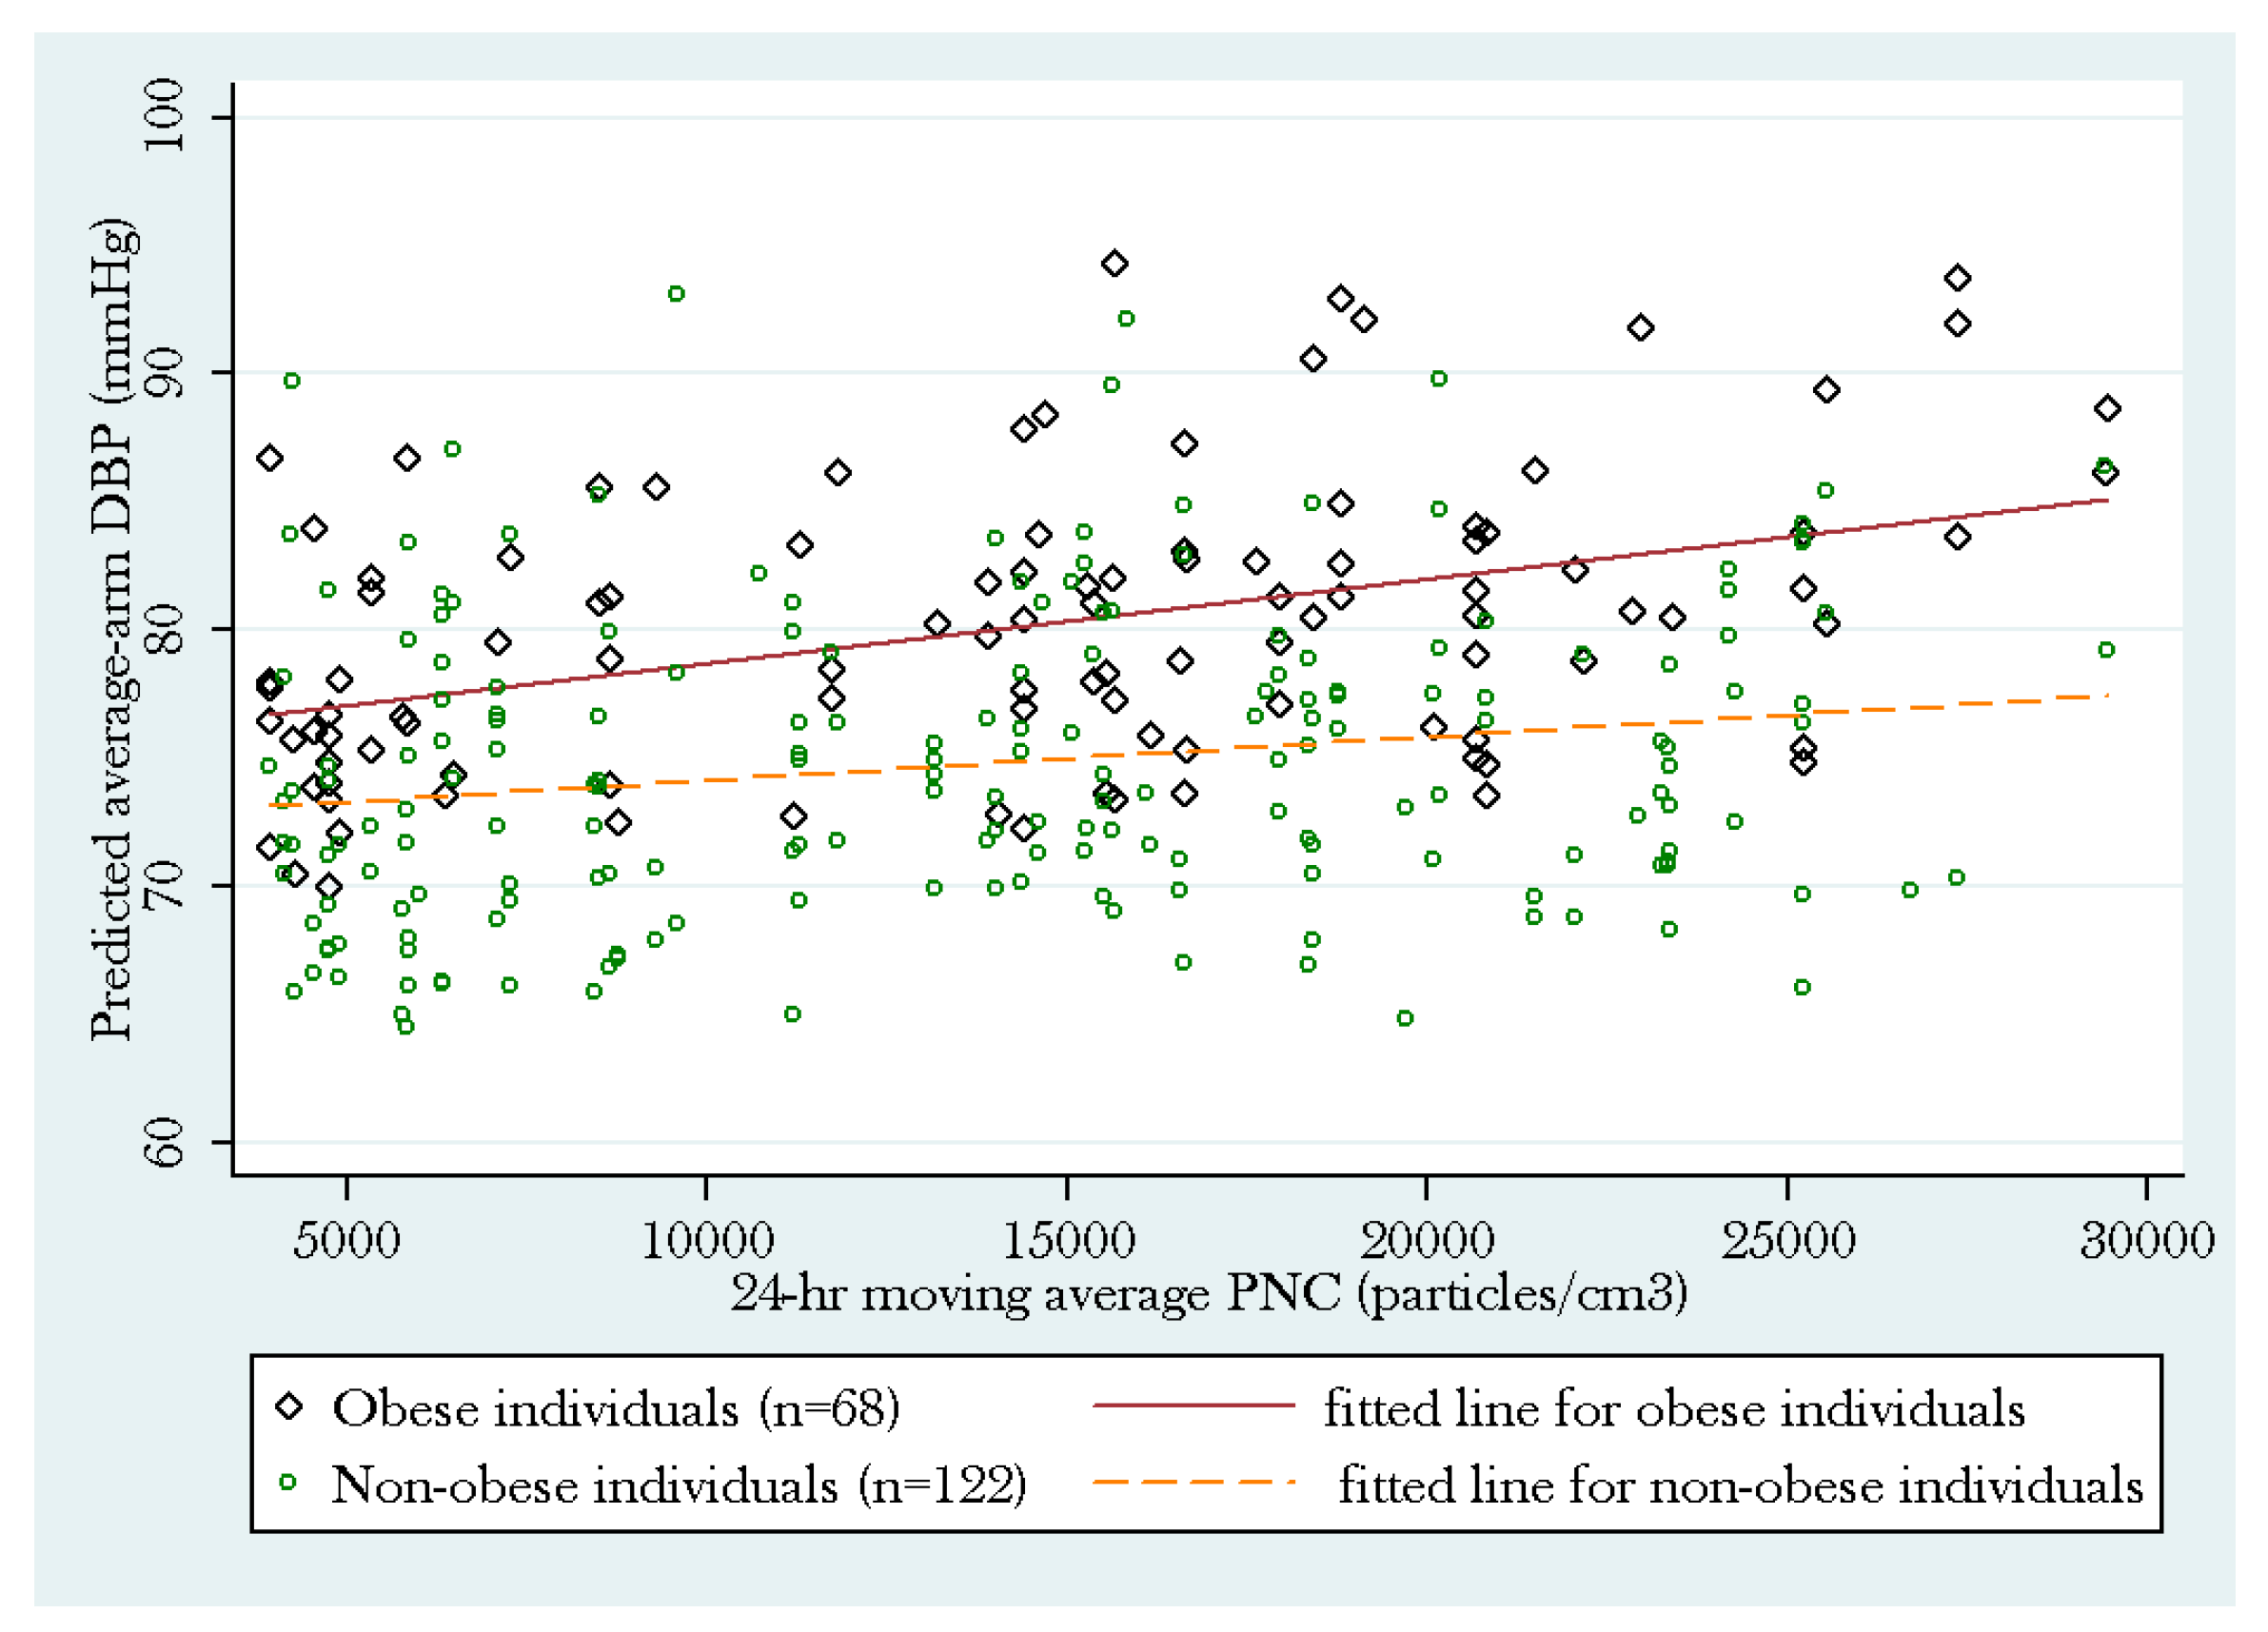
| Obesity status (obese vs. non-obese) | 7.07 | 2.43 | 0.00 ** | 5.91 | 1.63 | 0.00 ** | 1.32 | 1.84 | 0.47 |
| Hypertension medication use (yes vs. no) | −1.94 | 2.78 | 0.48 | −1.59 | 1.76 | 0.37 | −0.56 | 2.09 | 0.79 |
| Age (year) | 0.86 | 0.11 | 0.00 ** | 0.03 | 0.07 | 0.69 | 0.83 | 0.09 | 0.00 ** |
| Gender (female vs. male) | −3.57 | 2.46 | 0.15 | −2.46 | 1.55 | 0.11 | −1.22 | 1.74 | 0.49 |
| Race (White) | |||||||||
| Asian | 14.99 | 4.82 | 0.00 ** | 9.78 | 2.64 | 0.00 ** | 5.25 | 3.67 | 0.15 |
| Black | 9.06 | 6.49 | 0.16 | 5.17 | 3.82 | 0.18 | 3.68 | 3.29 | 0.26 |
| Other | 4.17 | 3.08 | 0.18 | 2.11 | 2.36 | 0.37 | 2.12 | 2.00 | 0.29 |
| Smoking status (Never smoked) | |||||||||
| Used to smoke | 1.41 | 2.48 | 0.57 | 1.27 | 1.75 | 0.47 | 0.21 | 1.84 | 0.91 |
| Current smoker | −0.04 | 3.21 | 0.99 | 2.41 | 2.05 | 0.24 | −2.45 | 2.36 | 0.30 |
| Education (<high school) | |||||||||
| High school | −3.44 | 3.58 | 0.34 | −4.81 | 2.50 | 0.05 | 1.35 | 2.58 | 0.60 |
| Undergraduate | −4.99 | 3.64 | 0.17 | −2.22 | 2.37 | 0.35 | −2.69 | 2.64 | 0.31 |
| Graduate | −10.06 | 3.83 | 0.01 * | −5.79 | 2.61 | 0.03 | −4.24 | 2.63 | 0.11 |
| Clinic Dates | |||||||||
| Seasonal Variation 1 | −1.00 | 1.29 | 0.44 | −0.32 | 0.67 | 0.63 | −0.75 | 0.99 | 0.45 |
| Seasonal Variation 2 | 1.93 | 1.26 | 0.13 | −0.68 | 0.85 | 0.43 | 2.45 | 1.00 | 0.01 * |
| Weekdays vs. Weekend | −0.04 | 1.83 | 0.98 | 0.01 | 1.06 | 0.99 | −0.18 | 1.42 | 0.90 |
| Clinic Date (1 day) | −0.02 | 0.01 | 0.00 ** | 0.005 | 0.004 | 0.30 | −0.02 | 0.01 | 0.00 ** |
3.2. Sensitivity Analyses
4. Discussion
| Dependent variable: SBP, DBP, or PPPM2.5 Model | SBP | DBP | PP | ||||||
|---|---|---|---|---|---|---|---|---|---|
| R | Robust SE | P | R | Robust SE | P | R | Robust SE | P | |
| Predictor: 24 h PM2.5 (µg/m3) | −0.21 | 0.16 | 0.20 | −0.14 | 0.11 | 0.21 | −0.06 | 0.11 | 0.58 |
| Quad-center transformed measure—24 h avg temp (°C) | −0.02 | 0.01 | 0.02 * | −0.01 | 0.01 | 0.08 | −0.01 | 0.01 | 0.09 |
| Random vs. Convenience Sample | 4.43 | 2.39 | 0.06 | 0.02 | 1.45 | 0.99 | 4.50 | 1.82 | 0.01* |
| Highway proximity (≤400 vs. ≥1000 m) | −1.01 | 2.48 | 0.69 | 0.55 | 1.54 | 0.72 | −1.58 | 2.30 | 0.49 |
| Obesity status (obese vs. non-obese) | 9.33 | 2.09 | 0.00 ** | 6.81 | 1.37 | 0.00 ** | 2.58 | 1.59 | 0.11 |
| Hypertension medication use (yes vs. no) | −0.98 | 2.50 | 0.70 | −1.61 | 1.50 | 0.28 | 0.62 | 1.85 | 0.74 |
| Age (year) | 0.73 | 0.10 | 0.00 ** | −0.01 | 0.06 | 0.87 | 0.74 | 0.09 | 0.00 ** |
| Gender (female vs. male) | −4.02 | 2.07 | 0.05 | −1.98 | 1.23 | 0.11 | −2.06 | 1.56 | 0.19 |
| Race (White) | |||||||||
| Asian | 11.16 | 4.31 | 0.01 * | 8.56 | 2.35 | 0.00 ** | 2.70 | 3.39 | 0.43 |
| Black | 2.86 | 4.69 | 0.54 | 4.79 | 2.35 | 0.04 * | −2.00 | 3.27 | 0.54 |
| Other | 0.54 | 3.10 | 0.86 | 1.29 | 2.07 | 0.53 | −0.79 | 2.26 | 0.73 |
| Smoking status (Never smoked) | |||||||||
| Used to smoke | −2.20 | 2.28 | 0.34 | −0.90 | 1.47 | 0.54 | −1.33 | 1.74 | 0.45 |
| Current smoker | −2.93 | 2.67 | 0.27 | −0.86 | 1.61 | 0.59 | −2.12 | 2.05 | 0.30 |
| Education (<high school) | |||||||||
| High school | −3.01 | 3.21 | 0.35 | −2.53 | 2.10 | 0.23 | −0.53 | 2.40 | 0.83 |
| Undergraduate | −5.09 | 3.28 | 0.12 | −2.79 | 1.94 | 0.15 | −2.38 | 2.49 | 0.34 |
| Graduate | −9.28 | 3.48 | 0.01 * | −4.65 | 2.27 | 0.04 * | −4.74 | 2.50 | 0.06 |
| Clinic Dates | |||||||||
| Seasonal Variation 1 | 0.14 | 0.95 | 0.89 | 0.89 | 0.51 | 0.08 | −0.75 | 0.74 | 0.31 |
| Seasonal Variation 2 | 1.79 | 0.93 | 0.05 | 0.45 | 0.62 | 0.47 | 1.27 | 0.68 | 0.06 |
| Week day vs. Weekend | −1.32 | 1.58 | 0.40 | −0.56 | 0.91 | 0.54 | −0.96 | 1.24 | 0.44 |
| Clinic Date (1 day) | −0.02 | 0.01 | 0.00 ** | −0.01 | 0.00 | 0.12 | −0.01 | 0.00 | 0.01 * |
| Dependent variable: SBP, DBP, or PPBC Model | SBP | DBP | PP | ||||||
|---|---|---|---|---|---|---|---|---|---|
| R | Robust SE | P | R | Robust SE | P | R | Robust SE | P | |
| Predictor: 24 h BC (µg/m3)) | −1.33 | 2.43 | 0.58 | −1.26 | 1.69 | 0.46 | −0.03 | 1.76 | 0.99 |
| Quad-center transformed measure—24 h avg temp (°C) | −0.02 | 0.01 | 0.01 * | −0.01 | 0.01 | 0.04 * | −0.01 | 0.01 | 0.06 |
| Random vs. Convenience Sample | 4.39 | 2.40 | 0.07 | 0.01 | 1.45 | 1.00 | 4.47 | 1.82 | 0.01 * |
| Highway proximity (≤400 vs. ≥1000 m) | −1.17 | 2.48 | 0.64 | 0.46 | 1.55 | 0.77 | −1.64 | 2.30 | 0.48 |
| Obesity status (obese vs. non-obese) | 9.34 | 2.10 | 0.00 ** | 6.80 | 1.37 | 0.00 ** | 2.59 | 1.59 | 0.10 |
| Hypertension medication use (yes vs. no) | −1.03 | 2.50 | 0.68 | −1.66 | 1.51 | 0.27 | 0.61 | 1.85 | 0.74 |
| Age (year) | 0.74 | 0.10 | 0.00 ** | −0.01 | 0.06 | 0.89 | 0.74 | 0.09 | 0.00 ** |
| Gender (female vs. male) | −4.14 | 2.07 | 0.05 | −2.04 | 1.23 | 0.10 | −2.11 | 1.56 | 0.18 |
| Race (White) | |||||||||
| Asian | 11.15 | 4.33 | 0.01 * | 8.54 | 2.36 | 0.00 ** | 2.71 | 3.40 | 0.43 |
| Black | 2.75 | 4.68 | 0.56 | 4.69 | 2.37 | 0.05 | −2.01 | 3.25 | 0.54 |
| Other | 0.68 | 3.08 | 0.83 | 1.40 | 2.05 | 0.50 | −0.76 | 2.25 | 0.74 |
| Smoking status (Never smoked) | |||||||||
| Used to smoke | −2.21 | 2.28 | 0.33 | −0.92 | 1.47 | 0.53 | −1.32 | 1.74 | 0.45 |
| Current smoker | −3.01 | 2.68 | 0.26 | −0.92 | 1.62 | 0.57 | −2.14 | 2.06 | 0.30 |
| Education (< high school) | |||||||||
| High school | −2.96 | 3.21 | 0.36 | −2.50 | 2.10 | 0.24 | −0.51 | 2.39 | 0.83 |
| Undergraduate | −4.97 | 3.28 | 0.13 | −2.73 | 1.94 | 0.16 | −2.33 | 2.49 | 0.35 |
| Graduate | −9.21 | 3.48 | 0.01 * | −4.60 | 2.27 | 0.04 * | −4.72 | 2.49 | 0.06 |
| Clinic Dates | |||||||||
| Seasonal Variation 1 | 0.10 | 0.96 | 0.92 | 0.87 | 0.51 | 0.09 | −0.78 | 0.75 | 0.30 |
| Seasonal Variation 2 | 1.95 | 0.94 | 0.04 * | 0.58 | 0.63 | 0.35 | 1.31 | 0.70 | 0.06 |
| Week day vs. Weekend | −1.24 | 1.57 | 0.43 | −0.51 | 0.90 | 0.57 | −0.94 | 1.24 | 0.45 |
| Clinic Date (1 day) | −0.02 | 0.01 | 0.00 ** | 0.00 | 0.00 | 0.14 | −0.01 | 0.00 | 0.01 * |
5. Limitations
6. Conclusions
Supplementary Files
Supplementary File 1Acknowledgments
Author Contributions
Conflicts of Interest
References
- Brook, R.D.; Rajagopalan, S. Particulate matter, air pollution, and blood pressure. J. Am. Soc. Hypertens. 2009, 3, 332–350. [Google Scholar]
- Brook, R.D.; Rajagopalan, S.; Pope, C.A., 3rd; Brook, J.R.; Bhatnagar, A.; Diez-Roux, A.V.; Holguin, F.; Hong, Y.; Luepker, R.V.; Mittleman, M.A.; et al. Metabolism, Particulate matter air pollution and cardiovascular disease: An update to the scientific statement from the American Heart Association. Circulation 2010, 121, 2331–2378. [Google Scholar]
- Delfino, R.J.; Tjoa, T.; Gillen, D.L.; Staimer, N.; Polidori, A.; Arhami, M.; Jamner, L.; Sioutas, C.; Longhurst, J. Traffic-related air pollution and blood pressure in elderly subjects with coronary artery disease. Epidemiology 2010, 21, 396–404. [Google Scholar]
- Hoffmann, B.; Luttmann-Gibson, H.; Cohen, A.; Zanobetti, A.; de Souza, C.; Foley, C.; Suh, H.H.; Coull, B.A.; Schwartz, J.; Mittleman, M.; et al. Opposing effects of particle pollution, ozone, and ambient temperature on arterial blood pressure. Environ. Health Perspect. 2012, 120, 241–246. [Google Scholar]
- Rich, D.Q.; Zareba, W.; Beckett, W.; Hopke, P.K.; Oakes, D.; Frampton, M.W.; Bisognano, J.; Chalupa, D.; Bausch, J.; OʼShea, K.; et al. Are ambient ultrafine, accumulation mode, and fine particles associated with adverse cardiac responses in patients undergoing cardiac rehabilitation? Environ. Health Perspect. 2012, 120, 1162–1169. [Google Scholar]
- Cosselman, K.E.; Krishnan, R.M.; Oron, A.P.; Jansen, K.; Peretz, A.; Sullivan, J.H.; Larson, T.V.; Kaufman, J.D. Blood pressure response to controlled diesel exhaust exposure in human subjects. Hypertension 2012, 59, 943–948. [Google Scholar]
- Sughis, M.; Nawrot, T.S.; Ihsan-ul-Haque, S.; Amjad, A.; Nemery, B. Blood pressure and particulate air pollution in schoolchildren of Lahore, Pakistan. BMC Public Health 2012, 12, 378. [Google Scholar]
- Fuller, C.H.; Patton, A.P.; Lane, K.; Laws, M.B.; Marden, A.; Carrasco, E.; Spengler, J.; Mwamburi, M.; Zamore, W.; Durant, J.L.; et al. A community participatory study of cardiovascular health and exposure to near-highway air pollution: Study design and methods. Rev. Environ. Health 2013, 28, 21–35. [Google Scholar]
- Brugge, D.; Lane, K.; Padro-Martinez, L.T.; Stewart, A.; Hoesterey, K.; Weiss, D.; Wang, D.D.; Levy, J.I.; Patton, A.P.; Zamore, W.; et al. Highway proximity associated with cardiovascular disease risk: The influence of individual-level confounders and exposure misclassification. Environ. Health 2013, 12, 84. [Google Scholar]
- Bland, J.M.; Altman, D.G. Statistical methods for assessing agreement between two methods of clinical measurement. Lancet 1986, 1, 307–310. [Google Scholar]
- Clark, C.E.; Taylor, R.S.; Shore, A.C.; Campbell, J.L. The difference in blood pressure readings between arms and survival: primary care cohort study. BMJ 2012, 344, e1327. [Google Scholar]
- Clark, C.E.; Taylor, R.S.; Shore, A.C.; Ukoumunne, O.C.; Campbell, J.L. Association of a difference in systolic blood pressure between arms with vascular disease and mortality: A systematic review and meta-analysis. Lancet 2012, 379, 905–914. [Google Scholar]
- Mordukhovich, I.; Wilker, E.; Suh, H.; Wright, R.; Sparrow, D.; Vokonas, P.S.; Schwartz, J. Black carbon exposure, oxidative stress genes, and blood pressure in a repeated-measures study. Environ. Health Perspect. 2009, 117, 1767–1772. [Google Scholar]
- Wellenius, G.A.; Wilhelm-Benartzi, C.S.; Wilker, E.H.; Coull, B.A.; Suh, H.H.; Koutrakis, P.; Lipsitz, L.A. Ambient particulate matter and the response to orthostatic challenge in the elderly: The Maintenance of Balance, Independent Living, Intellect, and Zest in the Elderly (MOBILIZE) of Boston study. Hypertension 2012, 59, 558–563. [Google Scholar]
- Padro-Martinez, L.T.; Patton, A.P.; Trull, J.B.; Zamore, W.; Brugge, D.; Durant, J.L. Mobile monitoring of particle number concentration and other traffic-related air pollutants in a near-highway neighborhood over the course of a year. Atmos. Environ. 2012, 61, 253–264. [Google Scholar]
- Fuller, C.H.; Brugge, D.; Williams, P.; Mittleman, M.; Durant, J.L.; Spengler, J.D. Estimation of ultrafine particle concentrations at near-highway residences using data from local and central monitors. Atmos. Environ. 2012, 57, 257–265. [Google Scholar]
- Donaldson, K.; Stone, V.; Seaton, A.; MacNee, W. Ambient particle inhalation and the cardiovascular system: potential mechanisms. Environ. Health Perspect. 2001, 109, 523–527. [Google Scholar]
- Kunzli, N.; Jerrett, M.; Mack, W.J.; Beckerman, B.; LaBree, L.; Gilliland, F.; Thomas, D.; Peters, J.; Hodis, H.N. Ambient air pollution and atherosclerosis in Los Angeles. Environ. Health Perspect. 2005, 113, 201–206. [Google Scholar]
- Peters, A.; Doring, A.; Wichmann, H.E.; Koenig, W. Increased plasma viscosity during an air pollution episode: a link to mortality? Lancet 1997, 349, 1582–1587. [Google Scholar]
- Valavanidis, A.; Fiotakis, K.; Vlachogianni, T. Airborne particulate matter and human health: Toxicological assessment and importance of size and composition of particles for oxidative damage and carcinogenic mechanisms. J. Environ. Sci. Health. C Environ. Carcinog. Ecotoxicol. Rev. 2008, 26, 339–362. [Google Scholar]
- Danesh, J.; Wheeler, J.G.; Hirschfield, G.M.; Eda, S.; Eiriksdottir, G.; Rumley, A.; Lowe, G.D.; Pepys, M.B.; Gudnason, V. C-reactive protein and other circulating markers of inflammation in the prediction of coronary heart disease. N. Engl. J. Med. 2004, 350, 1387–1397. [Google Scholar]
- Devaraj, S.; Xu, D.Y.; Jialal, I. C-reactive protein increases plasminogen activator inhibitor-1 expression and activity in human aortic endothelial cells: Implications for the metabolic syndrome and atherothrombosis. Circulation 2003, 107, 398–404. [Google Scholar]
- Pekkanen, J.; Brunner, E.J.; Anderson, H.R.; Tiittanen, P.; Atkinson, R.W. Daily concentrations of air pollution and plasma fibrinogen in London. Occup. Environ. Med. 2000, 57, 818–822. [Google Scholar]
- Yarnell, J.W.; Patterson, C.C.; Sweetnam, P.M.; Lowe, G.D. Haemostatic/inflammatory markers predict 10-year risk of IHD at least as well as lipids: the Caerphilly collaborative studies. Eur. Heart J. 2004, 25, 1049–1056. [Google Scholar]
- Hoek, G.; Brunekreef, B.; Fischer, P.; van Wijnen, J. The association between air pollution and heart failure, arrhythmia, embolism, thrombosis, and other cardiovascular causes of death in a time series study. Epidemiology 2001, 12, 355–357. [Google Scholar]
- Pope, C.A., 3rd; Hansen, M.L.; Long, R.W.; Nielsen, K.R.; Eatough, N.L.; Wilson, W.E.; Eatough, D.J. Ambient particulate air pollution, heart rate variability, and blood markers of inflammation in a panel of elderly subjects. Environ. Health Perspect. 2004, 112, 339–345. [Google Scholar]
- Zanobetti, A.; Canner, M.J.; Stone, P.H.; Schwartz, J.; Sher, D.; Eagan-Bengston, E.; Gates, K.A.; Hartley, L.H.; Suh, H.; Gold, D.R. Ambient pollution and blood pressure in cardiac rehabilitation patients. Circulation 2004, 110, 2184–2189. [Google Scholar]
© 2015 by the authors; licensee MDPI, Basel, Switzerland. This article is an open access article distributed under the terms and conditions of the Creative Commons Attribution license (http://creativecommons.org/licenses/by/4.0/).
Share and Cite
Chung, M.; Wang, D.D.; Rizzo, A.M.; Gachette, D.; Delnord, M.; Parambi, R.; Kang, C.-M.; Brugge, D. Association of PNC, BC, and PM2.5 Measured at a Central Monitoring Site with Blood Pressure in a Predominantly Near Highway Population. Int. J. Environ. Res. Public Health 2015, 12, 2765-2780. https://doi.org/10.3390/ijerph120302765
Chung M, Wang DD, Rizzo AM, Gachette D, Delnord M, Parambi R, Kang C-M, Brugge D. Association of PNC, BC, and PM2.5 Measured at a Central Monitoring Site with Blood Pressure in a Predominantly Near Highway Population. International Journal of Environmental Research and Public Health. 2015; 12(3):2765-2780. https://doi.org/10.3390/ijerph120302765
Chicago/Turabian StyleChung, Mei, Ding Ding Wang, Amanda M. Rizzo, Darrel Gachette, Marie Delnord, Ron Parambi, Choong-Min Kang, and Doug Brugge. 2015. "Association of PNC, BC, and PM2.5 Measured at a Central Monitoring Site with Blood Pressure in a Predominantly Near Highway Population" International Journal of Environmental Research and Public Health 12, no. 3: 2765-2780. https://doi.org/10.3390/ijerph120302765
APA StyleChung, M., Wang, D. D., Rizzo, A. M., Gachette, D., Delnord, M., Parambi, R., Kang, C.-M., & Brugge, D. (2015). Association of PNC, BC, and PM2.5 Measured at a Central Monitoring Site with Blood Pressure in a Predominantly Near Highway Population. International Journal of Environmental Research and Public Health, 12(3), 2765-2780. https://doi.org/10.3390/ijerph120302765