4.1. Real RF EMF Exposure and Exposure Perception
In order to compare RF EMF risk perception with the real user exposure to EMF, the typical radiation levels, expressed in terms of electric field, for the different devices and systems under study are indicated in
Table 1. These values are typically observed in normal usage conditions, as reported in Oliveira
et al. [
23] and Kuster [
24]. Note that the electric field can be easily measured near to any of the mentioned devices, on the contrary to SAR, whose measurement process is much more complex and difficult to achieve for many scenarios (e.g., people walking in the street submitted to both up- and downlinks exposure from surrounding devices and systems).
Table 1.
Typical user exposure to various devices (background information. [
23,
24]).
Table 1.
Typical user exposure to various devices (background information. [23,24]).
| Device System | User Exposure (Electric Field) [V/m] |
|---|
| Mobile phone | <10 |
| Wireless networks at home | <1 |
| Mobile communication masts | <0.3 |
| TV set | 0 |
Contrary to users’ perception, exposure is usually higher for mobile phones than for mobile communication masts, because mobile phones are operated closer to the user (a few millimeters away or attached to the user), while base stations are usually, at least, 1 to 15 m apart from the user (for micro- and macro-cells, respectively). Exposure to wireless networks at home is generally higher than the one from outdoor base stations, since, again, the former are closer to the user. The TV set is ranked at 0 V/m of exposure, as this device is not a transmitter, rather only receiving the TV signal through its antenna port.
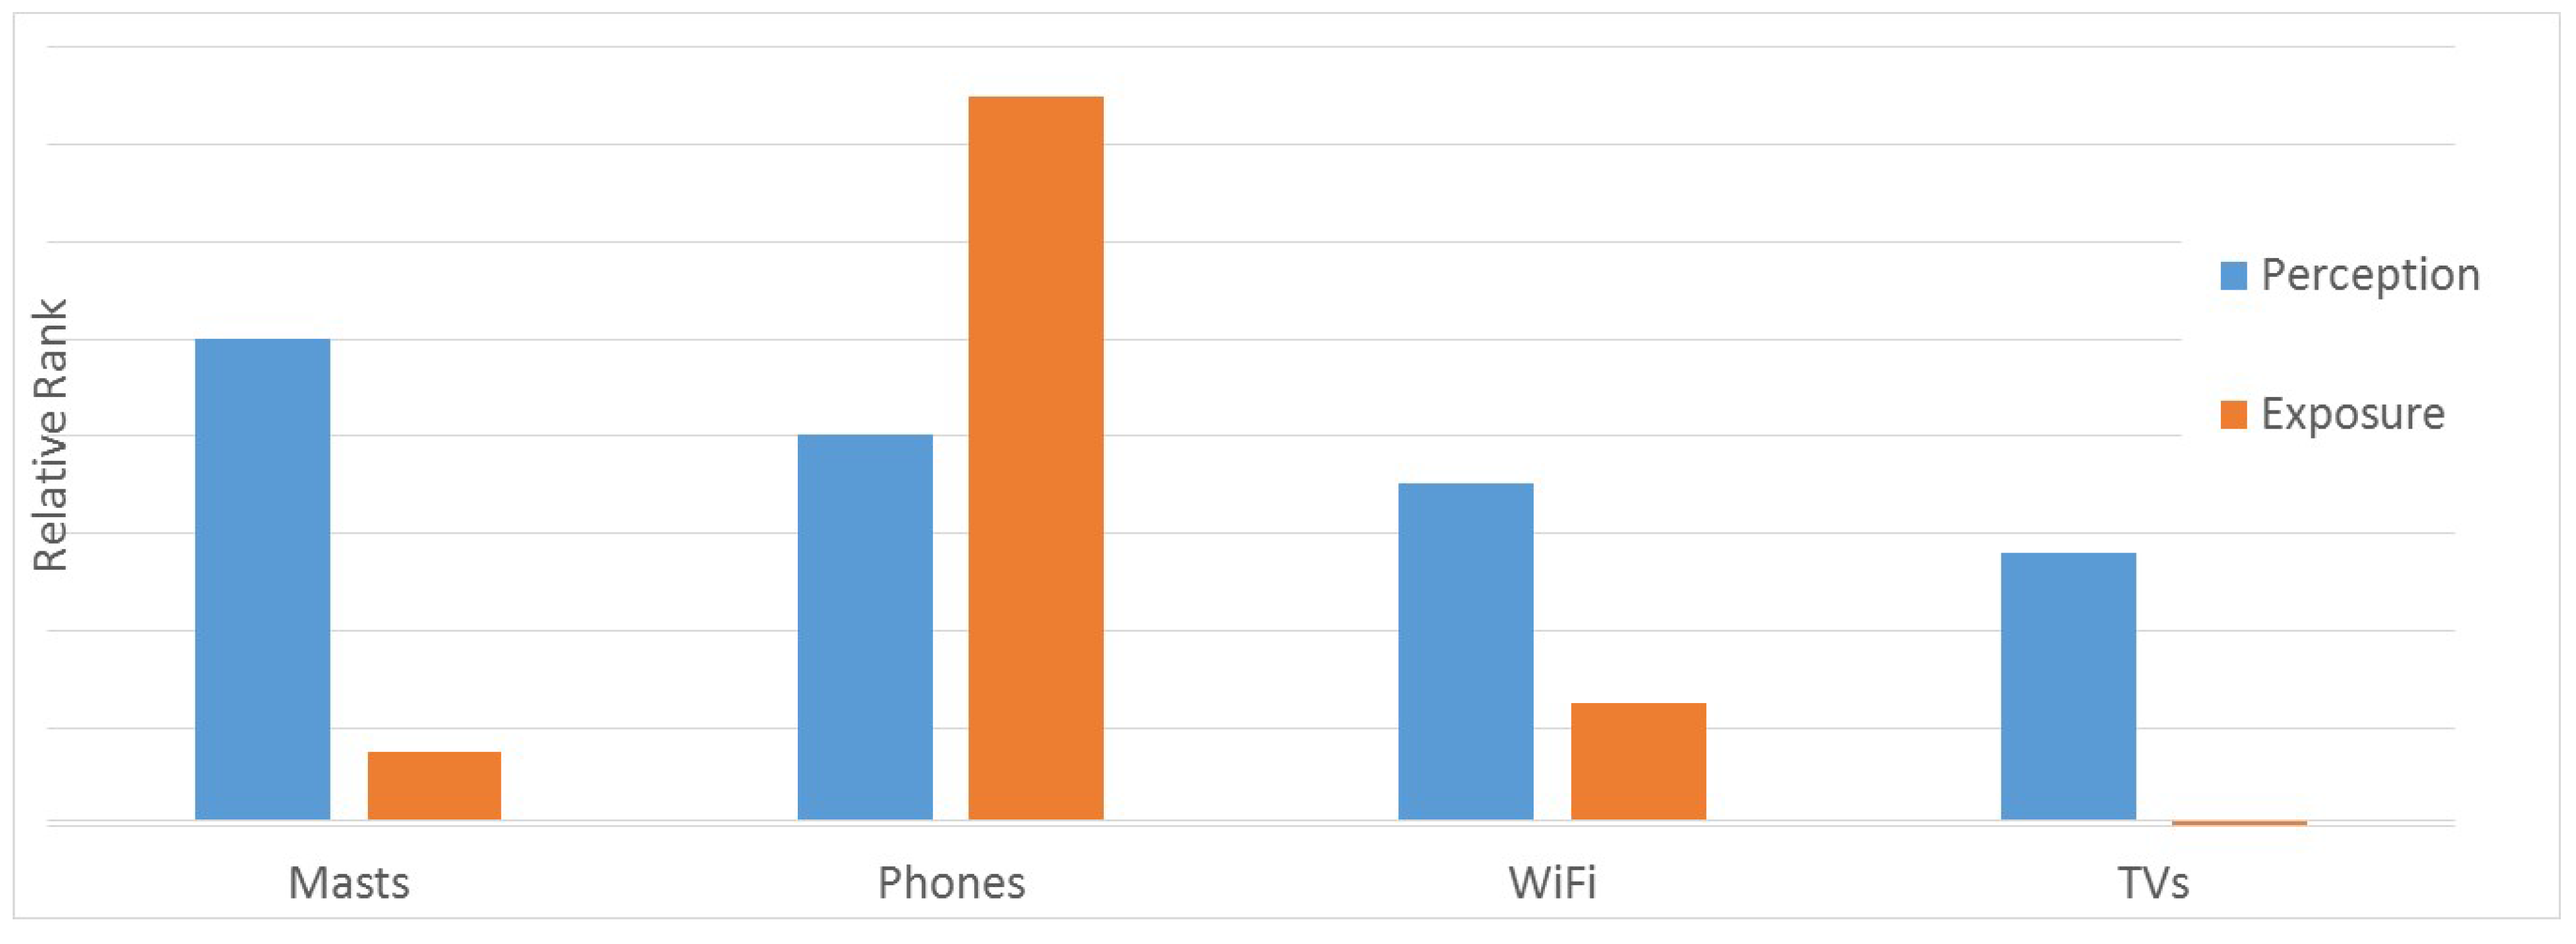
Table 2 shows the real user exposure compared to the subjective EMF exposure strengths, which the respondents had to estimate (
Figure 1), as well as the property of being an RF EMF radiation source, and the tendency for over and underestimation. In
Figure 1, the real EMF exposure of the various devices (
Table 1) is compared with the subjective exposure perception (
Figure 1). Note that, in
Figure 1, results are presented as a relative rank,
i.e., being normalized to the maximum value for each case (e.g., for exposure perception of base stations, values are normalized to 3.74).
Table 2.
Ranking means estimated EMF exposure of various devices and systems (Question: “In your opinion, how strong are electromagnetic fields from the following devices or technical systems? “on a 5-point Likert scale from 1 = very low intensity, 5 = very high intensity) and real user exposure in V/m.
| Exposure Source | Mean Exposure Perception | Real User Exposure [V/m] | Tendency Over-/Underestimate |
|---|
| Mobile communication masts | 3.74 | <0.3 | ↑ |
| Mobile telephones | 3.01 | <10 | ↓ |
| Wireless networks at home | 2.63 | <1 | ↑ |
| TV set | 2.09 | 0 | ↑ |
Figure 1.
Comparative rank of exposure perception and real exposure.
Figure 1.
Comparative rank of exposure perception and real exposure.
The comparison between real exposure and users’ perceived one clearly shows the tendency for over- and underestimation of exposure for each device/system. This is clearly evident by inspecting
Figure 1.
In contrast to lay people’s perspective, the actual user exposure to base stations and mobile terminals is very much different. Compared to the real user exposure, results confirm a clear overestimation of base stations, where exposure is lower (<0.3 V/m) than near-field source mobile phones (<10 V/m). However, note that 10 V/m is a conservative estimation of exposure, but it is still below the recommended threshold values of RF EMF [
25].
Concerning wireless networks at home, people think about it as a similar source of exposure to mobile phones, when in fact the real exposure is lower. It is notable that a TV set, which is a non-RF-EMF exposure source, is perceived to emit EMF by lay people. This can be explained by the fact that TV sets are still associated with the old cathode rays tube (CRT) devices, which could emit unintentional x-rays.
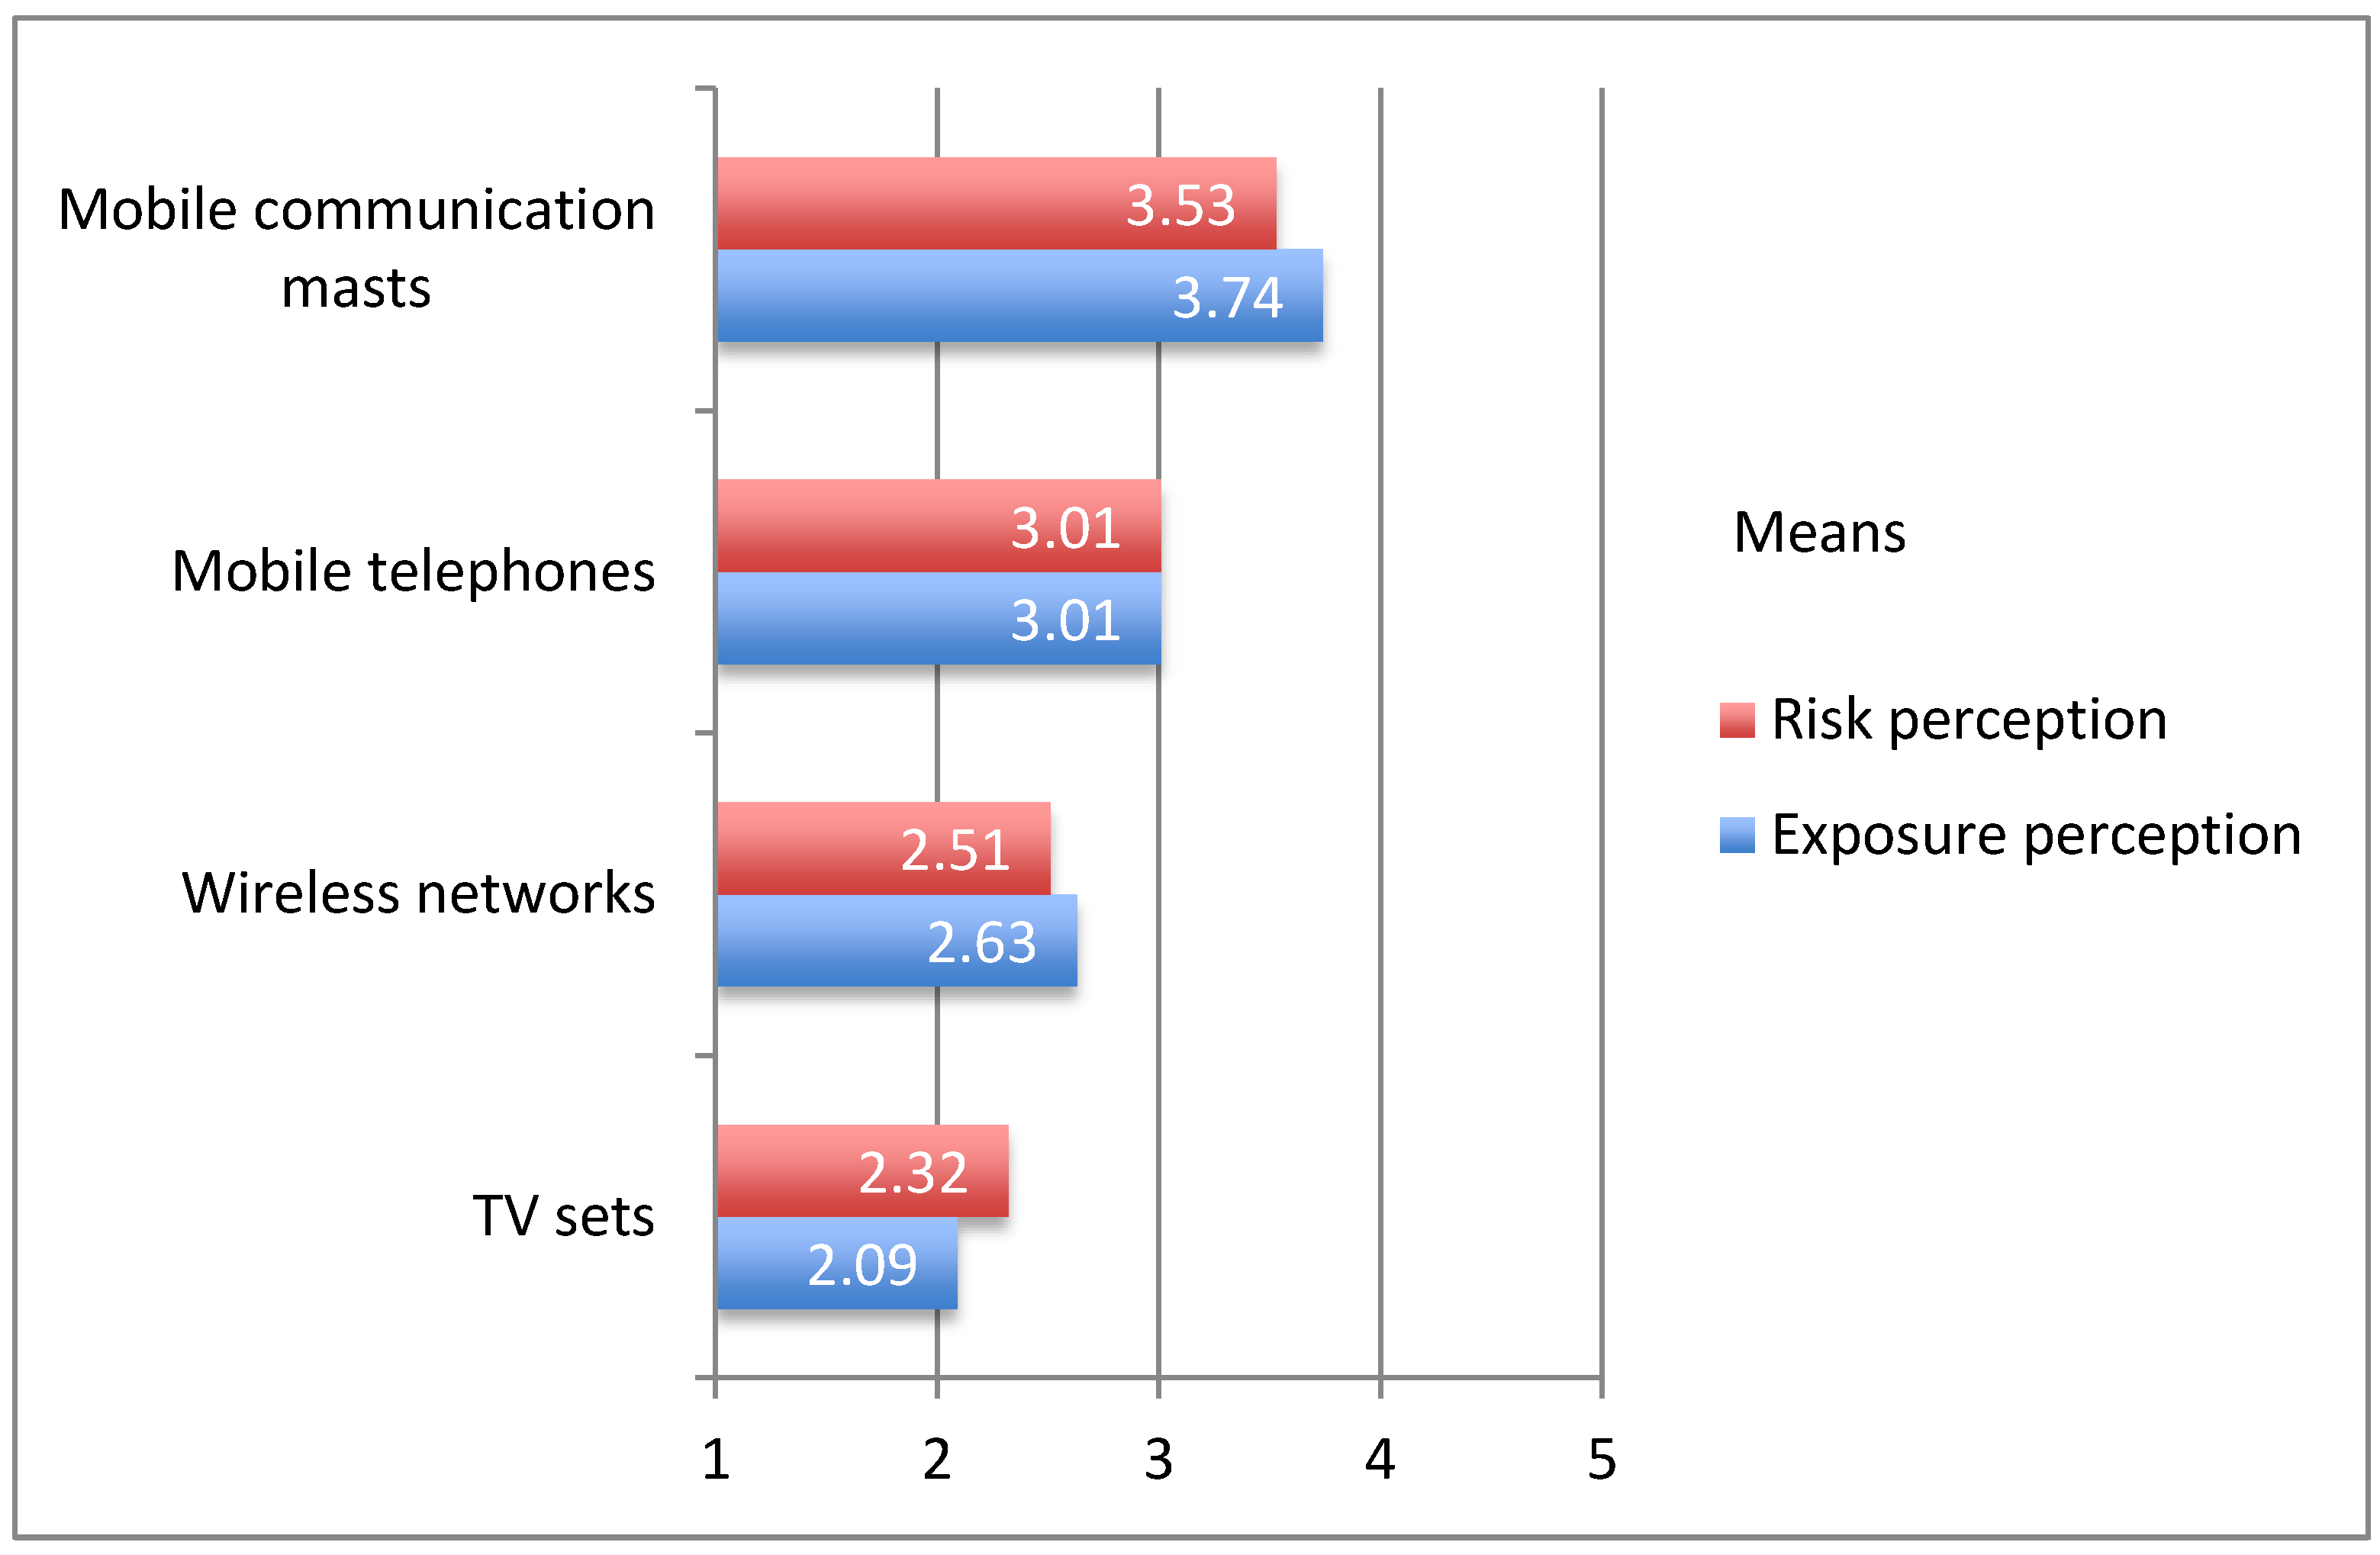
4.2. Exposure Perception and Risk Perception
In this section, the link between risk perceptions of possible health effects from different EMF devices and the subjective exposure perception is examined. In terms of the findings regarding the estimated exposure strength, the results indicate that mobile communication masts are perceived as the most intense source. The mean estimated exposure strength is 3.74, on the 5-point Likert scale (1 = very low intensity, 5 = very high intensity), which is followed by lower scores for mobile phones reaching a mean of 3.01, wireless networks at home (mean = 2.63) and TV sets (mean = 2.09). All values are displayed in
Figure 2.
Figure 2.
Comparison of means of risk perception and exposure perception of RF EMF devices and systems.
Figure 2.
Comparison of means of risk perception and exposure perception of RF EMF devices and systems.
The correlations between exposure and risk perceptions for the four RF EMF sources point in the same direction: all correlations are substantial and statistically significant (p = 0.000); mobile communication masts, r = 0.450; mobile phones, 0.548; wireless networks, 0.451; TV sets, r = 0.434. The results support the assumption that exposure perception is a good predictor of RF EMF risk perception. Those with high exposure perception tend also to high risk perception.
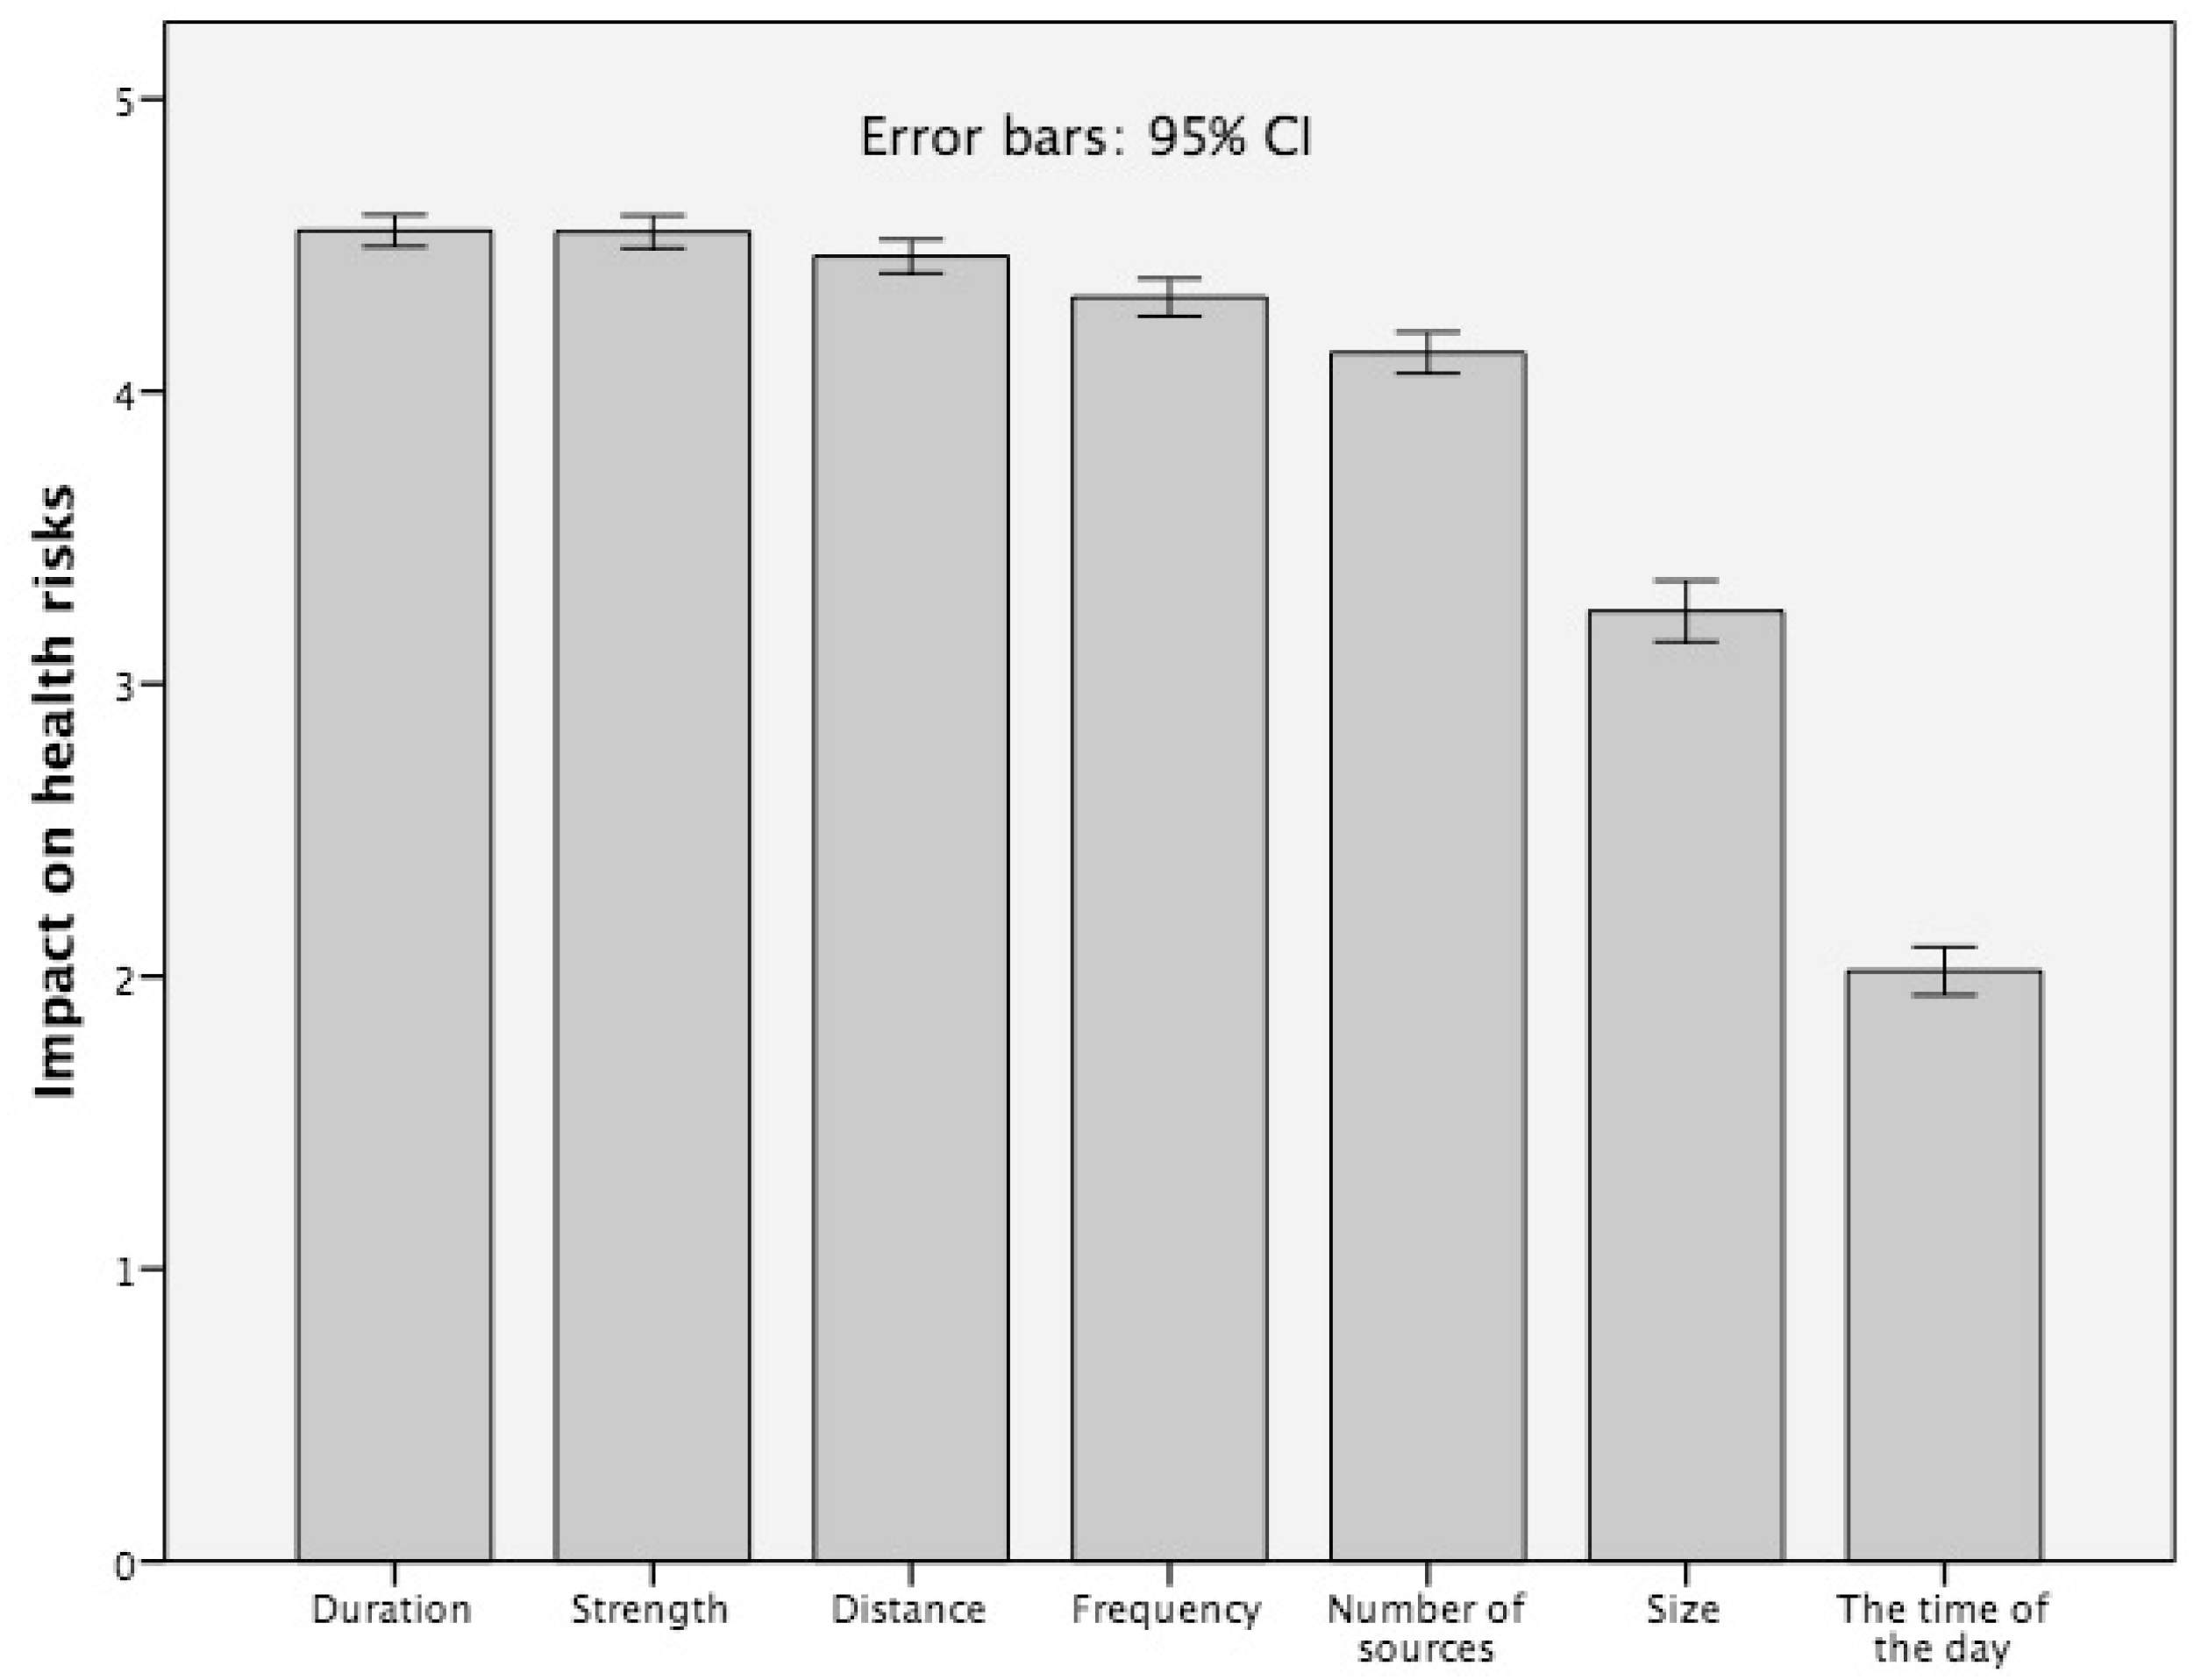
4.3. Subjective Exposure Impact Knowledge and Risk Perception
An important factor for an adequate assessment of possible adverse effects in exposure situations is the respondents’ subjective knowledge - their beliefs - about the impact of exposure features on potential health risks. As indicated in
Figure 3, the exposure characteristics (1) duration of exposure (mean = 4.54); (2) the strength of exposure (mean = 4.54); (3) the distance (mean = 4.46); (4) the frequency of exposure,
i.e., how often people are exposed (mean = 4.32); and (5) the number of exposure sources (mean = 4.13) are seen as crucial for health risks. The physical size of the exposure source and the time of the day of exposure, were ranked lower by the respondents (mean = 3.24 and mean = 2.01, respectively). The intervals plotted above the bars in
Figure 3 represent the 95% confidence interval,
i.e., the interval of values with 95% of probability of containing the population mean.
Figure 3.
Beliefs about the impact of EMF exposure characteristics on the EMF health risk, 5-point Likert scale 1 = disagree totally to 5 = agree totally (question: “What do the potential health risks of electro-magnetic fields from exposure sources like mobile phones, mobile communication masts, or other devices depend on?”).
On a first glance, the results presented in
Figure 3 indicate a quite appropriate understanding of how exposure factors may impact potential EMF health risks. They believe that the strength of the exposure source as well as the distance to the source and the duration of the exposure play a crucial role for potential health risks.
Of further interest is how RF EMF risk perception of various exposure sources is actually affected by the respondents’ views regarding the impact of exposure features. Therefore, several regression analyses for different exposure situations were calculated, to investigate the impact of exposure characteristics on EMF risk perception of base stations, mobile phones, WLAN routers and TV sets, as summarized in
Table 3,
Table 4 and
Table 5.
Table 3.
Linear regression exposure characteristics: dependent variable is risk perception of base stations.
Table 3.
Linear regression exposure characteristics: dependent variable is risk perception of base stations.
| Regression Exposure Characteristics, Base Station | β-Value | p |
|---|
| Duration | 0.026 | 0.680 |
| Distance | −0.008 | 0.874 |
| Frequency | 0.105 | 0.025 * |
| Strength | −0.060 | 0.221 |
| Number of sources | 0.083 | 0.056 |
| Time of day | 0.089 | 0.016 * |
| Size | 0.185 | 0.000 * |
The results for base stations demonstrate that the respondents’ risk perception regarding base stations is only slightly affected by factors that are relevant in science. Overall, the amount of the explained variance by the regression model is about 10%.
Most striking is that the belief about the strength of the exposure as a factor influencing potential health risks from EMF exposure is not a significant predictor for risk perception. Frequency seems to play a significant role (β = 0.105, p = 0.025) in influencing risk perception of the respondents. This seems not to be an acceptable view, because base stations do not operate in an on- or off-mode like mobile phones.
Furthermore, the size of the base station seems to play the most important role. The time of the day during RF EMF exposure is also a relevant predictor for lay people. At least, the degree of utilization of base stations varies with the time of the day. Taking this dependency into account, the view of “time of the day” as a critical factor is not false. However, another interpretation is possible and this is discussed later.
A slightly different picture is seen for mobile phones: duration (β = 0.112,
p = 0.027), frequency (β = 0.114,
p = 0.016) and number of sources (β = 0.088,
p = 0.045) are significant predictors for EMF risk perception (see
Table 4).
Table 4.
Linear regression exposure characteristics: dependent variable is risk perception of mobile phones.
Table 4.
Linear regression exposure characteristics: dependent variable is risk perception of mobile phones.
| Regression Exposure Characteristics, Mobile Phones | β-Value | p |
|---|
| Duration | 0.112 | 0.027 * |
| Distance | 0.013 | 0.794 |
| Frequency | 0.114 | 0.016 * |
| Strength | −0.035 | 0.474 |
| Number of sources | 0.088 | 0.045 * |
| Time of day | 0.114 | 0.002 * |
| Size | 0.085 | 0.030 * |
With the exception of “time of the day” these exposure features may play a significant role for health risks. In addition, again, the belief about the strength of the exposure as a factor influencing potential health risks associated with EMF exposure is not a significant predictor for risk perception. It has to be taken into account that the amount of explained variance by the regression model is low, only amounting to about 10%.
The two remaining sources were also tested in a linear regression model for the independent variables. As seen in
Table 5, for a WLAN router, the number of sources and the non-relevant feature time of the day are relevant (β = 0.165 and β = 0.167, both having
p = 0.000), as can be said for TV sets (β = 0.094,
p = 0.036 and β = 0.190,
p = 0.000). Again, the amount of the explained variance is low.
Table 5.
Linear regressions exposure characteristics: dependent variables are risk perception of WLAN router and risk perception of TV sets.
Table 5.
Linear regressions exposure characteristics: dependent variables are risk perception of WLAN router and risk perception of TV sets.
| WLAN Router | | | TV Sets | | |
|---|
| Regression Exposure Characteristics, WLAN | β-Value | p | Regression Exposure Characteristics, TV Set | β-Value | p |
|---|
| Duration | 0.052 | 0.307 | Duration | 0.048 | 0.350 |
| Distance | −0.049 | 0.324 | Distance | −0.073 | 0.150 |
| Frequency | 0.065 | 0.171 | Frequency | 0.028 | 0.565 |
| Strength | −0.040 | 0.411 | Strength | −0.005 | 0.932 |
| Number of sources | 0.165 | 0.000 * | Number of sources | 0.094 | 0.036 * |
| Time of day | 0.167 | 0.000 * | Time of day | 0.190 | 0.000 * |
| Size | 0.052 | 0.186 | Size | 0.062 | 0.115 |
That exposure characteristics like the time of the day (for all sources) and the size of the source (for base stations and mobile phones) seem to play a significant role in shaping risk perception is notable. In addition, it is striking that the strength of exposure does not play a significant role across all exposure sources. The TV set evaluation indicates a severe problem that lay people have only a restricted knowledge about what is an EMF exposure source and what is not.


