Removal of Disinfection By-Products from Contaminated Water Using a Synthetic Goethite Catalyst via Catalytic Ozonation and a Biofiltration System

Abstract
:1. Introduction
2. Materials and Methods
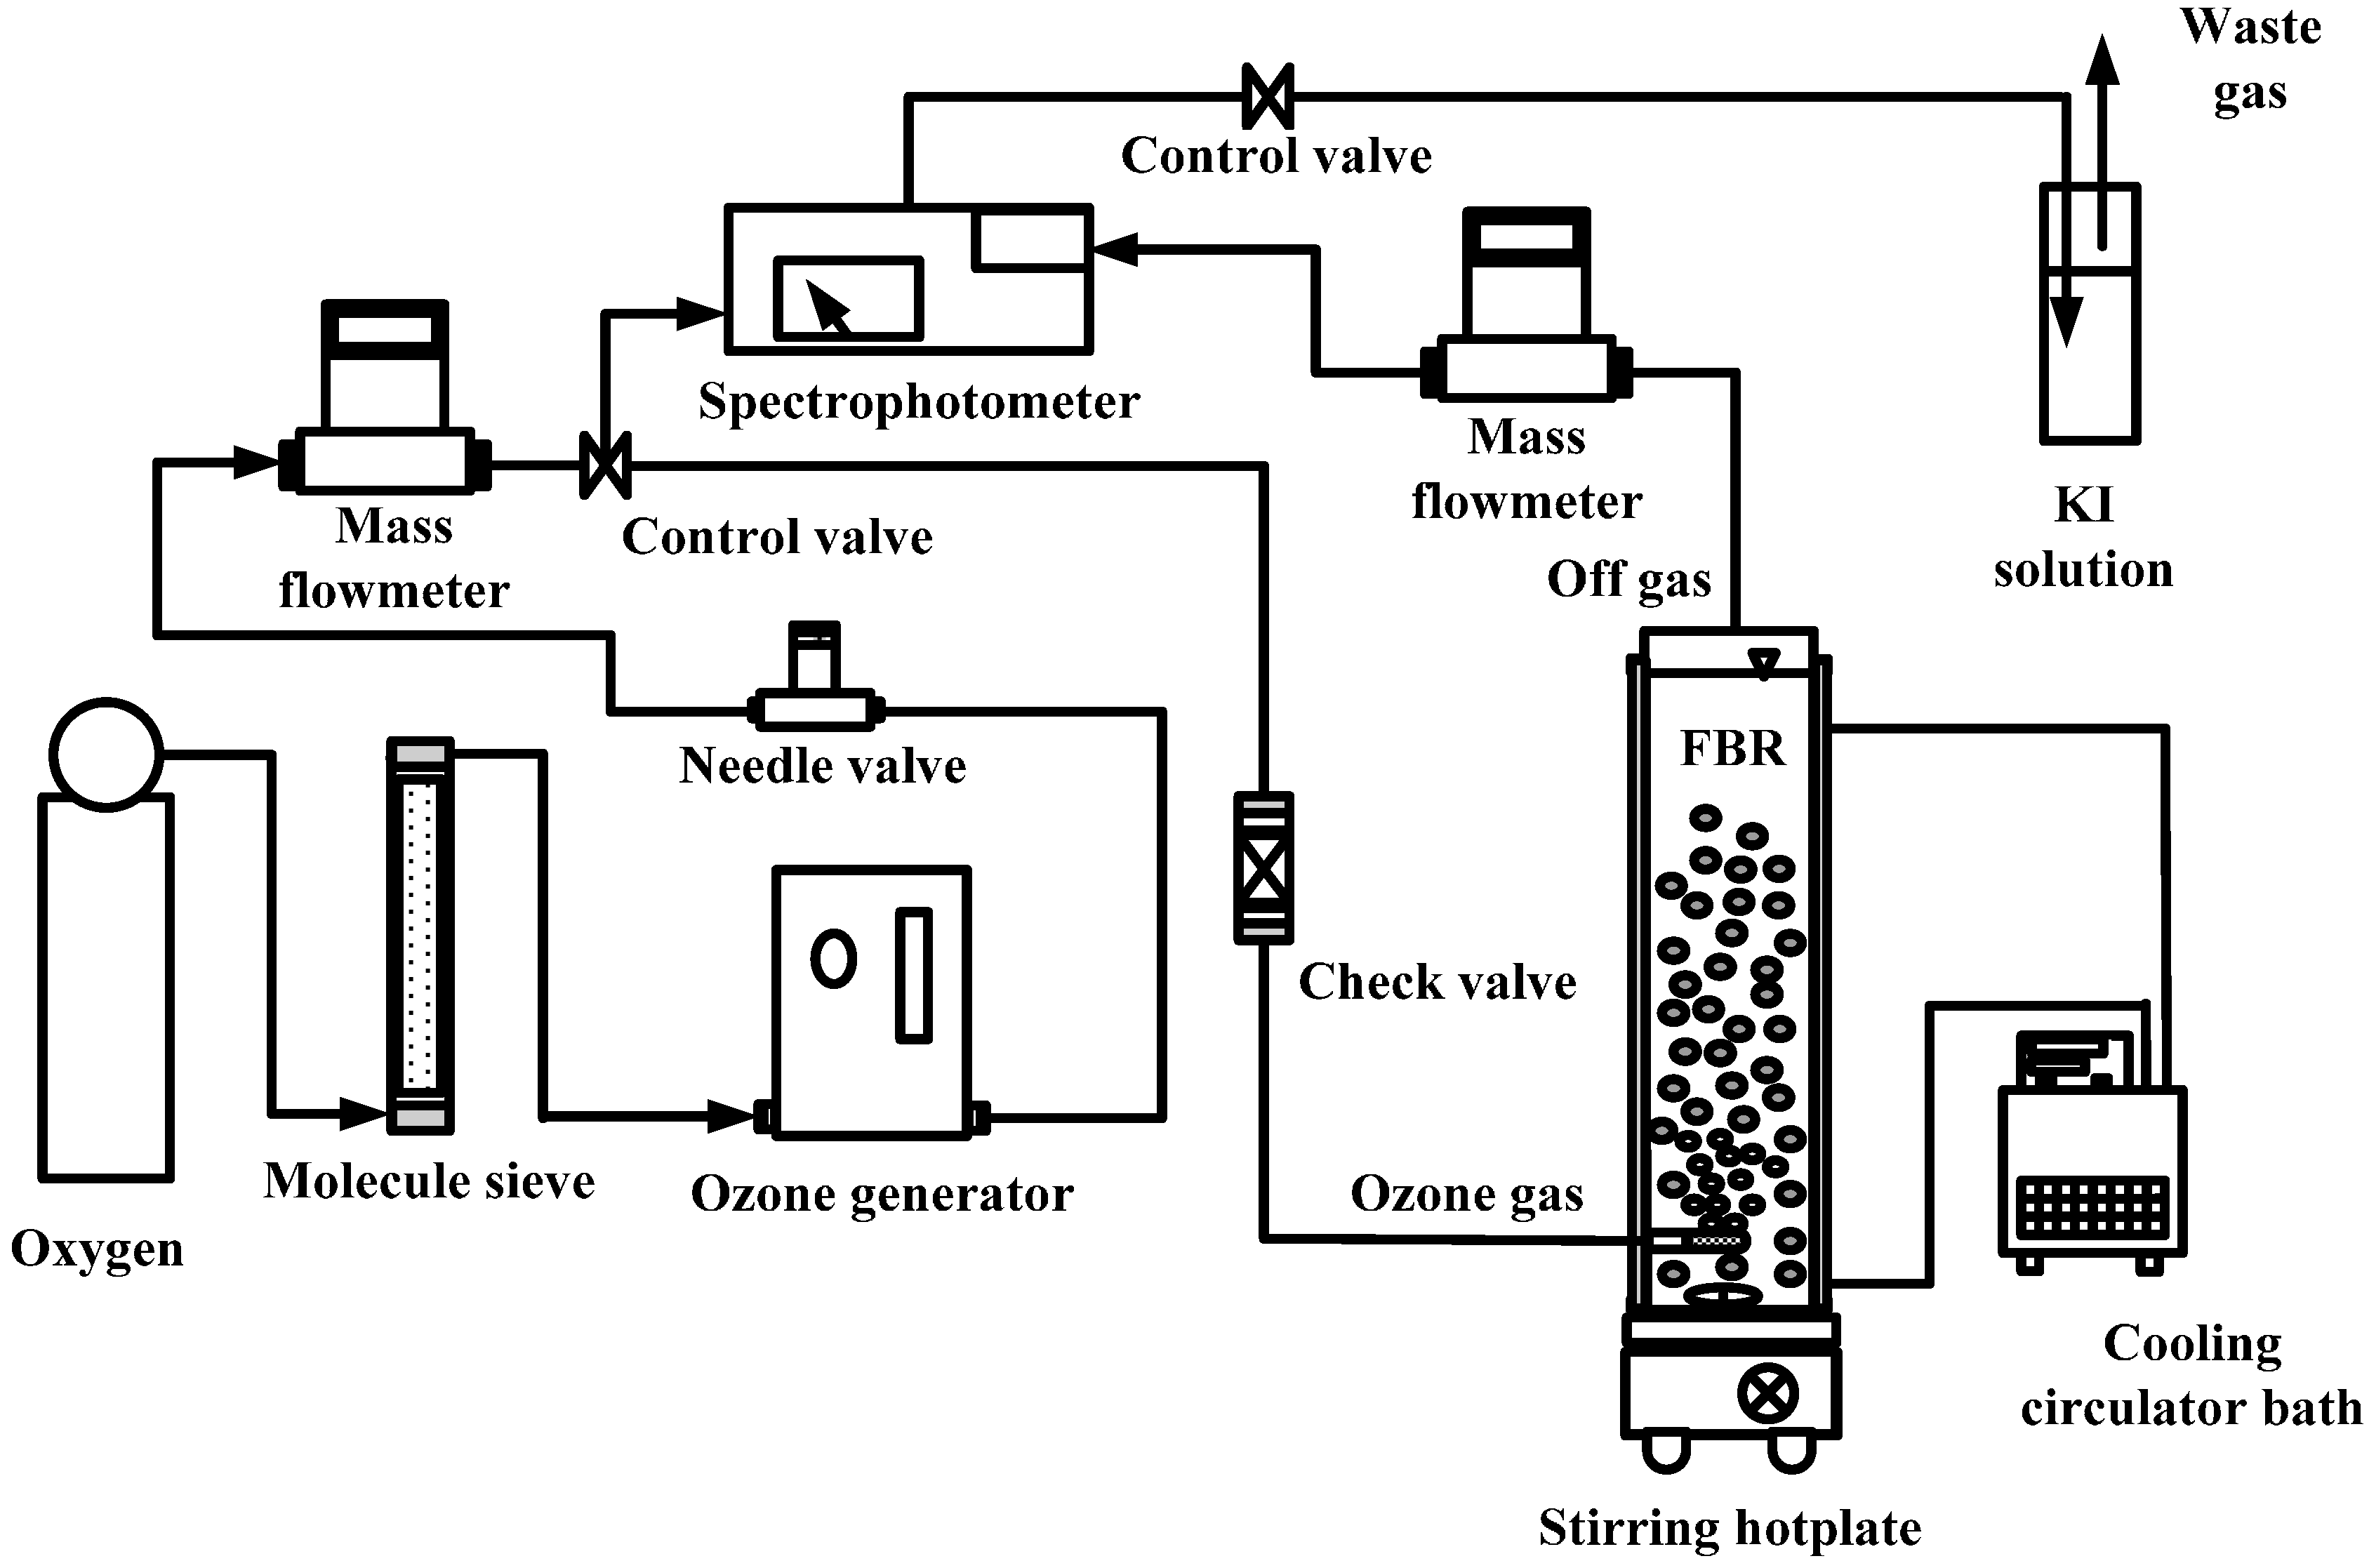
2.1. Catalytic Ozonation and Biofiltration

| Ozone concentration (mg·L−1) | 0, 2.5 |
| Gas flow (mL·min−1) | 50 |
| Water temperature (°C) | 20 |
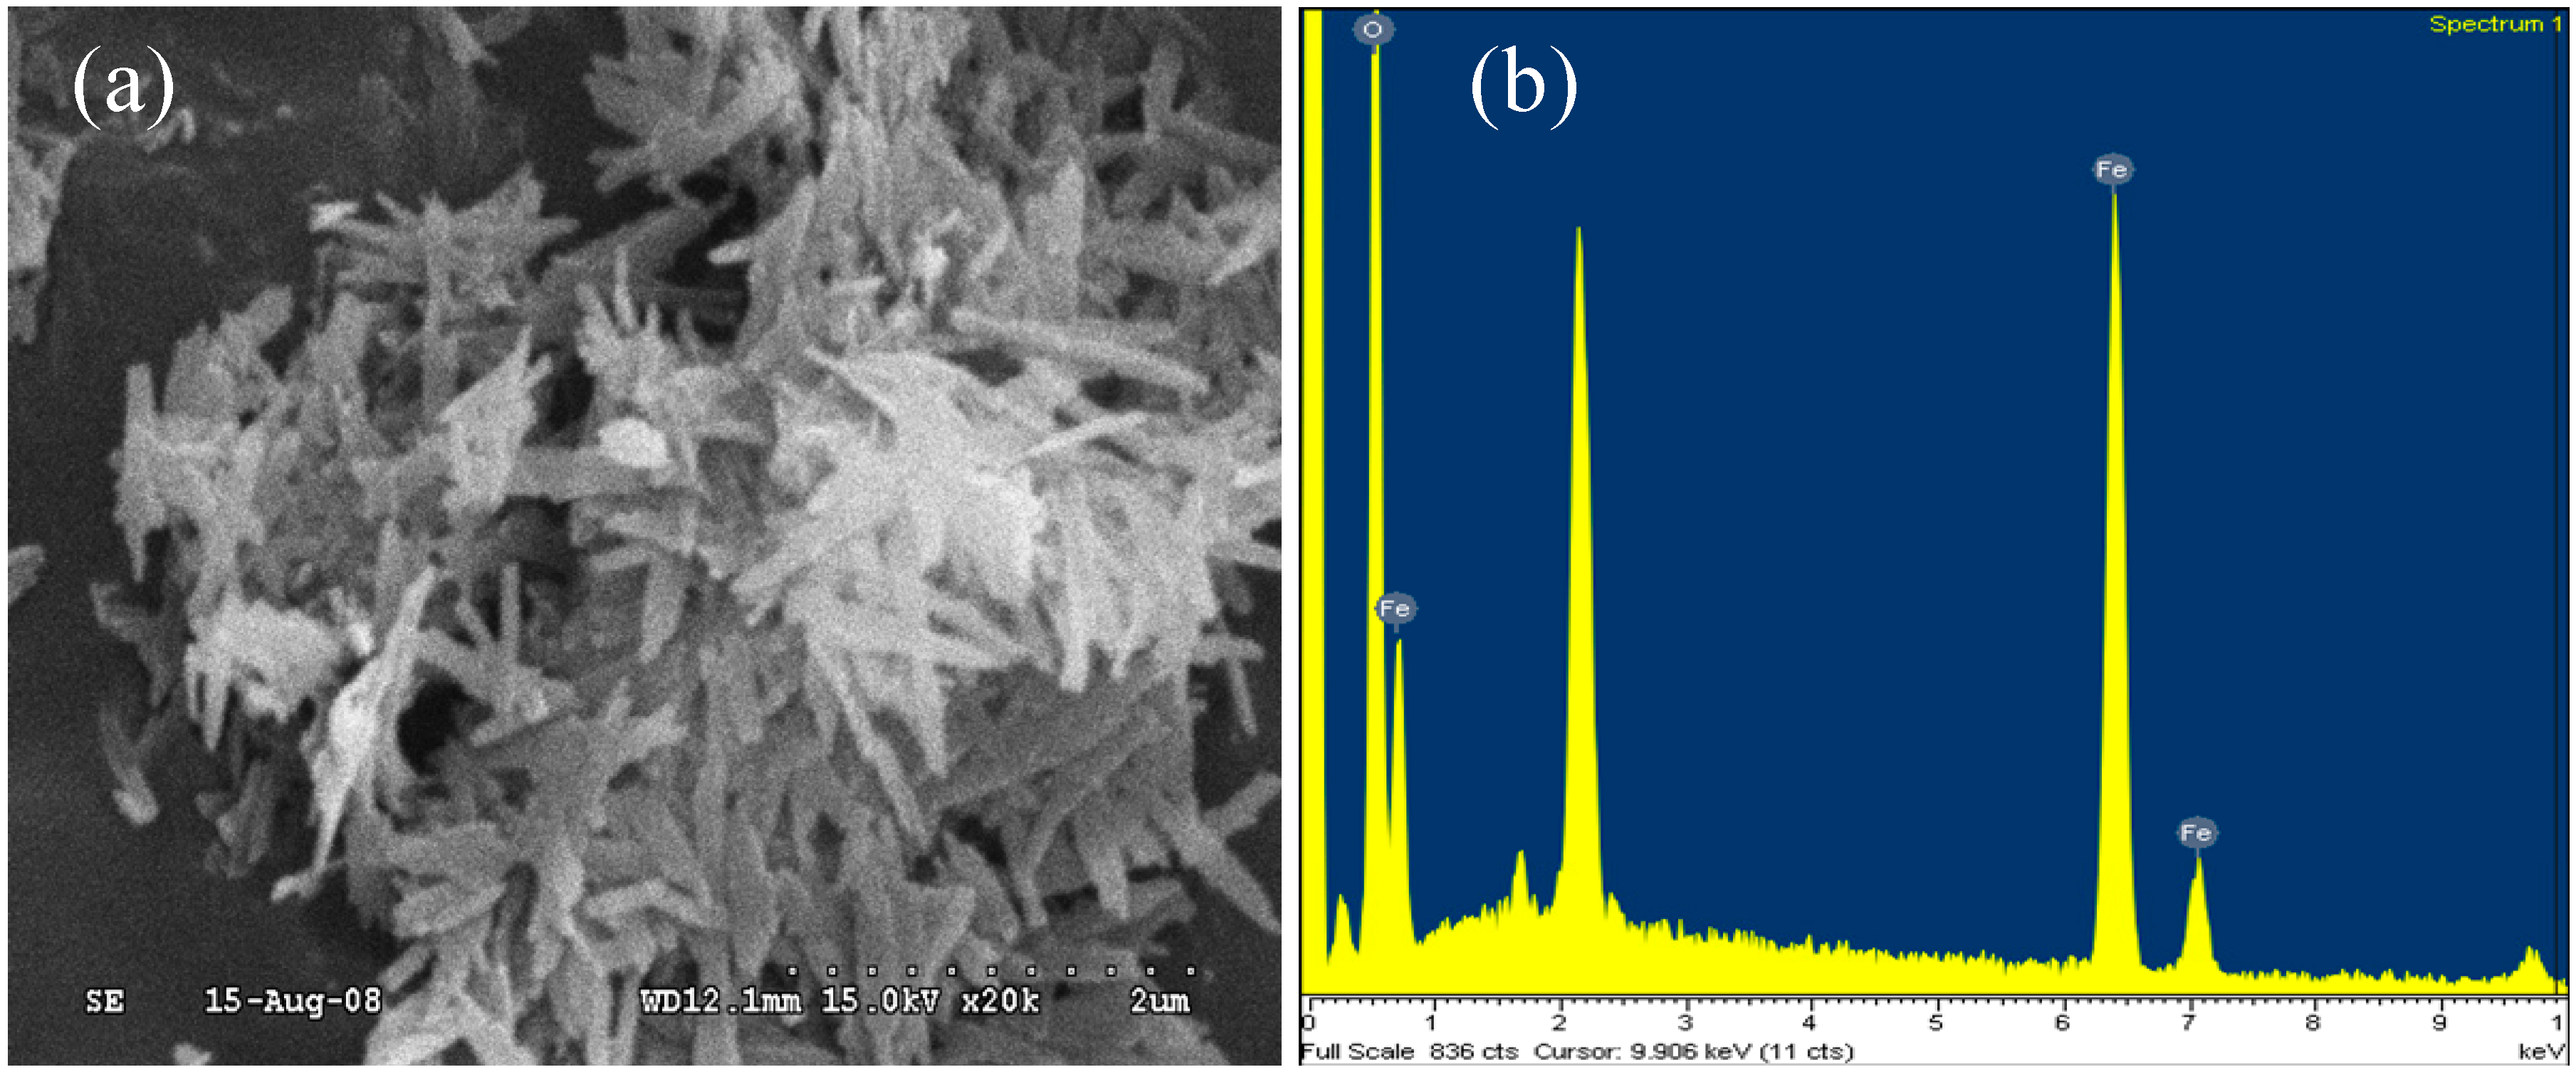
| Catalyst type | α-FeOOH |
| Catalyst dosage (g·L−1) | 0.5, 1.0, 1.5 |
2.2. Catalyst Preparation
2.3. Water Source
2.4. Fluorescence Measurements
2.5. DOC, UV254 and SUVA
2.6. Chlorination of the Water Samples
2.7. THMs and HAAs
2.8. Bromide and Bromate
3. Results and Discussion
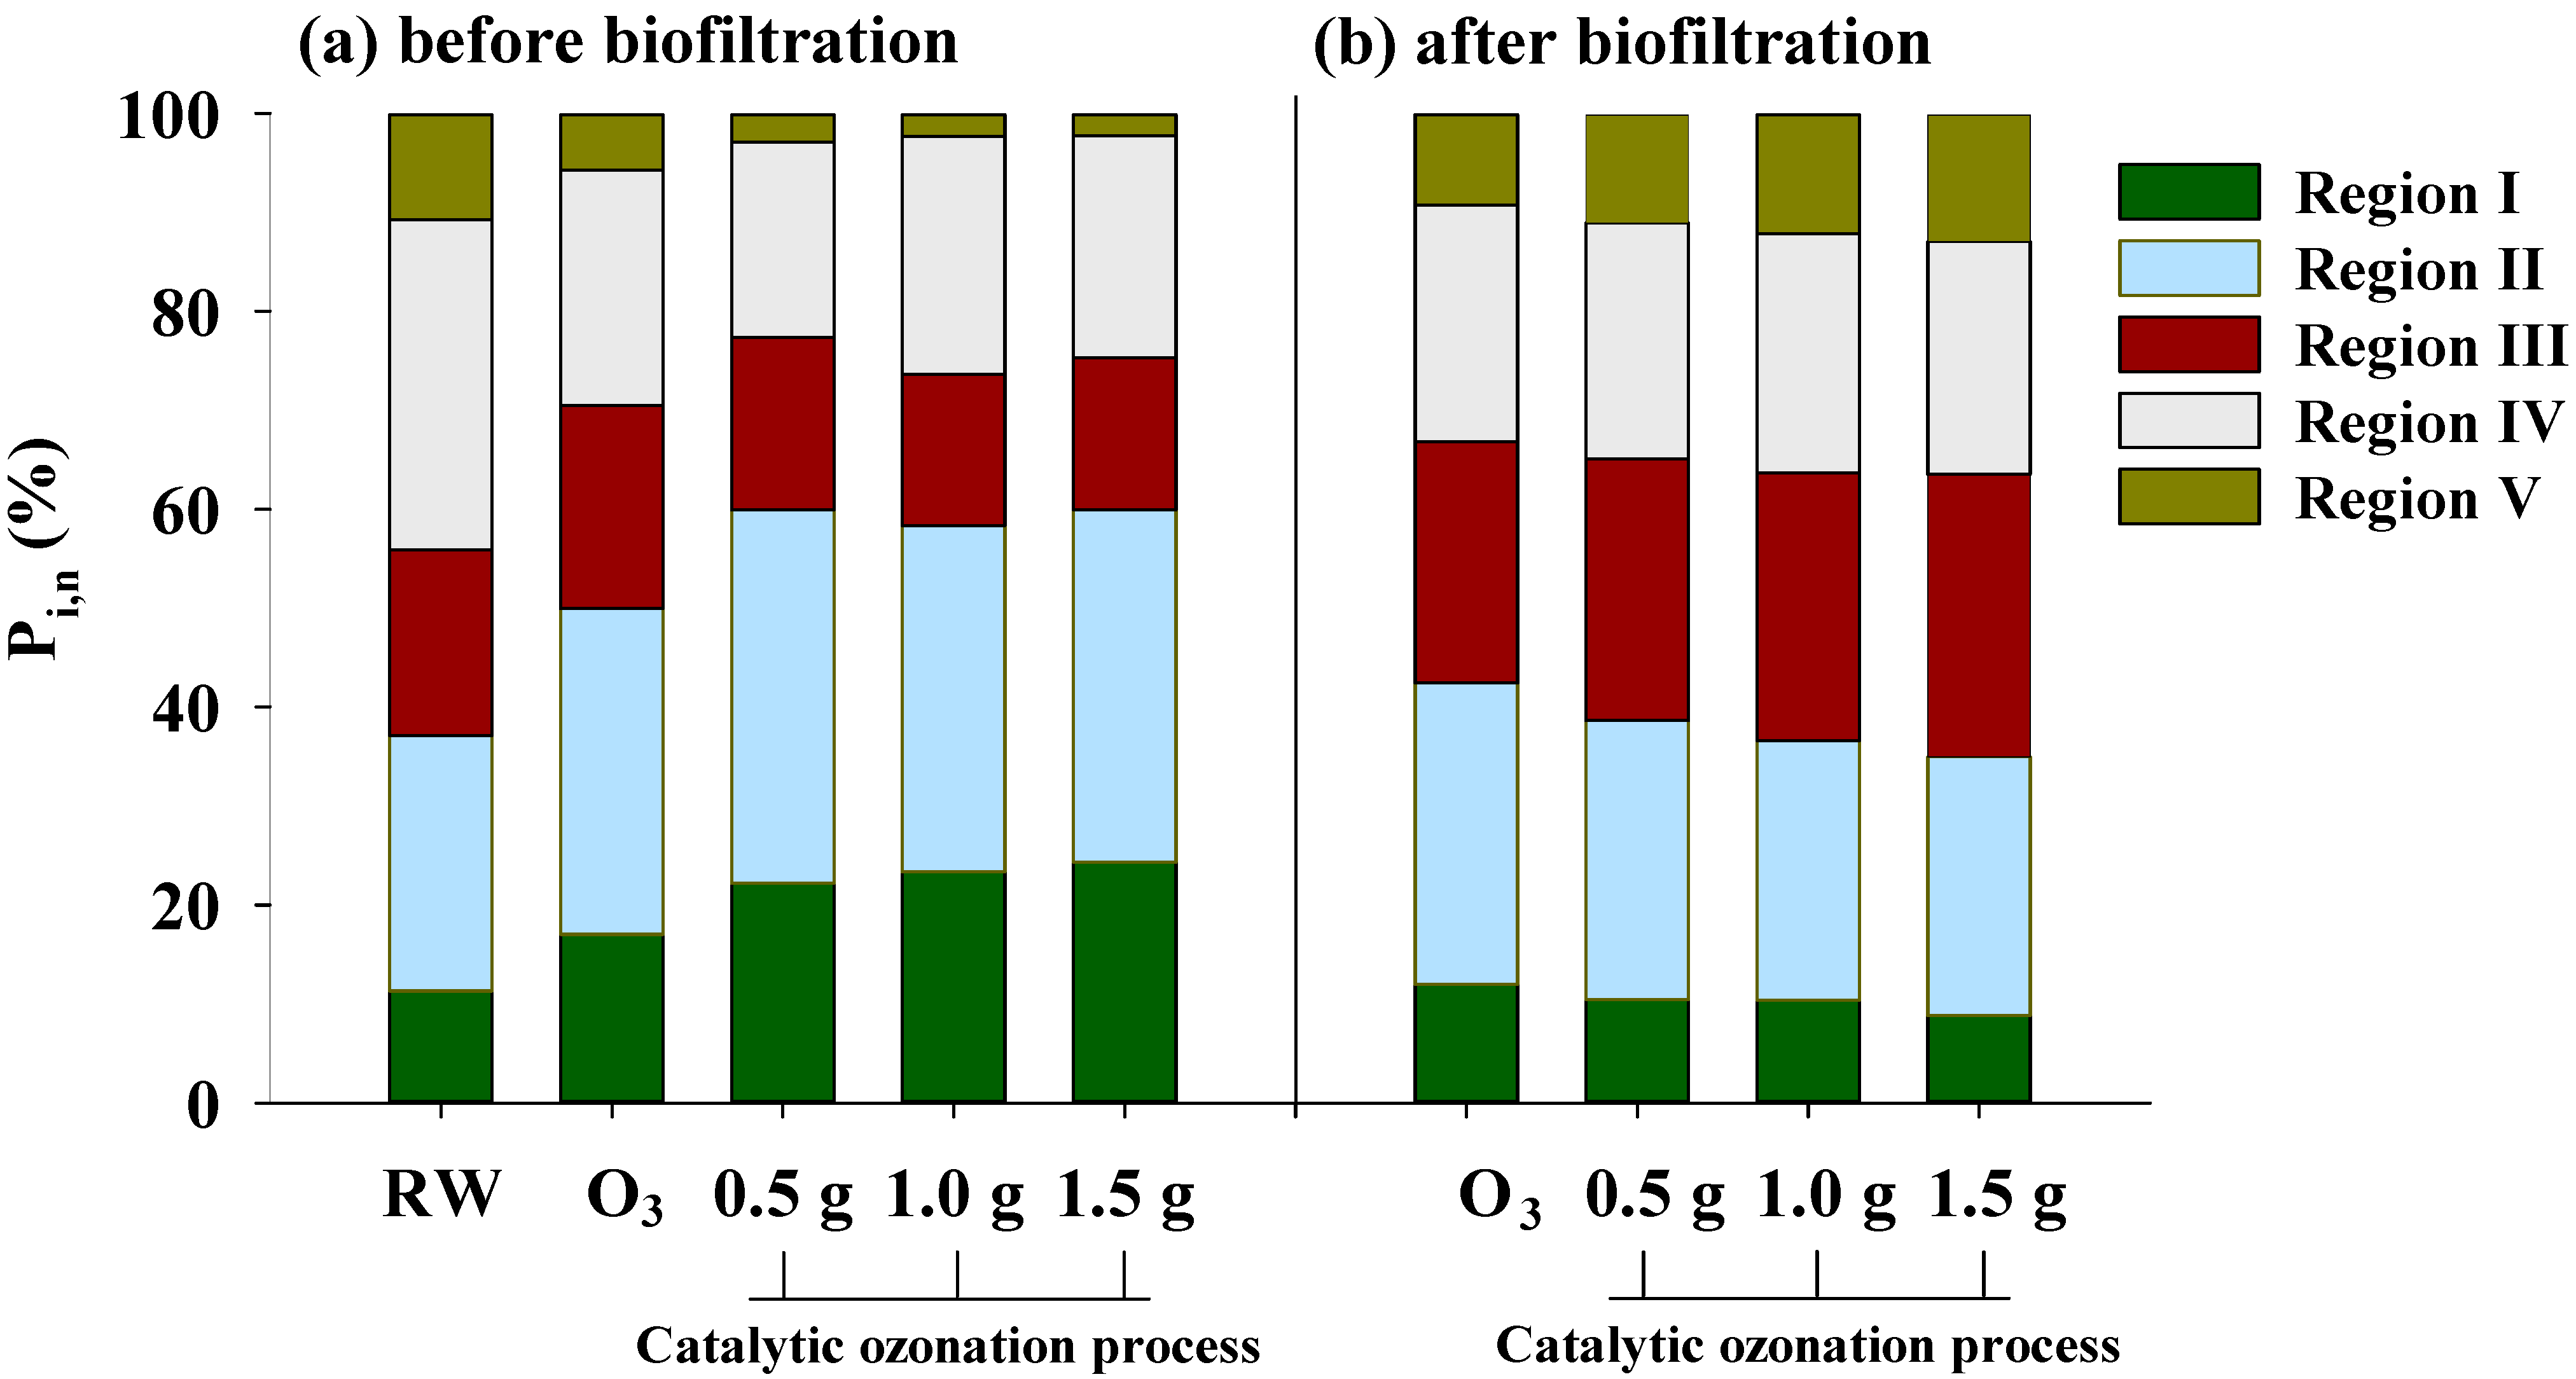
3.1. EEM Fluorescent Characteristics of DOM
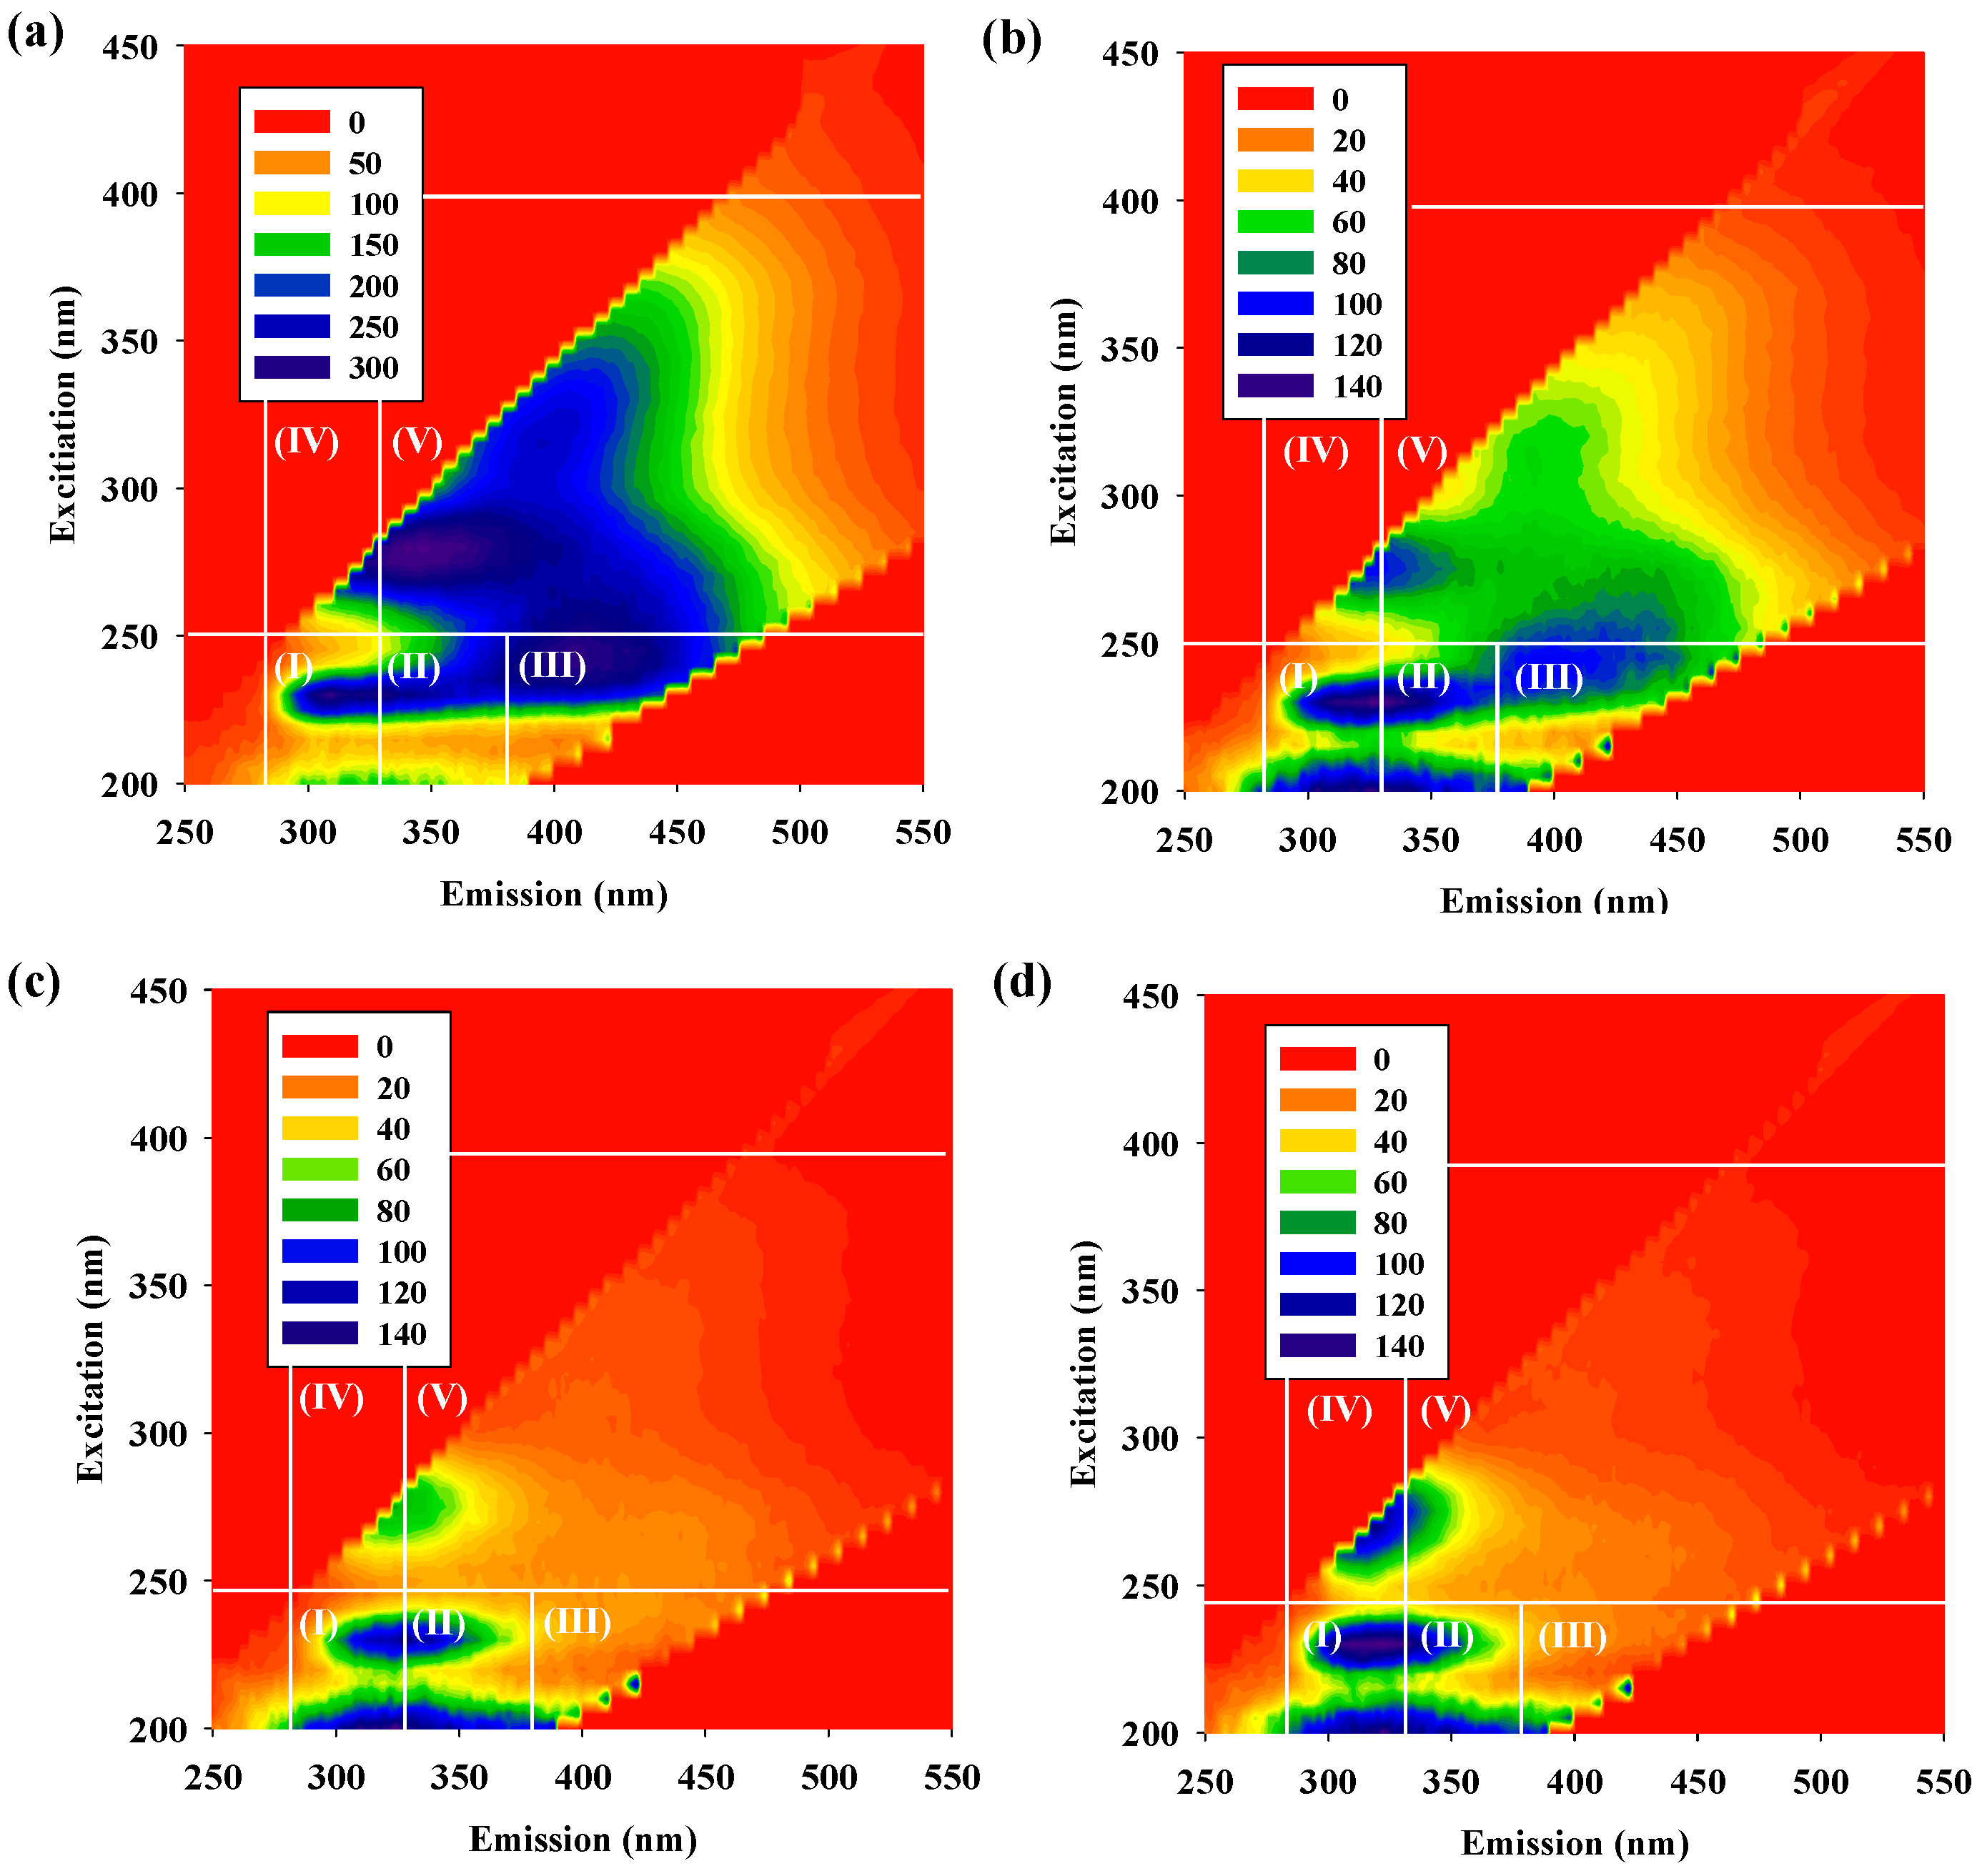
| Region I (×107) | Region II (×107) | Region III (×107) | Region IV (×107) | Region V (×107) | FI | |
|---|---|---|---|---|---|---|
| Raw water | 4.31 | 9.83 | 7.14 | 12.7 | 4.09 | 2.19 |
| Ozonation | 3.29 | 6.35 | 3.95 | 4.59 | 1.11 | 2.60 |
| HCOP-0.5 g | 2.96 | 5.02 | 2.33 | 2.63 | 3.87 | 2.69 |
| HCOP-1.0 g | 3.31 | 4.97 | 2.17 | 3.15 | 3.32 | 2.75 |
| HCOP-1.5 g | 3.42 | 5.00 | 2.15 | 3.42 | 3.16 | 2.83 |
| Ozonation/Bio. | 2.89 | 7.33 | 5.87 | 5.76 | 2.24 | 2.05 |
| HCOP-0.5 g/Bio. | 3.15 | 8.49 | 7.98 | 7.19 | 3.34 | 1.79 |
| HCOP-1.0 g/Bio. | 3.87 | 9.75 | 10.1 | 8.97 | 4.54 | 1.76 |
| HCOP-1.5 g/Bio. | 3.14 | 9.28 | 10.1 | 8.34 | 4.60 | 1.72 |
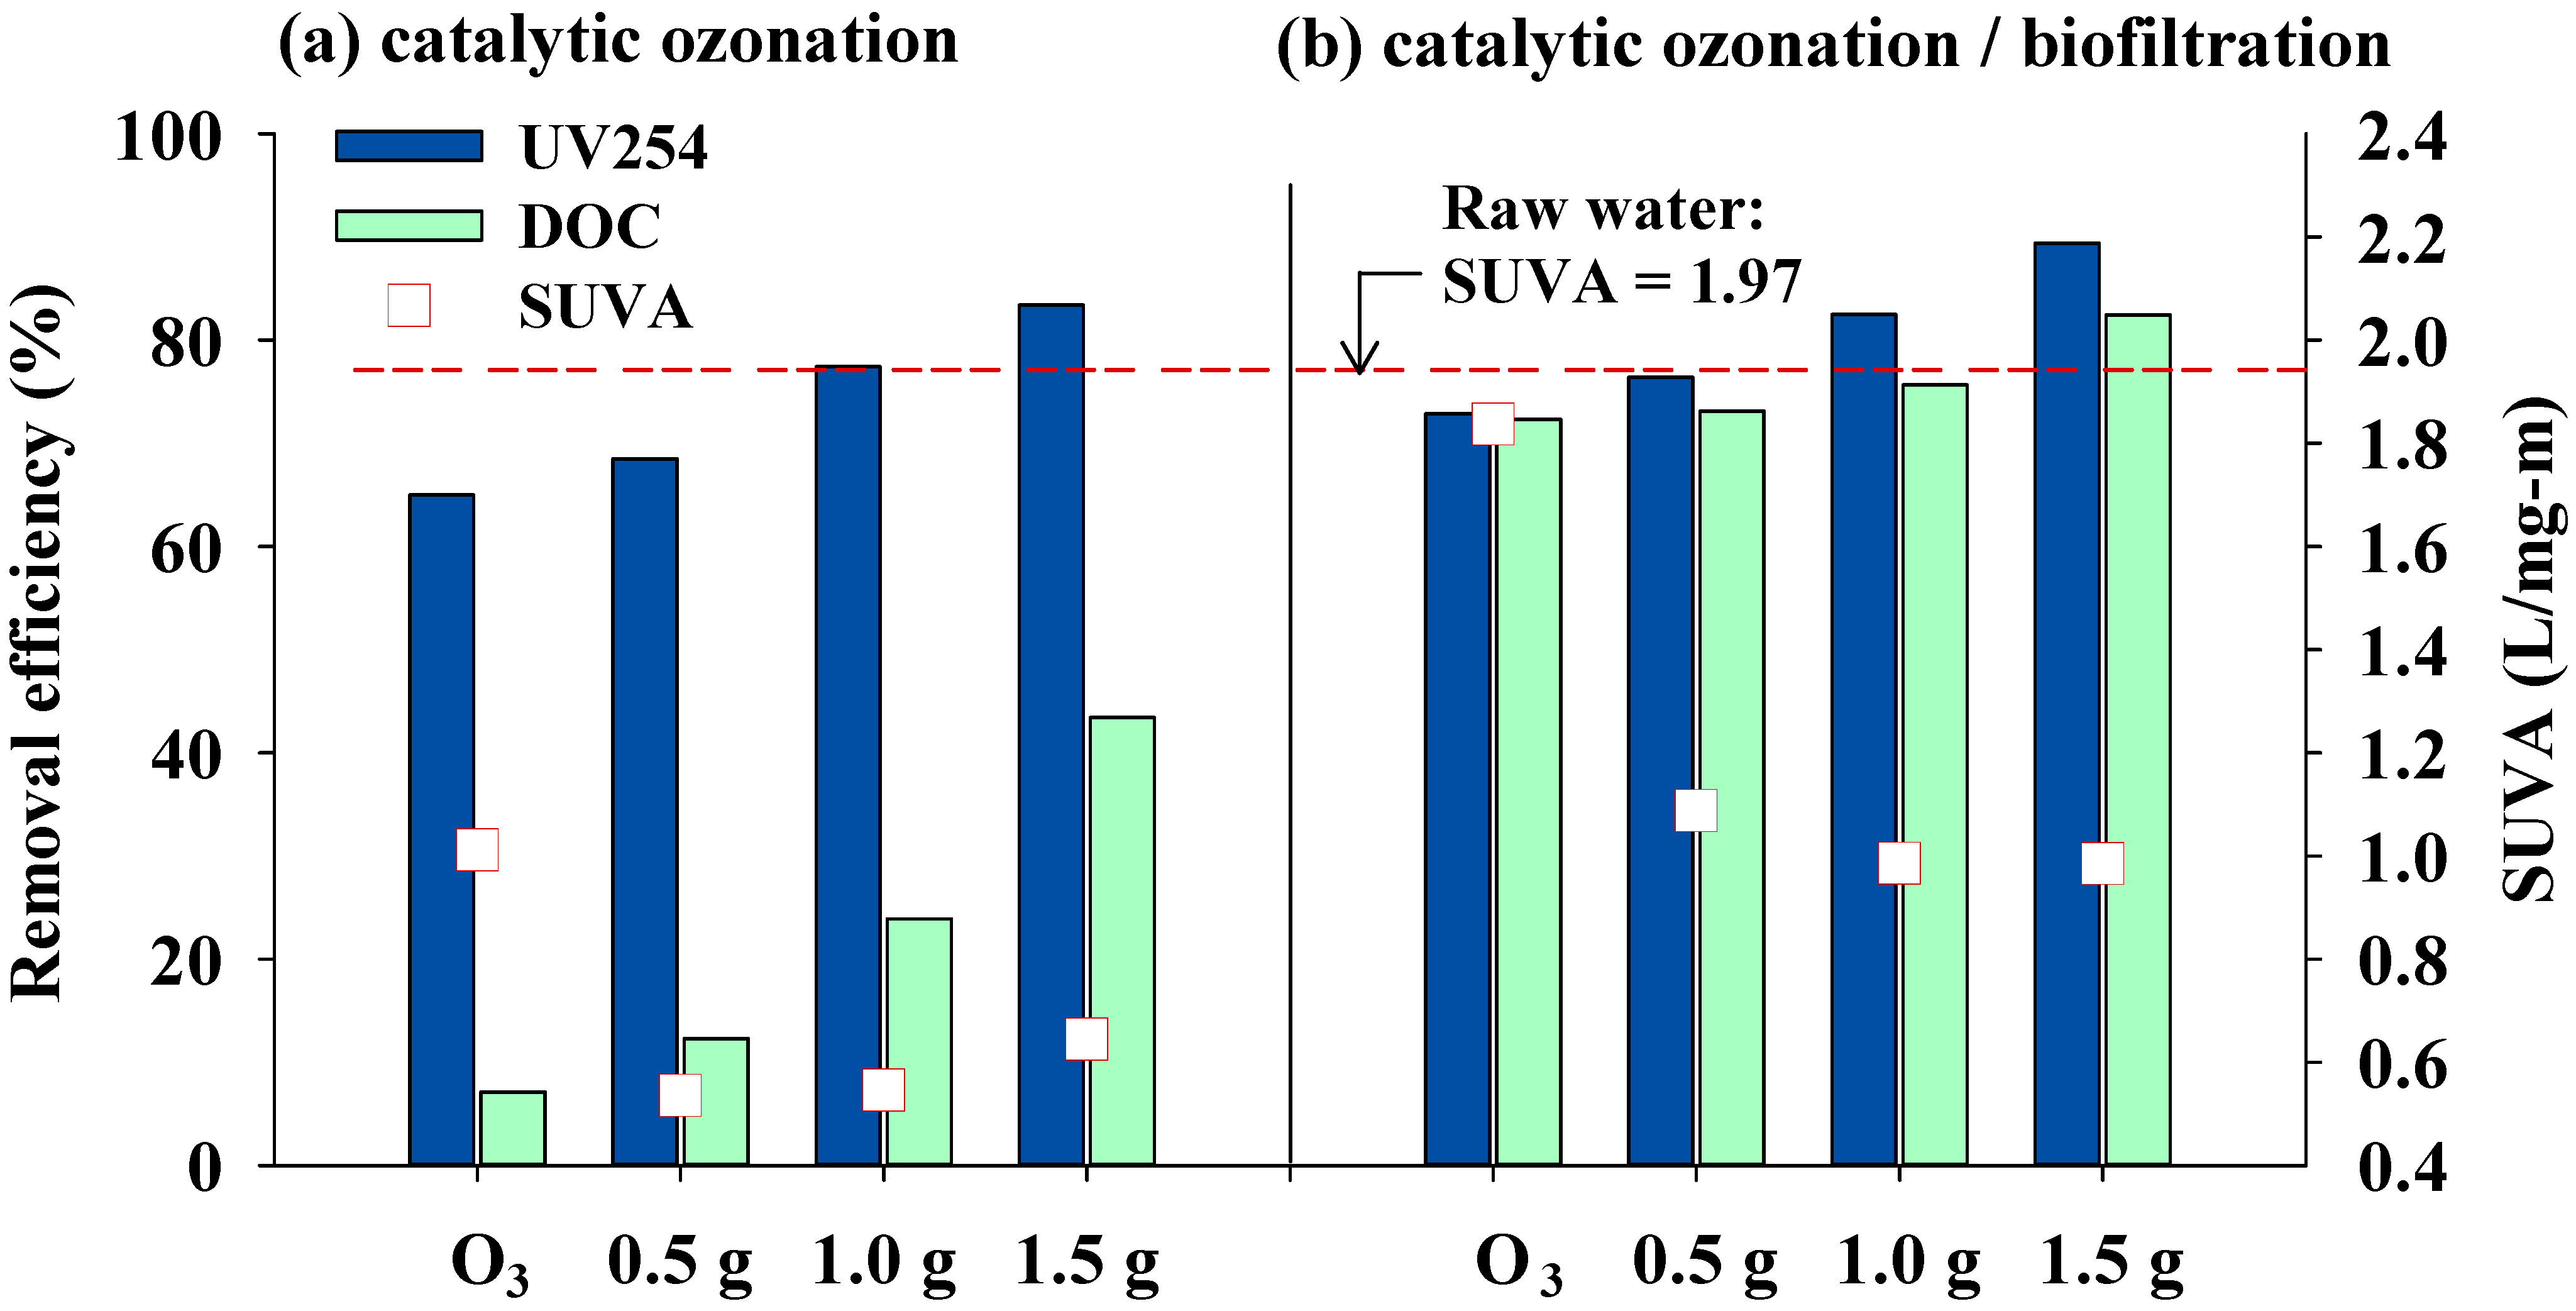
3.2. Effects of Catalytic Ozonation and Subsequent Biofiltration on Treated Water Quality
| DOC | UV254 | THMFP | HAAFP | |
|---|---|---|---|---|
| (mg·L−1) | (cm−1) | (µg·L−1) | (µg·L−1) | |
| Raw water | 9.21 ± 1.6 | 0.181 ± 0.036 | 233.5 ± 28.1 | 535.1 ± 23.4 |
| Ozonation | 8.5 ± 0.15 | 0.062 ± 0.001 | 179.3 ± 6.7 | 382.5 ± 4.6 |
| HCOP-0.5 | 8.0 ± 0.11 | 0.056 ± 0.002 | 147.0 ± 8.4 | 350.5 ± 7.7 |
| HCOP-1.0 | 7.0 ± 0.14 | 0.040 ± 0.000 | 143.0 ± 6.5 | 246.2 ± 6.4 |
| HCOP-1.5 | 5.2 ± 0.11 | 0.030 ± 0.001 | 102.7 ± 4.1 | 218.1 ± 8.9 |
| Ozonation/Bio. | 2.5 ± 0.15 | 0.048 ± 0.001 | 125.0 ± 7.9 | 112.2 ± 4.5 |
| HCOP-0.5/Bio. | 2.5 ± 0.12 | 0.042 ± 0.003 | 60.0 ± 8.8 | 68.3 ± 6.8 |
| HCOP-1.0/Bio. | 2.2 ± 0.13 | 0.031 ± 0.002 | 43.2 ± 7.2 | 66.1 ± 6.6 |
| HCOP-1.5/Bio. | 1.6 ± 0.11 | 0.019 ± 0.003 | 38.7 ± 4.2 | 64.0 ± 4.7 |
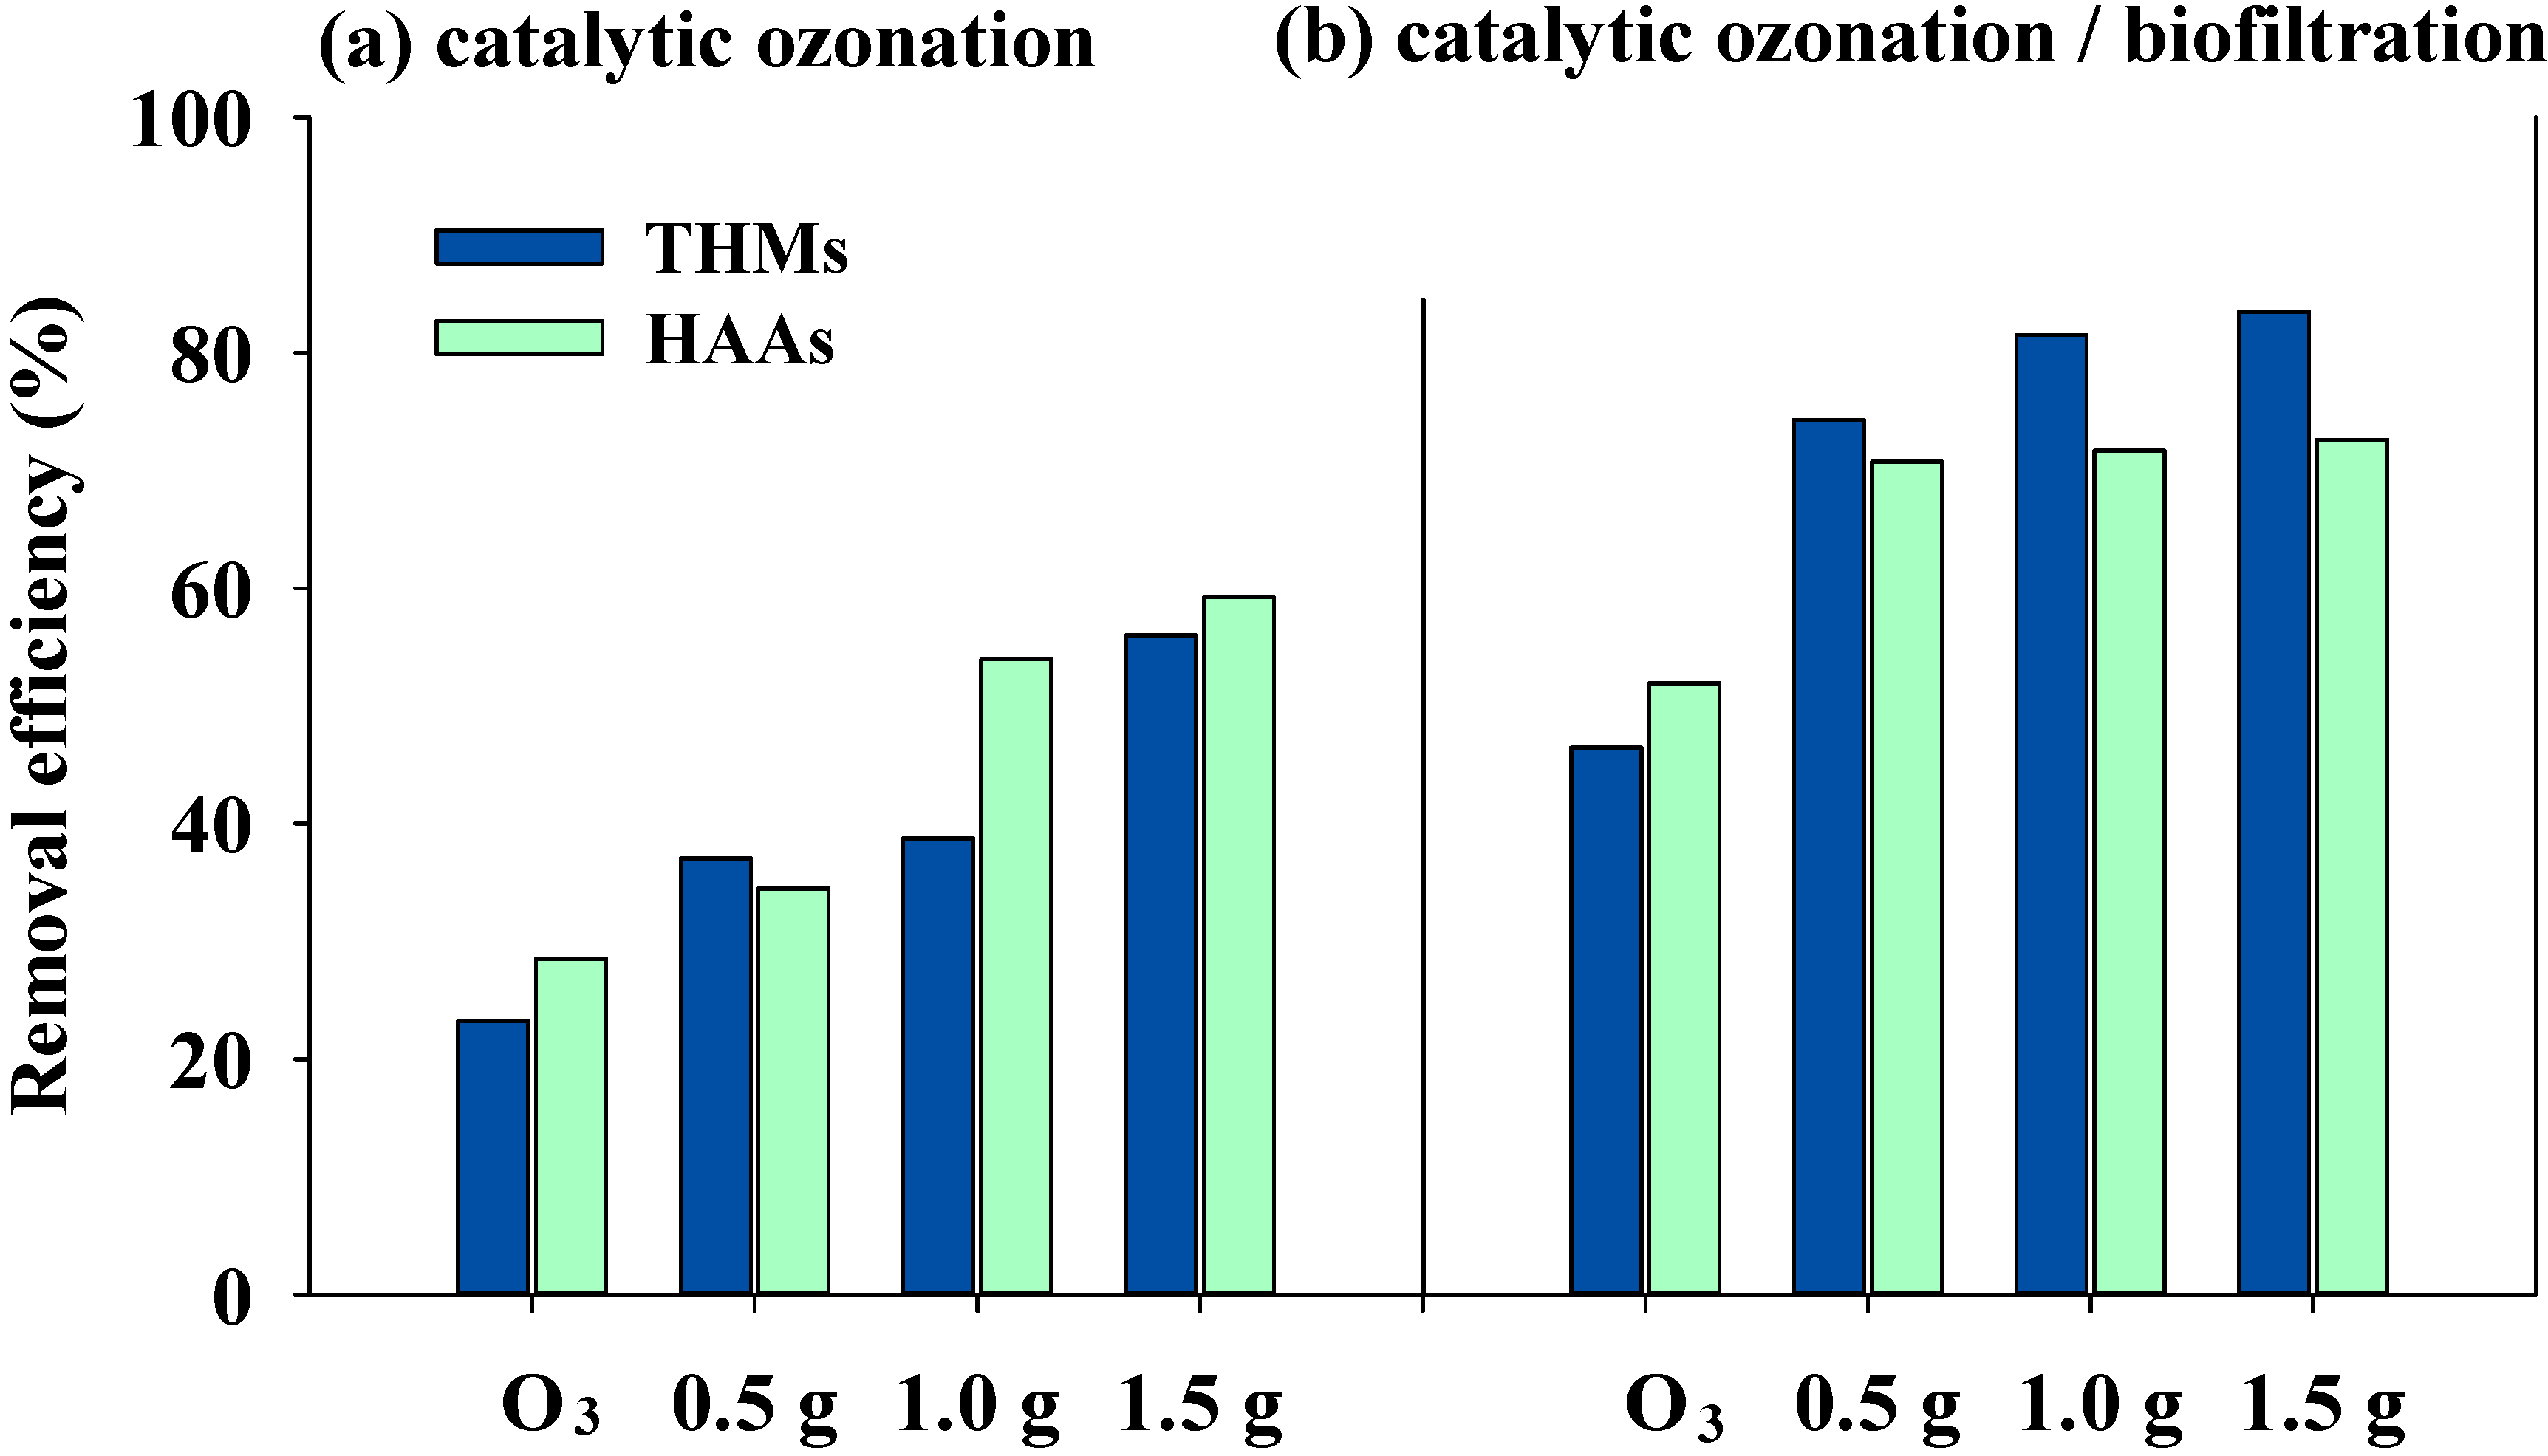
3.3. Effects of Catalytic Ozonation and Subsequent Biofiltration on DBP Formation

| CHCl3 (µg·L−1) | CHBrCl2 (µg·L−1) | CHBr2Cl (µg·L−1) | CHBr3 (µg·L−1) | THMs (µg·L−1) | |
|---|---|---|---|---|---|
| Raw water | 215.07 | 18.45 | 0 | 0 | 233.52 |
| Ozonation | 152.38 | 23.31 | 3.59 | 0 | 179.27 |
| HCOP-0.5 | 95.52 | 39.68 | 8.82 | 2.94 | 146.95 |
| HCOP-1.0 | 90.08 | 35.75 | 11.44 | 5.72 | 142.99 |
| HCOP-1.5 | 59.59 | 22.60 | 12.33 | 8.22 | 102.73 |
| Ozonation/Bio. | 68.75 | 41.25 | 12.50 | 2.50 | 125.00 |
| HCOP-0.5/Bio. | 30.62 | 14.41 | 10.21 | 4.80 | 60.03 |
| HCOP-1.0/Bio. | 19.02 | 10.80 | 8.64 | 4.75 | 43.22 |
| HCOP-1.5/Bio. | 14.69 | 10.05 | 8.51 | 5.41 | 38.66 |
| MCAA (µg·L−1) | MBAA (µg·L−1) | DCAA (µg·L−1) | TCAA (µg·L−1) | BCAA (µg·L−1) | BDCAA (µg·L−1) | DBAA (µg·L−1) | CDBAA (µg·L−1) | TBAA (µg·L−1) | HAA9 (µg·L−1) | |
|---|---|---|---|---|---|---|---|---|---|---|
| Raw water | 50.84 | 7.49 | 267.57 | 150.91 | 13.38 | 20.87 | 11.77 | 6.96 | 5.35 | 535.15 |
| Ozonation | 35.96 | 8.42 | 183.61 | 99.46 | 11.48 | 18.74 | 12.24 | 6.89 | 5.74 | 382.53 |
| HCOP-0.5 | 32.59 | 14.72 | 132.48 | 89.02 | 21.03 | 31.54 | 14.02 | 8.76 | 6.31 | 350.48 |
| HCOP-1.0 | 19.70 | 14.77 | 76.33 | 49.25 | 19.21 | 39.40 | 14.77 | 7.88 | 4.92 | 246.24 |
| HCOP-1.5 | 16.14 | 16.36 | 63.26 | 41.45 | 16.58 | 39.27 | 13.09 | 7.64 | 4.36 | 218.15 |
| Ozonation/Bio. | 18.01 | 12.86 | 113.71 | 56.60 | 20.58 | 18.01 | 12.86 | 2.06 | 2.57 | 257.27 |
| HCOP-0.5/Bio. | 9.39 | 12.06 | 94.67 | 32.88 | 12.84 | 10.65 | 10.18 | 2.04 | 1.88 | 156.58 |
| HCOP-1.0/Bio. | 8.78 | 12.27 | 60.60 | 30.61 | 12.58 | 10.91 | 11.82 | 2.27 | 1.67 | 151.52 |
| HCOP-1.5/Bio. | 7.33 | 12.90 | 54.24 | 27.85 | 12.17 | 13.49 | 13.19 | 3.23 | 2.20 | 146.59 |
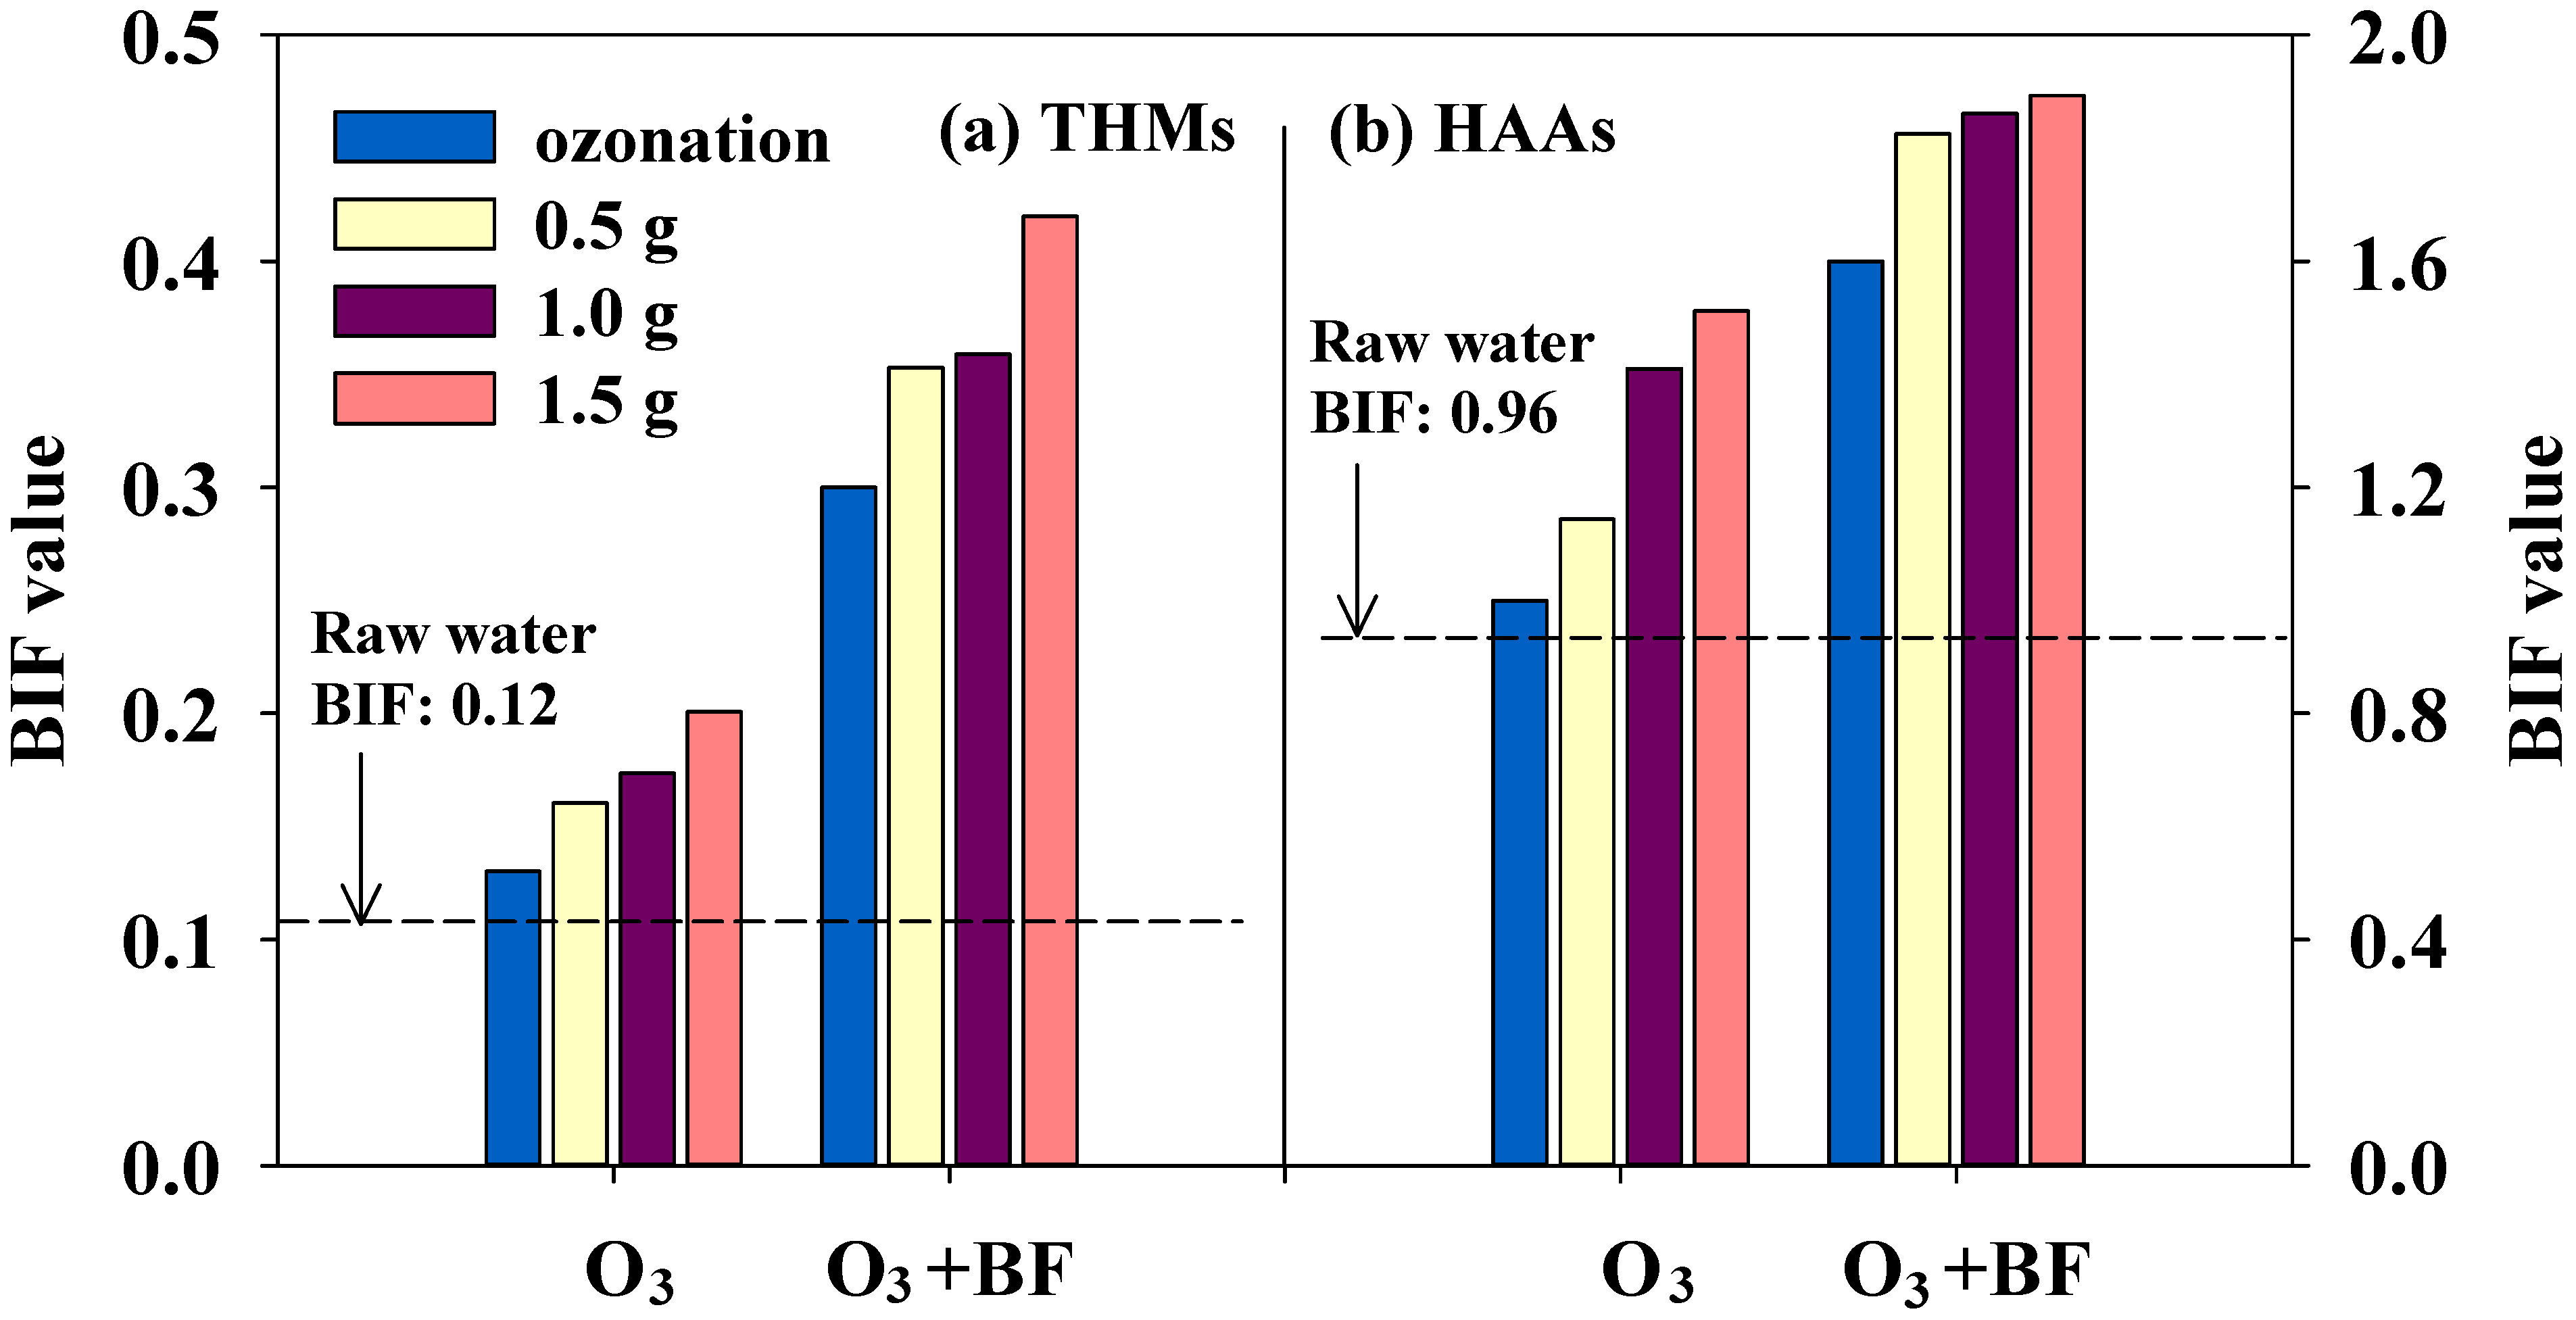
3.4. Bromine Incorporation Factor and Bromate Concentration
4. Conclusions
Acknowledgements
Author Contributions
Conflicts of Interest
References
- Richardson, S.D.; Plewa, M.J.; Wagner, E.D.; Schoeny, R.; DeMarini, D.M. Occurrence, genotoxicity, and carcinogenicity of regulated and emerging disinfection by-products in drinking water: A review and roadmap for research. Mutat. Res./Rev. in Mutat. Res. 2007, 636, 178–242. [Google Scholar]
- Pernet-Coudrier, B.; Varrault, G.; Saad, M.; Croue, J.P.; Dignac, M.F.; Mouchel, J.M. Characterisation of dissolved organic matter in Parisian urban aquatic systems: Predominance of hydrophilic and proteinaceous structures. Biogeochemistry 2011, 106, 89–106. [Google Scholar]
- Bond, T.; Goslan, E.H.; Parsons, S.A.; Jefferson, B. Treatment of disinfection by-product precursors. Environ. Technol. 2011, 32, 1–25. [Google Scholar] [CrossRef] [PubMed]
- Molnar, J.J.; Agbaba, J.R.; Dalmacija, B.D.; Klašnja, M.T.; Dalmacija, M.B.; Kragulj, M.M. A comparative study of the effects of ozonation and TiO2-catalyzed ozonation on the selected chlorine disinfection by-product precursor content and structure. Sci. Total Environ. 2012, 425, 169–175. [Google Scholar] [CrossRef] [PubMed]
- Chen, K.-C.; Wang, Y.-H. Control of disinfection by-product formation using ozone-based advanced oxidation processes. Environ. Technol. 2011, 33, 487–495. [Google Scholar] [CrossRef]
- Zhang, T.; Lu, J.F.; Ma, J.; Qiang, Z.M. Fluorescence spectroscopic characterization of DOM fractions isolated from a filtered river water after ozonation and catalytic ozonation. Chemosphere 2008, 71, 911–921. [Google Scholar] [CrossRef] [PubMed]
- Linlin, W.; Xuan, Z.; Meng, Z. Removal of dissolved organic matter in municipal effluent with ozonation, slow sand filtration and nanofiltration as high quality pre-treatment option for artificial groundwater recharge. Chemosphere 2011, 83, 693–699. [Google Scholar] [CrossRef] [PubMed]
- Chu, W.; Gao, N.; Yin, D.; Deng, Y.; Templeton, M.R. Ozone–Biological activated carbon integrated treatment for removal of precursors of halogenated nitrogenous disinfection by-products. Chemosphere 2012, 86, 1087–1091. [Google Scholar] [CrossRef] [PubMed]
- Chen, K.C.; Wang, Y.H.; Chang, Y.H. Using catalytic ozonation and biofiltration to decrease the formation of disinfection by-products. Desalination 2009, 249, 929–935. [Google Scholar] [CrossRef]
- Zhang Gerrity, D.; Gamage, S.; Holady, J.C.; Mawhinney, D.B.; Quinones, O.; Trenholm, R.A.; Snyder, S.A. Pilot-scale evaluation of ozone and biological activated carbon for trace organic contaminant mitigation and disinfection. Water Res. 2011, 45, 2155–2165. [Google Scholar]
- Wang, Y.-H.; Chen, K.-C.; Chen, C.-R. Combined catalytic ozonation and membrane system for trihalomethane control. Catal. Today 2013, 216, 261–267. [Google Scholar] [CrossRef]
- Qi, F.; Xu, B.; Chen, Z.; Feng, L.; Zhang, L.; Sun, D. Catalytic ozonation of 2-isopropyl-3-methoxypyrazine in water by γ-AlOOH and γ-Al2O3: Comparison of removal efficiency and mechanism. Chem. Eng. J. 2013, 219, 527–536. [Google Scholar] [CrossRef]
- Nawrocki, J.; Kasprzyk-Hordern, B. The efficiency and mechanisms of catalytic ozonation. Appl. Catal. B-Environ. 2010, 99, 27–42. [Google Scholar]
- Wang, J.B.; Zhou, Y.R.; Zhu, W.P.; He, X.W. Catalytic ozonation of dimethyl phthalate and chlorination disinfection by-product precursors over Ru/AC. J. Hazard. Mater. 2009, 166, 502–507. [Google Scholar] [CrossRef] [PubMed]
- Rodríguez, F.J.; Schlenger, P.; García-Valverde, M. A comprehensive structural evaluation of humic substances using several fluorescence techniques before and after ozonation. Part II: Evaluation of structural changes following ozonation. Sci. Total. Environ. 2014, 476–477, 731–742. [Google Scholar]
- Zhang, T.; Chen, W.; Ma, J.; Qiang, Z. Minimizing bromate formation with cerium dioxide during ozonation of bromide-containing water. Water Res. 2008, 42, 3651–3658. [Google Scholar] [CrossRef] [PubMed]
- Westerhoff, P.; Chao, P.; Mash, H. Reactivity of natural organic matter with aqueous chlorine and bromine. Water Res. 2004, 38, 1502–1513. [Google Scholar] [CrossRef] [PubMed]
- Chun, C.L.; Hozalski, R.M.; Arnold, W.A. Degradation of drinking water disinfection byproducts by synthetic goethite and magnetite. Environ. Sci. Technol. 2005, 39, 8525–8532. [Google Scholar] [CrossRef] [PubMed]
- Hassan, K.; Bower, K.; Miller, C. Iron oxide enhanced chlorine decay and disinfection by-product formation. J. Environ. Eng. 2006, 132, 1609–1616. [Google Scholar] [CrossRef]
- Kaplan Bekaroglu, S.S.; Yigit, N.O.; Karanfil, T.; Kitis, M. The adsorptive removal of disinfection by-product precursors in a high-SUVA water using iron oxide-coated pumice and volcanic slag particles. J. Hazard. Mater. 2010, 183, 389–394. [Google Scholar]
- Park, J.S.; Choi, H.C.; Ahn, K.H.; Kang, J.W. Removal mechanism of natural organic matter and organic acid by ozone in the presence of goethite. Ozone-Sci. Eng. 2004, 26, 141–151. [Google Scholar]
- Sui, M.H.; Sheng, L.; Lu, K.X.; Tian, F. FeOOH catalytic ozonation of oxalic acid and the effect of phosphate binding on its catalytic activity. Appl. Catal. B-Environ. 2010, 96, 94–100. [Google Scholar]
- Chen, W.; Westerhoff, P.; Leenheer, J.A.; Booksh, K. Fluorescence excitation-emission matrix regional integration to quantify spectra for dissolved organic matter. Environ. Sci. Technol. 2003, 37, 5701–5710. [Google Scholar] [CrossRef] [PubMed]
- APHA. Standard Methods for the Examination of Water and Wastewater, 20th ed.; American Water Works Association & Water Environment Federation, APHA-AWWA-WEF: Washington, DC, WA, USA, 1998. [Google Scholar]
- USEPA. Determination of Haloacetic Acid and Dalapon in Drinking Water by Liquid-Liquid Microextraction, Derivatization, and Gas Chromatography with Electron Capture Detection, Method 552.2 (Revision 1.0). Available online: http://www.caslab.com/EPA-Methods/PDF/552_2.pdf (accessed on 20 May 2014).
- USEPA. Determination of Inorganic Anions in Drinking Water by Ion Chromatography, Method 300.1, (Revision 1.0). Available online: http://water.epa.gov/scitech/drinkingwater/labcert/upload/met300.pdf (accessed on 20 May 2014).
- Chu, W.-H.; Gao, N.-Y.; Templeton, M.R.; Yin, D.-Q. Comparison of inclined plate sedimentation and dissolved air flotation for the minimisation of subsequent nitrogenous disinfection by-product formation. Chemosphere 2011, 83, 647–651. [Google Scholar] [CrossRef] [PubMed]
- Chen, K.-C.; Wang, Y.-H. The effects of Fe–Mn oxide and TiO2/α-Al2O3 on the formation of disinfection by-products in catalytic ozonation. Chem. Eng. J. 2014, 253, 84–92. [Google Scholar] [CrossRef]
- Coble, P.G. Characterization of marine and terrestrial DOM in seawater using excitation-emission matrix spectroscopy. Mar. Chem. 1996, 51, 325–346. [Google Scholar] [CrossRef]
- Senesi, N. Molecular and quantitative aspects of the chemistry of fulvic acid and its interactions with metal ions and organic chemicals : Part II. The fluorescence spectroscopy approach. Analytica Chimica Acta 1990, 232, 77–106. [Google Scholar] [CrossRef]
- Świetlik, J.; Sikorska, E. Application of fluorescence spectroscopy in the studies of natural organic matter fractions reactivity with chlorine dioxide and ozone. Water Res. 2004, 38, 3791–3799. [Google Scholar]
- Zhang, T.; Lu, J.F.; Ma, J.; Qiang, Z.M. Comparative study of ozonation and synthetic goethite-catalyzed ozonation of individual NOM fractions isolated and fractionated from a filtered river water. Water Res. 2008, 42, 1563–1570. [Google Scholar] [CrossRef] [PubMed]
- Her, N.; Amy, G.; McKnight, D.; Sohn, J.; Yoon, Y. Characterization of DOM as a function of MW by fluorescence EEM and HPLC-SEC using UVA, DOC, and fluorescence detection. Water Res. 2003, 37, 4295–4303. [Google Scholar] [CrossRef] [PubMed]
- McKnight, D.M.; Boyer, E.W.; Westerhoff, P.K.; Doran, P.T.; Kulbe, T.; Andersen, D.T. Spectrofluorometric characterization of dissolved organic matter for indication of precursor organic material and aromaticity. Limnol. Oceanogr. 2001, 46, 38–48. [Google Scholar] [CrossRef]
- Wen, G.; Wang, S.-J.; Ma, J.; Huang, T.-L.; Liu, Z.-Q.; Zhao, L.; Su, J.-F. Enhanced ozonation degradation of di-n-butyl phthalate by zero-valent zinc in aqueous solution: Performance and mechanism. J. Hazard. Mater. 2014, 265, 69–78. [Google Scholar] [CrossRef] [PubMed]
- Zhang, H.; Qu, J.H.; Liu, H.J.; Zhao, X. Characterization of isolated fractions of dissolved organic matter from sewage treatment plant and the related disinfection by-products formation potential. J. Hazard. Mater. 2009, 164, 1433–1438. [Google Scholar] [CrossRef] [PubMed]
- Lou, J.C.; Tseng, W.B.; Wu, M.C.; Han, J.Y.; Chen, B.H. Removal of disinfection by-products in raw water using a biological powder-activated carbon system. J. Environ. Sci. Health Part. A-Toxic/Hazard. Subst. Environ. Eng. 2012, 47, 1478–1485. [Google Scholar]
- Ates, N.; Kitis, M.; Yetis, U. Formation of chlorination by-products. in waters with low SUVA-correlations with SUVA and differential UV spectroscopy. Water Res. 2007, 41, 4139–4148. [Google Scholar]
- Bekaroglu, S.S.K.; Yigit, N.O.; Karanfil, T.; Kitis, M. The adsorptive removal of disinfection by-product precursors in a high-SUVA water using iron oxide-coated pumice and volcanic slag particles. J. Hazard. Mater. 2010, 183, 389–394. [Google Scholar] [CrossRef] [PubMed]
- Wu, J.J.; Muruganandham, M.; Chang, L.T.; Lee, G.J.; Batalova, V.N.; Mokrousov, G.M. Catalytic Ozonation of Oxalic Acid Using SrTiO3 Catalyst. Ozone-Sci. Eng. 2011, 33, 74–79. [Google Scholar]
- Ikhlaq, A.; Brown, D.R.; Kasprzyk-Hordern, B. Mechanisms of catalytic ozonation on alumina and zeolites in water: Formation of hydroxyl radicals. Appl. Catal. B: Environ. 2012, 123–124, 94–106. [Google Scholar]
- Chaiket, T.; Singer, P.C.; Miles, A.; Moran, M.; Pallotta, C. Effectiveness of coagulation, ozonation, and biofiltration in controlling DBPs. J. Am. Water Works Assoc. 2002, 94, 81–95. [Google Scholar]
- Yavich, A.A.; Masten, S.J. Use of ozonation and FBT to control THM precursors. J.Am. Water Works Assoc. 2003, 95, 159–171. [Google Scholar]
- Yavich, A.A.; Lee, K.H.; Chen, K.C.; Pape, L.; Masten, S.J. Evaluation of biodegradability of NOM after ozonation. Water Res. 2004, 38, 2839–2846. [Google Scholar] [CrossRef] [PubMed]
- Koudjonou, B.; LeBel, G.L.; Dabeka, L. Formation of halogenated acetaldehydes, and occurrence in Canadian drinking water. Chemosphere 2008, 72, 875–881. [Google Scholar] [CrossRef] [PubMed]
- Bessiere, Y.; Jefferson, B.; Goslan, O.; Bacchin, P. Effect of hydrophilic/hydrophobic fractions of natural organic matter on irreversible fouling of membranes. Desalination 2009, 249, 182–187. [Google Scholar] [CrossRef] [Green Version]
- Cowman, G.A.; Singer, P.C. Effect of bromide ion on haloacetic acid speciation resulting from chlorination and chloramination of aquatic humic substances. Environ. Sci. Technol. 1995, 30, 16–24. [Google Scholar] [CrossRef]
- Hua, G.; Reckhow, D.A. Evaluation of bromine substitution factors of DBPs during chlorination and chloramination. Water Res. 2012, 46, 4208–4216. [Google Scholar] [CrossRef] [PubMed]
- Allard, S.; Nottle, C.E.; Chan, A.; Joll, C.; von Gunten, U. Ozonation of iodide-containing waters: Selective oxidation of iodide to iodate with simultaneous minimization of bromate and I-THMs. Water Res. 2013, 47, 1953–1960. [Google Scholar] [CrossRef] [PubMed]
- Kingsbury, R.S.; Singer, P.C. Effect of magnetic ion exchange and ozonation on disinfection by-product formation. Water Res. 2013, 47, 1060–1072. [Google Scholar] [CrossRef] [PubMed]
© 2014 by the authors; licensee MDPI, Basel, Switzerland. This article is an open access article distributed under the terms and conditions of the Creative Commons Attribution license (http://creativecommons.org/licenses/by/3.0/).
Share and Cite
Wang, Y.-H.; Chen, K.-C. Removal of Disinfection By-Products from Contaminated Water Using a Synthetic Goethite Catalyst via Catalytic Ozonation and a Biofiltration System. Int. J. Environ. Res. Public Health 2014, 11, 9325-9344. https://doi.org/10.3390/ijerph110909325
Wang Y-H, Chen K-C. Removal of Disinfection By-Products from Contaminated Water Using a Synthetic Goethite Catalyst via Catalytic Ozonation and a Biofiltration System. International Journal of Environmental Research and Public Health. 2014; 11(9):9325-9344. https://doi.org/10.3390/ijerph110909325
Chicago/Turabian StyleWang, Yu-Hsiang, and Kuan-Chung Chen. 2014. "Removal of Disinfection By-Products from Contaminated Water Using a Synthetic Goethite Catalyst via Catalytic Ozonation and a Biofiltration System" International Journal of Environmental Research and Public Health 11, no. 9: 9325-9344. https://doi.org/10.3390/ijerph110909325