Reliability of Urinary Excretion Rate Adjustment in Measurements of Hippuric Acid in Urine


Abstract
:1. Introduction
2. Materials and Methods
3. Results

| Mean ± SD | Range | |||
|---|---|---|---|---|
| Age (years) | 30.4 ± 2.9 | 25–36 | ||
| BMI | 21.5 ± 3.0 | 17.7–29 | ||
| short-term samples | spot samples | |||
| mean ± SD | range | mean ± SD | range | |
| SG | 1018 ± 9 | 1003–1032 | 1020 ± 7 | 1004–1033 |
| creatinine mmol l−1 | 12.6 ± 8.9 | 1.2–30.2 | 14.0 ± 7.6 | 1.4–31.8 |
| HAun mg l−1 | 390.8 ± 427.4 | 9–1683 | 505.9 ± 606.3 | 25–2146 |
| HASG* mg l−1 | 533.3 ± 644.3 | 58–3253 | 612.1 ± 858.4 | 67–3737 |
| HAcn mg mmol−1 | 49.1 ± 85.7 | 3–409 | 38.5 ± 51.2 | 4–221 |
| HAUER mg | 332.7 ± 443.7 | 28–2379 | ||
| Part A | Equation | r | p | C.I. 95% * |
|---|---|---|---|---|
| HAun spot vs. HAun short time | y = 1.159x + 52.757 | 0.817 | <0.0001 | 0.651–0.908 |
| HASG spot vs. HASG short time | y = 1.060x + 46.596 | 0.796 | <0.0001 | 0.615–0.897 |
| HAcn spot vs. HAcn short time | y = 0.405x + 18.546 | 0.679 | <0.0001 | 0.427–0.833 |
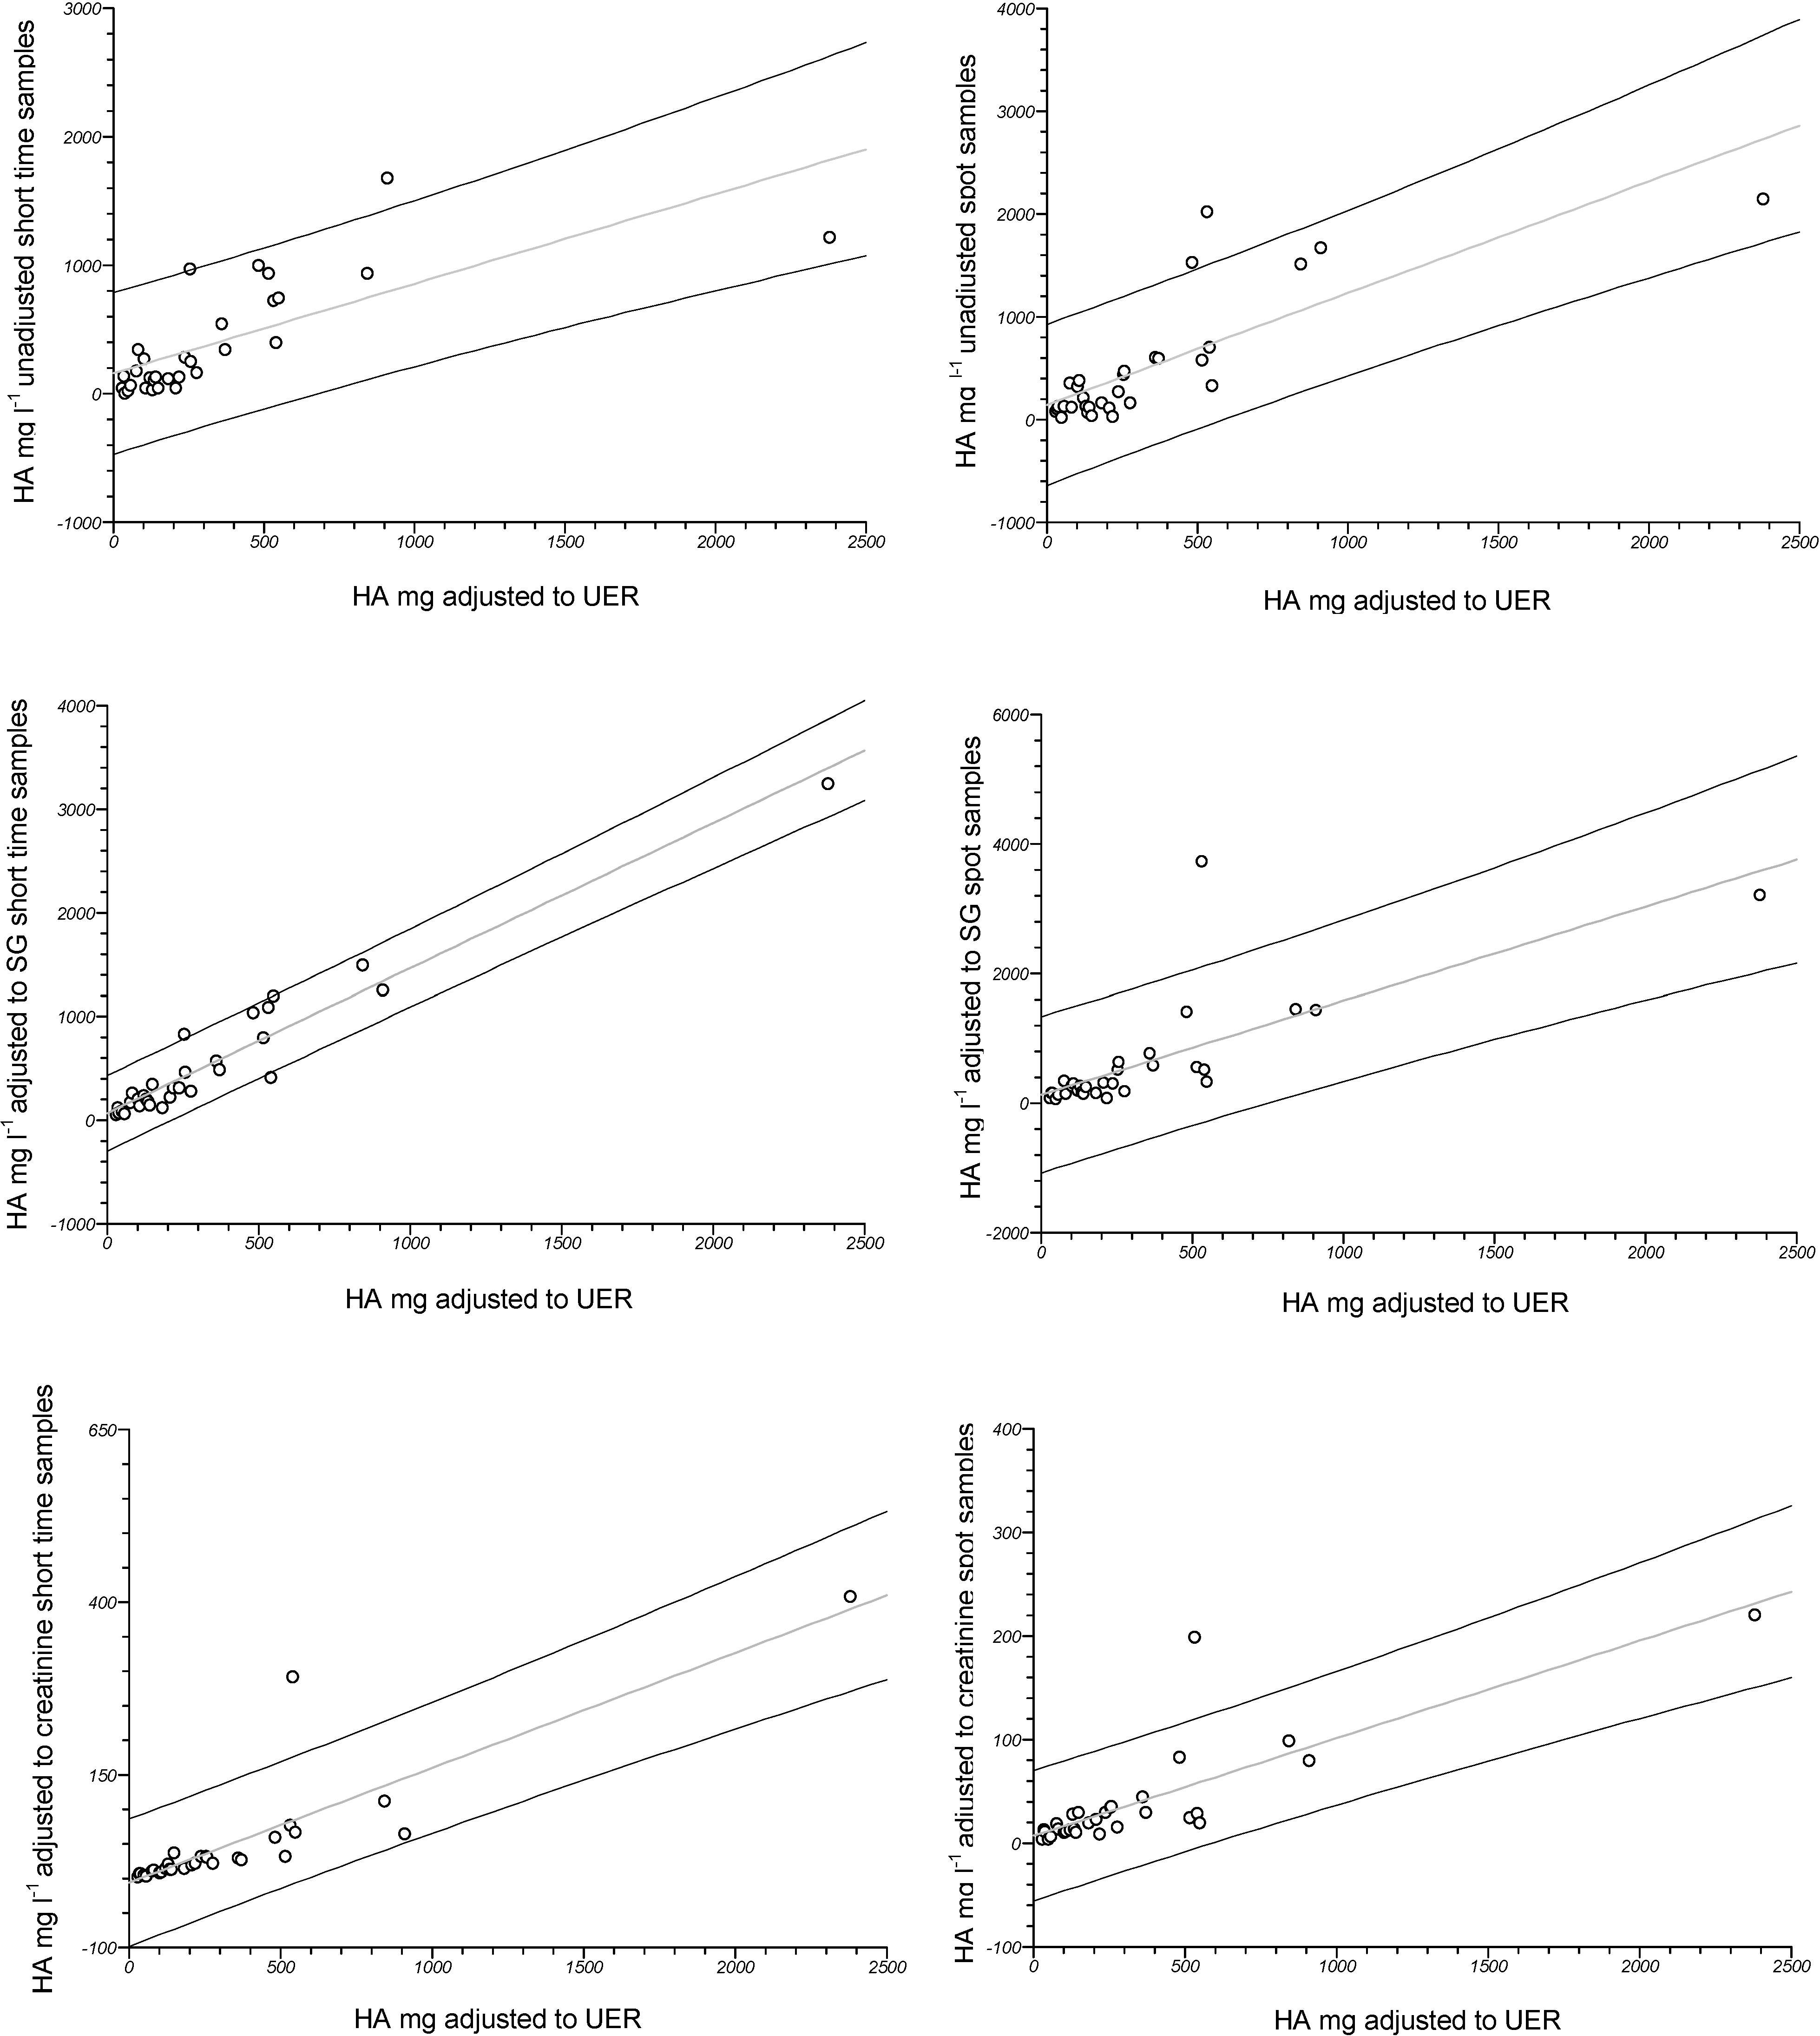
| Part B | Equation | r | p | C.I. 95% * |
| HASG short time vs. HAun short time | y = 1.208x + 60.964 | 0.802 | <0.0001 | 0.625–0.900 |
| HASG spot vs. HAun spot | y = 1.319x − 55.205 | 0.932 | <0.0001 | 0.862–0.967 |
| HAcn short time vs. HAun short time | y = 0.098x + 10.790 | 0.489 | =0.0052 | 0.163–0.719 |
| HAcn spot vs. HAun spot | y = 0.077x − 0.737 | 0.918 | <0.0001 | 0.835–0.960 |
| HAcn short time vs. HASG short time | y = 0.103x − 5.980 | 0.777 | <0.0001 | 0.583–0.887 |
| HAcn spot vs. HASG spot | y = 0.059x + 2.513 | 0.985 | <0.0001 | 0.968–0.993 |
4. Discussion
5. Conclusions
Acknowledgements
Author Contributions
Conflicts of Interest
References
- Rigas, M.L.; Okino, M.S.; Quackenboss, J.J. Use of a pharmacokinetic model to assess chlorpyrifos exposure and dose in children, based on urinary biomarker measurements. Toxicol. Sci. 2001, 61, 374–381. [Google Scholar] [CrossRef]
- Barr, D.B.; Wilder, L.C.; Caudill, S.P.; Gonzalez, A.J.; Needham, L.L.; Pirkle, J.L. Urinary creatinine concentrations in the U.S. population: Implications for urinary biologic monitoring measurements. Environ. Health Perspect. 2005, 113, 192–200. [Google Scholar]
- Boeniger, M.F.; Lowry, L.K.; Rosenberg, J. Interpretation of urine results used to assess chemical exposure with emphasis on creatinine adjustments: a review. Am. Ind. Hyg. Assoc. J. 1993, 54, 615–627. [Google Scholar] [CrossRef]
- Sedivec, V.; Flek, J. Exposure test for xylenes. Int. Arch. Occup. Environ. Health 1976, 37, 219–232. [Google Scholar] [CrossRef]
- Tola, S.; Kilpio, J.; Virtano, M.; Haapa, K. Urinary chromium as an indicator of the exposure of welders to chromium. Scand. J. Work Environ. Health 1977, 3, 192–202. [Google Scholar] [CrossRef]
- Elkins, H.B.; Pagnotto, L.D.; Smith, H.L. Concentration adjustments in urinalysis. Am. Ind. Hyg. Assoc. J. 1974, 35, 559–565. [Google Scholar] [CrossRef]
- Buratti, M.; Caravelli, G.; Pellegrino, O.; Xaiz, D.; Valla, C.; Giampiccolo, R.; Colombi, A. Determinazione degli acidi ippurico e metilippurico mediante cromatografia liquida ad alta pressione: Confronto tra metodi cromatografici e colorimetrici. Med. Lav. 1988, 7, 489–499. [Google Scholar]
- Villanueva, M.B.G.; Jonai, H.; Kanno, S.; Takeuchi, Y. Dietary sources and background levels of hippuric acid in urine: comparison of Philippine and Japanese levels. Ind. Health 1994, 32, 239–246. [Google Scholar] [CrossRef]
- Kawamoto, T.; Koga, M.; Oyama, T.; Kodama, Y. Habitual and genetic factors that affect urinary background levels of biomarkers for organic solvent exposure. Arch. Environ. Contam. Toxicol. 1996, 30, 114–120. [Google Scholar] [CrossRef]
- Phipps, A.N.; Stewart, J.; Wright, B.; Wilson, I.D. Effect of diet on the urinary excretion of hippuric acid and other dietary-derived aromatics in rat. A complex interaction between diet, gut microflora and substrate specificity. Xenobiotica. 1998, 28, 527–537. [Google Scholar] [CrossRef]
- Alvarez-Leite, E.M.; Duarte, A.; Barroca, M.M.; Silveira, J.N. Possible effects of drinking and smoking habits on hippuric acid levels in urine of adults with no occupational toluene exposure. J. Occup. Health 1999, 41, 112–114. [Google Scholar] [CrossRef]
- Christiani, D.C.; Chang, S.H.; Chun, B.C.; Lee, W.J. Urinary excretion of hippuric acid after consumption of nonalcoholic beverages. Int. J. Occup. Environ. Health 2000, 6, 238–242. [Google Scholar] [CrossRef]
- Clifford, M.N.; Copeland, E.L.; Bloxsidge, J.P.; Mitchell, L.A. Hippuric acid as a major excretion product associated with black tea consumption. Xenobiotica. 2000, 30, 317–326. [Google Scholar] [CrossRef]
- Mulder, T.P.; Rietveld, A.G.; Amelsvoort, J.M. Consumption of both black tea and green tea results in an increase in the excretion of hippuric acid into urine. Am. J. Clin. Nutr. 2005, 81, 256S–260S. [Google Scholar]
- Krupp, D.; Doberstein, N.; Shi, L.; Remer, T. Hippuric acid in 24-hour urine collections is a potential biomarker for fruit and vegetable consumption in healthy children and adolescents. J. Nutr. 2012, 142, 1314–1320. [Google Scholar] [CrossRef]
- Araki, S. Effects of urinary volume on urinary concentrations of lead, δ-aminolaevulinic acid, coproporphyrin, creatinine, and total solutes. Br. J. Ind. Med. 1980, 37, 50–54. [Google Scholar]
- Trevisan, A.; Nicoletto, G.; Maso, S.; Grandesso, G.; Odynets, A.; Secondin, L. Biological monitoring of cadmium exposure: reliability of spot urine samples. Int. Arch. Occup. Environ. Health 1994, 65, 373–375. [Google Scholar] [CrossRef]
- Araki, S.; Sata, F.; Murata, K. Adjustment for urinary flow rate: an improved approach to biological monitoring. Int. Arch. Occup. Environ. Health 1990, 62, 471–477. [Google Scholar] [CrossRef]
- Cole, M.; Craft, A.W.; Parker, L.; Bell, S.; Seviour, J.A.; McGill, A.C.; Dale, G. Urinary creatinine adjusted reference ranges for homovanillic and vanillylmandelic acid in children and adults. Clin. Chim. Acta. 1995, 236, 19–32. [Google Scholar] [CrossRef]
- Andersson, R.; Carlsson, A.; Nordqvist, M.B.; Sollenberg, J. Urinary excretion of hippuric acid and o-cresol after laboratory exposure of humans to toluene. Int. Arch. Occup. Environ. Health 1983, 53, 101–108. [Google Scholar] [CrossRef]
- Deguchi, T.; Kusuhara, H.; Takadate, A.; Endou, H.; Otagiri, M.; Sugiyama, Y. Characterization of uremic toxin transport by organic anion transporters in the kidney. Kidney Int. 2004, 65, 162–174. [Google Scholar] [CrossRef]
- Trevisan, A. Concentration adjustment of spot samples in analysis of urinary xenobiotic metabolites. Am. J. Ind. Med. 1990, 17, 637–642. [Google Scholar] [CrossRef]
- Carrieri, M.; Trevisan, A.; Bartolucci, G.B. Adjustment to concentration-dilution of spot urine samples: correlation between specific gravity and creatinine. Int. Arch. Occup. Environ. Health 2001, 74, 63–67. [Google Scholar]
- Mage, D.T.; Allen, R.H.; Gondy, G.; Smith, W.; Barr, D.B.; Needham, L.L. Estimating pesticide dose from urinary pesticide concentration data by creatinine correction in the Third National Health and Nutrition Examination Survey (NHANES-III). J. Expo. Anal. Environ. Epidemiol. 2004, 14, 457–465. [Google Scholar] [CrossRef]
© 2014 by the authors; licensee MDPI, Basel, Switzerland. This article is an open access article distributed under the terms and conditions of the Creative Commons Attribution license (http://creativecommons.org/licenses/by/3.0/).
Share and Cite
Nicolli, A.; Chiara, F.; Gambalunga, A.; Carrieri, M.; Bartolucci, G.B.; Trevisan, A. Reliability of Urinary Excretion Rate Adjustment in Measurements of Hippuric Acid in Urine. Int. J. Environ. Res. Public Health 2014, 11, 7036-7044. https://doi.org/10.3390/ijerph110707036
Nicolli A, Chiara F, Gambalunga A, Carrieri M, Bartolucci GB, Trevisan A. Reliability of Urinary Excretion Rate Adjustment in Measurements of Hippuric Acid in Urine. International Journal of Environmental Research and Public Health. 2014; 11(7):7036-7044. https://doi.org/10.3390/ijerph110707036
Chicago/Turabian StyleNicolli, Annamaria, Federica Chiara, Alberto Gambalunga, Mariella Carrieri, Giovanni Battista Bartolucci, and Andrea Trevisan. 2014. "Reliability of Urinary Excretion Rate Adjustment in Measurements of Hippuric Acid in Urine" International Journal of Environmental Research and Public Health 11, no. 7: 7036-7044. https://doi.org/10.3390/ijerph110707036