A Review of Data Quality Assessment Methods for Public Health Information Systems


Abstract
:
1. Introduction

2. Methods
2.1. Literature Search
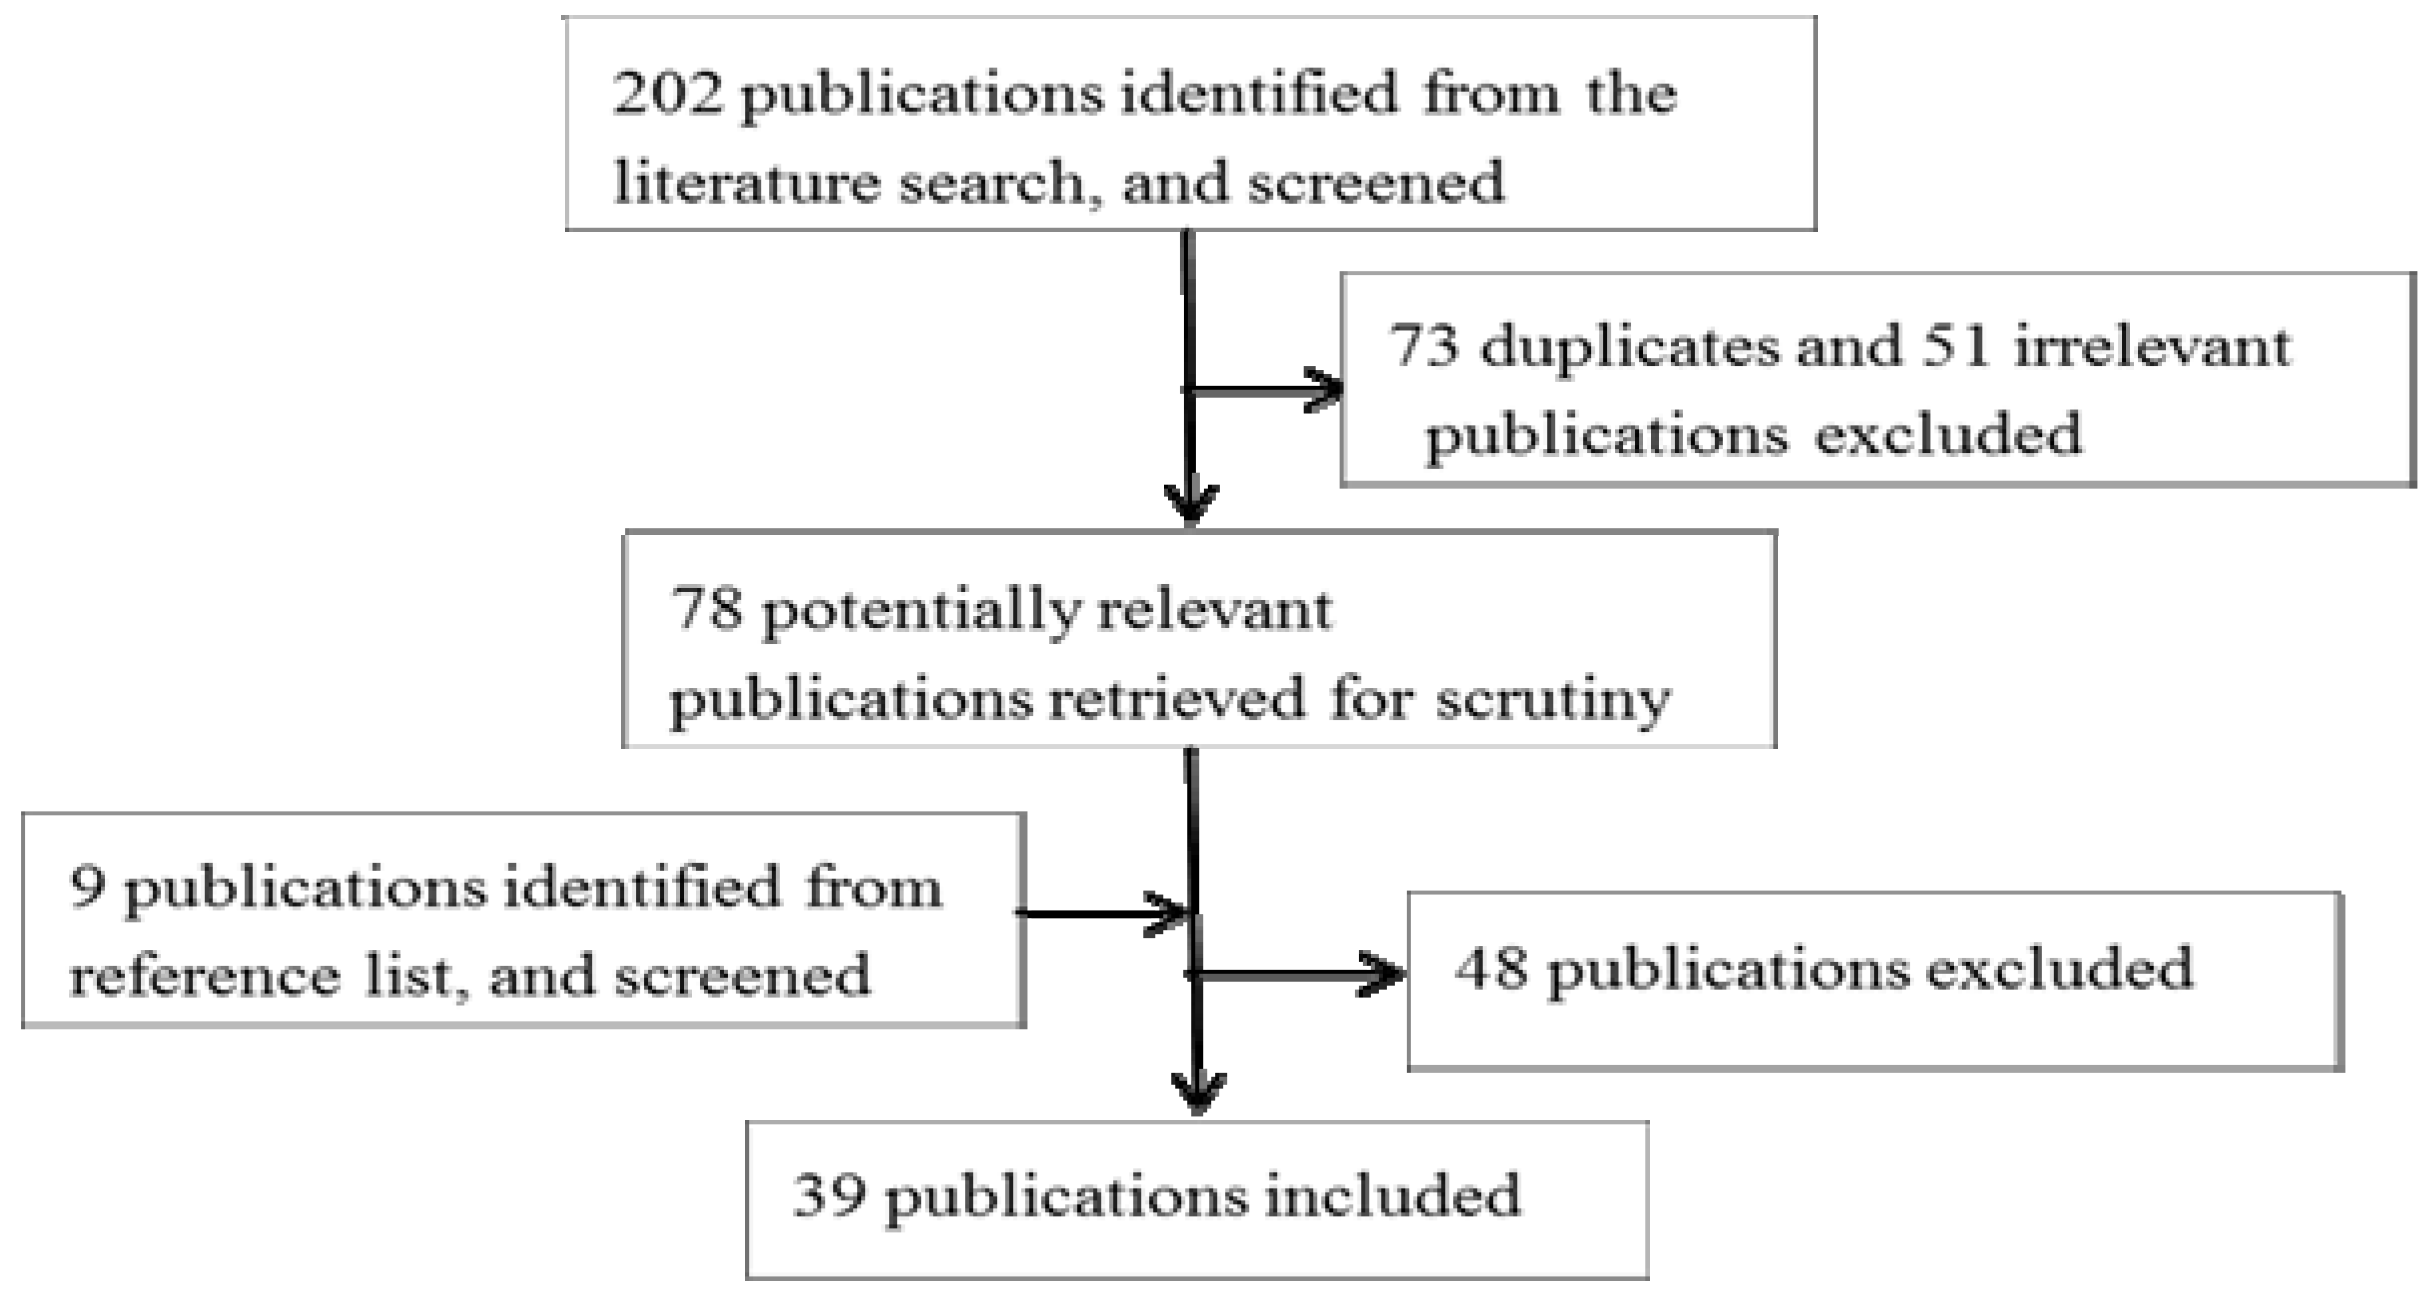
2.2. Selection of Publications

2.3. Data Abstraction
3. Results

| Acronym | Title | Institution |
|---|---|---|
| CDC’s Guidelines [15] | Updated Guidelines for Evaluating Public Health Surveillance Systems | United States Centers for Diseases Control and Prevention |
| CIHI DQF [30] | CIHI Data Quality Framework | Canadian Institute for Health Information |
| ME DQA [34,39] * | Data Quality Audit Tool | MEASURE Evaluation Project |
| ME PRISM [40,41] | Performance of Routine Information System Management Version 3.1 | MEASURE Evaluation Project |
| WHO DQA [42,43] | The Immunization Data Quality Audit (DQA)Procedure; Immunization Data Quality Self-assessment (WHO DQS) Tool | Department of Immunization Vaccines and Biologicals, World Health Organization |
| WHO DQRC [44] | Guide to the Health Facility Data Quality Report Card | World Health Organization |
| WHO HMN [45] | Assessing the National Health Information System An Assessment Tool Version 4.00 | Health Metrics Network, World Health Organization |
3.1. Aims of the Studies
3.2. Context and Scope of the Studies
3.3. Methods for Data Quality Assessment
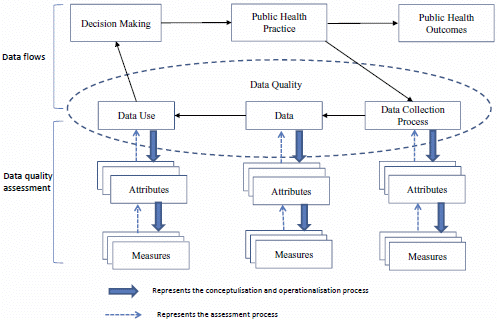
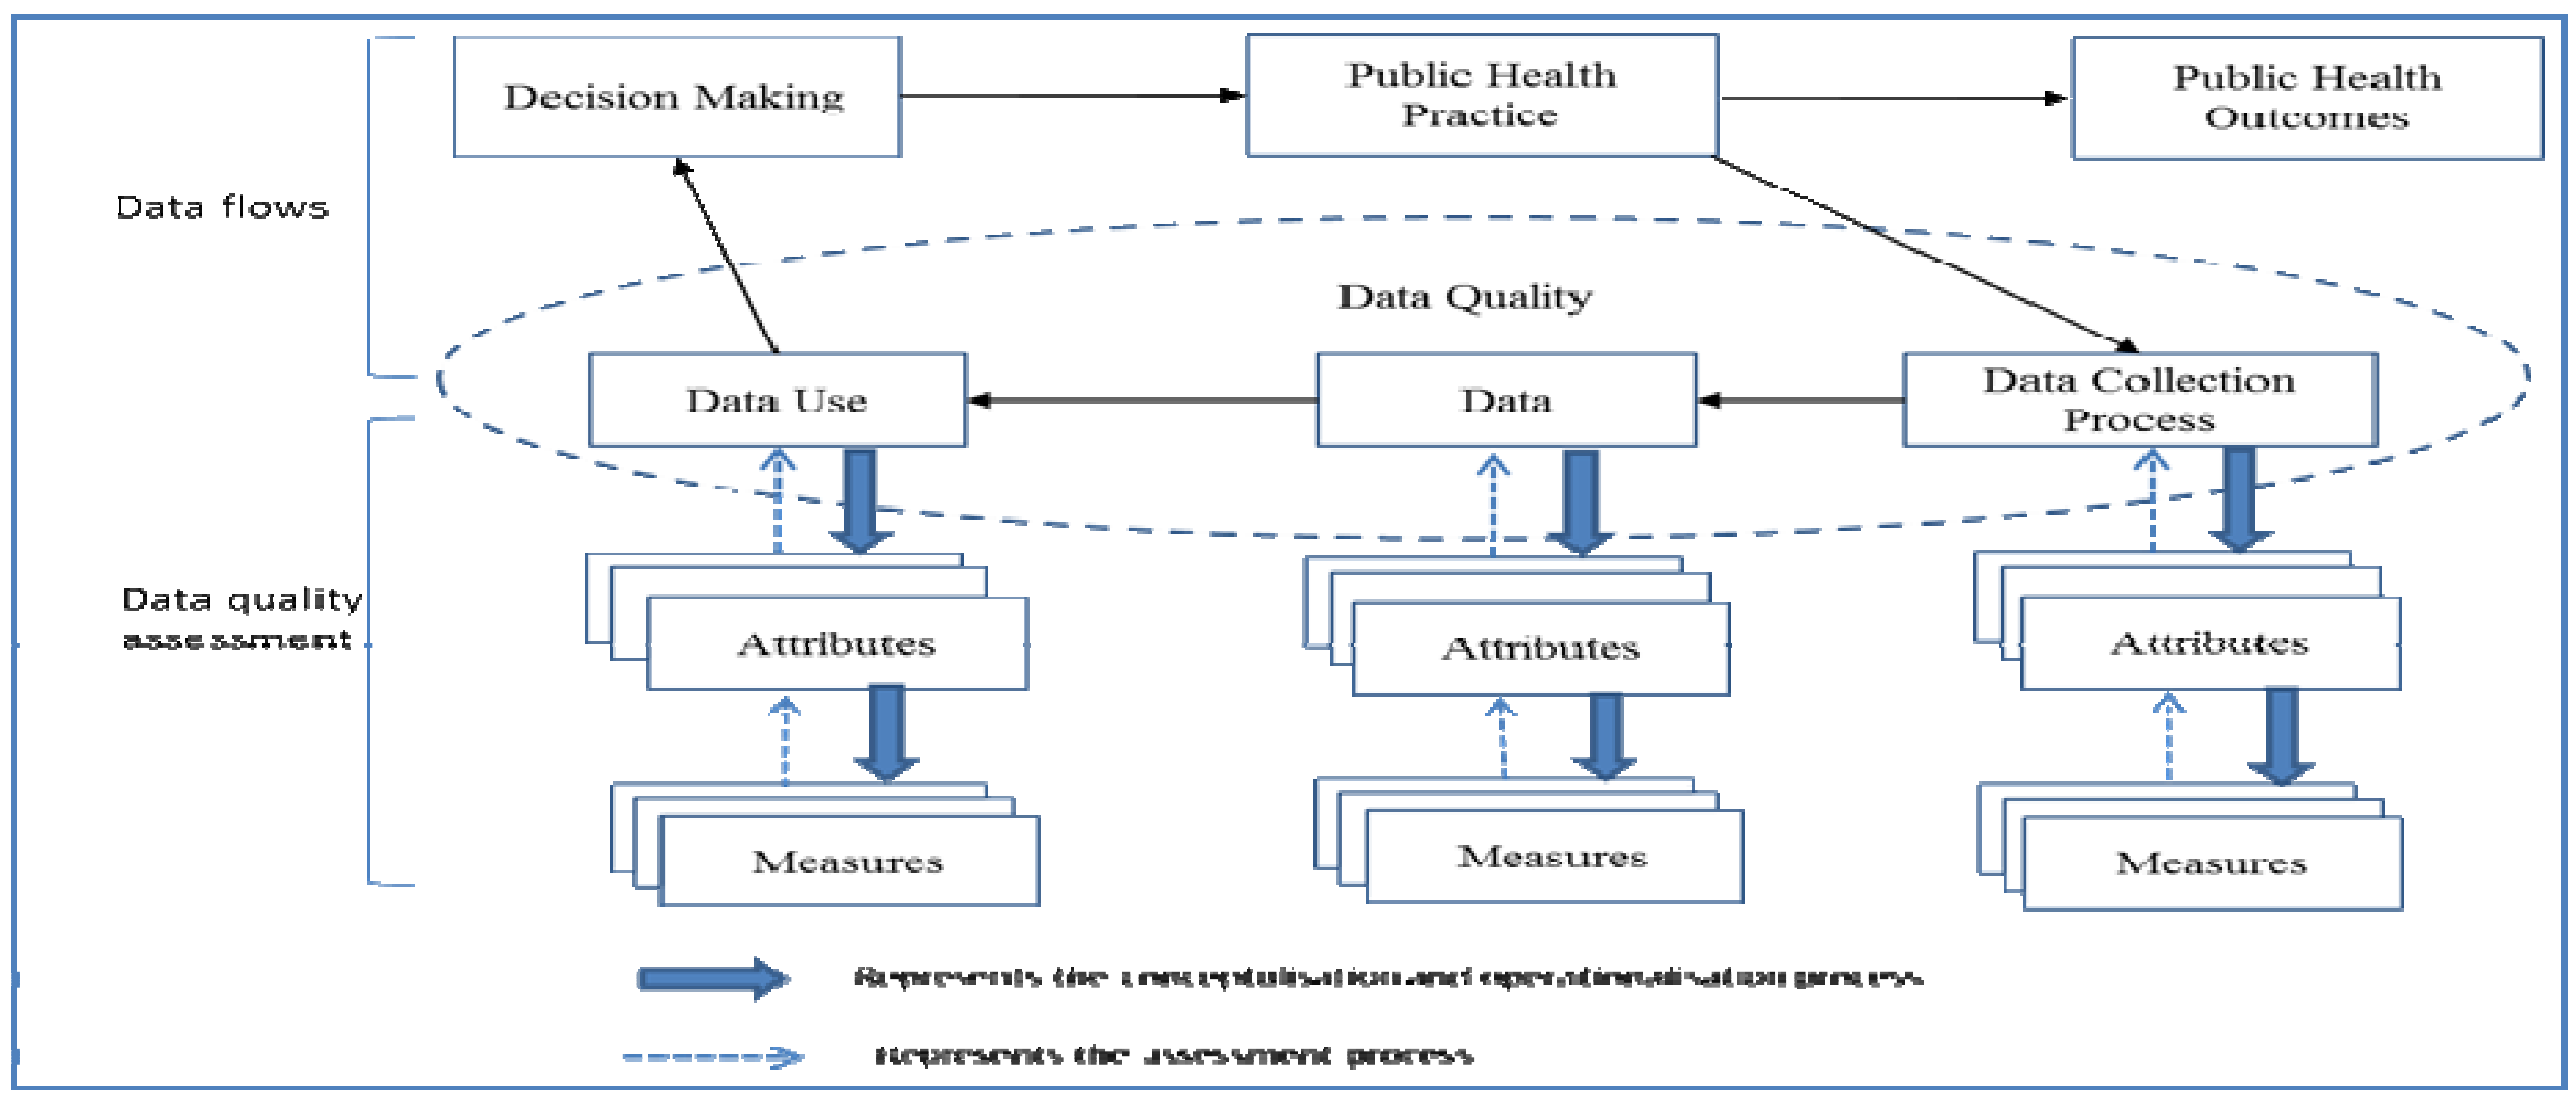
3.3.1. Methods for Assessment of the Dimension of Data
Quality Attributes of Data and Corresponding Measures
| Item | Attribute |
|---|---|
| High data quality (38) | Completeness, accuracy or positional accuracy, timeliness or up-datedness or currency, validity, periodicity, relevance, reliability, precision, integrity, confidentiality or data security, comparability, consistency or internal consistency or external consistency, concordance, granularity, repeatability, readily useableness or usability or utility, objectivity, ease with understanding, importance, reflecting actual sample, meeting data standards, use of standards, accessibility, transparency, representativeness, disaggregation, data collection method or adjustment methods or data management process or data management |
| Poor data quality (11) | Missing data, under-reporting, inconsistencies, data errors or calculation errors or errors in report forms or errors resulted from data entry, invalid data, illegible hand writing, non-standardization of vocabulary, and inappropriate fields |
Study Design
Data Collection Methods
Data Analysis Methods
3.3.2. Methods for Assessment of the Dimension of Data Use
Quality Attributes of Data Use and Corresponding Measures
Study Design
Data Collection Methods
Data Analysis Methods
3.3.3. Methods for Assessment of the Dimension of Data Collection Process
Quality Attributes of Data Collection Process and Corresponding Measures
Study Design
Data Collection and Analysis Methods
3.4. Summary of the Findings
4. Discussion
5. Conclusions
Acknowledgments
Author Contributions
Conflicts of Interest
References
- Winslow, C.E. The untilled fields of public health. Science 1920, 51, 23–33. [Google Scholar]
- Walker, R. Health information and public health. Health Inf. Manag. J. 2008, 37, 4–5. [Google Scholar]
- Institute of Medicine. The Future of Public Health; National Academies Press: Washington, DC, USA, 1988. [Google Scholar]
- Andresen, E.; Bouldin, E.D. Public Health Foundations: Concepts and Practices; Jossey-Bass: Hoboken, NJ, USA, 2010. [Google Scholar]
- World Health Organization. Framework and Standards for Country Health Information Systems. World Health Organization: Geneva, Switzerland, 2008. [Google Scholar]
- Australian Institute of Health and Welfare (AIHW); National Public Health Information Working Group. National Public Health Information Plan 2005; AIHW: Canberra, Australia, 2005. [Google Scholar]
- O’Carroll, P.W.; Yasnoff, W.A.; Ward, M.E.; Ripp, L.H.; Martin, E.L. Public Health Informatics and Information Systems; Springer Science+Business Media Inc.: New York, NY, USA, 2003. [Google Scholar]
- Lin, V.; Smith, J.; Fawkes, S.; Robinson, P.; Chaplin, S. Public Health Practice in Australia: The Organised Effort; Allen & Unwin: Crows Nest, NSW, Australia, 2007. [Google Scholar]
- World Health Organization. An introduction to the World Health Organization. Available online: http://www.who.int/about/brochure_en.pdf (accessed on 30 August 2013).
- European Commission. European Core Health Indicators. Available online: http://ec.europa.eu/health/indicators/echi/index_en.htm (accessed on 30 August 2013).
- U.S. Department of Health and Human Services. HealthyPeople.gov. Available online: http://www.healthypeople.gov/2020/about/default.aspx (accessed on 30 August 2013).
- Preventative Health Taskforce. Australia: The Healthiest Country by 2020. Available online: http://www.preventativehealth.org.au/internet/preventativehealth/publishing.nsf/Content/nphs-overview-toc (accessed on 30 August 2013).
- National Health and Family Planning Commission of the People’s Republic of China. Healthy China 2020. Available online: http://www.moh.gov.cn/wsb/pzcjd/201208/55651.shtml (accessed on 30 August 2013).
- Yasnoff, W.; O’Carroll, P.; Koo, D.; Linkins, R.; Kilbourne, E. Public health informatics: Improving and transforming public health in the information age. J. Public Health Manag. Pract. 2000, 6, 67–75. [Google Scholar]
- CDC. Updated guidelines for evaluating surveillance systems: Recommendations from the guidelines working group. Morb. Mortal. Wkly. Rep. 2001, 50, 1–35. [Google Scholar]
- Loonsk, J.W.; McGarvey, S.R.; Conn, L.A.; Johnson, J. The public health information network (PHIN) preparedness initiative. J. Am. Med. Inform. Assoc. 2006, 13, 1–4. [Google Scholar] [CrossRef]
- Thacker, S.B.; Stroup, D.F. Future directions for comprehensive public health surveillance and health information systems in the United States. Am. J. Epidemiol. 1994, 140, 383–397. [Google Scholar]
- Araujo, J.; Pepper, C.; Richards, J.; Choi, M.; Xing, J.; Li, W. The profession of public health informatics: Still emerging? Int. J. Med. Inform. 2009, 78, 375–385. [Google Scholar] [CrossRef]
- World Health Organization. Monitoring the Building Blocks of Health System: A Handbook of Indicators and Their Measurement Strategies; World Health Organization: Geneva, Switzerland, 2010. [Google Scholar]
- Wang, L.; Wang, Y.; Jin, S.; Wu, Z.; Chin, D.P.; Koplan, J.P.; Wilson, M.E. Emergence and control of infectious diseases in China. Lancet 2008, 372, 1598–1605. [Google Scholar] [CrossRef]
- Demlo, L.K.; Gentleman, J.F. Morbidity Data. In Public Health Informatics and Information Systems; O’Carroll, P.W., Yasnoff, W.A., Ward, M.E., Ripp, L.H., Martin, E.L., Eds.; Springer Science+Business Media Inc.: New York, NY, USA, 2003; pp. 286–315. [Google Scholar]
- Venkatarao, E.; Patil, R.R.; Prasad, D.; Anasuya, A.; Samuel, R. Monitoring data quality in syndromic surveillance: Learnings from a resource limited setting. J. Glob. Infect. Dis. 2012, 4, 120–127. [Google Scholar] [CrossRef]
- Cheng, P.; Gilchrist, A.; Robinson, K.M.; Paul, L. The risk and consequences of clinical miscoding due to inadequate medical documentation: A case study of the impact on health services funding. Health Inf. Manag. J. 2009, 38, 35–46. [Google Scholar]
- Chan, M.; Kazatchkine, M.; Lob-Levyt, J.; Obaid, T.; Schweizer, J.; Sidibe, M.; Veneman, A.; Yamada, T. Meeting the demand for results and accountability: a call for action on health data from eight global health agencies. PLoS Med. 2010, 7. [Google Scholar] [CrossRef]
- Chen, H.; Yu, P.; Wang, N. Do we have the reliable data? An exploration of data quality for AIDS information system in China. Stud. Health Technol. Inform. 2012, 192, 1042–1042. [Google Scholar]
- Wilkinson, D.L.; McCarthy, M. Use of comparative data for integrated cancer services. BMC Health Serv. Res. 2007, 7, 204. [Google Scholar] [CrossRef]
- Qazi, M.S.; Ali, M. Health management information system utilization in Pakistan: Challenges, pitfalls and the way forward. BioSci. Trends 2011, 5, 245–254. [Google Scholar] [CrossRef]
- Rugg, D.; Marais, H.; Carael, M.; de Lay, P.; Warner-Smith, M. Are we on course for reporting on the millennium development goals in 2015? J. Acquir. Immune Defic. Syndr. 2009, 52, S69–S76. [Google Scholar] [CrossRef]
- Chan, M. From new estimates to better data. Lancet 2012, 380, 2054. [Google Scholar] [CrossRef]
- Canadian Institute for Health Information. The CIHI Data Quality Framework; CIHI: Ottawa, ON, Canada, 2009. [Google Scholar]
- Institute of Medicine. The Future of the Public’s Health in the 21st Century; The National Academies Press: Washington, DC, USA, 2003. [Google Scholar]
- Snee, N.L.; McCormick, K.A. The case for integrating public health informatics networks. IEEE Eng. Med. Biol. Mag. 2004, 23, 81–88. [Google Scholar] [CrossRef]
- Wang, R.Y.; Strong, D.M. Beyond accuracy: What data quality means to data consumers. J. Manag. Inf. Syst. 1996, 12, 5–33. [Google Scholar]
- MEASURE Evaluation. Data Quality Audit Tool Guidelines for Implementation. Available online: http://www.theglobalfund.org/en/me/documents/dataquality/ (accessed on 30 August 2013).
- Karr, A.F.; Sanil, A.P.; Banks, D.L. Data quality: A statistical perspective. Stat. Methodol. 2006, 3, 137–173. [Google Scholar] [CrossRef]
- Redman, T.C. Measuring Data Accuracy A Framework and Review. In Information Quality; Wang, R.Y., Pierce, E.M., Madnick, S.E., Eds.; M.E. Sharpe, Inc.: Armonk, NY, USA, 2005; pp. 21–36. [Google Scholar]
- Batini, C.; Cappiello, C.; Francalanci, C.; Maurino, A. Methodologies for data quality assessment and improvement. ACM Comput. Surv. 2009, 41, 1–52. [Google Scholar]
- Pipino, L.; Wang, R.Y.; Kopcso, D.; Rybolt, W. Developing Measurement Scales for Data-quality Dimensions. In Information Quality; Wang, R.Y., Pierce, E.M., Madnick, S.E., Eds.; M.E. Sharpe, Inc.: Armonk, NY, USA, 2005; pp. 37–51. [Google Scholar]
- MEASURE Evaluation. Routine Data Quality Assessment Tool (RDQA): Guidelines for Implementation for HIV, TB, & Malaria Programs. Available online: http://www.theglobalfund.org/en/me/documents/dataquality/ (accessed on 30 August 2013).
- MEASURE Evaluation. PRISM: Performance of Routine Information System Management—PRISM Tools for Assessing, Monitoring, and Evaluating RHIS Performance: PRISM Tool Version 3.1 March 2010. Available online: http://www.cpc.unc.edu/measure/tools/monitoring-evaluation-systems/prism (accessed on 30 August 2013).
- Aqil, A.; Lippeveld, T.; Hozumi, D. PRISM framework: A paradigm shift for designing, strengthening and evaluating routine health information systems. Health Policy Plan. 2009, 24, 217–228. [Google Scholar] [CrossRef]
- World Health Organization. The Immunization Data Quality Audit (DQA) Procedure; World Health Organization: Geneva, Switzerland, 2003. [Google Scholar]
- World Health Organization. The Immunization Data Quality Self-assessment (DQS) Tool; World Health Organization: Geneva, Switzerland, 2005. [Google Scholar]
- World Health Organization. Guide to the Health Facility Data Quality Report Card. Available online: http://www.who.int.ezproxy.uow.edu.au/healthinfo/topics_standards_tools_data_quality_analysis/en/ (accessed on 30 August 2013).
- World Health Organization. Assessing the National Health Information System: An Assessment Tool Version 4.00; World Health Organization: Geneva, Switzerland, 2008. [Google Scholar]
- Van Hest, N.A.H.; Story, A.; Grant, A.D.; Antoine, D.; Crofts, J.P.; Watson, J.M. Record-linkage and capture-recapture analysis to estimate the incidence and completeness of reporting of tuberculosis in England 1999–2002. Epidemiol. Infect. 2008, 136, 1606–1616. [Google Scholar] [CrossRef]
- Savas, L.; del Junco, D.; Bastian, L.; Vernon, S. Mortality ascertainment of women veterans: A comparison of sources of vital status information, 1979–2002. Med. Care 2009, 47, 125–128. [Google Scholar] [CrossRef]
- Mate, K.S.; Bennett, B.; Mphatswe, W.; Barker, P.; Rollins, N. Challenges for routine health system data management in a large public programme to prevent mother-to-child HIV transmission in South Africa. PLoS One 2009, 4, e5483. [Google Scholar] [CrossRef]
- Makombe, S.D.; Hochgesang, M.; Jahn, A.; Tweya, H.; Hedt, B.; Chuka, S.; Yu, J.K.-L.; Aberle-Grasse, J.; Pasulani, O.; Bailey, C.; et al. Assessing the quality of data aggregated by antiretroviral treatment clinics in Malawi. Bull. World Health Organ. 2008, 86, 310–314. [Google Scholar] [CrossRef]
- Hahn, D.; Wanjala, P.; Marx, M. Where is information quality lost at clinical level? A mixed-method study on information systems and data quality in three urban Kenyan ANC clinics. Glob. Health Action 2013, 6, 1–10. [Google Scholar]
- Frizzelle, B.G.; Evenson, K.R.; Rodriguez, D.A.; Laraia, B.A. The importance of accurate road data for spatial applications in public health: Customizing a road network. Int. J. Health Geogr. 2009, 8. [Google Scholar] [CrossRef]
- Freestone, D.; Williamson, D.; Wollersheim, D. Geocoding coronial data: Tools and techniques to improve data quality. Health Inf. Manag. J. 2012, 41, 4–12. [Google Scholar]
- Ford, J.; Roberts, C.; Algert, C.; Bowen, J.; Bajuk, B.; Henderson-Smart, D. Using hospital discharge data for determining neonatal morbidity and mortality: A validation study. BMC Health Serv. Res. 2007, 20. [Google Scholar] [CrossRef]
- Dixon, B.E.; McGowan, J.J.; Grannis, S.J. Electronic laboratory data quality and the value of a health information exchange to support public health reporting processes. AMIA Annu. Symp. Proc. 2011, 2011, 322–330. [Google Scholar]
- Corriols, M.; Marín, J.; Berroteran, J.; Lozano, L.; Lundberg, I.; Thörn, Å. The Nicaraguan Pesticide Poisoning Register: Constant Underreporting. Int. J. Health Serv. 2008, 38, 773–787. [Google Scholar] [CrossRef]
- Clayton, H.B.; Sappenfield, W.M.; Gulitz, E.; Mahan, C.S.; Petersen, D.J.; Stanley, K.M.; Salihu, H.M. The florida investigation of primary late preterm and cesarean delivery: The accuracy of the birth certificate and hospital discharge records. Matern. Child Health J. 2013, 17, 869–878. [Google Scholar] [CrossRef]
- Chiba, Y.; Oguttu, M.A.; Nakayama, T. Quantitative and qualitative verification of data quality in the childbirth registers of two rural district hospitals in Western Kenya. Midwifery 2012, 28, 329–339. [Google Scholar] [CrossRef]
- Bosch-Capblanch, X.; Ronveaux, O.; Doyle, V.; Remedios, V.; Bchir, A. Accuracy and quality of immunization information systems in forty-one low income countries. Trop. Med. Int. Health 2009, 14, 2–10. [Google Scholar] [CrossRef] [Green Version]
- Ancker, J.S.; Shih, S.; Singh, M.P.; Snyder, A.; Edwards, A.; Kaushal, R. Root causes underlying challenges to secondary use of data. AMIA Annu. Symp. Proc. 2011, 2011, 57–62. [Google Scholar]
- Ronveaux, O.; Rickert, D.; Hadler, S.; Groom, H.; Lloyd, J.; Bchir, A.; Birmingham, M. The immunization data quality audit: Verifying the quality and consistency of immunization monitoring systems. Bull. World Health Organ. 2005, 83, 503–510. [Google Scholar]
- Saeed, K.M.I.; Bano, R.; Asghar, R.J. Evaluation of the national tuberculosis surveillance system in Afghanistan. East. Mediterr. Health J. 2013, 19, 200–207. [Google Scholar]
- Petter, S.; Fruhling, A. Evaluating the success of an emergency response medical information system. Int. J. Med. Inform. 2011, 80, 480–489. [Google Scholar] [CrossRef]
- Lowrance, D.; Filler, S.; Makombe, S.; Harries, A.; Aberle-Grasse, J.; Hochgesang, M.; Libamba, E. Assessment of a national monitoring and evaluation system for rapid expansion of antiretroviral treatment in Malawi. Trop. Med. Int. Health 2007, 12, 377–381. [Google Scholar] [CrossRef]
- Litow, F.; Krahl, P. Public health potential of a disability tracking system: Analysis of U.S. navy and marine corps physical evaluation boards 2005–2006. Mil. Med. 2007, 172, 1270–1274. [Google Scholar]
- Lin, W.; Chen, S.; Seguy, N.; Chen, Z.; Sabin, K.; Callejaf, J.G.; Bulterysa, M. Is the HIV sentinel surveillance system adequate in China? Findings from an evaluation of the national HIV sentinel surveillance system. West. Pac. Surveill. Response J. 2012, 3, 78–85. [Google Scholar]
- Harper, S.L.; Edge, V.L.; Schuster-Wallace, C.J.; Ar-Rushdi, M.; McEwen, S.A. Improving Aboriginal health data capture: Evidence from a health registry evaluation. Epidemiol. Infect. 2011, 139, 1774–1783. [Google Scholar] [CrossRef]
- Forster, M.; Bailey, C.; Brinkhof, M.W.G.; Graber, C.; Boulle, A.; Spohr, M.; Balestre, E.; May, M.; Keiser, O.; Jahnf, A.; et al. Electronic medical record systems, data quality and loss to follow-up: Survey of antiretroviral therapy programmes in resource-limited settings. Bull. World Health Organ. 2008, 86, 939–947. [Google Scholar] [CrossRef]
- Edmond, M.; Wong, C.; Chuang, S.K. Evaluation of sentinel surveillance system for monitoring hand, foot and mouth disease in Hong Kong. Public Health 2011, 125, 777–783. [Google Scholar] [CrossRef]
- Dai, L.; Zhu, J.; Liang, J.; Wang, Y.; Wang, H.; Mao, M. Birth defects surveillance in China. World J. Pediatr. 2011, 7, 302–310. [Google Scholar] [CrossRef]
- Iguiniz-Romero, R.; Palomino, N. Data do count! Collection and use of maternal mortality data in Peru, 1990–2005, and improvements since 2005. Reproduct. Health Matters 2012, 20, 174–184. [Google Scholar] [CrossRef]
- Matheson, A.I.; Baseman, J.G.; Wagner, S.H.; O’Malley, G.E.; Puttkammer, N.H.; Emmanuel, E.; Zamor, G.; Frédéric, R.; Coq, N.R.; Lober, W.B. Implementation and expansion of an electronic medical record for HIV care and treatment in Haiti: An assessment of system use and the impact of large-scale disruptions. Int. J. Med. Inform. 2012, 81, 244–256. [Google Scholar] [CrossRef]
- Pereira, J.A.; Quach, S.; Hamid, J.S.; Heidebrecht, C.L.; Quan, S.D.; Nassif, J.; Diniz, A.J.; van Exan, R.; Malawski, J.; Gentry, A.; et al. Exploring the feasibility of integrating barcode scanning technology into vaccine inventory recording in seasonal influenza vaccination clinics. Vaccine 2012, 30, 794–802. [Google Scholar] [CrossRef]
- Hills, R.A.; Revere, D.; Altamore, R.; Abernethy, N.F.; Lober, W.B. Timeliness and data element completeness of immunization data in Washington State in 2010: A comparison of data exchange methods. AMIA Annu. Symp. Proc. 2012, 2012, 340–349. [Google Scholar]
- Lash, R.R.; Carroll, D.S.; Hughes, C.M.; Nakazawa, Y.; Karem, K.; Damon, I.K.; Peterson, A.T. Effects of georeferencing effort on mapping monkeypox case distributions and transmission risk. Int. J. Health Geogr. 2012, 11, 23. [Google Scholar] [CrossRef]
- Strong, D.M.; Lee, Y.W.; Wang, R.Y. Data quality in context. Commun. ACM 1997, 40, 103–110. [Google Scholar] [CrossRef]
- Pipino, L.L.; Lee, Y.W.; Wang, R.Y. Data quality assessment. Commun. ACM 2002, 45, 211–218. [Google Scholar] [CrossRef]
| Authors Year | Attributes Major measures | Study design | Data collection methods | Data analysis methods | Contribution | Limitations |
|---|---|---|---|---|---|---|
| Ancker et al. 2011 [59] | Percentage of missing data, inconsistencies and potential errors of different variables; number of duplicate records, number of non-standardization of vocabulary, number of inappropriate fields | Quantitative audit of data attributes of dataset. | Selected one data set and used tools to query 30 variables, manually assessed data formats | Rates, percentage or counts | Identified data quality issues and their root causes. | Need a specific data query tool |
| Bosch-Capblanch et al. 2009 [58] | Accuracy Proportions in the relevant data set, such as the recounted number of indicator’s data by the reported number at the next tier in the reporting system. A ratio less than 100% indicates “over-reporting”; a ratio over 100% suggests “under-reporting” | Quantitative audit of data accuracy by external auditors applying WHO DQA in 41 countries | A multistage weighted representative random sampling procedure, field visits verifying the reported data. Compared data collected from fields with the reports at the next tier | Percentage, median, inter-quartile range, 95% confidence intervals, ratio (verification factor quotient) adjusted and extrapolated | Systematic methodology to describe data quality and identify basic recording and reporting practices as key factors and good practices | Limited attributes, lack of verification of source of actual data and excluded non-eligible districts |
| CDC 2001 [15] | Completeness, accuracy Percentage of blank or unknown responses, ratio of recorded data values over true values | Quantitative audit of dataset, a review of sampled data, a special record linkage, or a patient interview | Calculating the percentage of blank or unknown responses to items on recording forms, reviewing sampled data, conducting record linkage, or a patient interview | Descriptive statistics: percentage | Provides generic guidelines | Lack of detail on procedures, needs adjustment |
| Chiba et al. 2012 [57] | Completeness: percentage of complete data. Accuracy: 1-percentage of the complete data which were illegible, wrongly coded, inappropriate and unrecognized. Relevance: comparing the data categories with those in upper level report to evaluate whether the data collected satisfied management information needs | Quantitative verification of data accuracy and completeness, and qualitative verification of data relevance in a retrospective comparative case study | Purposive sampling, clinical visits, re-entered and audited 30 data categories of one year data to evaluate accuracy and completeness; qualitatively examined data categories and instructions to assess the relevance, completeness and accuracy of the data, semi-structured interviews to capture factors that influence data quality | Descriptive statistics for accuracy and completeness of the data. Qualitative data were thematically grouped and analyzed by data categories, instructions, and key informants’ views | Quantitative and qualitative verification of data quality; comparison of two hospitals increased generalizability of the findings | Consistency and timeliness were not assessed. Data from the system were not able to be validated |
| CIHI 2009 [30] | Accuracy: coverage, capture and collection, unit non-response, item (partial) non-response, measurement error, edit and imputation, processing and estimation. Timeliness: data currency at the time of release, documentation currency. Comparability: data dictionary standards, standardization, linkage, equivalency, historical comparability. Usability: accessibility, documentation, interpretability. Relevance: adaptability, value. | Quantitative method, user survey-questionnaire | Questionnaire by asking users, three ratings of each construct, including met, not met, unknown or not applicable (or minimal or none, moderate, significant or unknown) All levels of the system were taken into account in the assessment | Descriptive statistics for ratings by each criterion, the overall assessment for a criterion based on the worst assessment of the applicable levels | Data quality assessed from user’s perspective provides comprehensive characteristics and criteria of each dimension of data quality. 5 dimensions, 19 characteristics and 61criteria | Undefined procedures of survey including sample size. Being an internal assessment, rating scores were used for internal purposes |
| Clayton et al. 2013 [56] | Accuracy Sensitivity, specificity, positive predictive value (PPV), negative predictive value (NPV) | Quantitative method to audit dataset by power calculation of 840 medical records | Two stage sampling of study sites, abstracting records and auditing 25 data variables to assess accuracy of the data reported on three data sources | Descriptive statistics were calculated for each data sources; summary measure of kappa values sing the paired sample Wilcoxon signed rank test | Accessing and linking three data sources—maternal medical charts, birth certificates and hospital discharge data whose access is limited and using the medical chart as the gold standard | Limited generalizability of the findings; low sample size and limited representativeness |
| Corriols et al. 2008 [55] | Under-reporting Calculating the difference between registered cases and surveyed cases | Quantitative method to administer a cross-sectional survey in the country | 4 stage consistent random sampling method across the country. Face-to-face interview questionnaire survey. | Descriptive statistics for estimation of national underreporting by using survey results | Good representativeness of the study population | Lack of case diagnosis information and the quality of the source of the data |
| Dai et al. 2011 [69] | Under-reporting, errors on report forms, errors resulted from data entry; completeness of information, accuracy, timeliness | Qualitative and quantitative methods by reviewing publications on the system and data from the system | Reviewing publications on the system and data from the system | Descriptive statistics for quantitative data and thematically grouping for qualitative data | Evaluated all existing sub-systems included in the system | Undefined procedures of review, lack of verification of source data |
| Authors Year | Attributes Major measures | Study design | Data collection methods | Data analysis methods | Contribution | Limitations |
| Dixon et al. 2011 [54] | Completeness The proportion of diagnosed cases and the proportion of fields in a case report | Quantitative method by auditing dataset | Creating a minimum data set of 18 key data elements, using structured query language (SQL) statements to calculate the percent completeness of each field of a total of 7.5 million laboratory reports | Descriptive statistics to calculate the difference between the completeness scores across samples | Development of a method for evaluating the completeness of laboratory data | Need a specific data query tool and only assessed completeness |
| Edmond et al. 2011 [68] | Completeness, illegible hand writing, calculation errors The proportion of the consultation rates for two items, the proportion of illegible hand writing and required clarification, and the proportion of calculation errors on the submitted record forms | Quantitative method: audit the submitted record forms in the dataset | 3303 cards from randomly selected five weeks from each year between 2003 and 2009 | Descriptive statistics for the percentage of each data quality attribute | Random selection of dataset | Only calculated completeness, without field verification of accuracy of data |
| Ford et al. 2007 [53] | Accuracy Sensitivity, specificity and positive predictive values | Quantitative method to use record linkage to audit dataset, comparing the system with a gold standard (a statewide audit dataset) | Calculated data quality indicators for 18 data variables, compared with a statewide audit (gold standard), including 2432 babies admitted to NICUs, 1994–1996 | Descriptive statistics with exact binomial confidence intervals for data quality attributes, comparing two datasets by using the chi-square test | The findings are consistent with other validation studies that compare routinely collected population health data with medical records | Lack of verification of variations between two datasets, inadequate representativeness |
| Forster et al. 2008 [67] | Missing data The percentage of the missing data | Quantitative method to audit dataset | Assessed data quality of a set of six key variables. A global missing data index was computed determining the median of the percentages missing data. Sites were ranked according to this index | Confidence interval (CI), Conbach’s, multivariate logic models, Spearman rank correlation coefficient | Directly examined associations between site characteristics and data quality | Convenience sample and uncertain generalizability |
| Freestone et al. 2012 [52] | Accuracy, consistency, granularity | Quantitative method to audit dataset from three components: source documents, data extraction/transposition, and data cleaning | Systematic sampling 200 cases, each geocoded and comparatively assessed of data quality with and without the influence of geocoding, by pre-selected criteria | Data quality measured by category: perfect, near perfect, poor. Paired t-test for 200 samples and chi-square test for year | Quantify data quality attributes with different factors | No reference type and no field verification (for historic data) |
| Frizzelle et al. 2009 [51] | Accuracy, completeness, currency Assessed by positional errors, generalizations incompatible with highly accurate geospatial locations, updated with the change | Quantitative method to use geographic information systems (GIS) by developing a custom road dataset for analyzing data quality of four datasets | Developed a custom road dataset, and compared with four readily available public and commercial road datasets; developed three analytical measures to assess the comparative data quality | Percentage, concordance coefficients and Pearson correlation coefficients | Exemplary to assessing the feasibility of readily available commercial or public road datasets and outlines the steps of developing a custom dataset | No field verification for historic data |
| Hahn et al. 2013 [50] | Completeness, accuracy The percentage of correctly or completely transmitted items from the original data source to secondary data sources | A multiple case study by quantitative and qualitative approaches in 3 antenatal care clinics of two private and one public Kenyan hospital | Quantitative method: selected 11 data tracer items followed retrospectively and audited compared to independently created gold standard. Qualitative methods: structured interviews and qualitative in-depth interviews to assess the subjective dimensions of data quality. Five-point scales were used for each statement. Purposeful sampling of 44 staff for survey and 15 staff for key informants interviews | Quantitative data: manual review, descriptive statistics, Kruskal-Wallis test, Mann-Whitney U test for continuous measures. Qualitative data: processed manually and classified and grouped by facility and staff class | Combining different methods and viewing the information systems from different viewpoints, covering the quality of PHIS and drawing suggestions for improvement of data quality from qualitative results, likely to produce robust results in other settings | |
| Harper et al. 2011 [66] | Completeness: the proportion of filled fields on the reports. Validity: the proportion of the number of the written indicators against the assigned standard; the proportion of entered incorrect numbers; the proportion of illegible entries; the proportion of entries out of chronological order | Quantitative method to audit an electronic database that was manually extracted entries of a reference syndrome from anonymized dataset from the E-Book health registry entries | Using a random systematic sample of 10% of the extracted entries (i.e., beginning with a randomly chosen starting point and then performing interval sampling to check 10% of records), with an acceptable error rate of <5% | Descriptive statistics on attributes. To avoid bias, age and sex proportions were extracted from available records, the proportions compared to National Census data. | Examine data quality using a reference syndrome, thus making it possible to provide informed recommendations. Descriptive data analysis provides grounded and useful information for decision makers | No evaluation of data collection methods |
| Hills et al. 2012 [73] | Timeliness: the number of days between Service Date and Entry Date of submission of data to the system (three categories: ≤7 days, =8–30 days, and ≥31 days). Completeness: the complete recording of data elements by calculating the proportion of complete fields over total number of fields | Quantitative method to audit data set | Use a de-identified 757,476 demographic records and 2,634,101 vaccination records from the system | Descriptive statistics on attributes | Large dataset provides a statistically significant association | Not able to examine two highly relevant components of data quality: vaccination record coverage completeness and accuracy |
| Lash et al. 2012 [74] | Completeness: the number of locations matching to latitude and longitude coordinates. Positional accuracy: spatial resolution of the dataset. Concordance: the number of localities falling within the boundary. Repeatability: the georeferencing methodology | Georeferencing historic datasets, quantitative method research historic data with 404 recorded MPX cases in seven countries during 1970–1986 from 231 unique localities | Develop ecological niche models and maps of potential MPX distributions based on each of the three occurrence data sets with different georeferencing efforts | Descriptive statistics on attributes and comparison of georeferencing match rates | Document the difficulties and limitations in the available methods for georeferencing with historic disease data in foreign locations with poor geographic reference information. | Not able to examine the accuracy of data source |
| Lin et al. 2012 [65] | Completeness: sufficient sample size. Accuracy: data missing or discrepancies between questionnaires and database | Quantitative and qualitative methods, auditing data set by cross-checking 5% questionnaires against the electronic database during the field visits | Review guidelines and protocols using a detailed checklist; purposive sampling; direct observations of data collection; cross-checking compared database with the questionnaires | Descriptive statistics for attributes of data quality | Mixed-methods to assess data quality | Unable to generalize the findings to the whole system |
| Litow and Krahl 2007 [64] | Accuracy, use of standards, completeness, timeliness, and accessibility | Quantitative method based on a framework developed for assessment of PHIS | Exported and queried one year data by 12 data items | Descriptive statistics for data quality attributes | Research on Navy population for public health applicability of the system and identified factors influencing data quality | Needs a framework which was undefined in the research |
| Lowrance et al. 2007 [63] | Completeness, updated-ness, accuracy | Qualitative method by following CDC’s Guidelines with qualitative methods | Standardized interviews with 18 key informants during 12 site visits, and meetings with stakeholders from government, non-governmental and faith-based organizations. | Thematically grouping interview responses | Data quality qualitatively assessed by key informants and stakeholders | Lack of quantifiable information |
| Authors Year | Attributes Major measures | Study design | Data collection methods | Data analysis methods | Contribution | Limitations |
| Makombe et al. 2008 [49] | Completeness: filled fields; accuracy: no missing examined variables or a difference less than 5% compared to the supervision report | Quantitative methods to audit the quality of site reports as of the date of field supervisory visits | 6 case registration fields and 2 outcome data were examined | Descriptive statistics on attributes of data quality from site reported were compared to those of supervision reports (“gold standard”) | Set up thresholds of accuracy, examine association between facility characteristics and data quality | Only assessed aggregated facility-level rather individual patient data |
| Mate et al. 2009 [48] | Completeness: no missing data in a period of time; accuracy: the value in the database was within 10% of the gold standard value or percentage deviation from expected for each data element when compared to the gold standard data set | Quantitative methods to assess attributes. Completeness: surveying six data elements in one year dataset from all sample sites. Accuracy: surveying a random sample sites in three months to assess variation of three steps in data collection and reporting | Extracted one year dataset for surveying data completeness of six data elements. Randomization sampling. Paralleled collection of raw data by on-site audit of the original data. Reconstructed an objective, quality-assured “gold standard” report dataset. All clinical sites were surveyed for data completeness, 99 sites were sampled for data accuracy | Descriptive statistics, by using charts, average magnitude of deviation from expected, and data concordance analysis between reported data and reconstructed dataset | Large sample size, randomized sampling technique, the use of an objective, quality-assured “gold standard” report generated by on-site audit of the original data to evaluate the accuracy of data elements reported in the PHIS. Set up thresholds of accuracy and errors | Sources of data were not verified |
| Matheson et al. 2012 [71] * | Missing data, invalid data, data cleaning, data management processes | Not conducted | N/A | N/A | N/A | Lack of specific metrics |
| ME DQA 2008 [34] | Accuracy, reliability, precision, completeness, timeliness, integrity, confidentiality | Comprehensive audit in quantitative and qualitative methods including in-depth verifications at the service delivery sites; and follow-up verifications at the next level | 4 methods for selection of sites including purposive selection, restricted site design, stratified random sampling, random sampling; the time period corresponding to the most recent relevant reporting period for the IS. Five types of data verifications including description, documentation review, trace and verification (recount), cross-checks, spot-checks. Observation, interviews and conversations with key data quality officials were applied to collect data | Descriptive statistics on accuracy, availability, completeness, and timeliness of reported data, including results verification ratio of verification, percentage of each dimension, differences between cross-check | Two protocols, 6 phases, 17 steps for the audit; sample on a limited scale considering the resources available to conduct the audit and level of precision desired; 2–4 indicators “case by case” purposive selection; on-site audit visits by tracing and verifying results from source documents at each level of the PHIS | Confined to specific disease context and standard program-level output indicators |
| ME PRISM 2010 [40] | Relevance: comparing data collected against management information needs. Completeness: filling in all data elements in the form, the proportion of facilities reporting in an administrative area. Timeliness: submission of the reports by an accepted deadline. Accuracy: comparing data between facility records and reports, and between facility reports and administrative area databases | Quantitative method, Questionnaire survey including data completeness and transmission, data accuracy check, data processing and analysis, assess the respondent’s perceptions about the use of registers, data collection forms and information technology | Non-anonymous interviews with identified name and title, including asking, manual counting, observation and recording results or circling “yes or no” | Using a data entry and analysis tool (DEAT), described in quantitative terms rather than qualitative. Yes or No tick checklist | A diagnostic tool in forms measures strengths and weaknesses in three dimensions of data quality. Quantitative terms help set control limits and targets and monitor over time | Indicators are not all inclusive; tool should be adapted in a given context. Need pre-test and make adjustments |
| Pereira et al. 2012 [72] | Completeness and accuracy of data-fields and errors | Quantitative and qualitative methods: Use primary (multi-center randomized trial) and secondary (observational convenience sample) studies | Field visits of a sample of clinics within each PHU to assess barcode readability, method efficiency and data quality. 64 clinic staff representing 65% of all inventory staff members in 19 of the 21 participating PHUs completed a survey examining method perceptions | Descriptive statistics: a weighted analysis method, histograms, 95% confidence intervals, F-test, Bootstrap method, the two-proportion z-test, adjusted the p values using Benjamin–Hochberg’s method for controlling false discovery rates (FDR) | The first study of such in an immunization setting. | Lack of representativeness to multiple lot numbers. Inaccurate data entry was not examined. Observations were based on a convenience sample |
| Petter and Fruhling 2011 [62] | Checklist of system quality, information quality | Quantitative methods to use DeLone&McLean IS success model. Use a survey in structured questionnaire | Online survey, facsimile, and mail, using 7 Likert scale for all quantitative questions. A response rate of 42.7% with representative demographics | Summative score for each construct, and each hypothesis was tested using simple regression. Mean, standard deviation, the Spearman’s correlation coefficients for analysis | Demonstrates the need to consider the context of the medical information system when using frameworks to evaluate the system | Inability of assessing some correlational factors due to the small PHIS user system |
| Ronveaux et al. 2005 [60] | Consistency The ratio of verified indicators reported compared with written documentation at health facilities and districts | Quantitative methods, using standardized data quality audits (WHO DQAs) in 27 countries | Recounted data compared to reported data | Descriptive statistics | A quantitative indication of reporting consistency and quality, facilitate comparisons of results over time or place | Similar to WHO DQA |
| Saeed et al. 2013 [61] | Completeness, validity, data management Calculation of missing data and illegal values (out of a predetermined range), data management (data collection, entry, editing, analysis and feedback) | Quantitative and qualitative methods, including interview, consultation, and documentation review | 10 key informants interview among the directors, managers and officers; 1 or 2 staff at national level interviewed; consultation with stakeholders, document review of each system strategic plan, guidelines, manuals, annual reports and data bases at national level | Predefined scoring criteria for attributes: poor, average, or good | Comparison of two PHIS | Purposive sampling |
| Savas et al. 2009 [47] | Sensitivity, specificity and the Kappa coefficient for inter-rater agreement | Quantitative methods: audit data set by cross-linkage techniques | Databases were deterministically cross linked using female sex and social security numbers. Deterministic and probabilistic linkage methods were also compared | Descriptive statistics | Combined electronic databases provide nearly complete ascertainment for specific dataset | Using data which were missing would affect the results by under-ascertainment |
| Van Hest et al. 2008 [46] | Accuracy and completeness of reported cases | Quantitative methods: audit data set by record-linkage and capture-recapture techniques | Use record linkage, false-positive records and correction, and capture-recapture analysis through 3 data sources by a core set of identifiers | Descriptive statistics: number, proportion and distribution of cases, 95% ACI (Approximate confidence interval), Zelterman’s truncated model | Record-linkage of TB data sources and cross-validation with additional TB related datasets improves data accuracy as well as completeness of case ascertainment | Imperfect record-linkage and false-positive records, violation of the underlying capture–recapture assumptions |
| Venkatarao et al. 2012 [22] | Timeliness: Percentage of the reports received on time every week; Completeness: percentage of the reporting units sending reports every week | Quantitative methods: Use field survey (questionnaire) with a 4-stage sampling method | 2 study instruments: the first focused on the components of disease surveillance; the second assessed the ability of the study subject in identifying cases through a syndromic approach | Descriptive statistics analysis | Two instruments including surveying users and dataset | Not able to assess the quality of data source such as accuracy |
| WHO DQA 2003 [42] | Completeness of reporting, report availability, timeliness of reporting, verification factor | Quantitative methods to audit selected indicators in the dataset. Multi-stage sampling from stratified sample representing the country’s PHIS | Recounted data compared to reported data | Descriptive statistics | A systematic methodology to describe data quality in the collection, transmission and use of information, and to provide recommendations to address them | Sample size and the precision dictated by logistical and financial considerations |
| WHO DQRC 2013 [44] | Completeness of reporting; internal consistency of reported data; external consistency of population data; external consistency of coverage rates | Quantitative method to conduct a desk review of available data and a data verification component at national level and sub-national level | An accompanying Excel-based data quality assessment tool | Simple descriptive statistics: percentage, standard deviation | Easy to calculate | Needs WHO DQA to complement assessment of the quality of data source |
| WHO HMN 2008 [45] | Data-collection method, timeliness, periodicity, consistency, representativeness, disaggregation, confidentiality, data security, and data accessibility. | Quantitative and qualitative methods to use 63 out of 197 questions among around 100 major stakeholders | Use consensus development method by group discussions, self-assessment approach, individual (less than 14) or group scoring to yield a percentage rating for each category | An overall score for each question, quartiles for the overall report. | Expert panel discussion, operational indicators with quality assessment criteria. | Sample size was dictated by logistical and financial considerations |
| Authors Year | Attributes Major measures | Study design | Data collection methods | Data analysis methods | Contribution | Limitations |
|---|---|---|---|---|---|---|
| Freestone et al. 2012 [52] | Trends in use Actioned requests from researchers in a set period of time | Analysis of actioned requests from researchers in a period of time | Abstracted data from the database for the study period | Trend analysis of proportion of requests | Quantifiable measures | Limit attributes |
| Hahn et al. 2013 [50] | Use of data The usage of aggregated data for monitoring, information processing, finance and accounting, and long-term business decisions | Qualitative methods: structured interviews with purposive sample of 44 staff and in-depth interviews with 15 key informants | Structured survey and key informant interview to assess five structured statements. Five-point scales were used for each statement | Responses were processed manually, classified and grouped by facility and staff class | Identified indicators of use of data | Lack of quantifiable results for assessment of data use |
| Iguiñiz-Romero and Palomino 2012 [70] | Data use Data dissemination: identify whether data used for decision making, the availability of feedback mechanisms | Qualitative exploratory study including interview and review of documentations | Open-ended, semi-structured questionnaire interviews with 15 key decision-makers. Review national documents and academic publications | Interview data recorded, transcribed, organized thematically and chronologically. The respondents were identified by positions but not named | Most respondents held key positions and a long period of the reviewed publications | Purposive sample lack of representativeness |
| Matheson et al. 2012 [71] | Clinical use of data: the number of summaries produced. Use of data for local activities to improve care. Data entry: the number of active sites. Report use: the percentage of active sites using prebuilt queries to produce data for each type of report in a given month over time | Qualitative and quantitative methods: key informant interview, documentation review, database query. | Personal interviews by phone and through internet telephony; follow up in person or by email; running SQL queries against the central database. External events were identified by reviewing news reports and through personal knowledge of the authors | Descriptive statistics using charts on number of clinics using the system in a given month, percentage of active clinics | Multiple methods | Lack of verification of data source |
| ME PRISM 2010 [40] | Checklist of use of information Report production, display of information, discussion and decisions about use of information, promotion and use of information at each level | Quantitative method to complete a predesigned checklist diagnostic tool | Checklist and non-anonymous interviewing staff, asking, manual counting, observation and recording results or circling “yes or no” | Two Likert score and descriptive statistics | Quantitative terms help set control limits and targets and monitor over time | |
| Petter and Fruhling 2011 [62] | System use, intention to use, user satisfaction | Quantitative methods to use DeLone & McLean IS success model. Survey respondents with a response rate of 42.7% and with representative demographics | Use an online survey in structured questionnaire with 7 Likert scale for all quantitative questions, in addition to facsimile and mail | Summative score for each construct, and each hypothesis was tested using simple regression, in addition to mean, standard deviation, the Spearman’s correlation coefficients | Use is dictated by factors outside of the control of the user, and it is not a reasonable measure of IS success. The quality does not affect the depth of use | Lack of objective assessments |
| Qazi and Al 2011 [27] | Use of data Non-use, misuse, disuse of data | Descriptive qualitative interviews | In-depth, face to face and semi structured interviews with an interview guide, 26 managers (all men, ages ranging from 26 to 49 years; selected from federal level (2), provincial (4) and seven selected districts (20) from all four provinces) | Data transcription, analysis based on categorization of verbatim notes into themes and a general description of the experience that emerged out of statements | A qualitative study allows getting close to the people and situations being studied, identified a number of hurdles to use of data | Convenience sample only one type of stakeholders has been covered. |
| Saeed et al. 2013 | Usefulness of the system Data linked to action, feedback at lower level, data used for planning, detect outbreaks, data used for the development and conduct of studies | Quantitative and qualitative methods, including interview, consultation, and documentation review | 10 key informants interview; consultation with stakeholders, document review of each system | Predefined scoring criteria for attributes: poor, average, or good | Mixed methods | Purposive sampling |
| WHO HMN 2008 [45] | Information dissemination and use, demand and analysis, policy and advocacy, planning and priority-setting, resource allocation, implementation and action | Mixed methods: quantitative and qualitative. Use 10 out of 197 questions among stakeholders at national and subnational levels | Use group discussions (100 major stakeholders), self-assessment approach, individual (less than 14) or group scoring to yield a percentage rating for each category | An overall score for each question, quartiles for the overall report | Expert panel discussion, operational indicators with quality assessment criteria | Lack of field verification of data use |
| Wilkinson and McCarthy | Extent of data recognition and use, strategies and routines, specific uses, dissemination | Quantitative and qualitative methods to use standardized semi-structured questionnaire telephone interviews of key informants from the management teams of the system | Telephone structured questionnaire interviews of 68 key informants from the 29 out of 34 management teams of the networks. Response options for most of the questionnaire items were yes/no or five or seven point Likert and semantic differential response scales | Quantitative and qualitative analysis of survey results. Qualitative data transcribed, ordered by question number, and common themes, then content analyzed to indicate frequencies and percentages. Correlational analyses used Pearson’s r for parametric data and Spearman’s Rho for non-parametric data | Quantification of qualitative data | Statistical analysis is limited by the size of the sample as there were only 29 networks and 68 individual participants, statistical power to detect an effect is weak, and general trends are mainly reported. |
| Authors Year | Attributes Major measures | Study design | Data collection methods | Data analysis methods | Contribution | Limitations |
|---|---|---|---|---|---|---|
| Ancker et al. 2011 [59] | Group discussion about root causes of poor data quality and strategies for solving the problems | Qualitative method by focus group discussion | Held a series of weekly team meetings over about 4 months with key informants involved in the data collection | Theme grouping to each data quality issue | Initiated by and related to identified poor data quality issues | Implicitly focused. Only analyzed causes not assessed the magnitude |
| Bosch-Capblanch et al. 2009 [58] | Quality scores Recording and reporting of data, keeping of vaccine ledgers and information system design | Quantitative method by user’s survey based on WHO DQA. A multistage weighted representative sampling procedure | Questionnaire based on a series of 19 questions and observations undertaken at each level (national, district and health units) | Each question 1 point. Average score, summary score, medians, inter-quartile ranges, confidence intervals, P value, bubble scatter chart, Rho value | Combined with data quality | Implicitly focused, the number of questions surveyed was less than that of the WHO DQA |
| CIHI 2009 [30] | Metadata documentation Data holding description, methodology, data collection and capture, data processing, data analysis and dissemination, data storage, and documentation. | Quantitative method by surveying users | Questionnaire | Undefined | 7 categories, with subcategories and definition and/or example | Implicitly focused |
| Corriols et al. 2008 [55] | Identification of underreporting reasons by reviewing information flow chart and non-reporting in physicians | Qualitative method to review documentations | Review the national reports on the system related to deficiency in the information flow chart and non-reporting in physicians | Undefined | Initiated by identified data quality issues | Implicitly focused |
| Dai et al. 2011 [69] | Data collection, data quality management, statistical analysis and data dissemination | Qualitative method, review documentations | Document review | Theme grouping | Desk review | Implicitly focused |
| Forster et al. 2008 | Routine data collection, training and data quality control | Quantitative method by online survey | Questionnaire | Descriptive statistics. | Examine associations between site characteristics and data quality | Implicitly focused. Convenience sample |
| Freestone et al. 2012 [52] | Data collection and recording processes | Qualitative method to review current processes about identification, code, geocode of address or location data. Staff consulted to establish and observe coder activities and entry processes | Review the processes; consultation with staff; observation of coder activities and entry processes to identify any potential cause of errors which then grouped thematically | Thematically grouping data | Identify each of the key elements of the geocoding process are factors that impact on geocoding quality | Differences in software and system settings need to be aware of. |
| Hahn et al. 2013 [50] | Data flow The generation and transmission of health information | Qualitative method to use workplace walkthroughs on 5 subsequent working days at each site | Informal observations of the generation and transmission of health information of all kinds for the selection of data flows | Undefined | Observation of walkthroughs | Undefined indicators |
| Iguiñiz-Romero and Palomino 2012 [70] | Data flow or data collection process: data collectors, frequencies, data flow, data processing and sharing, | Qualitative exploratory study including interview and review documentations | Open-ended, semi-structured questionnaire interviews with 15 key decision-makers. Review national documents and academic publications | Data recorded, transcribed, organized thematically and chronologically | Most respondents held key positions and a long period of reviewed publications | Purposive sample |
| Lin et al. 2012 [65] | Data collection and reporting | Qualitative methods based on CDC’s Guidelines, | Review guidelines and protocols using a detailed checklist; direct observation; focus group discussions and semi-structured interviews | Theme grouping | Field visits or observations of data collection to identify impact on the data quality | Undefined indicators |
| ME DQA 2008 [34] | Five functional areas: M&E structures, functions and capabilities, indicator definitions and reporting guidelines, data collection and reporting forms and tools, data management processes, and links with national reporting system | Quantitative and qualitative methods by 13 system assessment summary questions based on 39 questions from five functional areas. Score the system combined with a comprehensive audit of data quality | Off-site desk review of documentation provided by the program/project; on-site follow-up assessments at each level of the IS, including observation, interviews, and consultations with key informants | Using summary statistics based on judgment of the audit team. Three-point Likert scale to each response. Average scores for per site between 0 and 3 continuous scale | DQA protocol and system assessment protocol | Implicitly focused. The scores should be interpreted within the context of the interviews, documentation reviews, data verifications and observations made during the assessment. |
| ME PRISM 2010 [40] | ProcessesData collection, transmission, processing, analysis, display, quality checking, feedback | Quantitative method by questionnaire survey including data transmission, quality check, processing and analysis and assessing the respondent’s perceptions about the use of registers, data collection forms and information technology | Non-anonymous interviewing staff with identified name and title, including asking, observation and circling “yes or no” | Using a data entry and analysis tool (DEAT), described in quantitative terms rather than qualitative. Yes or No tick checklist | A diagnostic tool. Quantitative terms help set control limits and targets and monitor over time | Indicators are not all inclusive; tool should be adapted and pre-test and make adjustments |
| Ronveaux et al. 2005 [60] | Quality index (QI) Recording practices, storing/reporting practices, monitoring and evaluation, denominators used at district and national levels, and system design at national level | Quantitative and qualitative methods by external on-site evaluation after a multi-stage sampling based on WHO DQA. | Questionnaires and observations. Survey at national level (53 questions), district level (38 questions) and health-unit level (31 questions). Observations to workers at the health-unit level. They were asked to complete 20 hypothetical practices. | Descriptive statistics (aggregated scores, mean scores): 1 point each question or task observed. Correlational analyses by zero-order Pearson correlation coefficients | Implicitly focused. The chosen sample size and the precision of the results were dictated by logistical and financial considerations | |
| Venkatarao et al. 2012 [22] | Accuracy of case detection, data recording, data compilation, data transmission | Quantitative method by using a 4-stage sampling method to conduct field survey (questionnaire) during May-June 2005 among 178 subjects | Questionnaires of 2 study instruments: the first focused on the components of disease surveillance; the second assessed the ability of the study subject in identifying cases through a syndromic approach | Descriptive statistics analysis | Assessment from user’s viewpoint. | Implicitly focused. Lack of field verification of data collection process |
| WHO DQA 2003 [42] | Quality questions checklist, quality index Five components: recording practices, storing/reporting practices, monitoring and evaluation, denominators, system design (the receipt, processing, storage and tabulation of the reported data) | Quantitative and qualitative method using questionnaire checklists for each level (three levels: national, district, health unit level) of the system including 45, 38, 31 questions respectively | Questionnaires and discussions. Observations by walking around the health unit for field observation to validate the reported values | Percentage of the items answered yes. The target is 100% for each component | Describe the quality of data collection and transmission | Implicitly focused. The chosen sample size was dictated by logistical and financial considerations |
| WHO HMN 2008 [45] | Data management or metadata A written set of procedures for data management including data collection, storage, cleaning, quality control, analysis and presentation for users, an integrated data warehouse, a metadata dictionary, unique identifier codes available | Mixed methods: quantitative and qualitative. Use 5 out of 197 questions, at various national and subnational levels | Use group discussions around 100 major stakeholders, self-assessment approach, individual (less than 14) or group scoring to yield a percentage rating for each category | An overall score for each question, quartiles for the overall report | Expert panel discussion, operational indicators with quality assessment criteria | Lack of field verification of data collection process |
© 2014 by the authors; licensee MDPI, Basel, Switzerland. This article is an open access article distributed under the terms and conditions of the Creative Commons Attribution license (http://creativecommons.org/licenses/by/3.0/).
Share and Cite
Chen, H.; Hailey, D.; Wang, N.; Yu, P. A Review of Data Quality Assessment Methods for Public Health Information Systems. Int. J. Environ. Res. Public Health 2014, 11, 5170-5207. https://doi.org/10.3390/ijerph110505170
Chen H, Hailey D, Wang N, Yu P. A Review of Data Quality Assessment Methods for Public Health Information Systems. International Journal of Environmental Research and Public Health. 2014; 11(5):5170-5207. https://doi.org/10.3390/ijerph110505170
Chicago/Turabian StyleChen, Hong, David Hailey, Ning Wang, and Ping Yu. 2014. "A Review of Data Quality Assessment Methods for Public Health Information Systems" International Journal of Environmental Research and Public Health 11, no. 5: 5170-5207. https://doi.org/10.3390/ijerph110505170