Differences in Age-Standardized Mortality Rates for Avoidable Deaths Based on Urbanization Levels in Taiwan, 1971–2008

Abstract
:1. Introduction
2. Experimental Section
2.1. Causes of Mortality
2.2. Urbanization
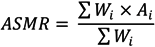
2.3. ASMR

| Urban1 | ||||||||
|---|---|---|---|---|---|---|---|---|
| Cause | Year | |||||||
| 1971–1975 | 1976–1980 | 1981–1985 | 1986–1990 | 1991–1995 | 1996–2000 | 2001–2005 | 2006–2008 | |
| All causes | 242.62 | 225.58 | 192.11 | 166.78 | 151.34 | 137.03 | 135.93 | 119.15 |
| Appendicitis | 0.17 | 0.15 | 0.06 | 0.04 | 0.02 | 0.01 | 0.04 | 0.00 |
| Asthma | 0.85 | 0.65 | 0.39 | 0.46 | 0.29 | 0.29 | 0.28 | 0.17 |
| Breast cancer | 8.61 | 10.20 | 10.52 | 12.37 | 14.65 | 17.07 | 21.02 | 20.79 |
| Cervical cancer | 9.38 | 9.56 | 8.61 | 8.35 | 7.73 | 6.52 | 5.86 | 3.87 |
| Gallbladder disease | 0.81 | 0.68 | 0.28 | 0.19 | 0.17 | 0.08 | 0.16 | 0.17 |
| Hernia | 0.00 | 0.01 | 0.06 | 0.01 | 0.00 | 0.01 | 0.00 | 0.00 |
| Hodgkin’s disease | 0.13 | 0.11 | 0.08 | 0.08 | 0.07 | 0.03 | 0.05 | 0.01 |
| Hypertension/CVD * | 119.68 | 114.52 | 91.96 | 59.26 | 40.79 | 26.56 | 24.32 | 17.94 |
| Injuries | 26.06 | 28.47 | 28.45 | 28.37 | 25.61 | 21.01 | 19.32 | 17.26 |
| Ischemic heart disease | 12.01 | 14.00 | 11.91 | 12.16 | 10.72 | 8.26 | 7.69 | 6.80 |
| Lung cancer | 13.74 | 18.20 | 18.44 | 18.14 | 17.61 | 17.87 | 23.31 | 22.38 |
| Maternal mortality | 1.27 | 0.78 | 0.44 | 0.26 | 0.19 | 0.19 | 0.13 | 0.09 |
| Tuberculosis | 10.29 | 5.34 | 3.08 | 1.60 | 0.95 | 0.76 | 0.44 | 0.23 |
| Ulcers | 2.68 | 1.52 | 1.12 | 0.84 | 0.54 | 0.64 | 0.69 | 0.34 |
| Uterine cancer | 6.83 | 5.58 | 3.68 | 2.06 | 1.37 | 1.26 | 1.64 | 1.82 |
| Urban2 | ||||||||
| Cause | Year | |||||||
| 1971–1975 | 1976–1980 | 1981–1985 | 1986–1990 | 1991–1995 | 1996–2000 | 2001–2005 | 2006–2008 | |
| All causes | 276.49 | 250.86 | 200.89 | 194.18 | 173.57 | 155.20 | 150.91 | 132.79 |
| Appendicitis | 0.07 | 0.14 | 0.08 | 0.03 | 0.01 | 0.02 | 0.01 | 0.03 |
| Asthma | 0.91 | 0.66 | 0.62 | 0.46 | 0.39 | 0.39 | 0.21 | 0.24 |
| Breast cancer | 7.65 | 9.20 | 8.70 | 11.79 | 14.00 | 15.97 | 19.99 | 20.19 |
| Cervical cancer | 7.99 | 8.06 | 8.05 | 8.20 | 8.77 | 7.02 | 6.06 | 4.74 |
| Gallbladder disease | 0.53 | 0.78 | 0.41 | 0.18 | 0.24 | 0.09 | 0.20 | 0.14 |
| Hernia | 0.03 | 0.02 | 0.02 | 0.01 | 0.00 | 0.00 | 0.01 | 0.00 |
| Hodgkin’s disease | 0.13 | 0.12 | 0.13 | 0.10 | 0.04 | 0.08 | 0.04 | 0.05 |
| Hypertension/CVD * | 126.46 | 129.27 | 95.47 | 72.74 | 50.21 | 34.74 | 30.14 | 23.74 |
| Injuries | 32.19 | 36.14 | 35.04 | 38.03 | 34.04 | 29.31 | 24.23 | 21.45 |
| Ischemic heart disease | 11.46 | 13.35 | 11.12 | 14.15 | 12.69 | 9.05 | 10.61 | 7.41 |
| Lung cancer | 14.37 | 15.45 | 14.38 | 17.17 | 17.29 | 18.35 | 22.08 | 21.45 |
| Maternal mortality | 1.85 | 1.22 | 0.66 | 0.32 | 0.24 | 0.18 | 0.15 | 0.12 |
| Tuberculosis | 12.88 | 7.16 | 2.72 | 2.15 | 1.07 | 0.79 | 0.54 | 0.41 |
| Ulcers | 3.57 | 1.83 | 1.92 | 0.84 | 0.76 | 0.68 | 0.93 | 0.58 |
| Uterine cancer | 9.38 | 6.88 | 4.98 | 2.85 | 1.65 | 0.99 | 1.57 | 2.08 |
| Urban3 | ||||||||
| Cause | Year | |||||||
| 1971–1975 | 1976–1980 | 1981–1985 | 1986–1990 | 1991–1995 | 1996–2000 | 2001–2005 | 2006–2008 | |
| All causes | 284.53 | 256.46 | 226.84 | 202.34 | 183.85 | 171.12 | 150.82 | 138.35 |
| Appendicitis | 0.35 | 0.09 | 0.11 | 0.05 | 0.07 | 0.04 | 0.02 | 0.04 |
| Asthma | 1.11 | 0.87 | 0.89 | 0.63 | 0.48 | 0.40 | 0.36 | 0.20 |
| Breast cancer | 5.73 | 6.39 | 7.34 | 9.21 | 11.90 | 14.51 | 16.85 | 17.74 |
| Cervical cancer | 6.03 | 6.74 | 7.07 | 7.05 | 8.17 | 7.96 | 6.26 | 4.99 |
| Gallbladder disease | 1.03 | 0.86 | 0.56 | 0.25 | 0.30 | 0.18 | 0.26 | 0.14 |
| Hernia | 0.00 | 0.03 | 0.01 | 0.00 | 0.01 | 0.00 | 0.00 | 0.00 |
| Hodgkin’s disease | 0.17 | 0.14 | 0.05 | 0.10 | 0.04 | 0.05 | 0.04 | 0.08 |
| Hypertension/CVD * | 108.24 | 115.41 | 103.88 | 74.53 | 52.85 | 35.56 | 29.89 | 23.18 |
| Injuries | 36.80 | 42.82 | 43.83 | 46.07 | 41.64 | 37.73 | 29.05 | 25.51 |
| Ischemic heart disease | 10.44 | 11.39 | 11.97 | 11.57 | 12.54 | 9.72 | 9.36 | 8.57 |
| Lung cancer | 10.41 | 11.66 | 14.35 | 14.95 | 16.20 | 17.75 | 19.10 | 22.04 |
| Maternal mortality | 2.36 | 1.33 | 0.74 | 0.40 | 0.27 | 0.31 | 0.12 | 0.22 |
| Tuberculosis | 14.37 | 7.16 | 3.83 | 1.88 | 1.41 | 0.96 | 0.52 | 0.21 |
| Ulcers | 5.28 | 2.84 | 1.96 | 1.07 | 1.27 | 0.66 | 0.72 | 0.60 |
| Uterine cancer | 8.56 | 7.17 | 6.02 | 3.63 | 1.68 | 1.13 | 1.45 | 1.36 |
| Urban1 | ||||||||||||||
|---|---|---|---|---|---|---|---|---|---|---|---|---|---|---|
| Cause | Year | |||||||||||||
| 1971–1975 | 1976–1980 | 1981–1985 | 1986–1990 | 1991–1995 | 1996–2000 | 2001–2005 | 2006–2008 | |||||||
| All causes | 369.79 | 351.70 | 316.12 | 293.39 | 284.04 | 270.44 | 290.91 | 268.50 | ||||||
| Appendicitis | 0.22 | 0.16 | 0.10 | 0.08 | 0.04 | 0.03 | 0.02 | 0.05 | ||||||
| Asthma | 0.64 | 0.63 | 0.43 | 0.43 | 0.53 | 0.40 | 0.46 | 0.33 | ||||||
| Gallbladder disease | 0.58 | 0.49 | 0.36 | 0.26 | 0.24 | 0.24 | 0.28 | 0.19 | ||||||
| Hernia | 0.05 | 0.06 | 0.03 | 0.01 | 0.01 | 0.03 | 0.01 | 0.01 | ||||||
| Hodgkin’s disease | 0.39 | 0.20 | 0.17 | 0.05 | 0.05 | 0.07 | 0.10 | 0.06 | ||||||
| Hypertension/CVD * | 152.56 | 149.73 | 129.88 | 99.58 | 79.24 | 63.66 | 56.91 | 49.98 | ||||||
| Injuries | 72.59 | 77.04 | 73.56 | 71.86 | 64.00 | 54.01 | 50.79 | 44.95 | ||||||
| Ischemic heart disease | 22.15 | 24.99 | 24.18 | 27.24 | 33.22 | 30.02 | 34.22 | 28.87 | ||||||
| Lung cancer | 26.35 | 30.23 | 32.46 | 32.61 | 30.74 | 31.41 | 37.45 | 37.11 | ||||||
| Tuberculosis | 21.68 | 12.86 | 7.15 | 4.57 | 3.44 | 2.40 | 1.66 | 0.96 | ||||||
| Ulcers | 7.66 | 3.84 | 3.30 | 2.16 | 2.16 | 2.14 | 2.06 | 1.39 | ||||||
| Urban2 | ||||||||||||||
| Cause | Year | |||||||||||||
| 1971–1975 | 1976–1980 | 1981–1985 | 1986–1990 | 1991–1995 | 1996–2000 | 2001–2005 | 2006–2008 | |||||||
| All causes | 424.88 | 405.55 | 334.42 | 346.80 | 326.00 | 310.66 | 326.74 | 308.83 | ||||||
| Appendicitis | 0.14 | 0.14 | 0.11 | 0.06 | 0.05 | 0.05 | 0.05 | 0.01 | ||||||
| Asthma | 1.37 | 0.66 | 0.60 | 0.57 | 0.66 | 0.39 | 0.53 | 0.50 | ||||||
| Gallbladder disease | 0.49 | 0.58 | 0.36 | 0.21 | 0.34 | 0.32 | 0.29 | 0.29 | ||||||
| Hernia | 0.06 | 0.05 | 0.04 | 0.01 | 0.03 | 0.00 | 0.06 | 0.02 | ||||||
| Hodgkin’s disease | 0.25 | 0.30 | 0.18 | 0.18 | 0.10 | 0.10 | 0.11 | 0.05 | ||||||
| Hypertension/CVD * | 165.09 | 167.70 | 128.09 | 107.90 | 91.24 | 71.81 | 70.16 | 64.62 | ||||||
| Injuries | 92.14 | 103.93 | 92.54 | 104.01 | 89.05 | 75.09 | 67.64 | 60.01 | ||||||
| Ischemic heart disease | 20.96 | 22.96 | 22.63 | 29.24 | 33.58 | 29.64 | 36.03 | 31.37 | ||||||
| Lung cancer | 20.57 | 26.97 | 28.60 | 29.58 | 33.71 | 32.12 | 38.02 | 39.57 | ||||||
| Tuberculosis | 26.77 | 16.13 | 7.57 | 5.65 | 3.93 | 2.73 | 2.22 | 1.32 | ||||||
| Ulcers | 10.79 | 6.78 | 4.31 | 2.77 | 2.65 | 2.56 | 1.96 | 1.53 | ||||||
| Urban3 | ||||||||||||||
| Cause | Year | |||||||||||||
| 1971–1975 | 1976–1980 | 1981–1985 | 1986–1990 | 1991–1995 | 1996–2000 | 2001–2005 | 2006–2008 | |||||||
| All causes | 451.97 | 438.00 | 401.12 | 381.26 | 375.94 | 358.38 | 357.20 | 347.33 | ||||||
| Appendicitis | 0.33 | 0.24 | 0.17 | 0.06 | 0.04 | 0.03 | 0.01 | 0.01 | ||||||
| Asthma | 1.40 | 0.72 | 0.73 | 0.75 | 0.60 | 0.59 | 0.63 | 0.42 | ||||||
| Gallbladder disease | 0.66 | 0.76 | 0.54 | 0.35 | 0.46 | 0.33 | 0.30 | 0.25 | ||||||
| Hernia | 0.13 | 0.06 | 0.03 | 0.03 | 0.08 | 0.00 | 0.01 | 0.03 | ||||||
| Hodgkin’s disease | 0.19 | 0.31 | 0.21 | 0.08 | 0.09 | 0.14 | 0.12 | 0.08 | ||||||
| Hypertension/CVD * | 148.89 | 157.25 | 136.35 | 105.05 | 91.42 | 68.61 | 70.73 | 62.89 | ||||||
| Injuries | 101.15 | 118.15 | 123.64 | 128.42 | 119.35 | 103.52 | 86.43 | 77.27 | ||||||
| Ischemic heart disease | 16.57 | 19.28 | 22.60 | 26.29 | 30.79 | 25.86 | 31.06 | 31.36 | ||||||
| Lung cancer | 19.01 | 22.98 | 29.31 | 29.31 | 32.09 | 32.60 | 37.73 | 40.98 | ||||||
| Tuberculosis | 33.67 | 19.56 | 11.56 | 6.66 | 4.72 | 3.41 | 2.42 | 1.08 | ||||||
| Ulcers | 16.86 | 8.45 | 5.66 | 3.94 | 3.48 | 3.24 | 2.45 | 2.05 | ||||||
| Urban4 | ||||||||||||||
| Cause | Year | |||||||||||||
| 1971–1975 | 1976–1980 | 1981–1985 | 1986–1990 | 1991–1995 | 1996–2000 | 2001–2005 | 2006–2008 | |||||||
| All causes | 488.65 | 484.97 | 459.85 | 442.21 | 446.65 | 436.33 | 427.62 | 420.17 | ||||||
| Appendicitis | 0.52 | 0.16 | 0.25 | 0.08 | 0.00 | 0.00 | 0.05 | 0.00 | ||||||
| Asthma | 1.89 | 1.08 | 1.13 | 0.87 | 1.08 | 0.86 | 0.69 | 0.89 | ||||||
| Gallbladder disease | 1.12 | 0.76 | 0.61 | 0.45 | 0.39 | 0.46 | 0.41 | 0.45 | ||||||
| Hernia | 0.13 | 0.03 | 0.08 | 0.00 | 0.01 | 0.01 | 0.00 | 0.00 | ||||||
| Hodgkin’s disease | 0.25 | 0.33 | 0.17 | 0.05 | 0.08 | 0.11 | 0.24 | 0.15 | ||||||
| Hypertension/CVD * | 139.43 | 155.49 | 140.57 | 108.75 | 93.57 | 79.40 | 75.31 | 72.48 | ||||||
| Injuries | 105.27 | 127.34 | 137.00 | 151.32 | 144.48 | 130.25 | 105.60 | 90.73 | ||||||
| Ischemic heart disease | 13.42 | 17.55 | 21.76 | 25.97 | 31.99 | 30.23 | 34.34 | 33.80 | ||||||
| Lung cancer | 19.09 | 21.32 | 29.68 | 34.37 | 33.97 | 39.17 | 42.62 | 43.80 | ||||||
| Tuberculosis | 44.01 | 27.25 | 16.60 | 10.18 | 7.88 | 6.64 | 4.29 | 2.33 | ||||||
| Ulcers | 20.72 | 11.54 | 7.82 | 5.39 | 5.32 | 4.31 | 2.99 | 2.80 | ||||||
| Urban5 | ||||||||||||||
| Cause | Year | |||||||||||||
| 1971–1975 | 1976–1980 | 1981–1985 | 1986–1990 | 1991–1995 | 1996–2000 | 2001–2005 | 2006–2008 | |||||||
| All causes | 303.42 | 279.22 | 245.35 | 220.13 | 201.82 | 195.47 | 174.69 | 159.22 | ||||||
| Appendicitis | 0.31 | 0.09 | 0.18 | 0.06 | 0.02 | 0.02 | 0.06 | 0.04 | ||||||
| Asthma | 1.31 | 0.92 | 0.94 | 0.66 | 0.76 | 0.59 | 0.43 | 0.48 | ||||||
| Breast cancer | 5.22 | 5.68 | 5.93 | 8.08 | 10.34 | 12.39 | 14.79 | 15.93 | ||||||
| Cervical cancer | 5.51 | 7.23 | 6.94 | 6.59 | 8.31 | 7.70 | 7.34 | 4.95 | ||||||
| Gallbladder disease | 0.95 | 0.84 | 0.51 | 0.38 | 0.35 | 0.32 | 0.12 | 0.18 | ||||||
| Hernia | 0.04 | 0.05 | 0.00 | 0.00 | 0.00 | 0.00 | 0.00 | 0.00 | ||||||
| Hodgkin’s disease | 0.06 | 0.17 | 0.10 | 0.02 | 0.02 | 0.05 | 0.10 | 0.03 | ||||||
| Hypertension/CVD * | 92.99 | 100.31 | 92.48 | 74.21 | 52.29 | 40.71 | 33.19 | 28.40 | ||||||
| Injuries | 38.80 | 45.44 | 49.80 | 52.62 | 48.34 | 47.66 | 35.89 | 31.33 | ||||||
| Ischemic heart disease | 7.52 | 10.32 | 11.75 | 13.44 | 14.56 | 10.90 | 11.23 | 10.60 | ||||||
| Lung cancer | 10.28 | 11.86 | 14.76 | 15.36 | 16.26 | 21.04 | 20.44 | 20.24 | ||||||
| Maternal mortality | 3.84 | 2.48 | 1.17 | 0.40 | 0.30 | 0.35 | 0.21 | 0.09 | ||||||
| Tuberculosis | 19.39 | 10.52 | 5.95 | 3.33 | 2.06 | 1.92 | 1.27 | 0.42 | ||||||
| Ulcers | 6.82 | 3.94 | 2.04 | 1.20 | 0.92 | 0.73 | 0.61 | 0.76 | ||||||
| Uterine cancer | 8.30 | 9.51 | 6.43 | 3.39 | 1.74 | 0.79 | 0.91 | 1.38 | ||||||


3. Results and Discussion
3.1. Primary Results
3.1.1. All-cause Mortality
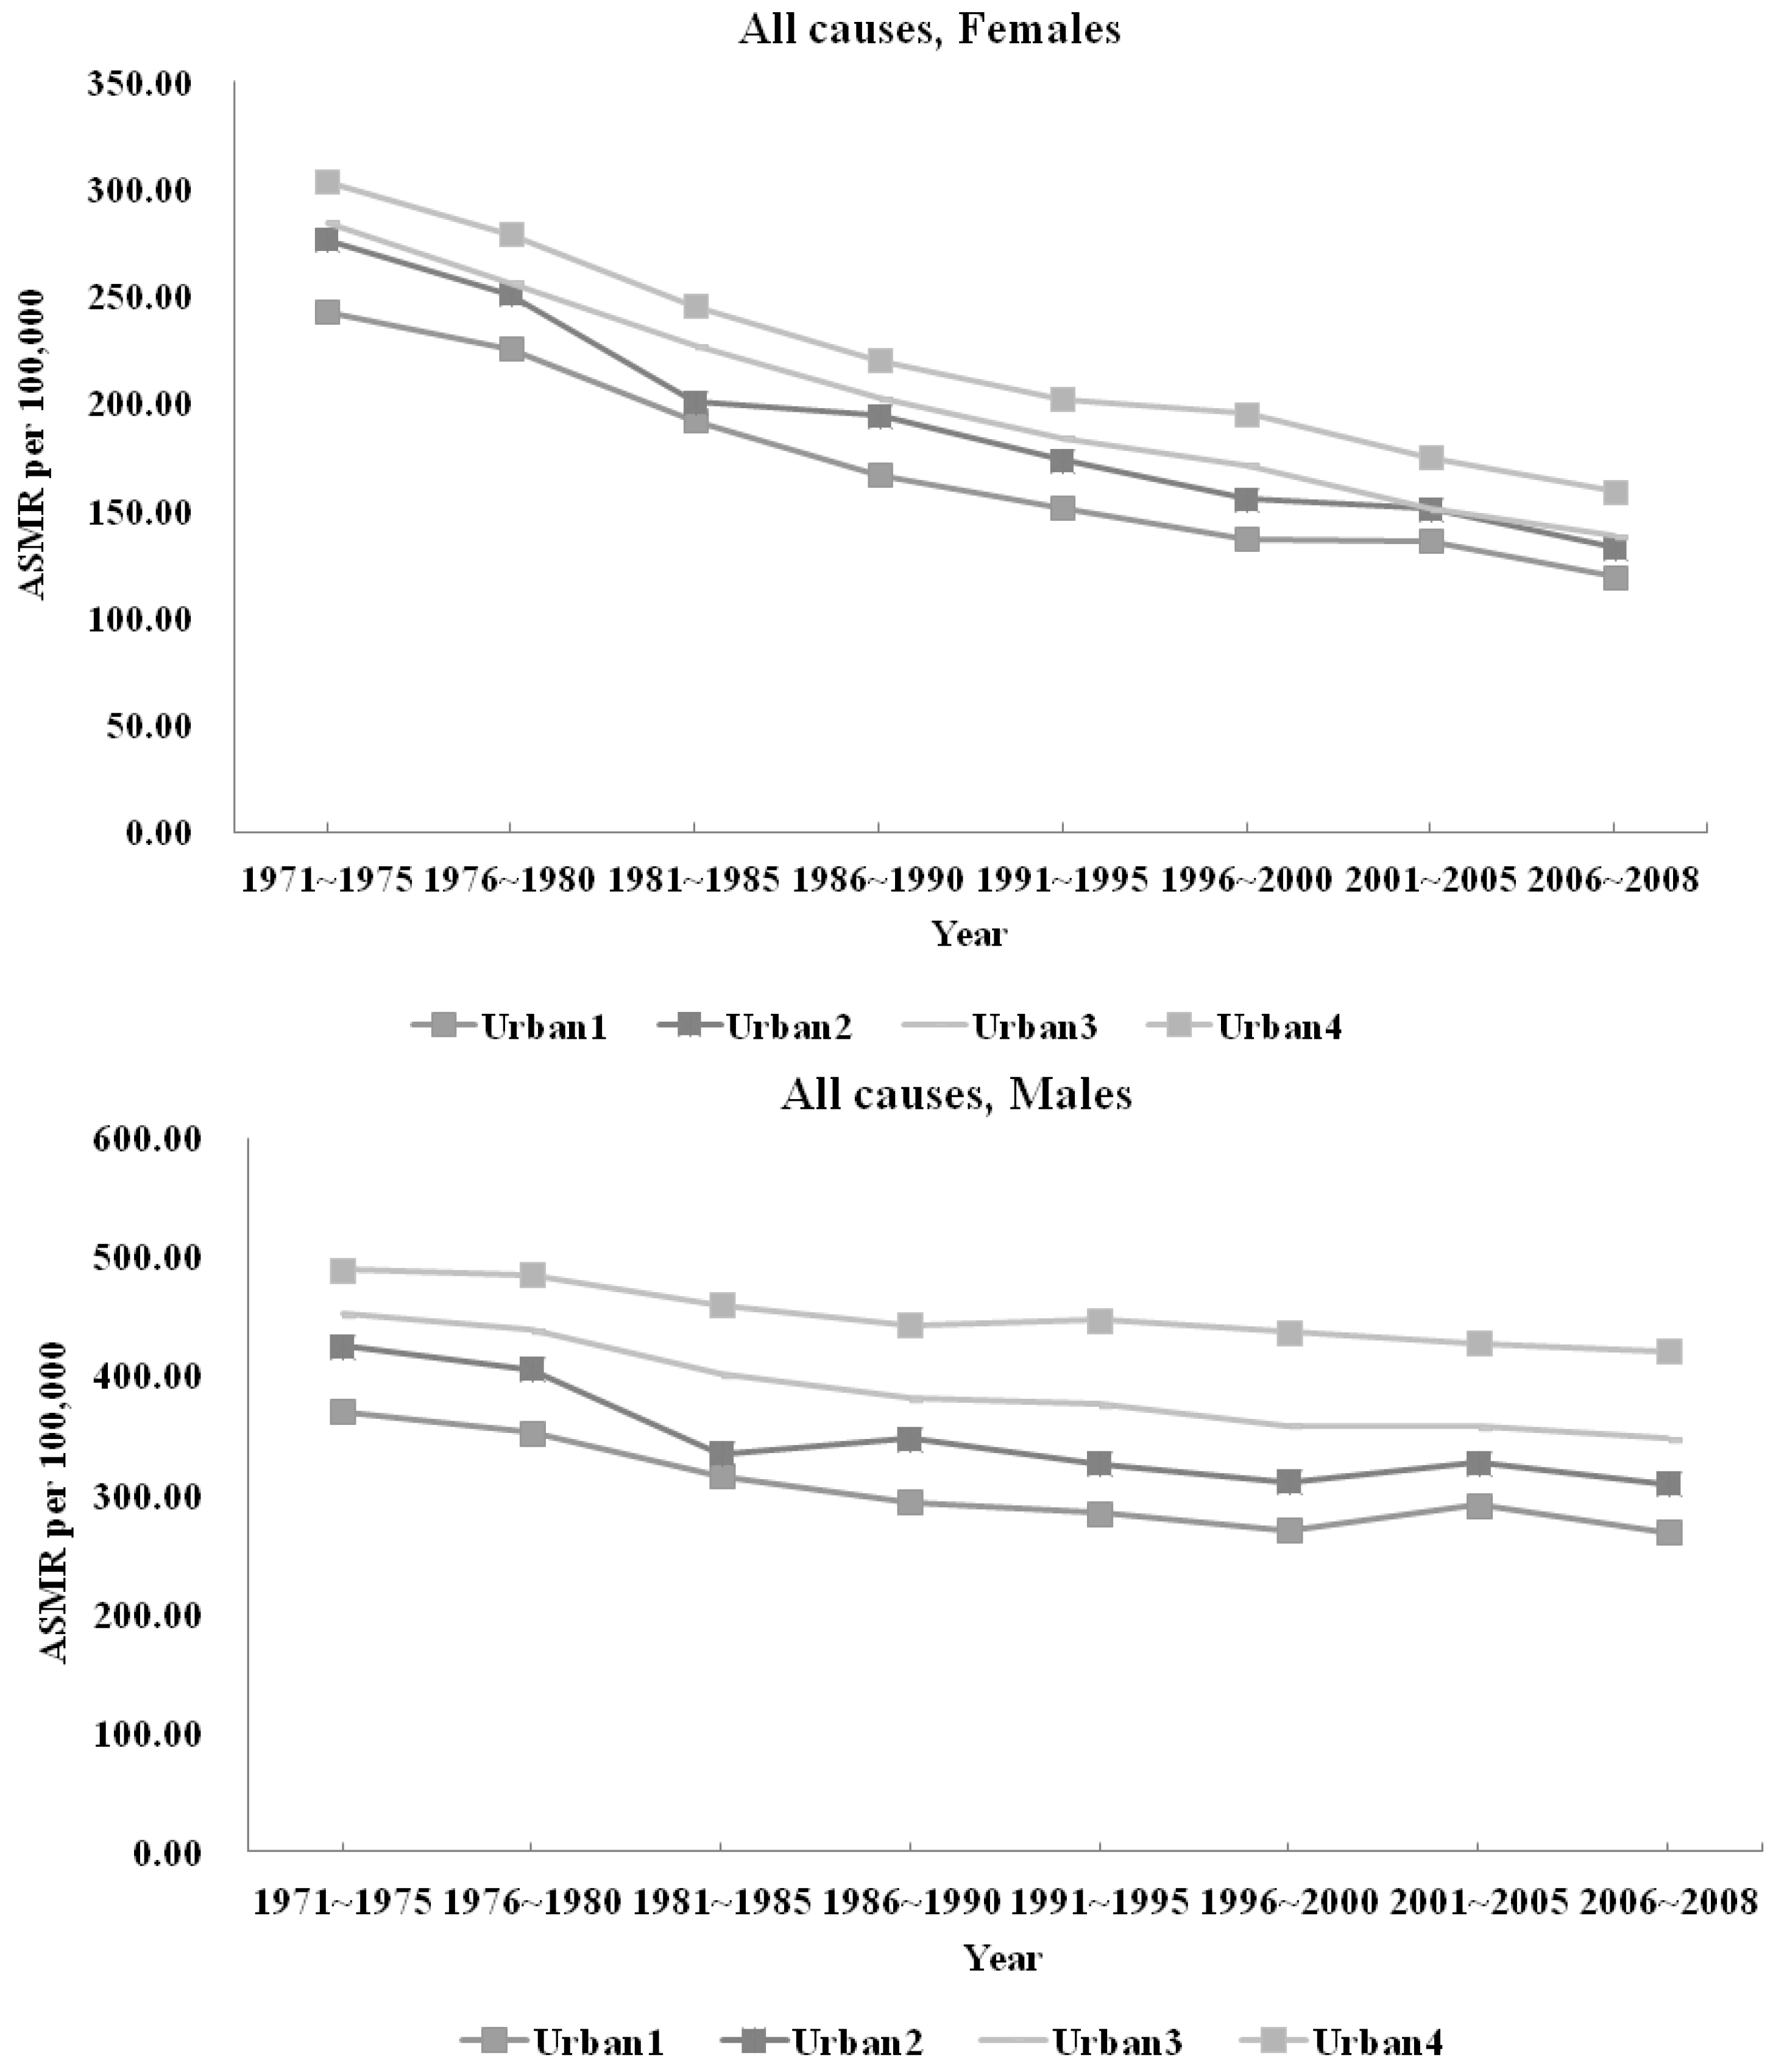
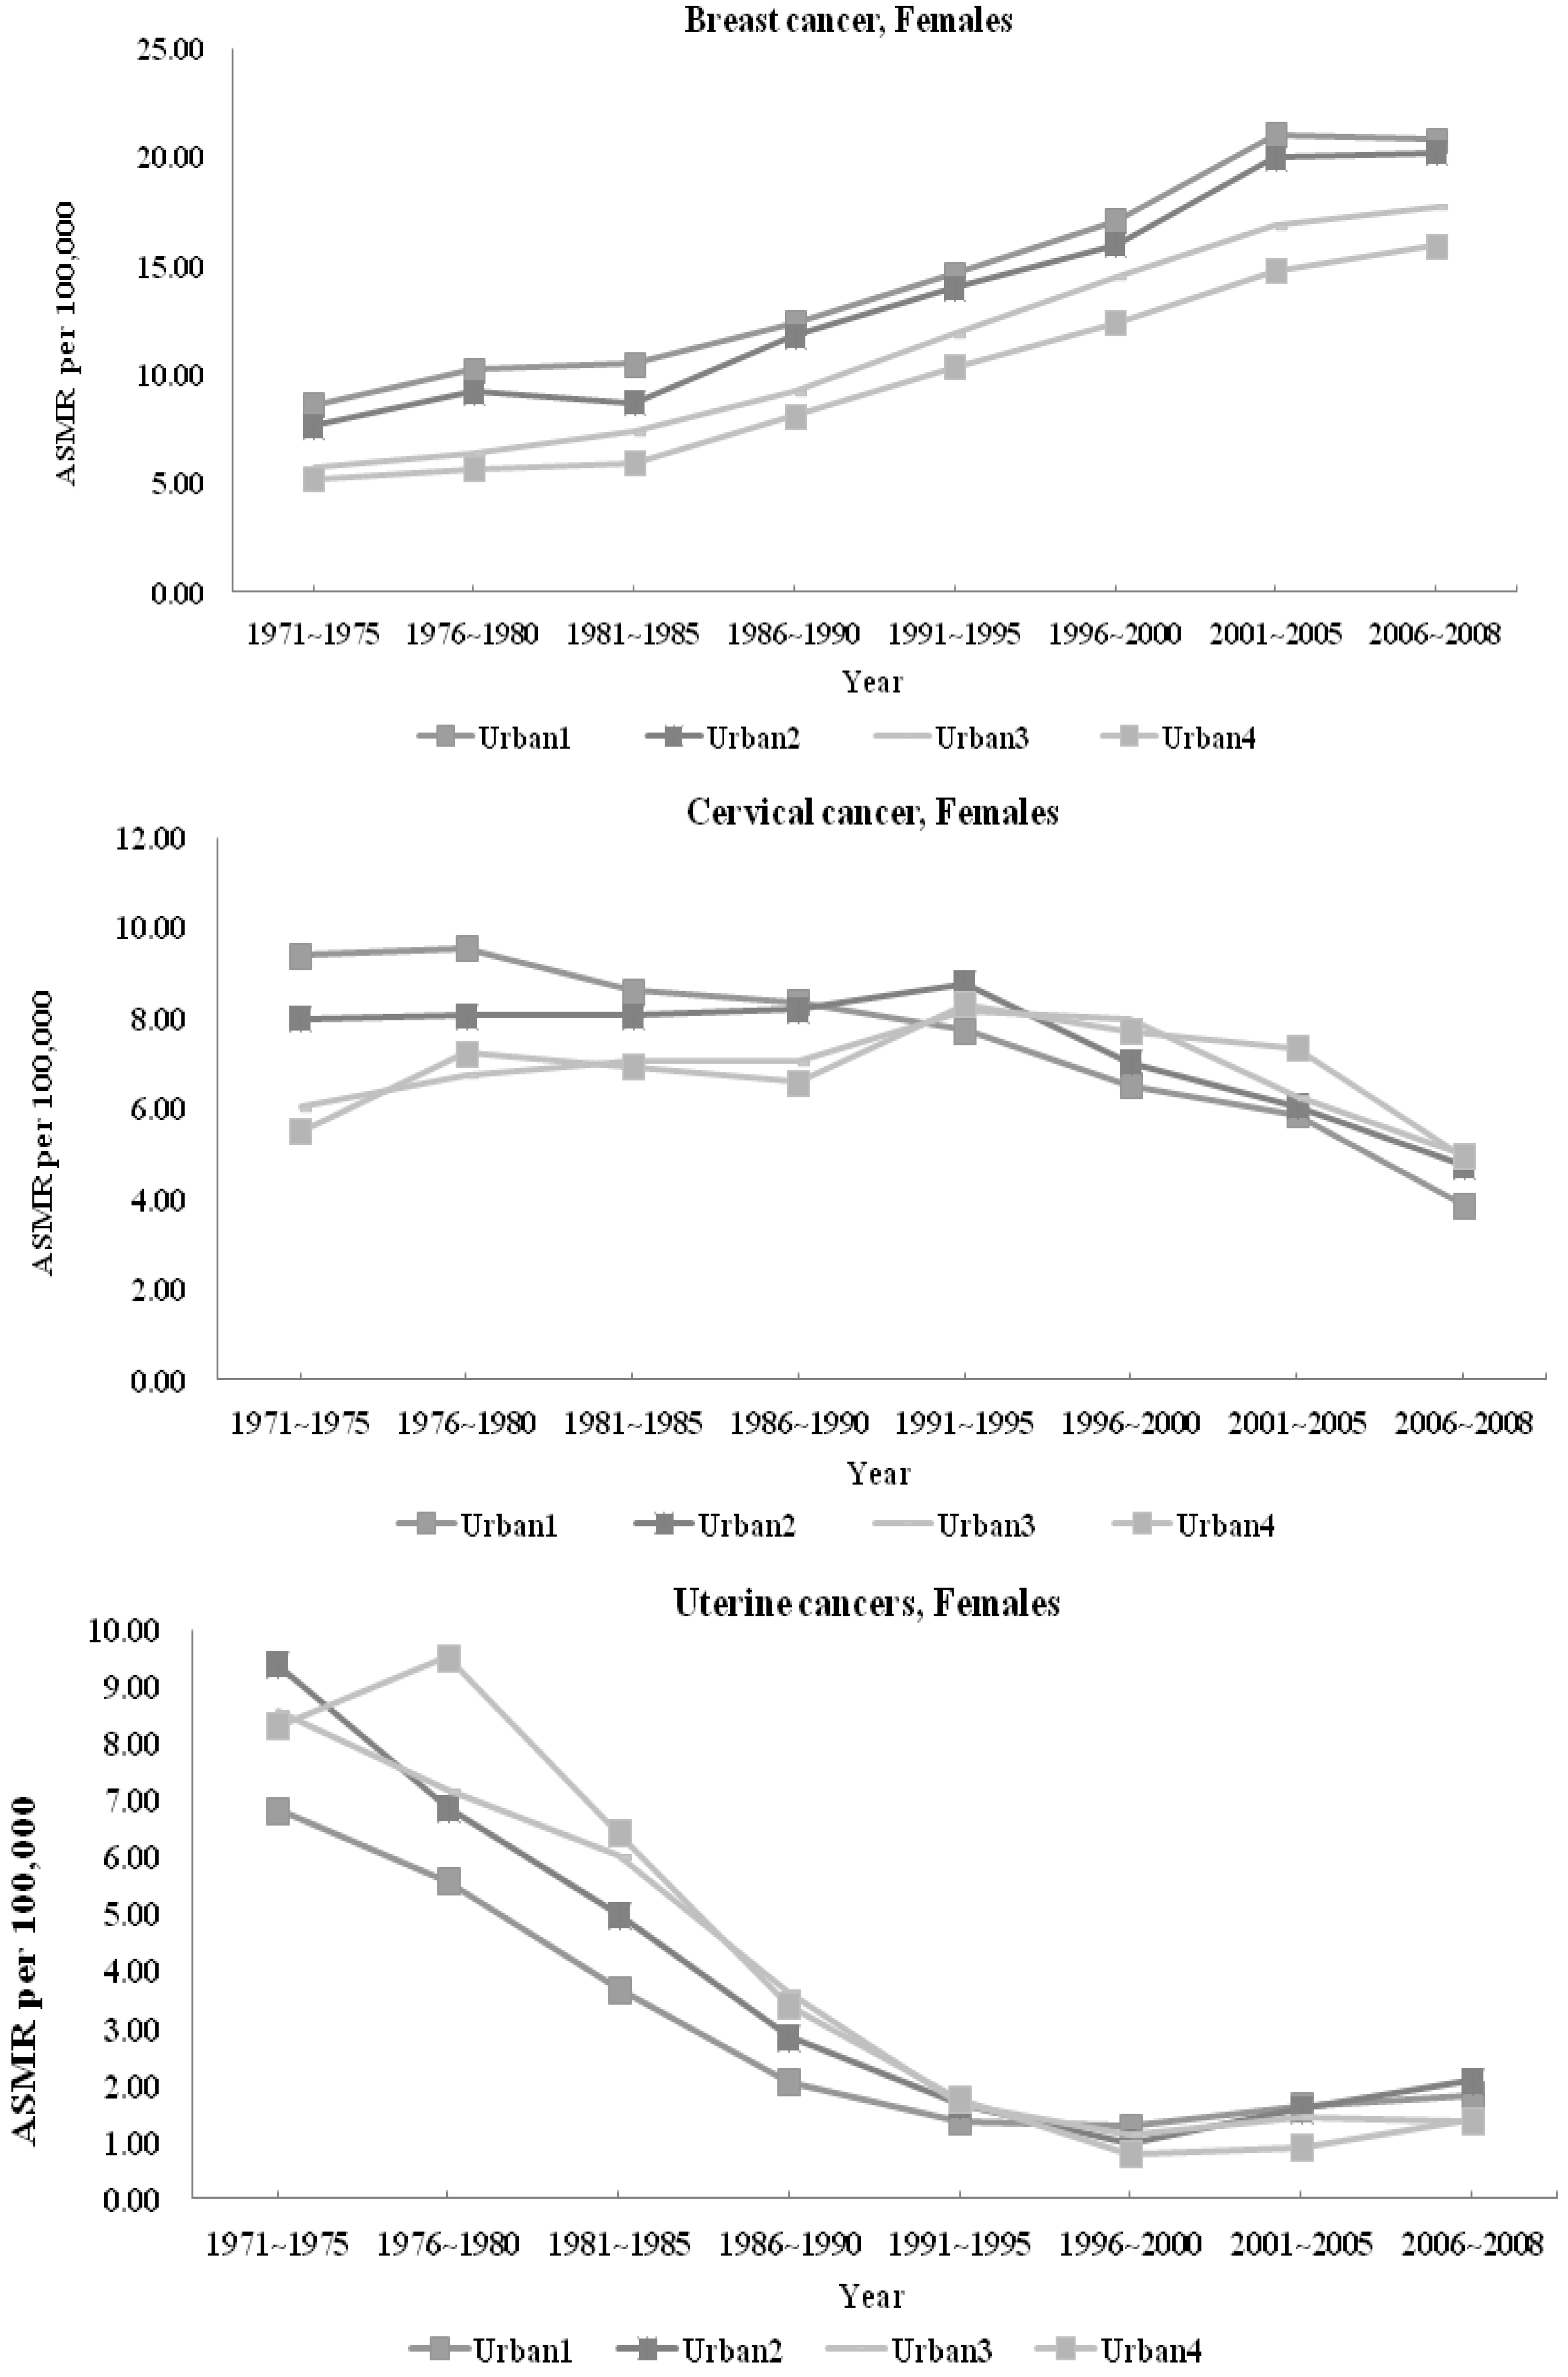
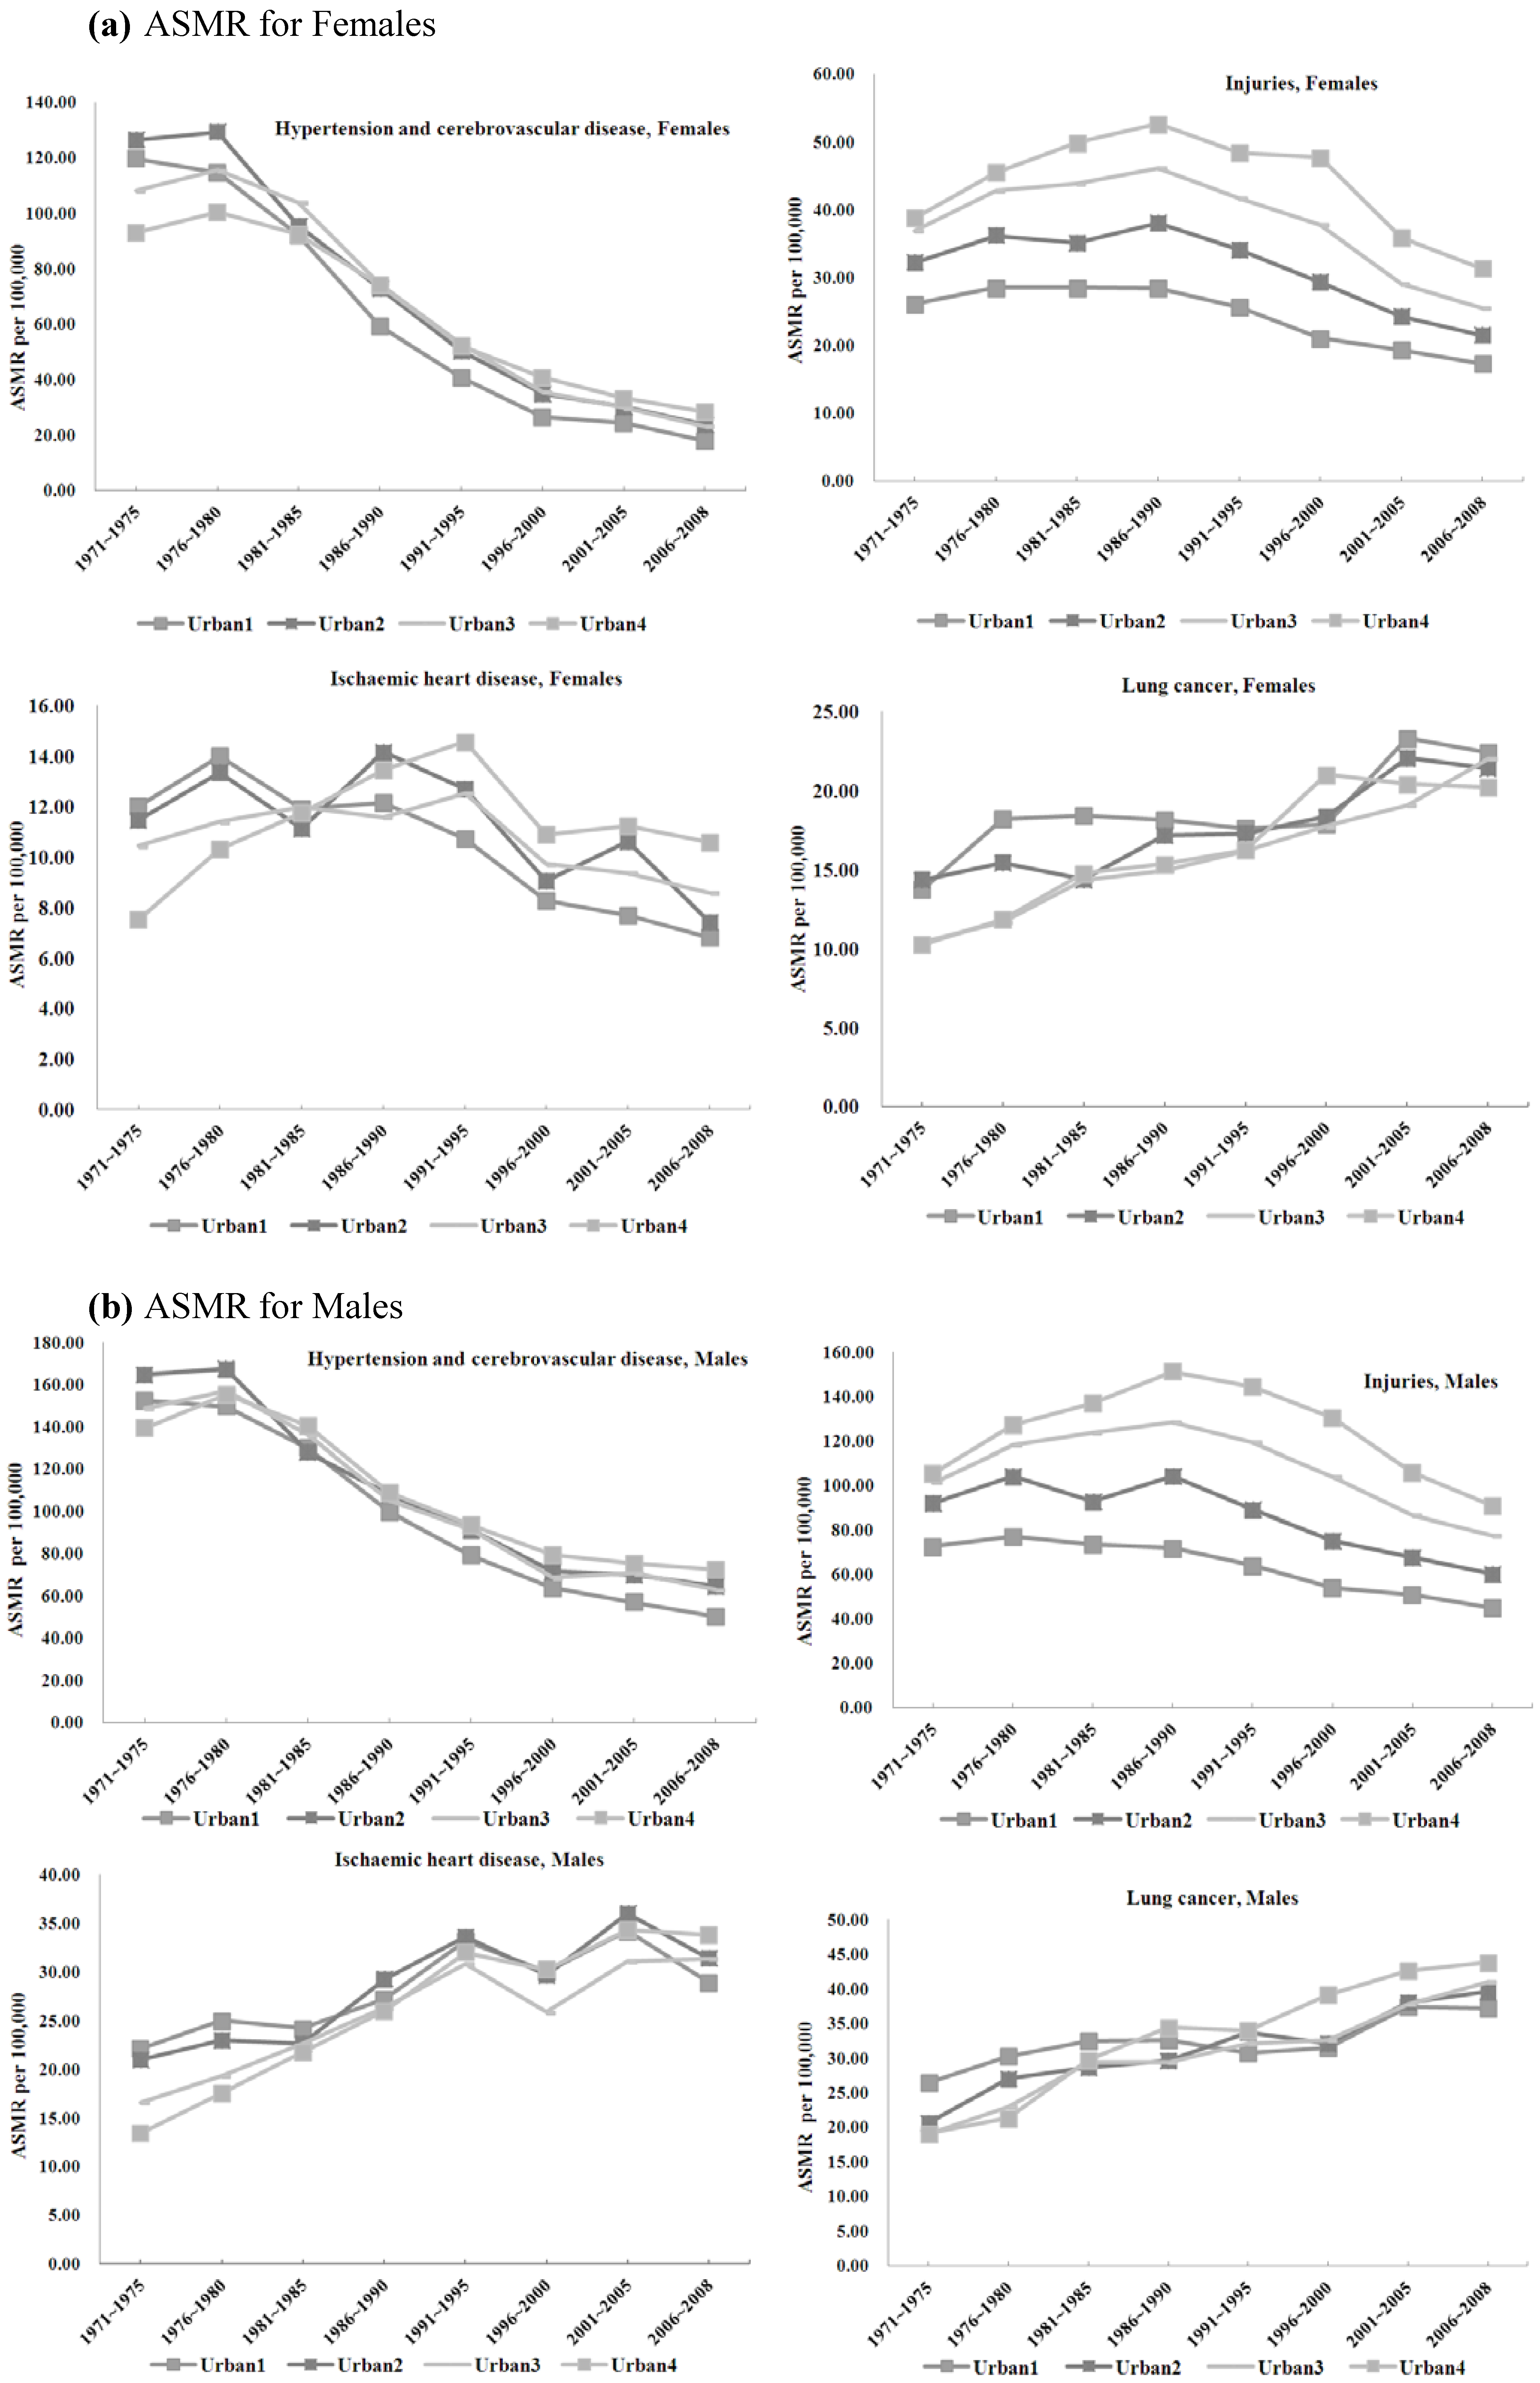
3.1.2. Avoidable Mortality and Urbanization
3.2. Discussion
3.2.1. All-cause Mortality
3.2.2 Injuries
3.2.3. Gender-specific ASMRs
3.2.4. Chronic Illnesses
Asthma
Hypertension and Cerebrovascular Diseases
Ischemic Heart Disease
Lung Cancer
3.3. Limitations
4. Conclusions
Acknowledgments
Author Contributions
Conflicts of Interests
References
- Moore, M.; Gould, P.; Keary, B.S. Global urbanization and impact on health. Int. J. Hyg. Environ. Health 2003, 206, 269–278. [Google Scholar]
- United Nations Secretariat. United Nations Expert Group Meeting on Population Distribution, Urbanization, Internal Migration and Development; Population Division, Department of Economic and Social Affairs, United Nations: New York, NY, USA, 2008. [Google Scholar]
- Deshpande, A.; Mishra, P. Urbanization, air pollution and human health. J. Environ. Res. Dev. 2007, 1, 305–317. [Google Scholar]
- Knudsen, A.B.; Slooff, R. Vector-borne disease problems in rapid urbanization: New approaches to vector control. Bull. WHO 1992, 70, 1–6. [Google Scholar]
- Population and Health Dynamics in Nairobi’s Informal Settlements: Report of the Nairobi Cross-Sectional Slums Survey (NCSS) 2000; African Population and Health Research Center: Nairobi, Kenya, 2002.
- Ludermir, A.B.; Harpham, T. Urbanization and mental health in Brazil: Social and economic dimensions. Health Place 1998, 4, 223–232. [Google Scholar] [CrossRef]
- Leon, D.A. Cities, urbanization and health. Int. J. Epidemiol. 2008, 37, 4–8. [Google Scholar] [CrossRef]
- Zhu, Y.-G.; Ioannidis, J.P.; Li, H.; Jones, K.C.; Martin, F.L. Understanding and harnessing the health effects of rapid urbanization in China. Environ. Sci. Technol. 2011, 45, 5099–5104. [Google Scholar] [CrossRef]
- Galea, S. Urbanization, urbanicity, and health. J. Urban Health 2002, 79, S1–S12. [Google Scholar] [CrossRef]
- Yang, C.-Y.; Hsieh, Y.-L. The Relationship between population density and cancer mortality in Taiwan. Cancer Sci. 1998, 89, 355–360. [Google Scholar] [CrossRef]
- Chen, C.J.; Wu, H.Y.; Chuang, Y.C.; Chang, A.S.; Luh, K.T.; Chao, H.H.; Chen, K.Y.; Chen, S.G.; Lai, G.M.; Huang, H.H.; et al. Epidemiologic characteristics and multiple risk factors of lung cancer in Taiwan. Anticancer Res. 1990, 10, 971–976. [Google Scholar]
- Yang, C.-Y.; Chiu, J.-F.; Chiu, H.-F.; Wang, T.-N.; Lee, C.-H.; Ko, Y.-C. Relationship between water hardness and coronary mortality in Taiwan. J. Toxicol. Environ. Health 1996, 49, 1–9. [Google Scholar]
- Chen, C.-J.; Wang, C.-J. Ecological correlation between arsenic level in well water and age-adjusted mortality from malignant neoplasms. Cancer Res. 1990, 50, 5470–5474. [Google Scholar]
- Yang, C.-Y.; Cheng, M.-F.; Tsai, S.-S.; Hung, C.-F. Fluoride in drinking water and cancer mortality in Taiwan. Environ. Res. 2000, 82, 189–193. [Google Scholar] [CrossRef]
- Yang, C.-Y.; Chiu, H.-F.; Chiu, J.-F.; Kao, W.-Y.; Tsai, S.-S.; Lan, S.-J. Cancer mortality and residence near petrochemical industries in Taiwan. J. Toxicol. Environ. Health Pt. A 1997, 50, 265–274. [Google Scholar] [CrossRef]
- Yang, C.-Y.; Hung, C.-F. Colon cancer mortality and total hardness levels in Taiwan’s drinking water. Arch. Environ. Contam. Toxicol. 1998, 35, 148–151. [Google Scholar] [CrossRef]
- Hung, L.-J.; Tsai, S.-S.; Chen, P.-S.; Yang, Y.-H.; Liou, S.-H.; Wu, T.-N.; Yang, C.-Y. Traffic air pollution and risk of death from breast cancer in Taiwan: Fine particulate matter (PM2.5) as a proxy marker. Aerosol Air Qual. Res. 2012, 12, 275–282. [Google Scholar]
- Yang, C.-Y.; Chiu, J.-F.; Lin, M.-C.; Cheng, M.-F. Geographic variations in mortality from motor vehicle crashes in Taiwan. J. Trauma Acute Care Surg. 1997, 43, 74–77. [Google Scholar] [CrossRef]
- Cheng, Y.; Guo, Y.-L.; Yeh, W.-Y. A national survey of psychosocial job stressors and their implications for health among working people in Taiwan. Int. Arch. Occup. Environ. Health 2001, 74, 495–504. [Google Scholar] [CrossRef]
- Huang, S.L.; Lin, K.C.; Pan, W.H. Dietary factors associated with physician-diagnosed asthma and allergic rhinitis in teenagers: Analyses of the first Nutrition and Health Survey in Taiwan. Clin. Experiment Allergy 2001, 31, 259–264. [Google Scholar]
- Chen, L.; Chen, C.-L.; Yang, W.-C. The influences of Taiwan’s national health insurance on women’s choice of prenatal care facility: Investigation of differences between rural and non-rural areas. BMC Health Serv. Res. 2008, 8. [Google Scholar] [CrossRef]
- Chen, L.; Yip, W.; Chang, M.-C.; Lin, H.-S.; Lee, S.-D.; Chiu, Y.-L.; Lin, Y.-H. The effects of Taiwan’s National Health Insurance on access and health status of the elderly. Health Econ. 2007, 16, 223–242. [Google Scholar] [CrossRef]
- Chie, W.C.; Cheng, K.W.; Fu, C.H.; Yen, L.L. A study on women’s practice of breast self-examination in Taiwan. Prev. Med. 1993, 22, 316–324. [Google Scholar] [CrossRef]
- Hu, Y.-H.; Wu, A.C.-C. Many ways to health: A study of 2,000 rural and urban Taiwan families. Amer J. Chin. Med. 1980, 8, 313–330. [Google Scholar] [CrossRef]
- Chen, P.-L.; Huang, W.; Chuang, Y.-L.; Warren, C.W.; Jones, N.R.; Asma, S. Prevalence of tobacco use among junior high and senior high school students in Taiwan. J. School Health 2008, 78, 649–654. [Google Scholar]
- Lu, T.-H.; Lee, M.-C.; Chou, M.-C. Accuracy of cause-of-death coding in Taiwan: Types of miscoding and effects on mortality statistics. Int. J. Epidemiol. 2000, 29, 336–343. [Google Scholar] [CrossRef]
- Holland, W. Measuring the quality of medical care. J. Health Serv. Res. Policy 2009, 14, 183–185. [Google Scholar] [CrossRef]
- Tzeng, G.; Wu, T. Characteristics of urbanization levels in Taiwan districts. Geogr. Res. 1986, 12, 287–323. [Google Scholar]
- Lin, H-C; Kao, S; Tang, C-H; Chang, W-Y. Using a population-based database to explore the inter-specialty differences in physician practice incomes in Taiwan. Health Policy 2005, 73, 253–262. [Google Scholar] [CrossRef]
- Liu, C.; Hung, Y.; Chuang, Y.; Chen, Y.; Weng, W.; Liu, J.; Liang, K. Incorporating development stratification of Taiwan townships into sampling design of large scale health interview survey. J. Health Manage. 2006, 4, 1–22. [Google Scholar]
- Ahmad, O.E.; Boschi-Pinto, C.; Lopez, A.D.; Lozano, R.; Inoue, M. Age Standardization of Rates: A New WHO Standard; WHO: Geneva, Switzerland, 2010. [Google Scholar]
- International Monetary Fund: World Economic Outlook Database. 2012. Available online: http://www.imf.org/external/data.htm (accessed on 30 January 2014).
- Foreign Exchange Reserves (including Gold). Available online: http://www.cbc.gov.tw/public/data/EBOOKXLS/fs/p3.pdf (accessed on 9 September 2013).
- Cheng, T.-M. Taiwan’s new national health insurance program: Genesis and experience so far. Health Affair. 2003, 22, 61–76. [Google Scholar] [CrossRef]
- Chiang, T.-L. Taiwan’s 1995 health care reform. Health Policy 1997, 39, 225–239. [Google Scholar] [CrossRef]
- Massie, D.L.; Campbell, K.L.; Williams, A.F. Traffic Accident involvement rates by driver age and gender. Accid. Anal. Prevent. 1995, 27, 73–87. [Google Scholar] [CrossRef]
- Tsai, M.-C.; Hemenway, D. Effect of the mandatory helmet law in Taiwan. Inj. Prev. 1999, 5, 290–291. [Google Scholar] [CrossRef]
- Chen, Y.Y.; You, S.L.; Chen, C.A.; Shih, L.Y.; Koong, S.L.; Chao, K.Y.; Hsiao, M.L.; Hsieh, C.Y.; Chen, C.J. Effectiveness of national cervical cancer screening programme in Taiwan: 12-year experiences. Br. J. Cancer 2009, 101, 174–177. [Google Scholar] [CrossRef]
- Peto, J.; Gilham, C.; Fletcher, O.; Matthews, F.E. The cervical cancer epidemic that screening has prevented in the UK. Lancet 2004, 364, 249–256. [Google Scholar] [CrossRef]
- Nelson, H.D.; Tyne, K.; Naik, A.; Bougatsos, C.; Chan, B.K.; Humphrey, L. Screening for breast cancer: An update for the U.S. preventive services task force. Ann. Intern. Med. 2009, 151, 727–737. [Google Scholar] [CrossRef]
- Leong, S.L.; Shen, Z.-Z.; Liu, T.-J.; Agarwal, G.; Tajima, T.; Paik, N.-S.; Sandelin, K.; Derossis, A.; Cody, H.; Foulkes, W. Is breast cancer the same disease in asian and western countries? World J. Surgery 2010, 34, 2308–2324. [Google Scholar] [CrossRef]
- Tan, S.M.; Evans, A.J.; Lam, T.P.; Cheung, K.L. How relevant is breast cancer screening in the Asia/Pacific region? Breast 2007, 16, 113–119. [Google Scholar]
- Guo, Y.L.; Lin, Y.-C.; Sung, F.-C.; Huang, S.-L.; Ko, Y.-C.; Lai, J.-S.; Su, H.-J.; Shaw, C.-K.; Lin, R.-S.; Dockery, D.W. Climate, traffic-related air pollutants, and asthma prevalence in middle-school children in Taiwan. Environ. Health Perspect. 1999, 107, 1001–1006. [Google Scholar] [CrossRef]
- Suissa, S.; Ernst, P.; Benayoun, S.; Baltzan, M.; Cai, B. Low-dose inhaled corticosteroids and the prevention of death from asthma. N. Engl. J. Med. 2000, 343, 332–336. [Google Scholar] [CrossRef]
- Hung, T.P. Changes in mortality from cerebrovascular disease and clinical pattern of stroke in Taiwan. J. Formos. Med. Assoc. 1993, 92, 687–696. [Google Scholar]
- Hu, H.; Chu, F.; Wong, W.; Lo, Y.; Sheng, W. Trends in mortality from cerebrovascular disease in Taiwan. Stroke 1986, 17, 1121–1125. [Google Scholar] [CrossRef]
- Doll, R.; Hill, A.B. Lung cancer and other causes of death in relation to smoking. BMJ 1956, 2, 1071–1081. [Google Scholar] [CrossRef]
- Hecht, S.S. Tobacco smoke carcinogens and lung cancer. J. Natl. Cancer Inst. 1999, 91, 1194–1210. [Google Scholar] [CrossRef]
- Zhong, L.; Goldberg, M.S.; Parent, M.E.; Hanley, J.A. Exposure to environmental tobacco smoke and the risk of lung cancer: A meta-analysis. Lung Cancer 2000, 27, 3–18. [Google Scholar] [CrossRef]
- Hecht, S.S. Cigarette smoking and lung cancer: Chemical mechanisms and approaches to prevention. Lancet Oncol. 2002, 3, 461–469. [Google Scholar] [CrossRef]
- Cornfield, J.; Haenszel, W.; Hammond, E.C.; Lilienfeld, A.M.; Shimkin, M.B.; Wynder, E.L. Smoking and lung cancer: Recent evidence and a discussion of some questions. Int. J. Epidemiol. 2009, 38, 1175–1191. [Google Scholar] [CrossRef]
- Ridge, C.A.; McErlean, A.M.; Ginsberg, M.S. Epidemiology of lung cancer. Chest 2003, 123, 21–49. [Google Scholar]
- Liaw, K.; Chen, C. Mortality attributable to cigarette smoking in Taiwan: A 12-year follow-up study. Tob. Control 1998, 7, 141–148. [Google Scholar] [CrossRef]
- Shih, H.-C. Government Plans to Cut Smoking Rate. Taipei Times, 1 June 2012. [Google Scholar]
- Ilan County Has Nation’s Highest Smoking Rate: Poll. Taipei Times, 29 July 2006.
- Wen, C.P.; Levy, D.T.; Cheng, T.Y.; Hsu, C.-C.; Tsai, S.P. Smoking behaviour in Taiwan, 2001. Tob. Control 2005, 14. [Google Scholar] [CrossRef]
© 2014 by the authors; licensee MDPI, Basel, Switzerland. This article is an open access article distributed under the terms and conditions of the Creative Commons Attribution license (http://creativecommons.org/licenses/by/3.0/).
Share and Cite
Chen, B.K.; Yang, C.-Y. Differences in Age-Standardized Mortality Rates for Avoidable Deaths Based on Urbanization Levels in Taiwan, 1971–2008. Int. J. Environ. Res. Public Health 2014, 11, 1776-1793. https://doi.org/10.3390/ijerph110201776
Chen BK, Yang C-Y. Differences in Age-Standardized Mortality Rates for Avoidable Deaths Based on Urbanization Levels in Taiwan, 1971–2008. International Journal of Environmental Research and Public Health. 2014; 11(2):1776-1793. https://doi.org/10.3390/ijerph110201776
Chicago/Turabian StyleChen, Brian K., and Chun-Yuh Yang. 2014. "Differences in Age-Standardized Mortality Rates for Avoidable Deaths Based on Urbanization Levels in Taiwan, 1971–2008" International Journal of Environmental Research and Public Health 11, no. 2: 1776-1793. https://doi.org/10.3390/ijerph110201776
APA StyleChen, B. K., & Yang, C.-Y. (2014). Differences in Age-Standardized Mortality Rates for Avoidable Deaths Based on Urbanization Levels in Taiwan, 1971–2008. International Journal of Environmental Research and Public Health, 11(2), 1776-1793. https://doi.org/10.3390/ijerph110201776