Spatial Analysis of the Distribution, Risk Factors and Access to Medical Resources of Patients with Hepatitis B in Shenzhen, China


Abstract
:1. Introduction
2. Data and Methods
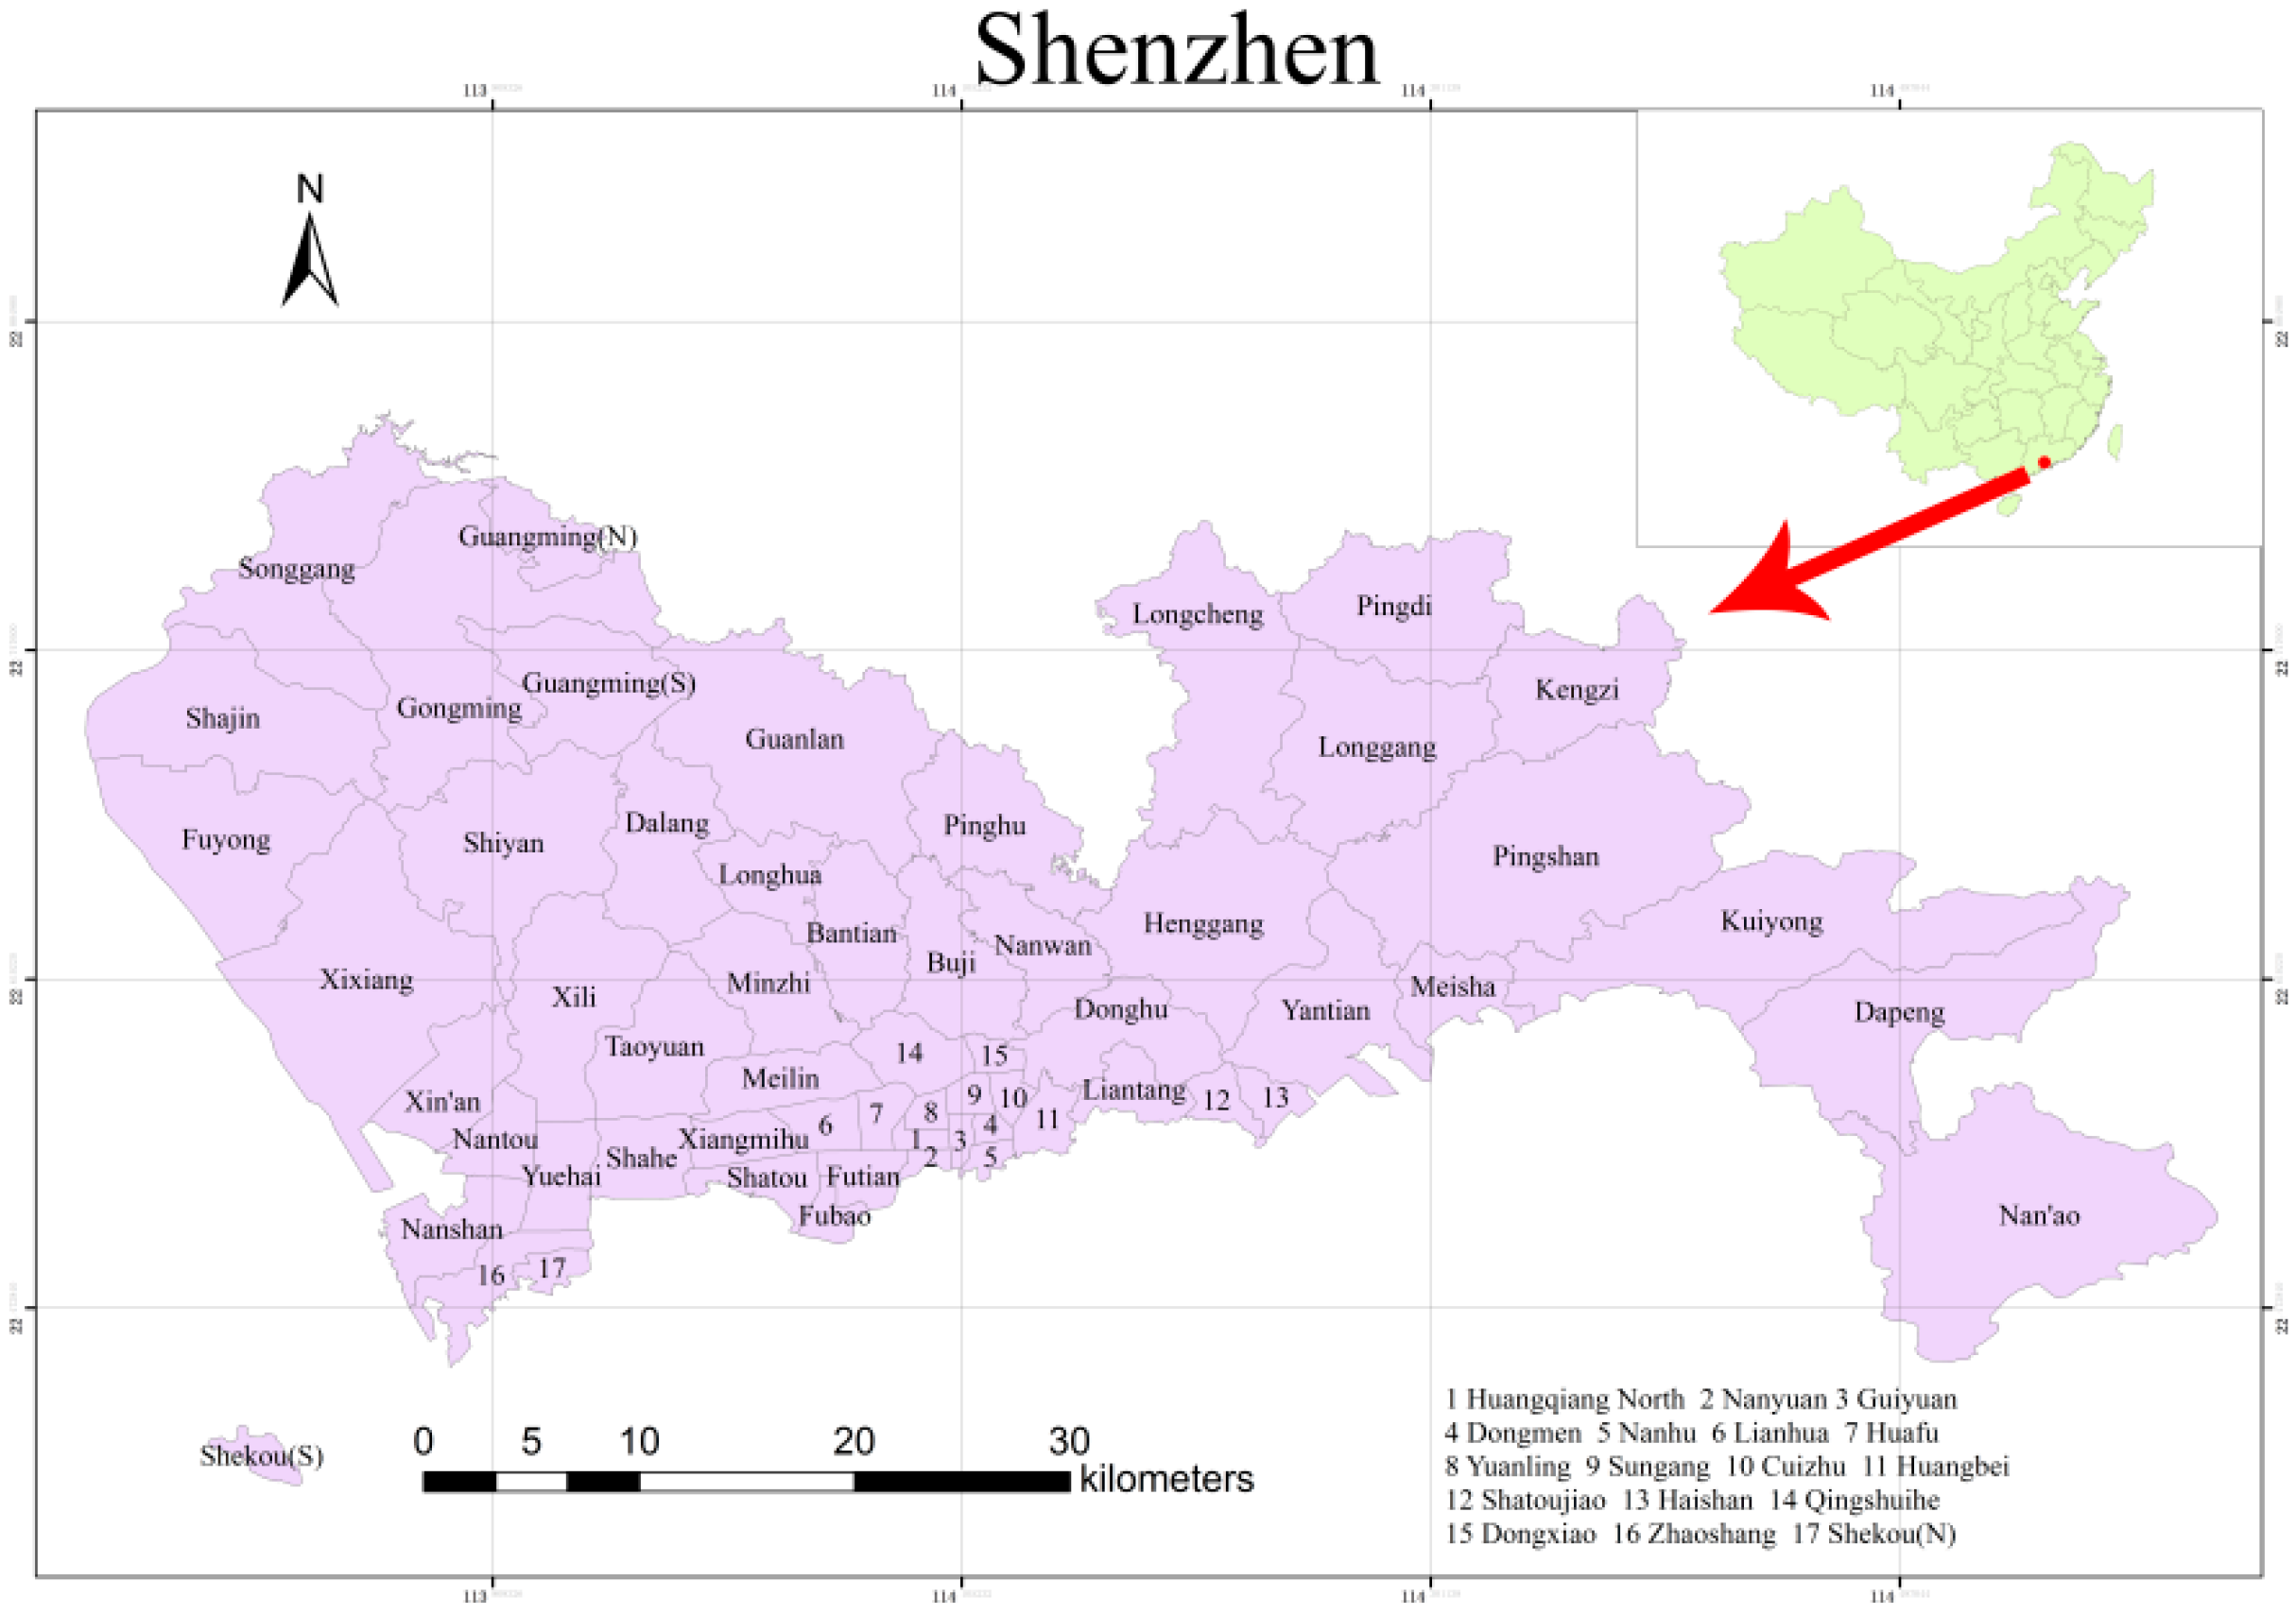
2.1. Study Area
2.2. Study Data
- Basic geographic data: Administrative data for the division of Shenzhen were obtained from the Urban Planning, Land and Resources Commission of the Shenzhen Municipality [9].
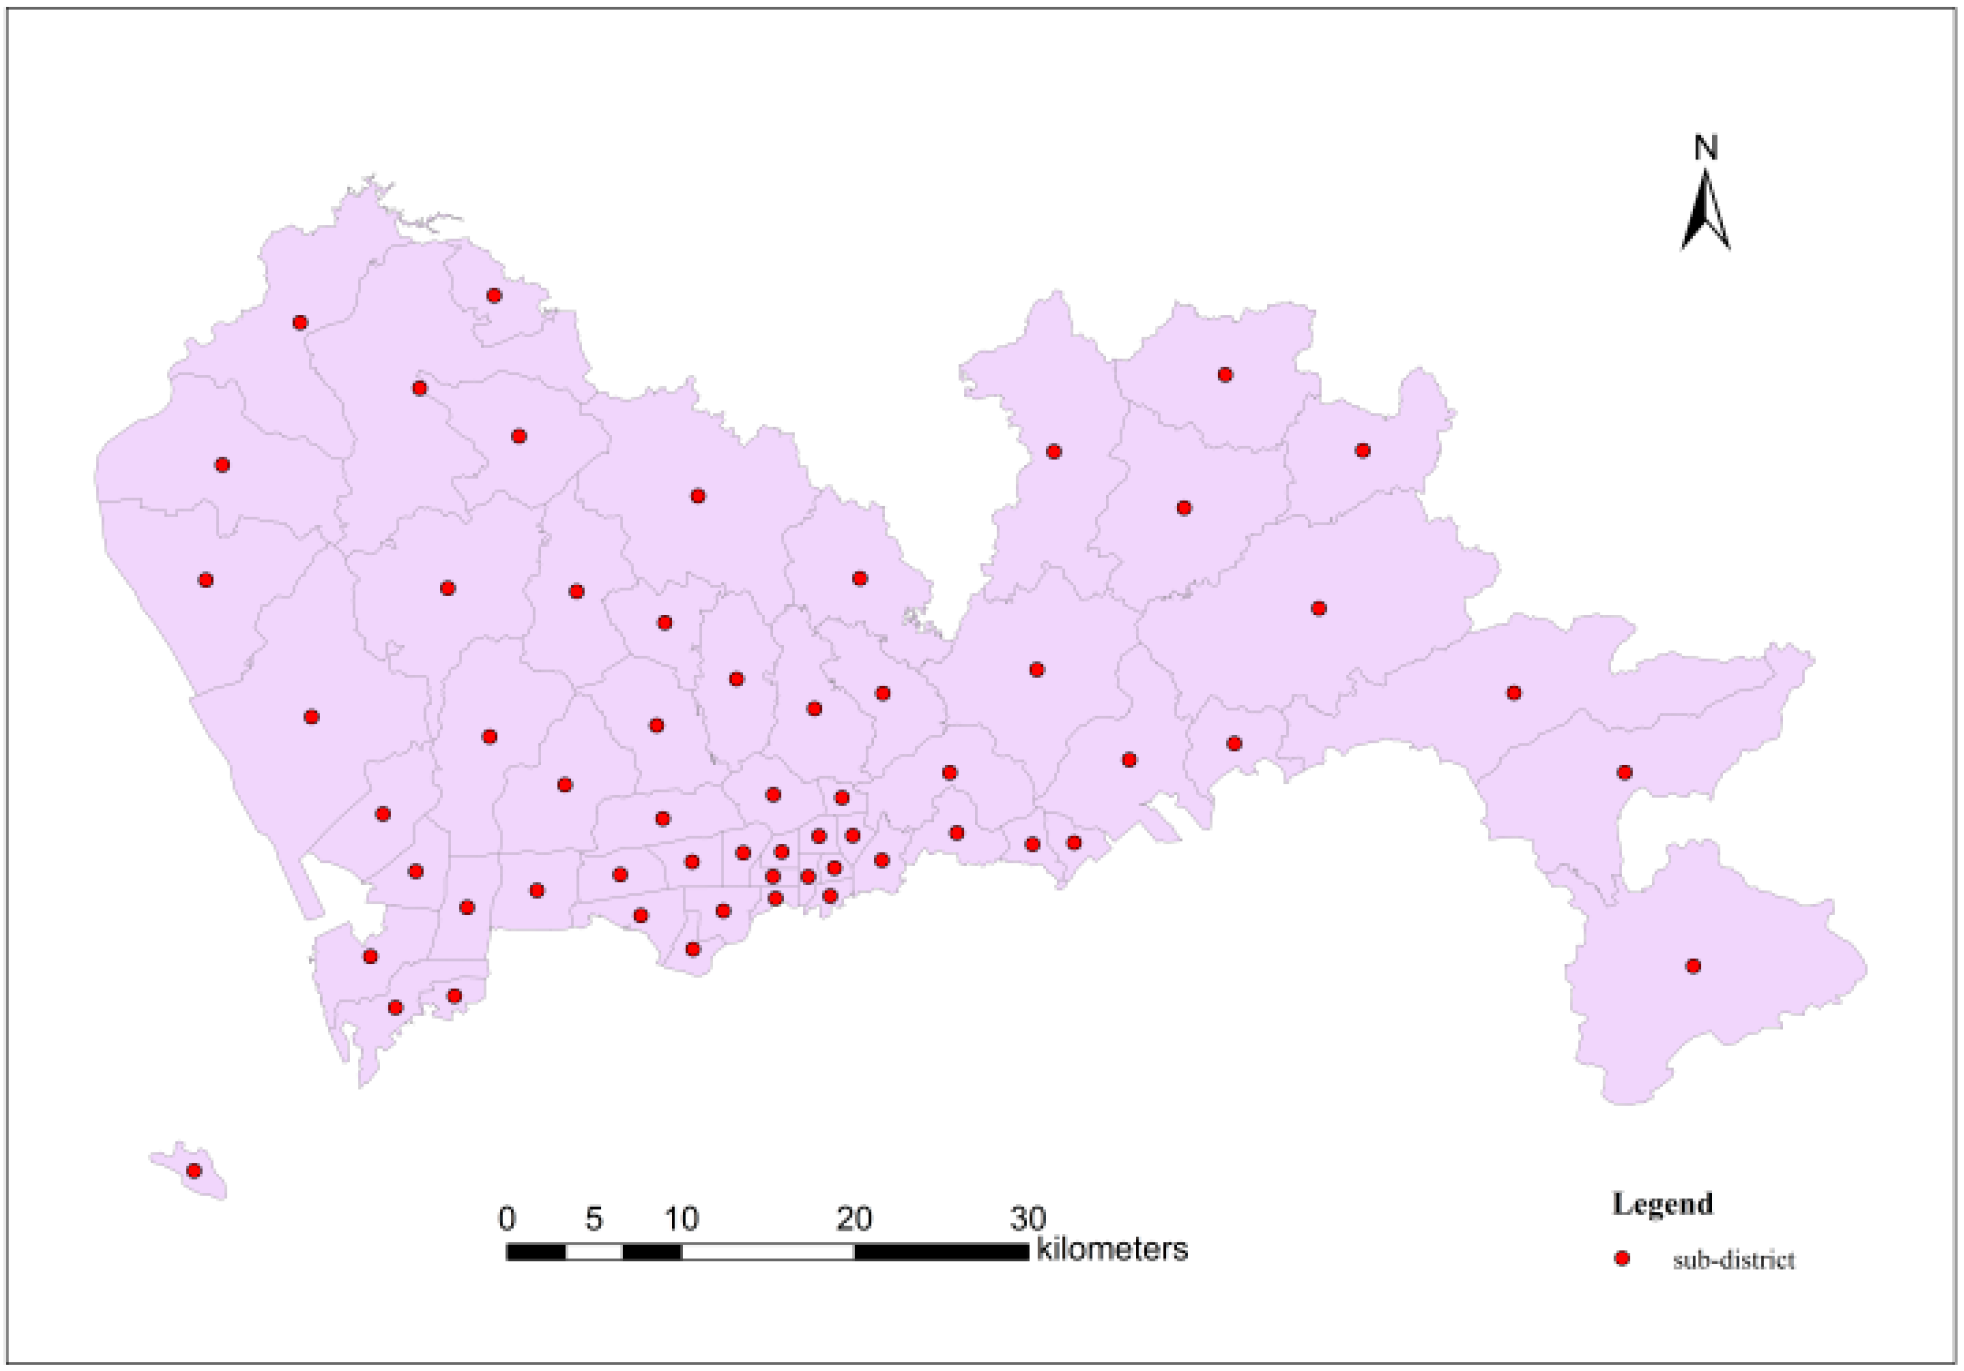
- Demographic data: These data, for all 57 different sub-district administrative regions, were obtained from the 6th national population census [28].
- Hepatitis B case data: Data from the Shenzhen Centre for Health Information (SCHI), an institute directly administered by the Health, Population and Family Planning Commission of Shenzhen Municipality, were obtained from hospitalized patients’ medical records including the patients’ home addresses, ages, sexes, etc. in 2010.
- Medical facility data: These data were also obtained from the Shenzhen Centre for Health Information with addresses and service levels for most hospitals.
- Service facility data: Certain service facilities may promote hepatitis B infection. Address data were obtained by searching electronic maps on the Internet.
2.3. Study Methods
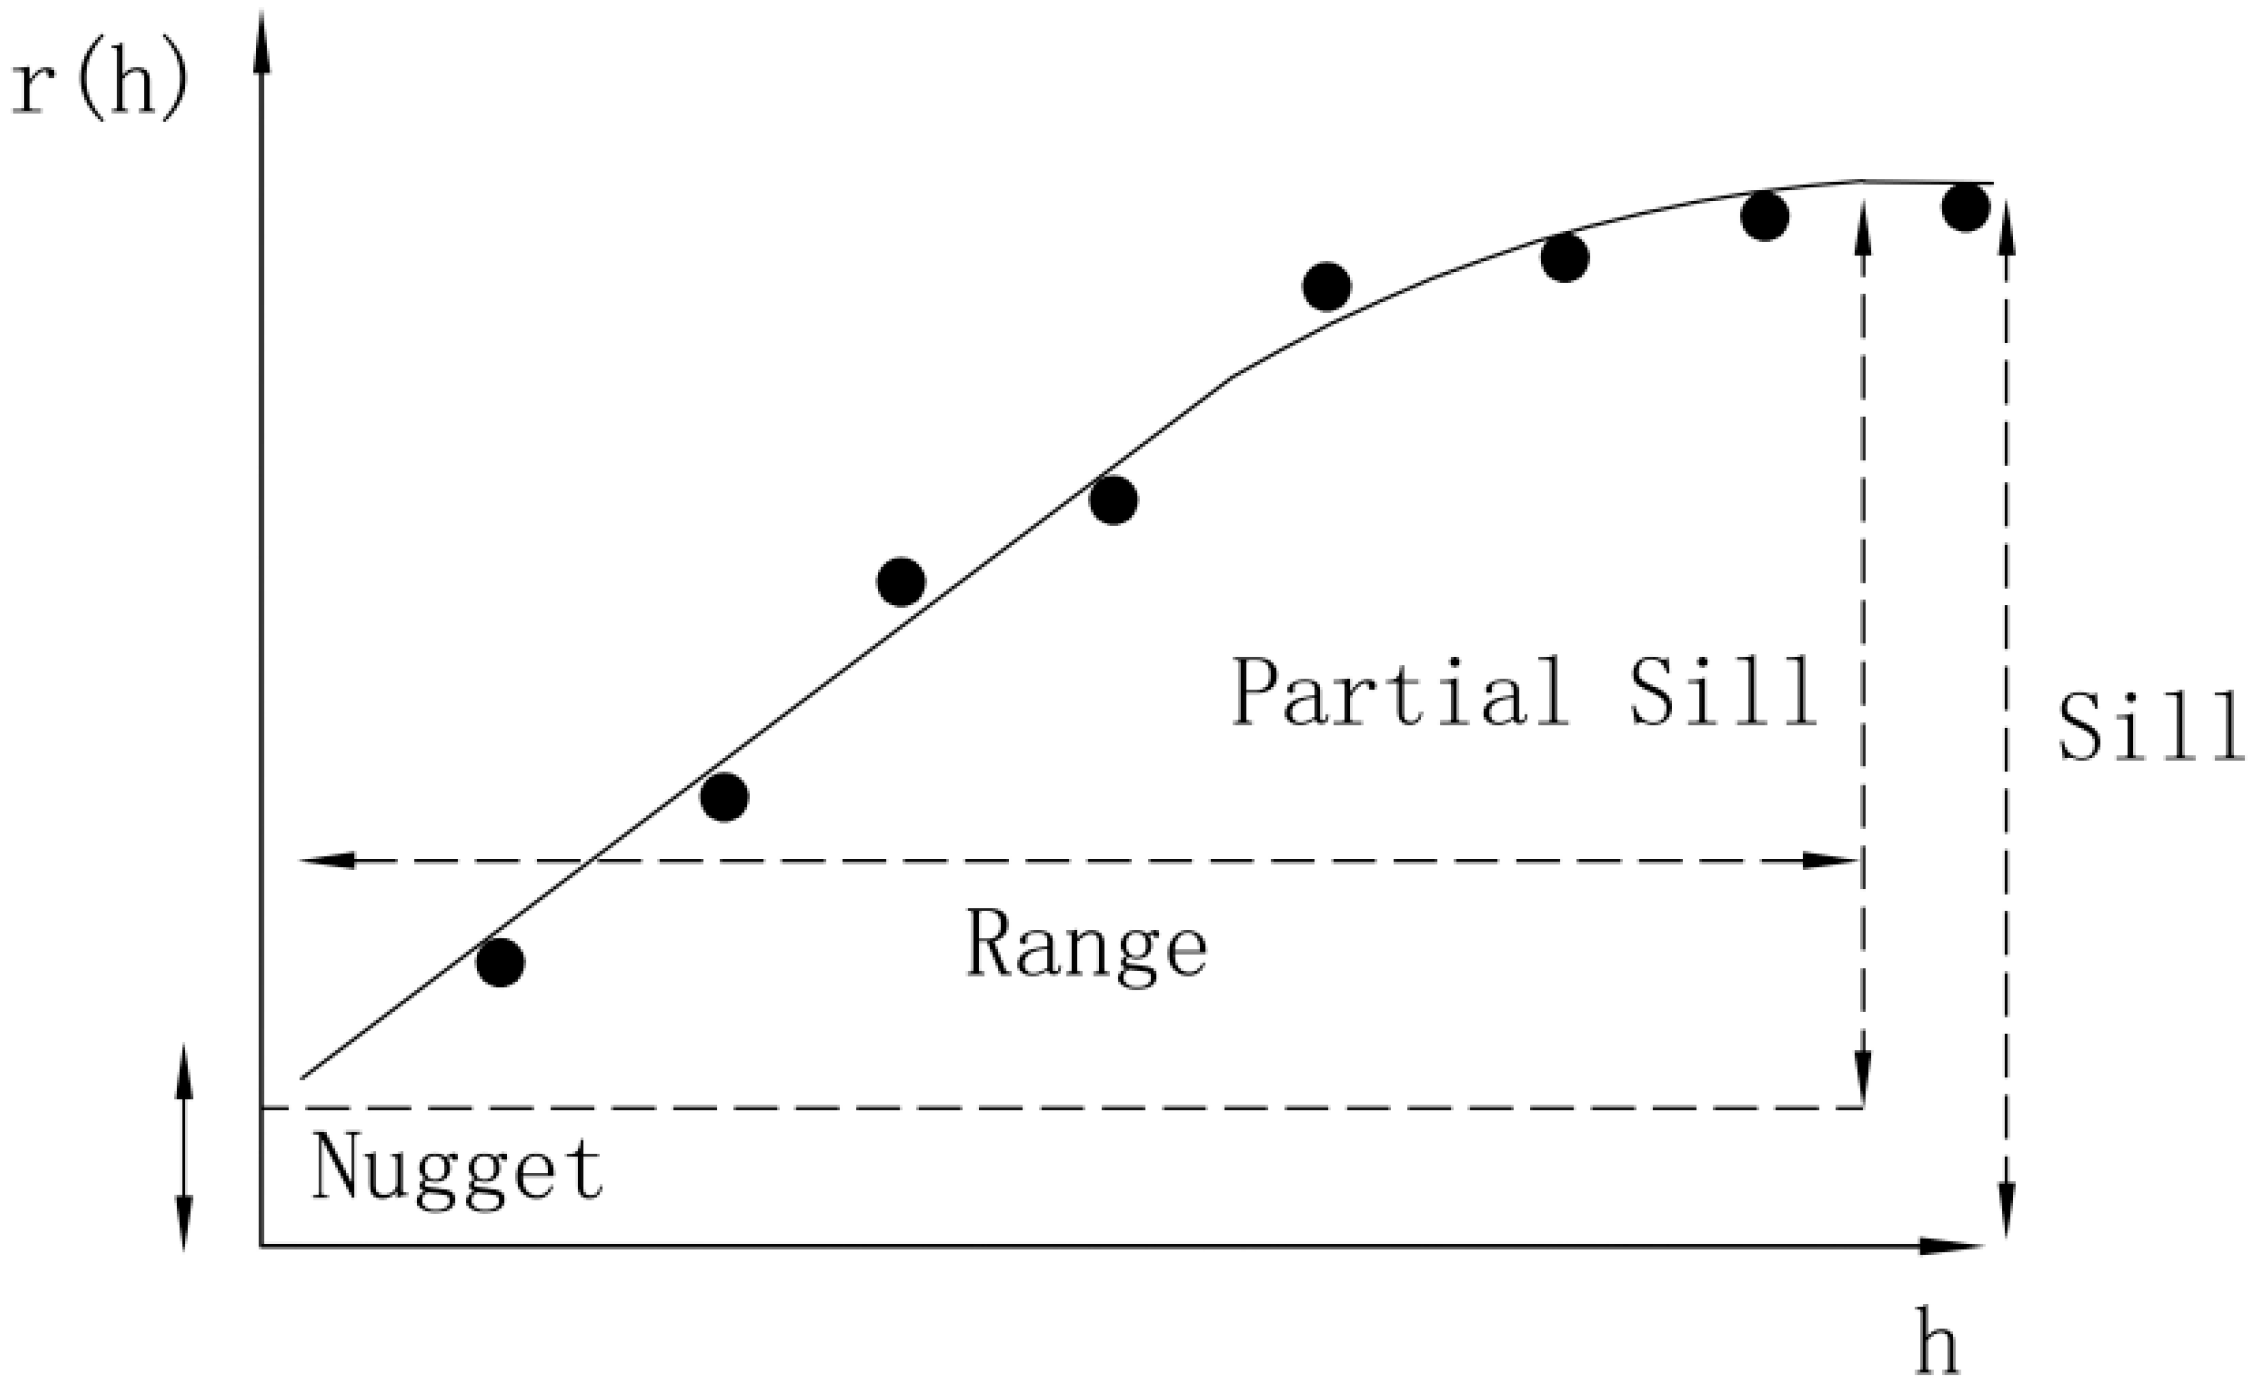
2.3.1. Spatial Interpolation

2.3.2. Correlation Analysis of Spatial Risk Factors

| Correlation | Pearson Correlation Coefficient (Positive) | Pearson Correlation Coefficient (Negative) |
|---|---|---|
| Irrelevant | 0 to 0.09 | −0.09 to 0 |
| Weak correlation | 0.1 to 0.3 | −0.3 to −0.1 |
| Medium correlation | 0.3 to 0.5 | −0.5 to −0.3 |
| Strong correlation | 0.5 to 1.0 | −1.0 to −0.5 |
2.3.3. Analysis of Spatial Access
- (a)
- The search radius value can be set by the service level and capacity of each hospital. Hospitals are divided into three levels, with higher service levels, indicating a greater search radius value.
- (b)
- To set a more accurate hospital service radius, a group gradient search radius value can be set at the same hospital level. Each level has three search radius values.
- (c)
- Based on the requirements of the hospital, which mainly depend on the number of beds and the number of health technical personnel, each hospital’s service capacity can be calculated.
3. Results and Discussion
3.1. Spatial Distribution of Hepatitis B Morbidity in Shenzhen
3.1.1. Hepatitis B Data Processing
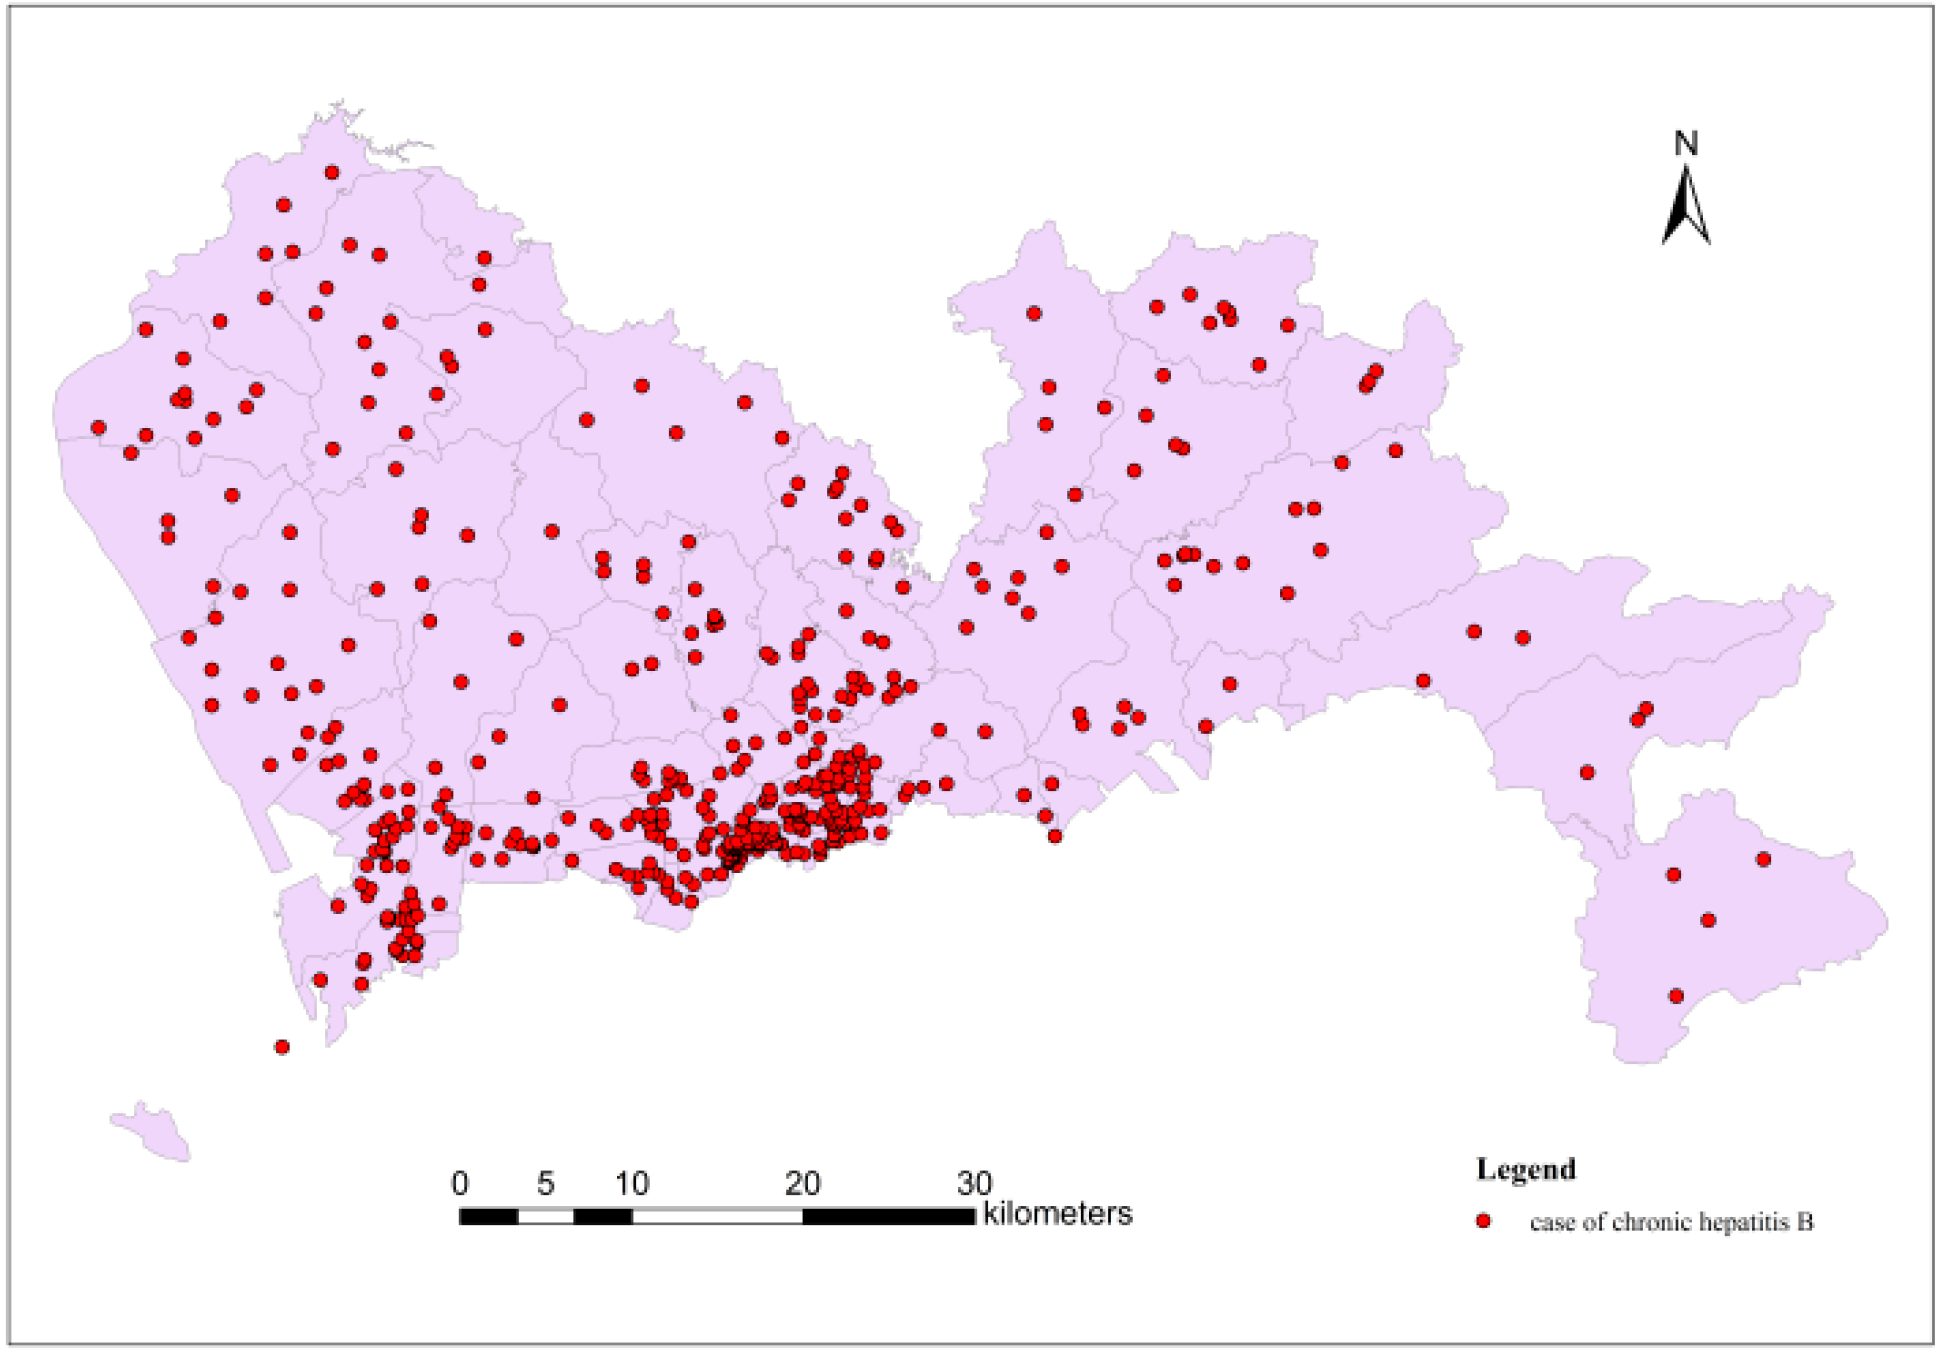

| Sub-District Name | Number of Cases | Sub-District Name | Number of Cases | Sub-District Name | Number of Cases |
|---|---|---|---|---|---|
| Shekou (N) | 7 | Dalang | 7 | Huangbei | 21 |
| Shekou (S) | 39 | Haishan | 1 | Liantang | 12 |
| Zhaoshang | 17 | Shatoujiao | 17 | Dongxiao | 6 |
| Nanshan | 9 | Meisha | 3 | Qingshuihe | 8 |
| Shahe | 21 | Yantian | 13 | Donghu | 37 |
| Nantou | 1443 | Shatou | 14 | Dapeng | 5 |
| Taoyuan | 4 | Nanyuan | 22 | Nanwan | 22 |
| Xili | 39 | Huaqiang North | 21 | Kuiyong | 5 |
| Yuehai | 74 | Xiangmihu | 15 | Buji | 73 |
| Longhua | 66 | Lianhua | 88 | Bantian | 18 |
| Xixiang | 57 | Yuanling | 10 | Henggang | 19 |
| Fuyong | 9 | HuaFu | 11 | Pingshan | 57 |
| Shiyan | 74 | Meilin | 40 | Pinghu | 48 |
| Shajin | 30 | Fubao | 7 | Longgang | 7 |
| Guangming (N) | 3 | Futian | 45 | Kengzi | 5 |
| Guangming (S) | 11 | Nanhu | 29 | Pingdi | 37 |
| Gongming | 50 | Guiyuan | 17 | Longcheng | 12 |
| Songgang | 38 | Dongmen | 13 | Nan’ao | 8 |
| Minzhi | 10 | Sungang | 8 | Xin’an | 15 |
| Guanlan | 39 | Cuizhu | 15 |
| Sub-District Name | Morbidity (104) | Sub-District Name | Morbidity (104) | Sub-District Name | Morbidity (104) | ||
|---|---|---|---|---|---|---|---|
| Shekou (N) | 1.56 | Dalang | 0.29 | Huangbei | 1.81 | ||
| Shekou (S) | 7.53 | Haishan | 0.33 | Liantang | 1.40 | ||
| Zhaoshang | 2.05 | Shatoujiao | 3.13 | Dongxiao | 0.67 | ||
| Nanshan | 0.64 | Meisha | 1.56 | Qingshuihe | 0.85 | ||
| Shahe | 1.70 | Yantian | 1.59 | Donghu | 4.06 | ||
| Nantou | 88.40 | Shatou | 0.65 | Dapeng | 1.12 | ||
| Taoyuan | 0.36 | Nanyuan | 1.97 | Nanwan | 1.13 | ||
| Xili | 2.04 | Huaqiang North | 3.49 | Kuiyong | 0.90 | ||
| Yuehai | 4.49 | Xiangmihu | 1.65 | Buji | 2.01 | ||
| Longhua | 1.78 | Lianhua | 5.01 | Bantian | 0.84 | ||
| Xixiang | 0.99 | Yuanling | 1.16 | Henggang | 0.64 | ||
| Fuyong | 0.22 | HuaFu | 1.53 | Pingshan | 2.70 | ||
| Shiyan | 2.92 | Meilin | 2.32 | Pinghu | 2.07 | ||
| Shajin | 0.58 | Fubao | 0.72 | Longgang | 0.37 | ||
| Guangming N) | 1.36 | Futian | 1.89 | Kengzi | 0.61 | ||
| Guangming (S) | 2.28 | Nanhu | 3.02 | Pingdi | 3.66 | ||
| Gongming | 1.21 | Guiyuan | 1.98 | Longcheng | 0.49 | ||
| Songgang | 0.96 | Dongmen | 1.43 | Nan’ao | 3.28 | ||
| Minzhi | 0.39 | Sungang | 1.27 | Xin’an | 0.39 | ||
| Guanlan | 0.87 | Cuizhu | 1.36 | ||||
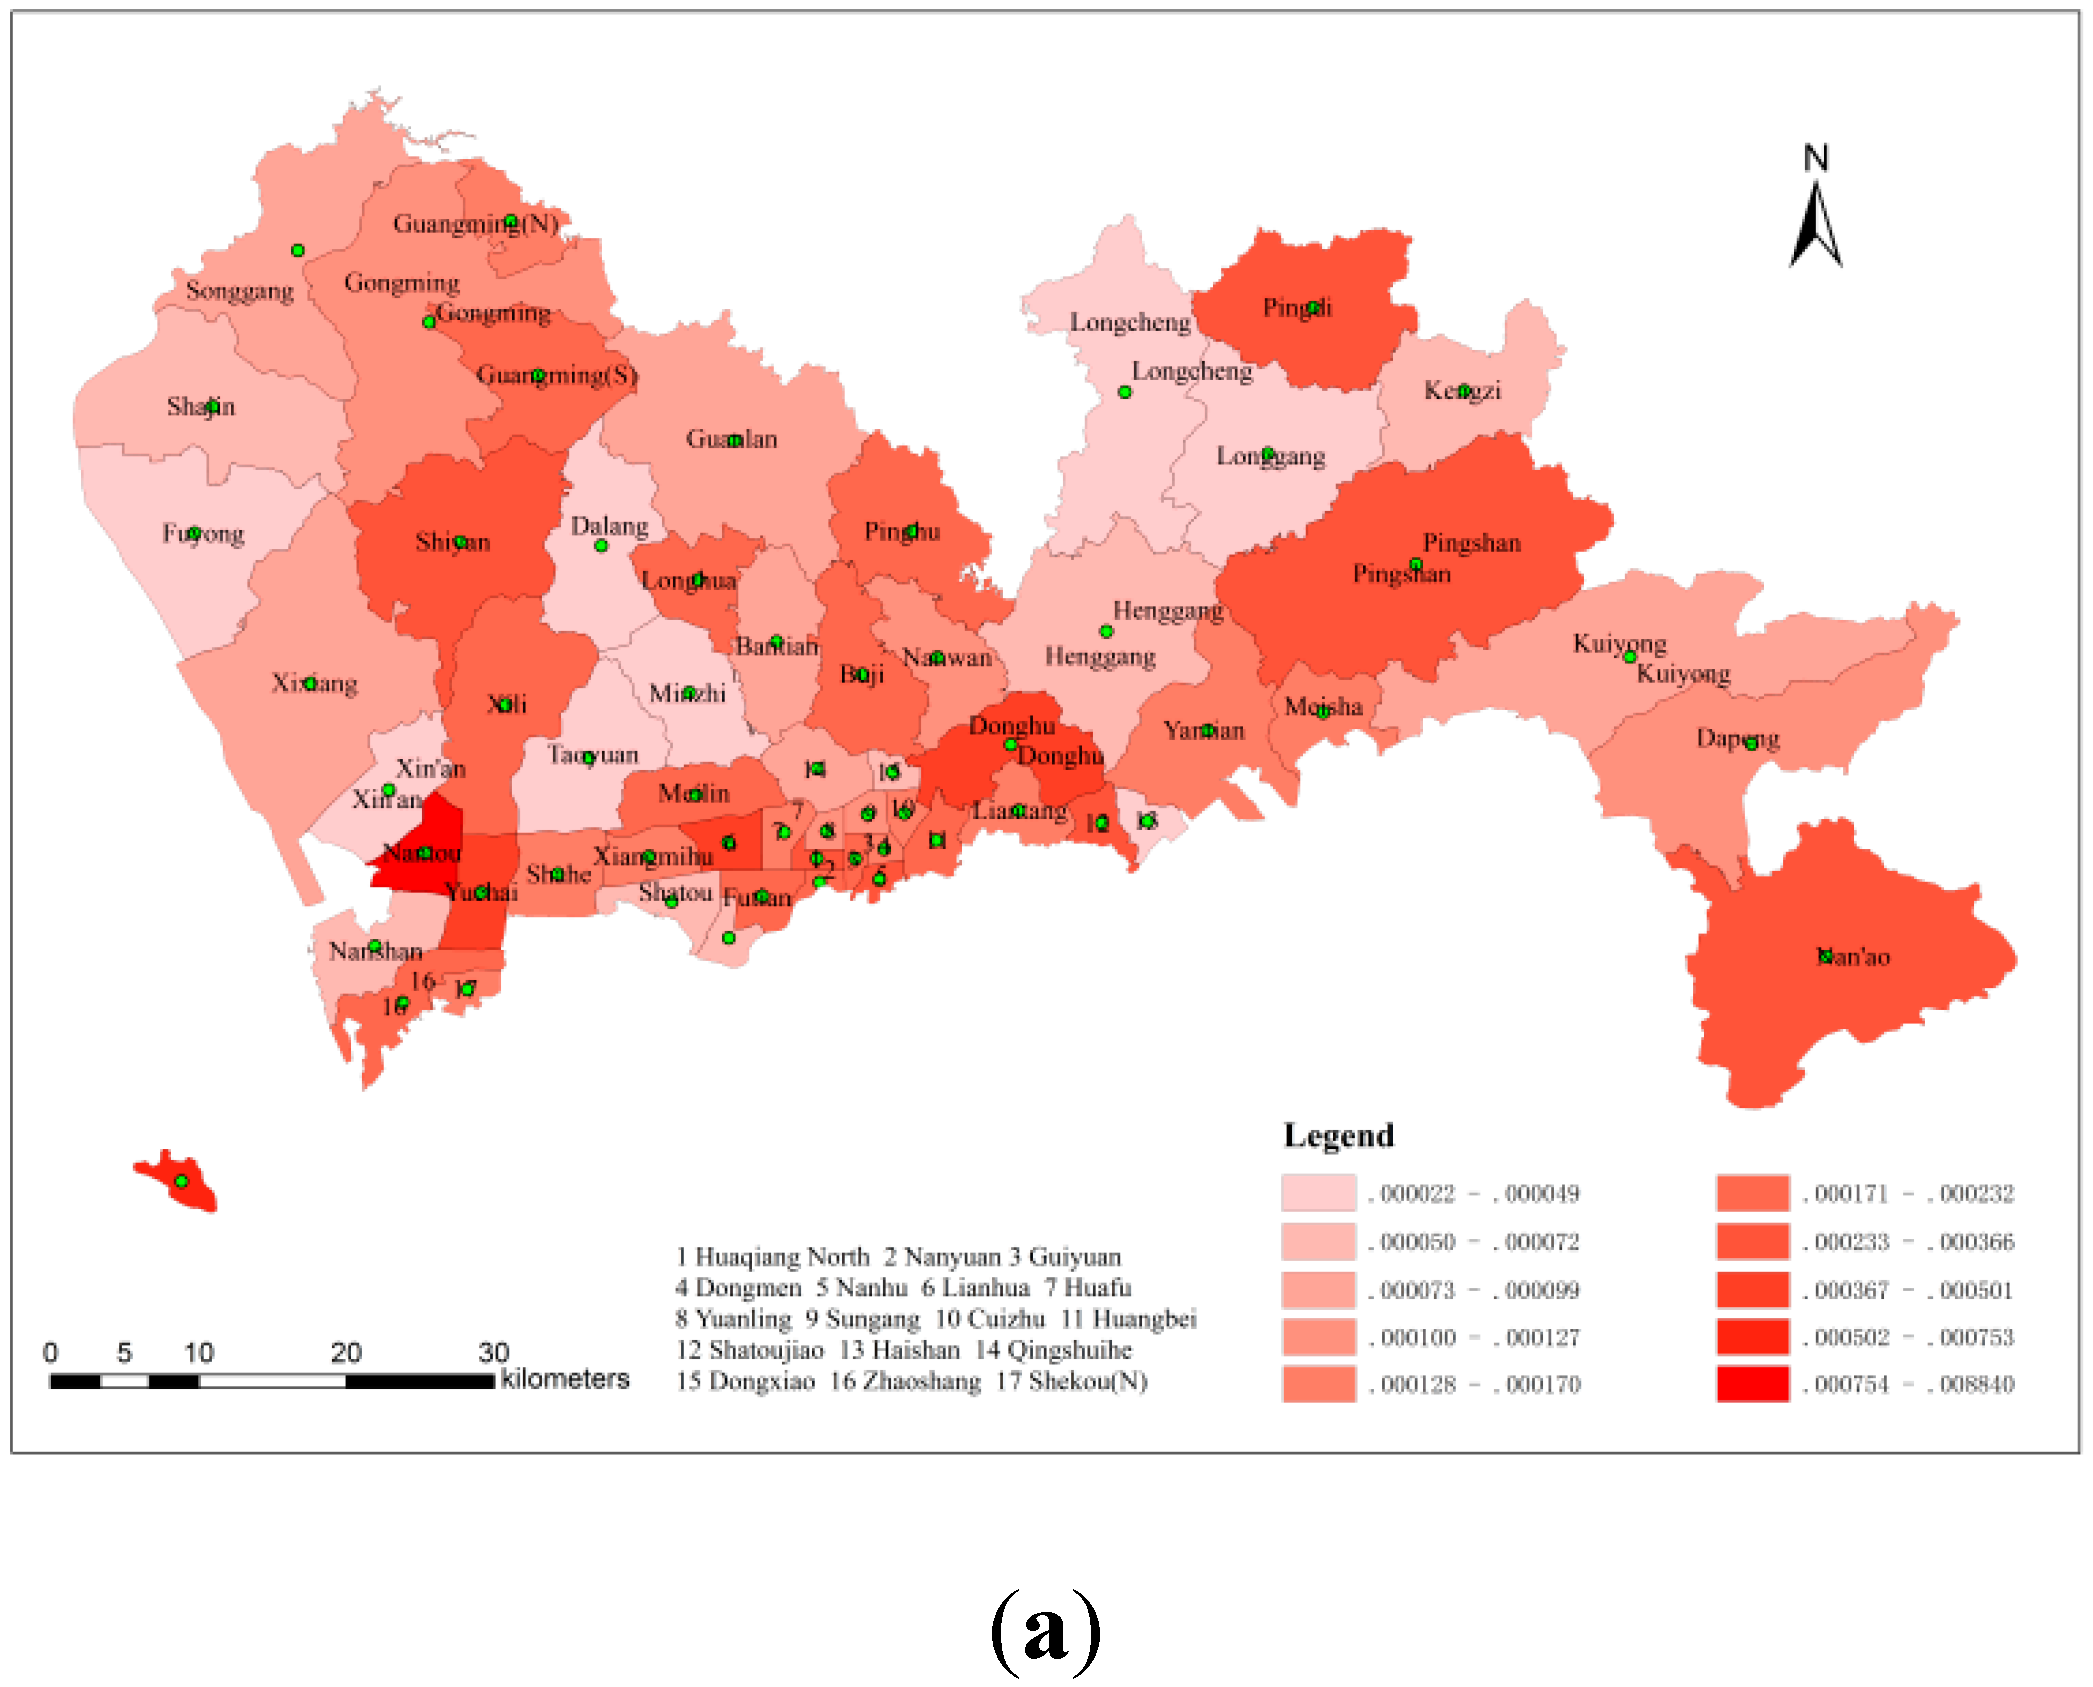
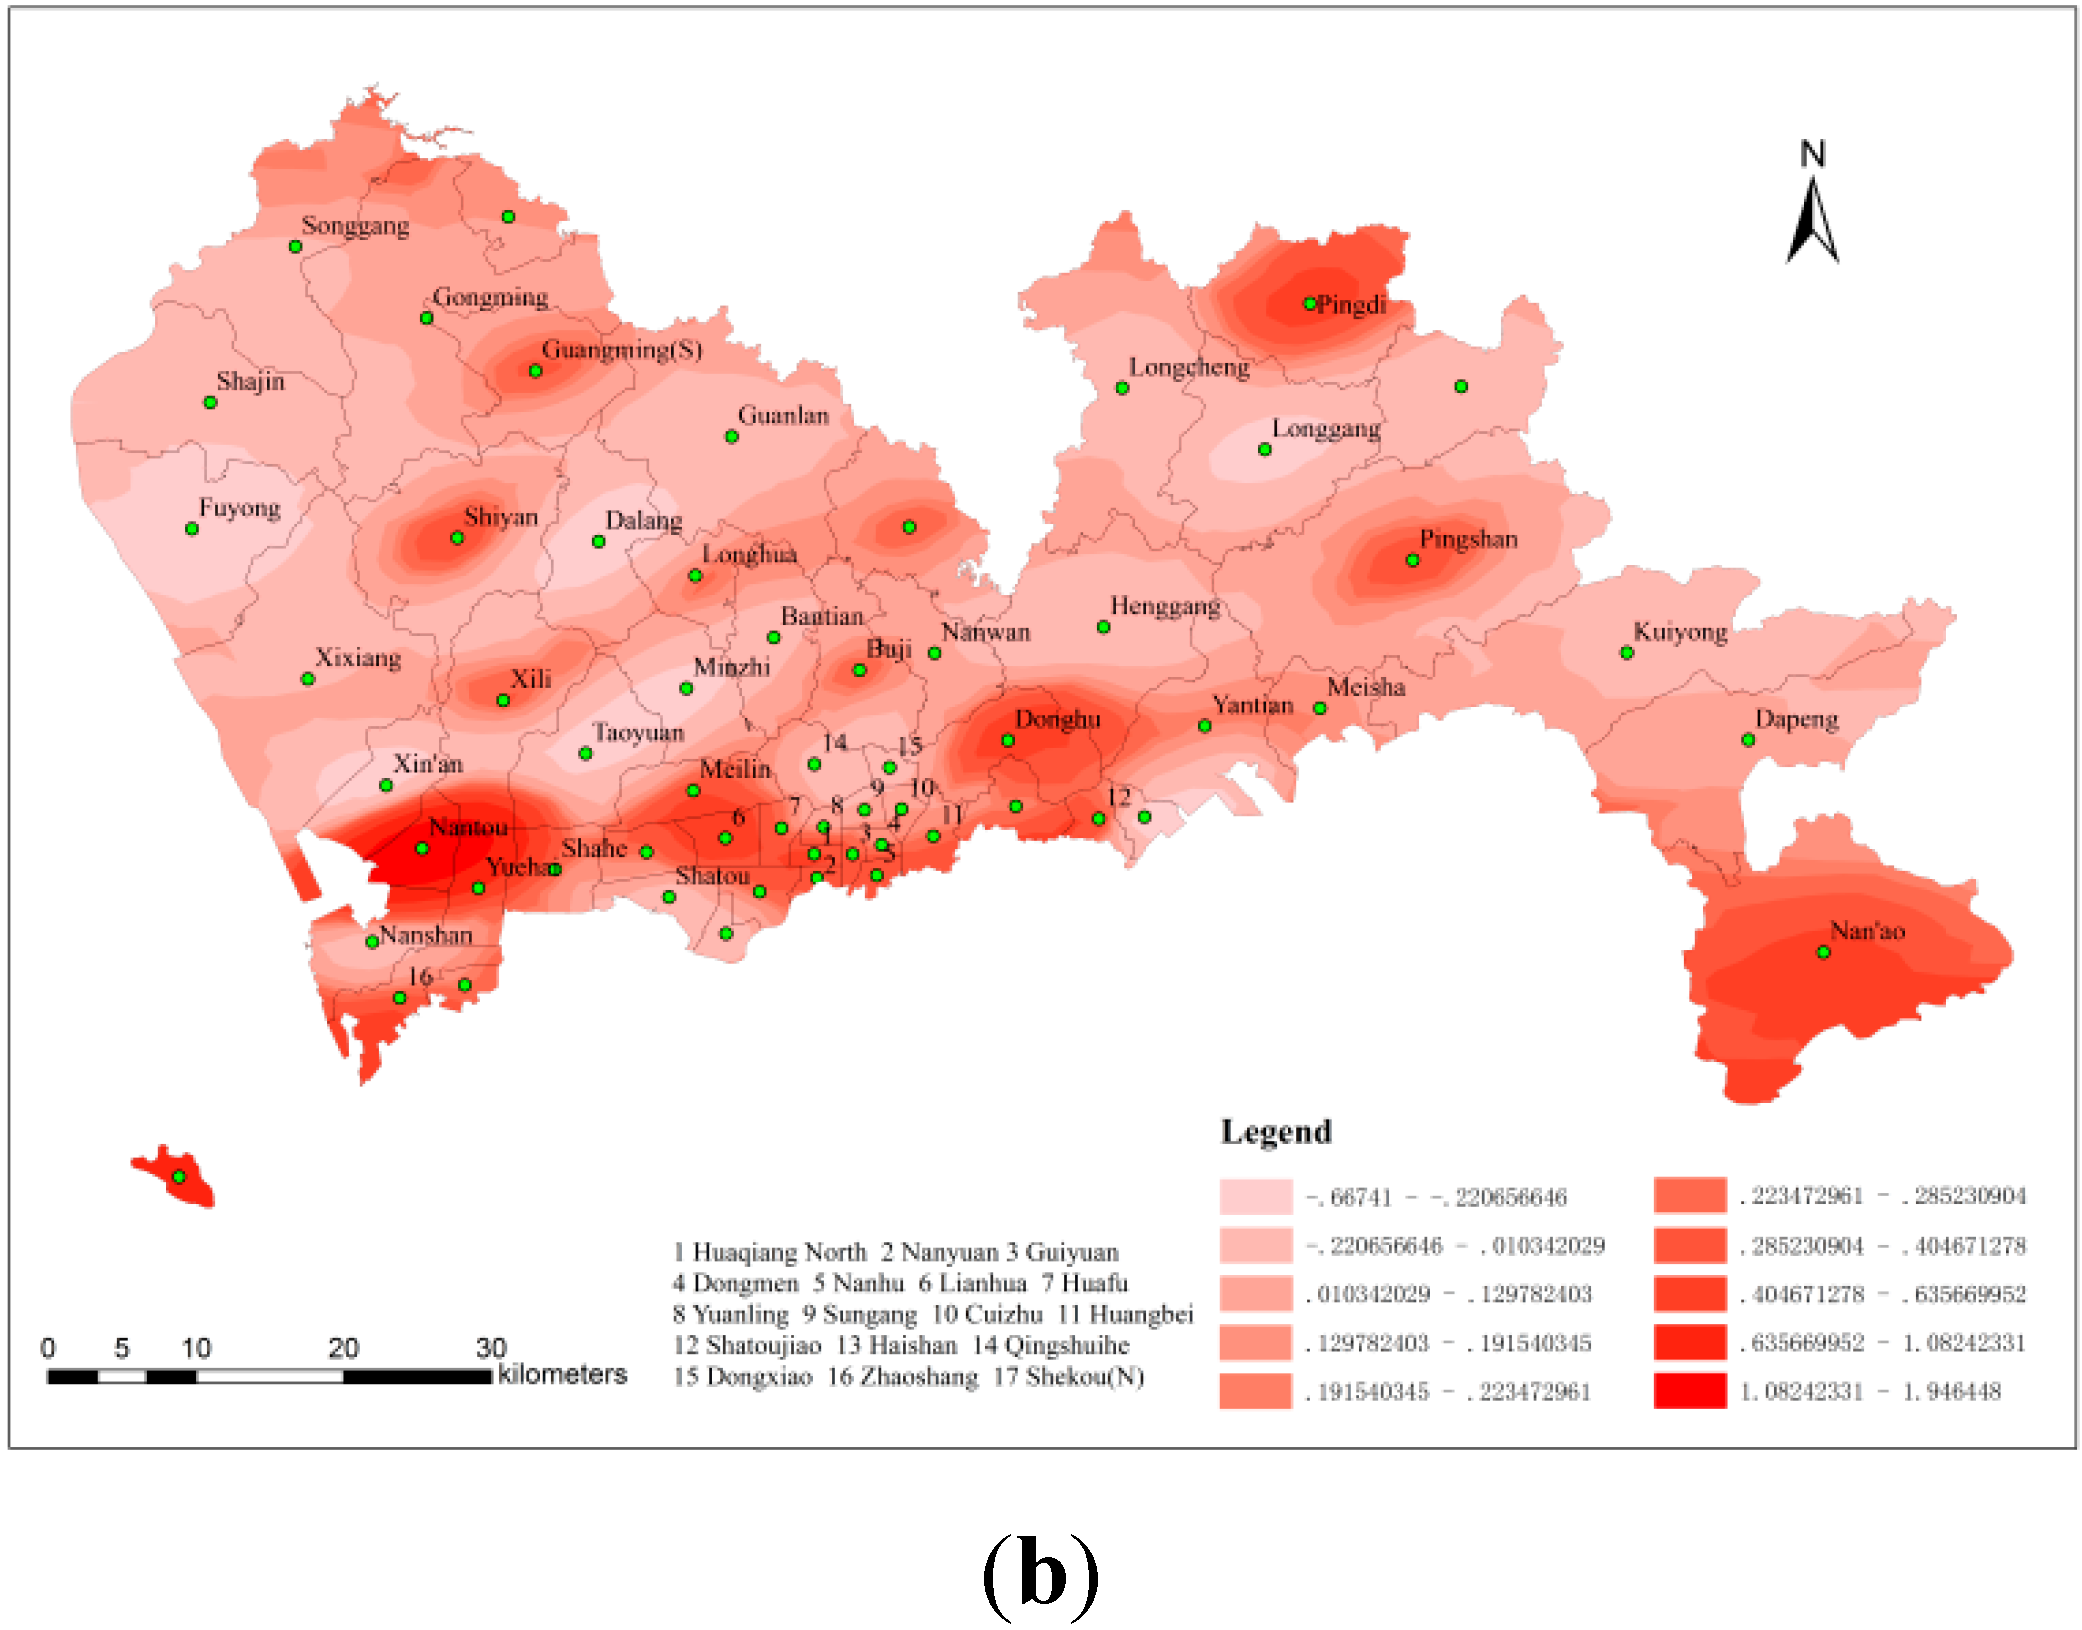
3.1.2. The Spatial Distribution of Hepatitis B Morbidity
3.2. Spatial Risk Factor Analysis of the Spread of Hepatitis B
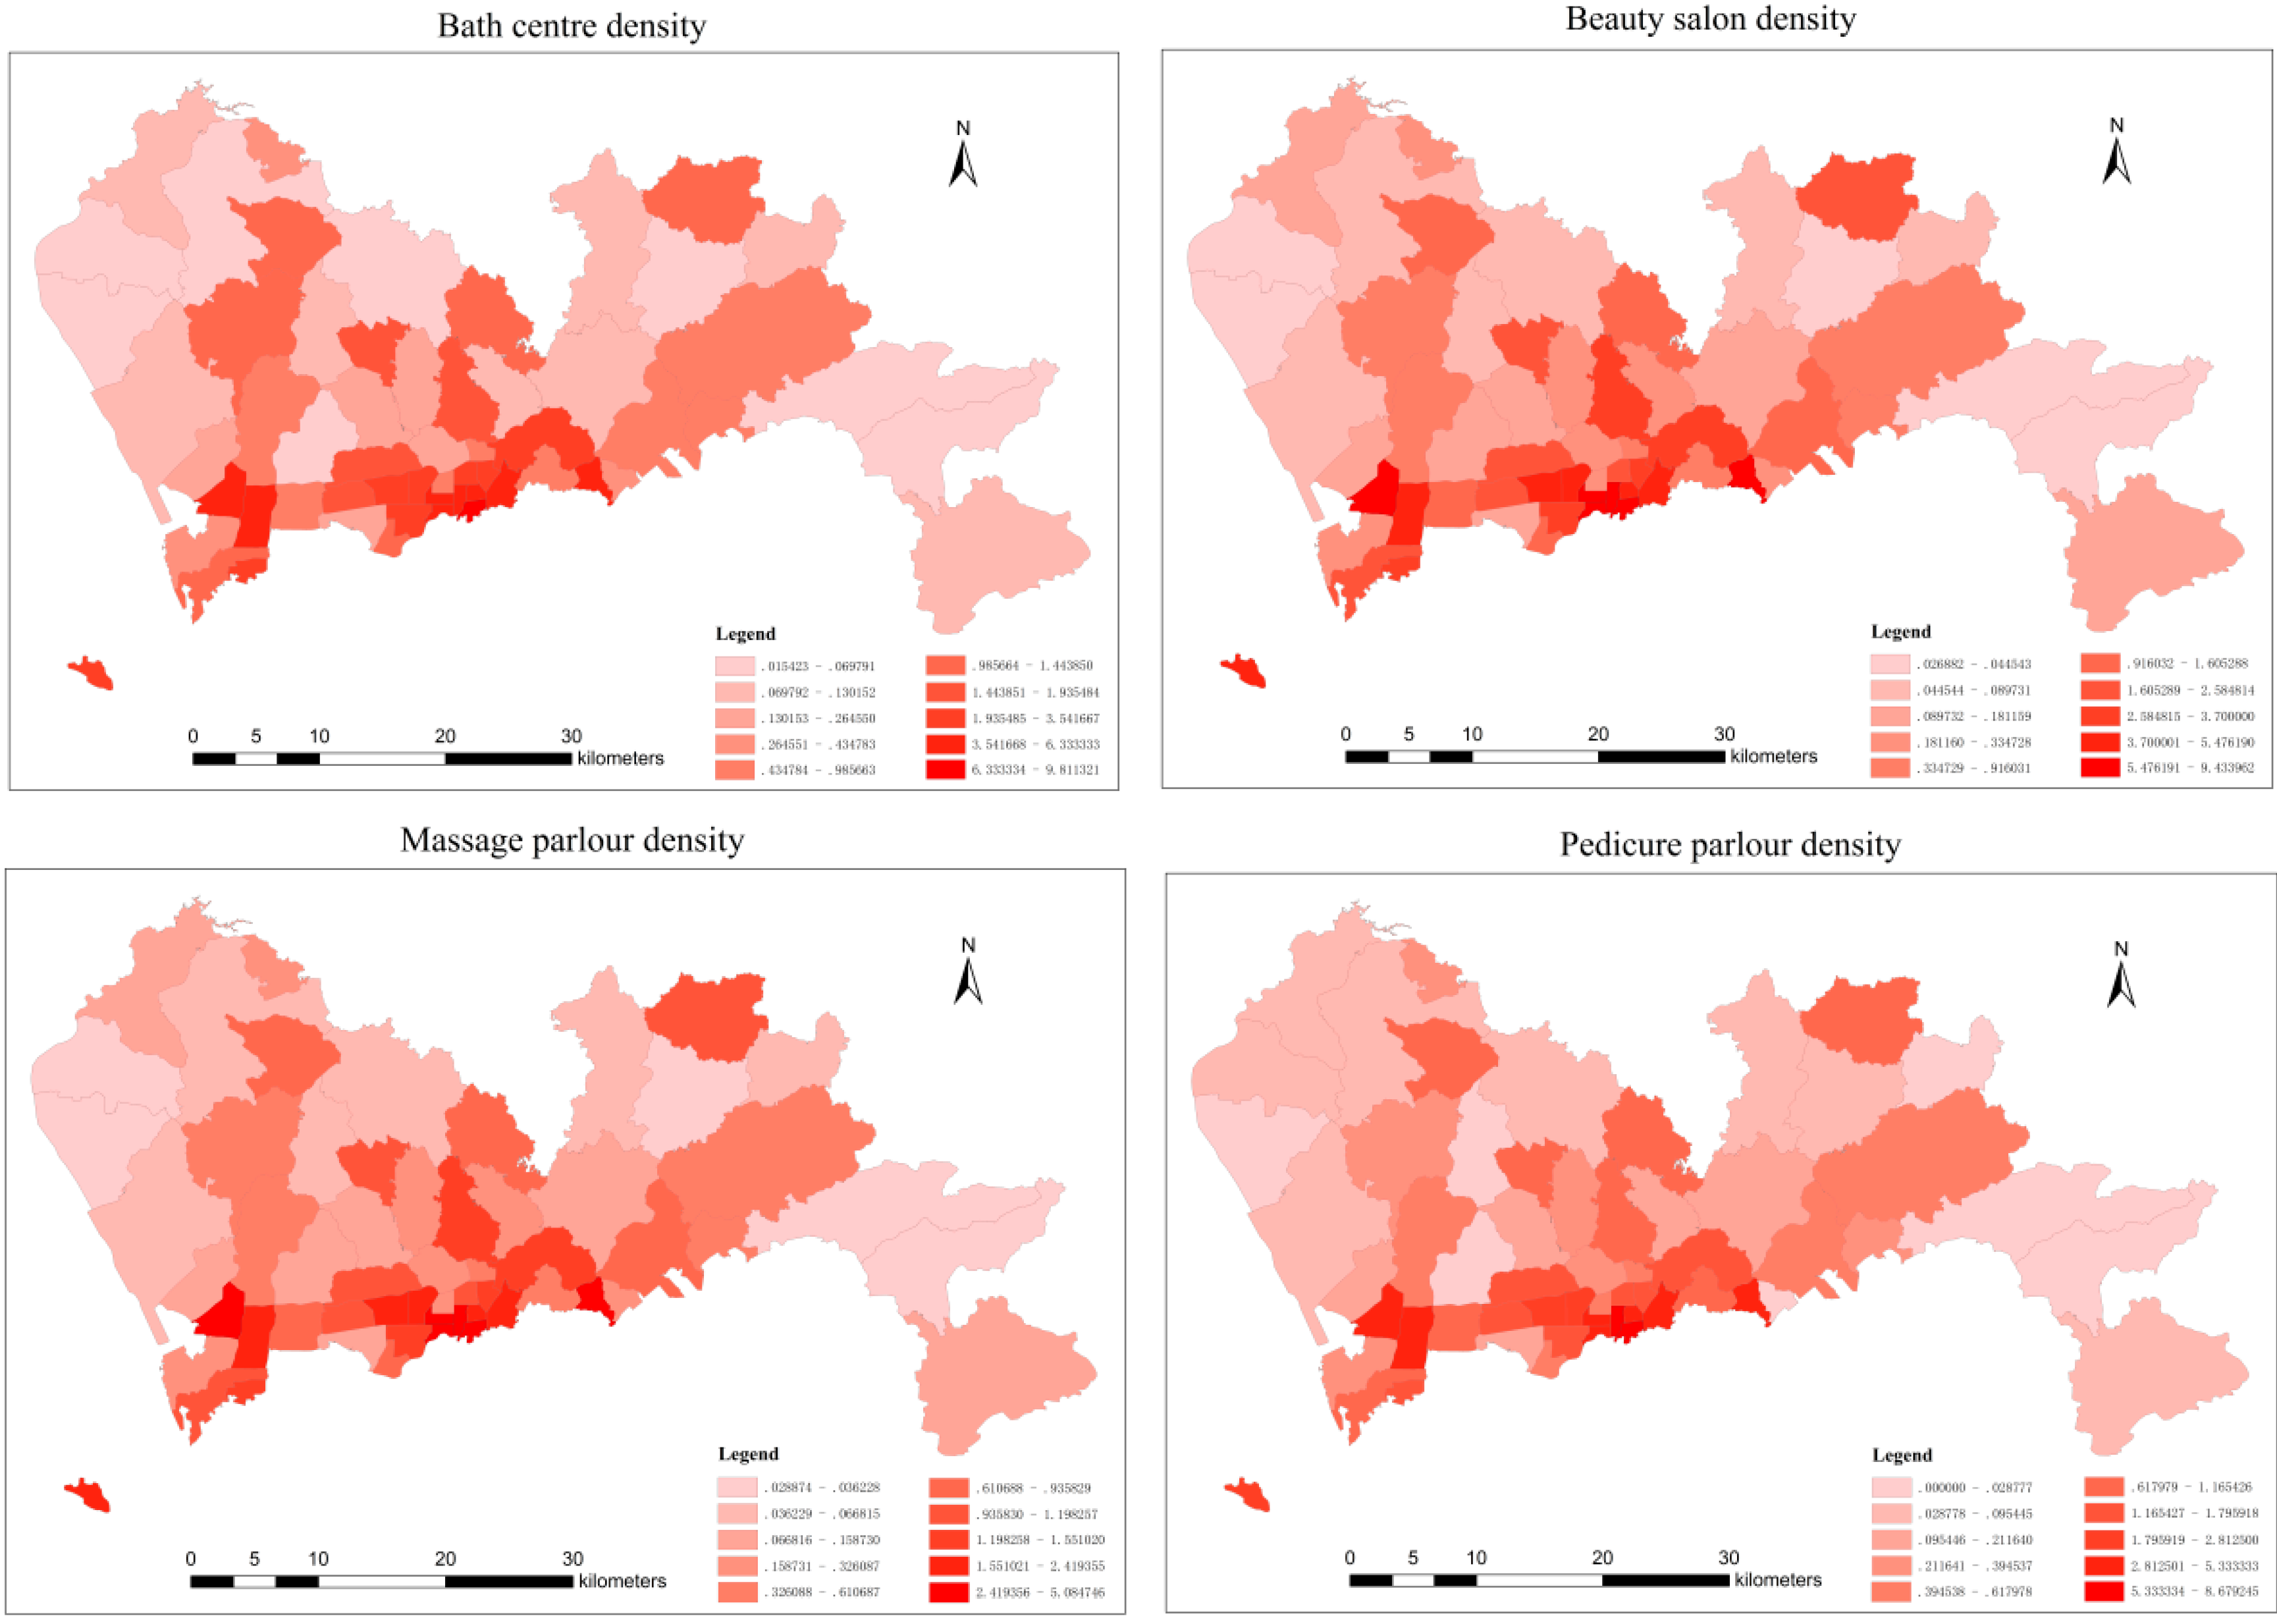
3.2.1. The Types of Risk Factors
3.2.2. Data Processing of Risk Factors

3.2.3. The Calculation and Explanation of the Pearson Correlation Coefficient
| Bath Centres | Beauty Salons | Massage Parlours | Pedicure Parlours |
|---|---|---|---|
| 0.566 | 0.515 | 0.626 | 0.538 |
3.3. Analysis of Spatial Access to Medical Resources
3.3.1. The Spatial Distribution of Medical Resources

3.3.2. The Calculation of Spatial Access
| Sub-District Name | Spatial Access to Hospitals at Different Search Radiuses (103) | ||
|---|---|---|---|
| 6, 3, 1.7 km | 9, 4, 2 km | 12, 5, 2.3 km | |
| Shekou (N) | 22.23 | 26.52 | 29.97 |
| Shekou (S) | 0.74 | 0.74 | 0.74 |
| Zhaoshang | 6.02 | 8.35 | 10.32 |
| Nanshan | 4.18 | 5.60 | 6.33 |
| Shahe | 2.30 | 5.64 | 9.26 |
| Nantou | 13.92 | 13.92 | 13.92 |
| Taoyuan | 1.49 | 2.76 | 7.24 |
| Xili | 0.67 | 4.09 | 4.77 |
| Yuehai | 7.04 | 8.44 | 9.93 |
| Longhua | 0.26 | 0.26 | 0.62 |
| Xixiang | 2.35 | 2.68 | 2.91 |
| Fuyong | 4.02 | 4.02 | 4.02 |
| Shiyan | 3.06 | 3.24 | 4.31 |
| Shajin | 4.35 | 4.35 | 4.35 |
| Guangming (N) | 3.05 | 3.05 | 3.05 |
| Guangming (S) | 6.02 | 6.02 | 6.02 |
| Gongming | 0.19 | 0.19 | 0.19 |
| Songgang | 0.43 | 0.43 | 0.43 |
| Minzhi | 0.82 | 1.48 | 2.50 |
| Guanlan | 0.70 | 0.70 | 0.70 |
| Dalang | 0.28 | 0.28 | 0.28 |
| Haishan | 11.34 | 11.34 | 13.46 |
| Shatoujiao | 5.95 | 5.95 | 9.24 |
| Meisha | 3.01 | 3.01 | 8.03 |
| Yantian | 1.08 | 1.08 | 1.08 |
| Shatou | 4.13 | 5.82 | 7.16 |
| Nanyuan | 20.63 | 24.50 | 25.40 |
| Huaqiang North | 51.10 | 58.86 | 60.84 |
| Xiangmihu | 7.82 | 14.52 | 19.33 |
| Lianhua | 30.58 | 31.72 | 31.72 |
| Yuanling | 29.13 | 35.10 | 36.31 |
| HuaFu | 54.17 | 57.96 | 58.23 |
| Meilin | 10.12 | 10.26 | 11.30 |
| Fubao | 9.60 | 12.30 | 12.30 |
| Futian | 8.31 | 10.47 | 10.47 |
| Nanhu | 42.56 | 46.43 | 47.67 |
| Guiyuan | 31.86 | 36.20 | 36.20 |
| Dongmen | 47.61 | 49.84 | 49.84 |
| Sungang | 42.51 | 46.05 | 47.65 |
| Cuizhu | 154.18 | 155.82 | 156.69 |
| Huangbei | 16.49 | 20.47 | 21.82 |
| Liantang | 3.51 | 3.51 | 7.98 |
| Dongxiao | 16.23 | 21.64 | 23.67 |
| Qingshuihe | 14.37 | 15.03 | 17.70 |
| Donghu | 0.20 | 2.76 | 6.57 |
| Dapeng | 0.13 | 0.13 | 0.13 |
| Nanwan | 1.60 | 3.22 | 4.67 |
| Kuiyong | 0.62 | 0.62 | 0.62 |
| Buji | 2.01 | 3.15 | 4.10 |
| Bantian | 0.38 | 1.58 | 2.89 |
| Henggang | 1.85 | 1.85 | 1.85 |
| Pingshan | 2.67 | 2.67 | 2.67 |
| Pinghu | 11.06 | 11.06 | 11.48 |
| Longgang | 1.77 | 2.82 | 2.82 |
| Kengzi | 2.49 | 4.64 | 4.64 |
| Pingdi | 24.79 | 26.83 | 26.83 |
| Longcheng | 0.60 | 0.60 | 1.11 |
| Nan’ao | 0.40 | 0.40 | 0.40 |
| Xin’an | 10.16 | 10.16 | 10.16 |
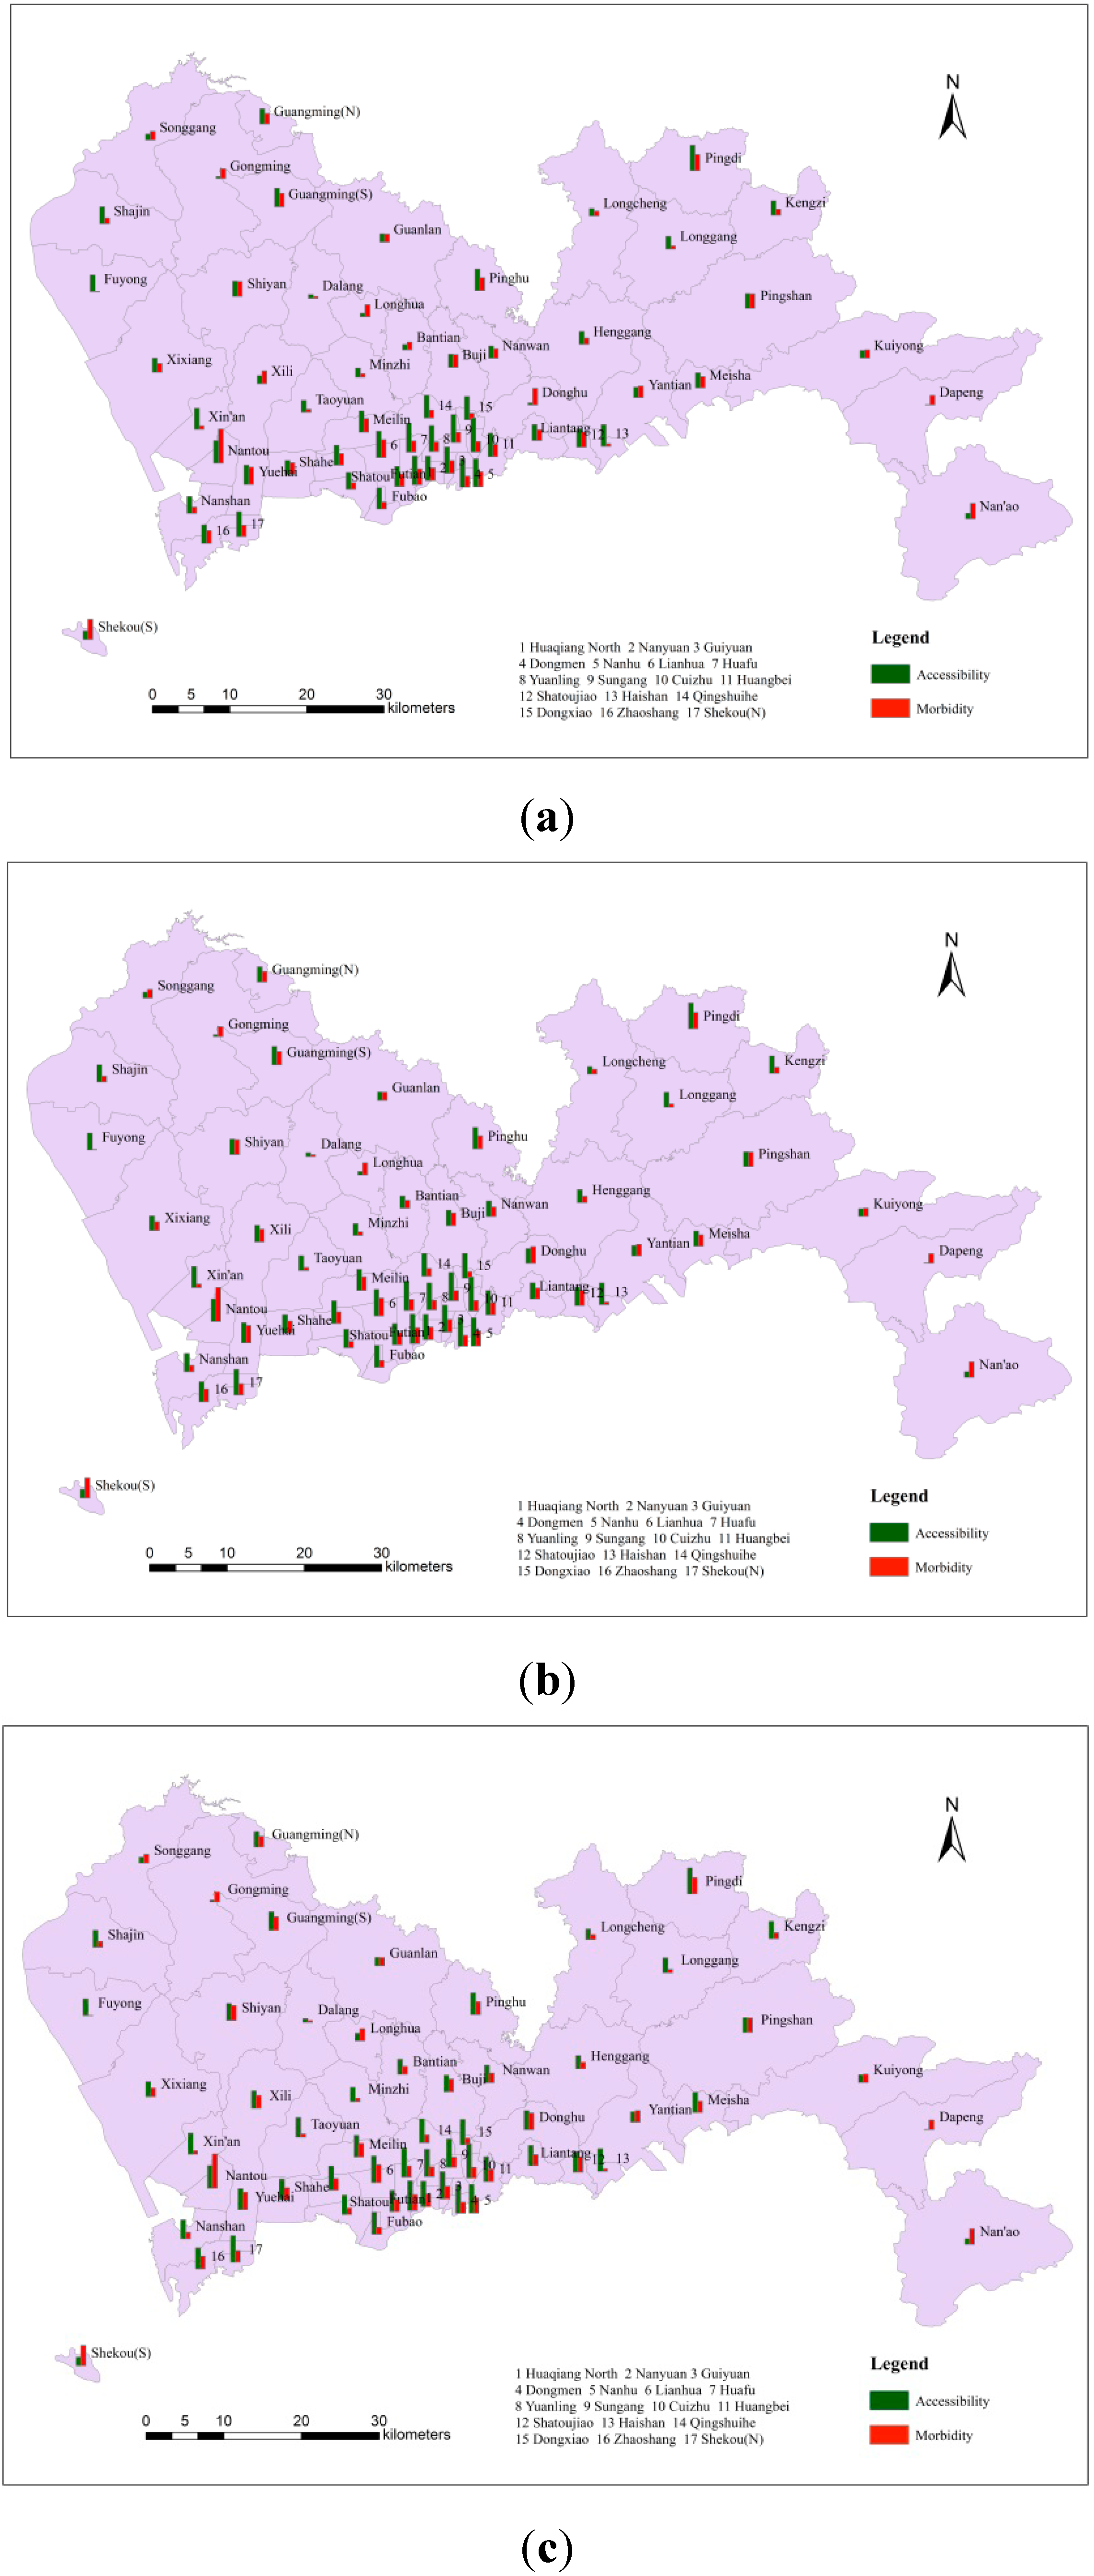
3.3.3. The Distribution of Spatial Access

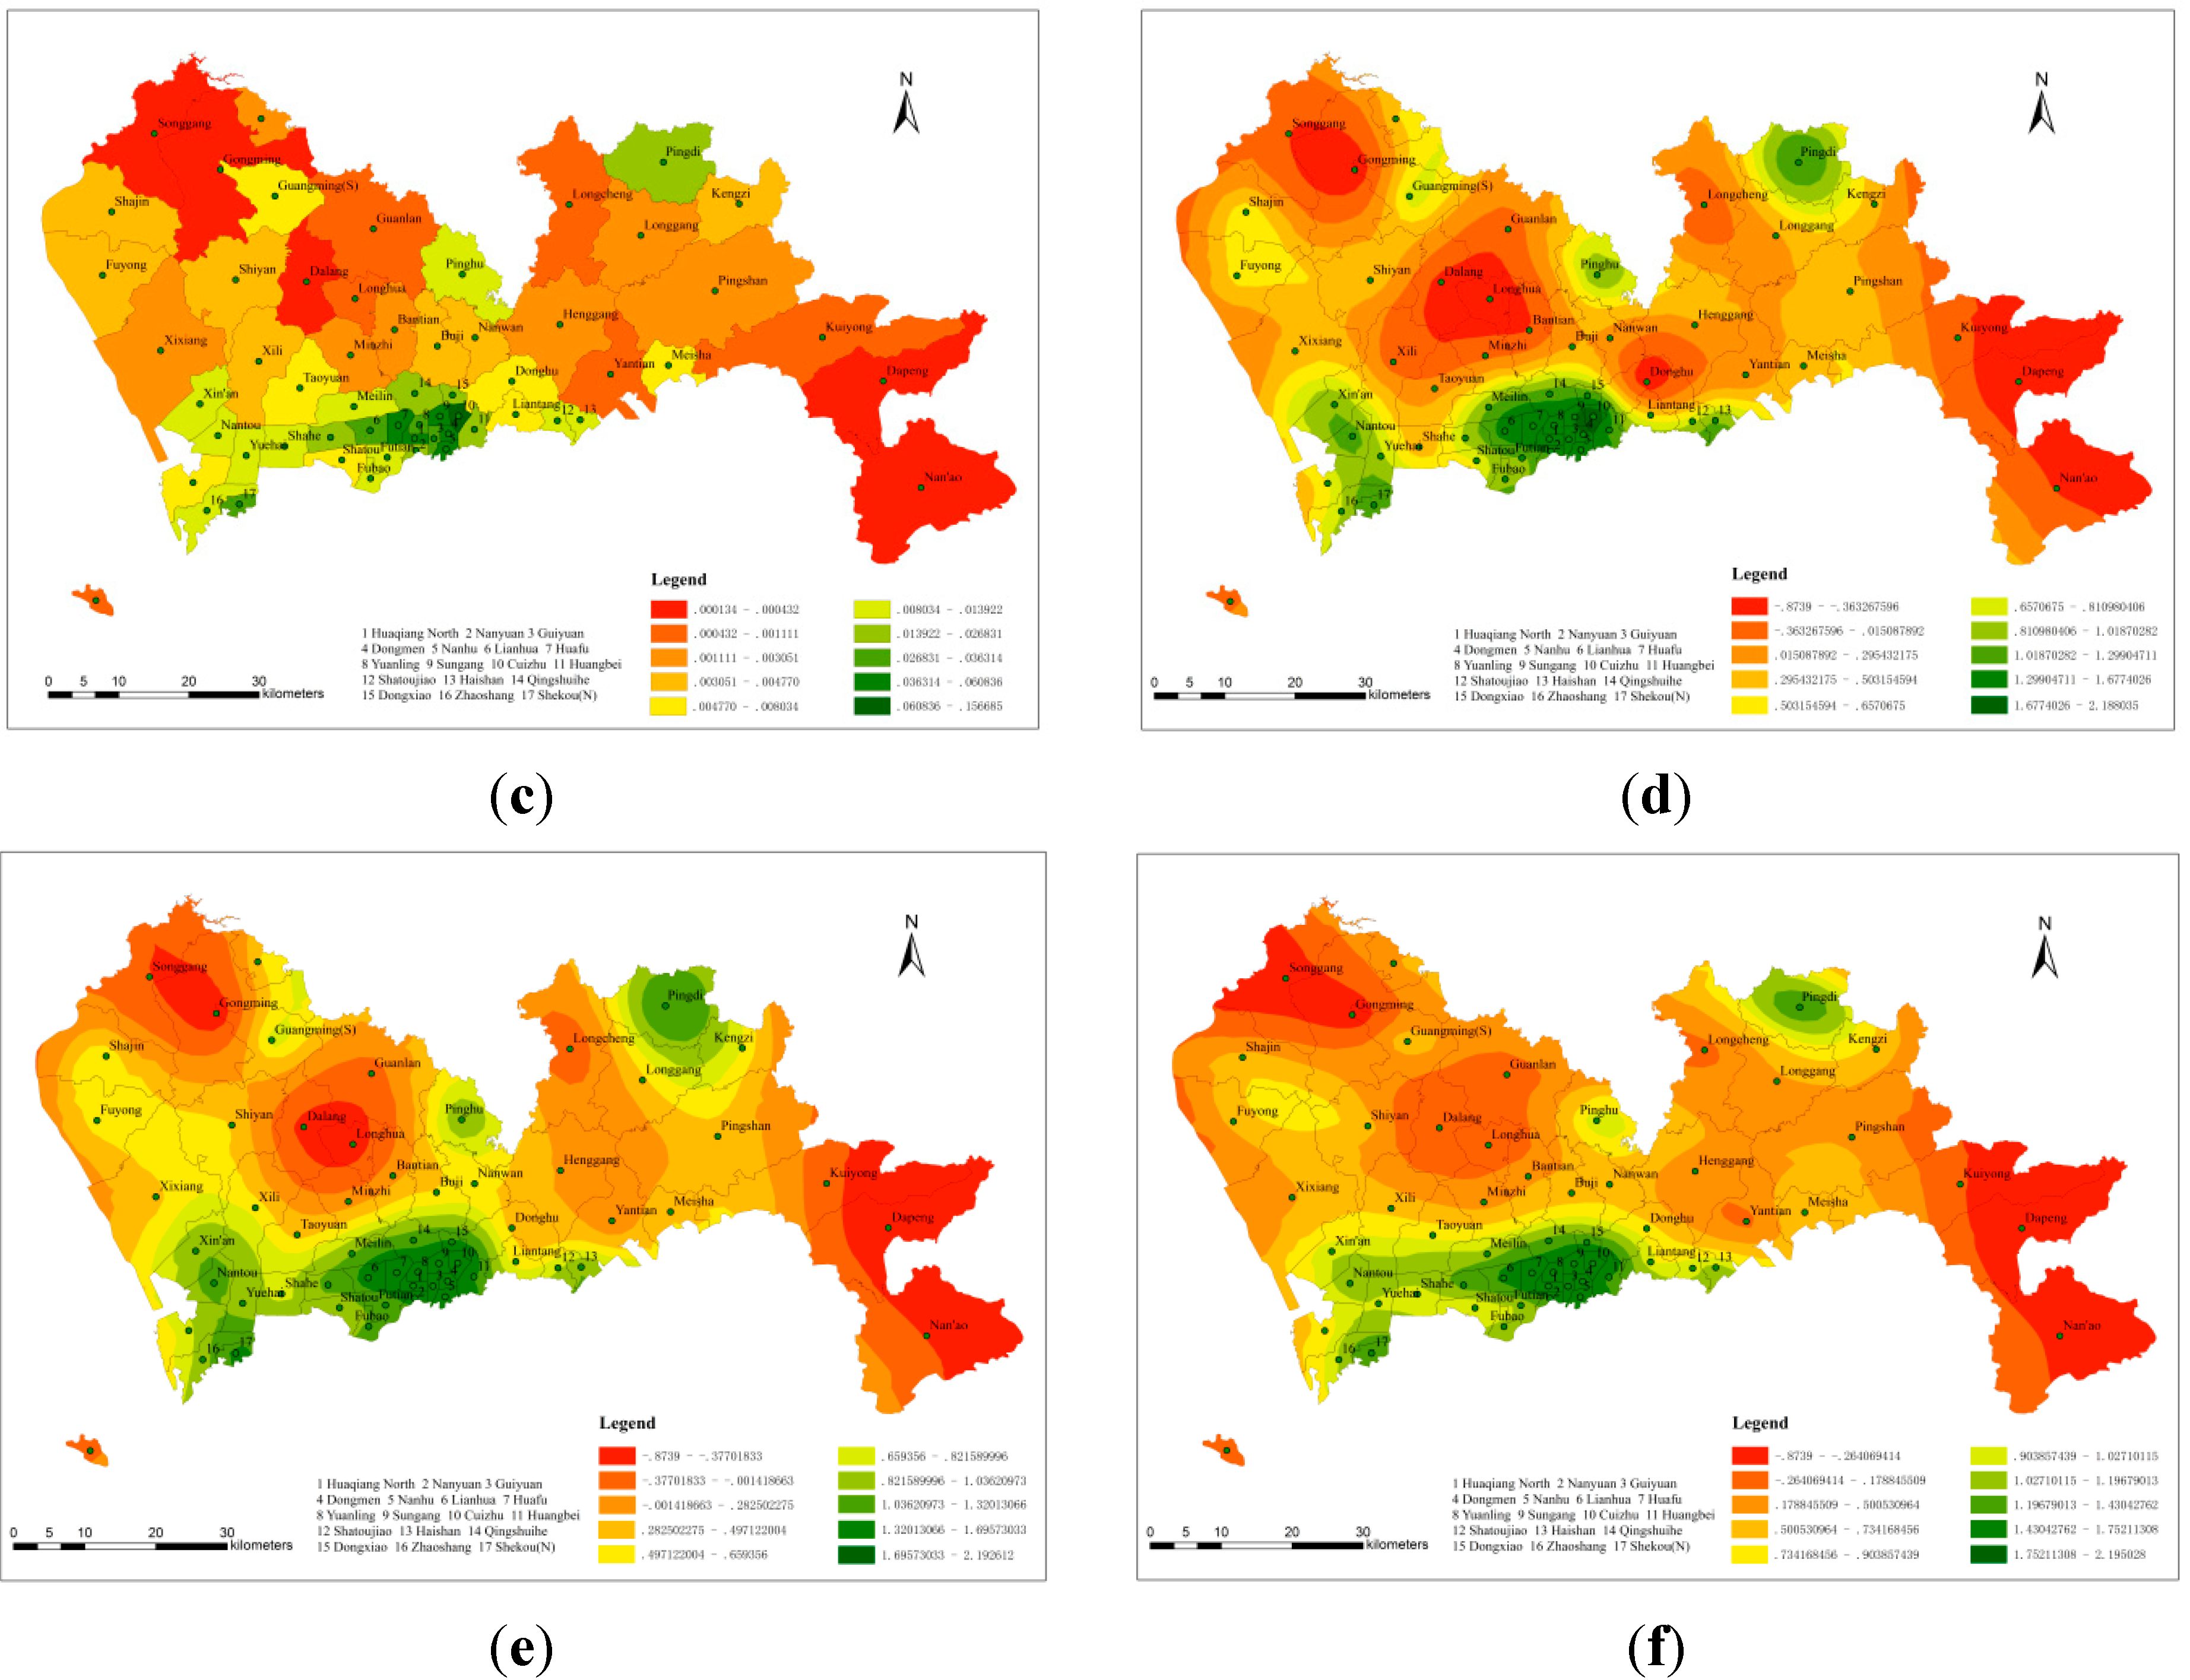
3.3.4. Relationship between Hepatitis B Morbidity and Spatial Access
4. Conclusions
Acknowledgments
Author Contributions
Conflicts of Interest
References
- Shahnaz, S.; Seyed, M.A.; Graham, R.F. Influencing factors on the outcome and prognosis of patients with HBV infection: Seven years follow-up. Hepat. Mon. 2013, 13, 1–7. [Google Scholar]
- Lu, F.M.; Zhuang, H. Prevention of hepatitis B in China: Achievements and challenges. Chinese Med. J. 2009, 122, 2925–2927. [Google Scholar]
- Zhang, Y.; Zhang, H.; Elizabeth, A. Epidemiology of hepatitis B and associated liver diseases in China. Chinese Med. Sci. J. 2012, 27, 243–248. [Google Scholar]
- Tanaka, M.; Katayama, F.; Kato, H. Hepatitis B and C virus infection and hepatocellular carcinoma in China: A review of epidemiology and control measures. Epidemiology 2011, 21, 401–416. [Google Scholar] [CrossRef]
- Statistical Methods in Spatial Epidemiology. Available online: https://www.jstage.jst.go.jp/article/jea/21/6/21_JE20100190/_article (accessed on 22 October 2011).
- Pfeiffer, D.; Robinson, T.; Stevenson, M. Spatial Analysis in Epidemiology; Oxford University Press: New York, NY, USA, 2008. [Google Scholar]
- Zhou, X.N. Spatial Epidemiology; Science Press: Beijing, China, 2009. [Google Scholar]
- Wang, Z.S.; Du, Q.Y.; Liang, S. Analysis of the spatial variation of hospitalization admissions for hypertension disease in Shenzhen, China. Int. J. Environ. Res. Public Health 2014, 11, 713–733. [Google Scholar] [CrossRef]
- Hu, T.; Du, Q.Y.; Liang, S. Spatial analysis of the home addresses of hospital patients with hepatitis B infection or hepatoma in Shenzhen, China from 2010 to 2012. Int. J. Environ. Res. Public Health 2014, 11, 3143–3155. [Google Scholar] [CrossRef]
- Wang, Y.X.; Du, Q.Y.; Ren, F. Spatio-temporal variation and prediction of ischemic heart disease hospitalizations in Shenzhen, China. Int. J. Environ. Res. Public Health 2014, 11, 4799–4824. [Google Scholar] [CrossRef]
- Elliott, P.; Wartenberg, D. Spatial epidemiology: Current approaches and future challenges. Environ. Health Perspect. 2004, 112, 998–1006. [Google Scholar] [CrossRef]
- Guo, R.Z. Spatial Analysis; China Higher Education Press: Beijing, China, 2011. [Google Scholar]
- Cliff, A.; Haggett, P.; Du, C.Z. Disease mapping. Prog. Geog. 1990, 9, 44–49. [Google Scholar]
- Lu, B.L.; Wang, J.F.; Zeng, G. Approaches to study disease clustering in space. Dis. Surveill. 2010, 25, 394–396. [Google Scholar]
- Lynch, M.; Painter, J.; Woodruff, R. Surveillance for foodornborne-disease outbreaks—United States, 1998–2002. Surveill. Summ. 2006, 55, 1–42. [Google Scholar]
- Kulldorff, M.; Nagarwalla, N. Spatial disease clusters: Detection and inference. Stat. Med. 1995, 14, 799–810. [Google Scholar] [CrossRef]
- Kulldorff, M. A spatial scan statistic. Commun. Stat. Theory Methods 1997, 26, 1481–1496. [Google Scholar] [CrossRef]
- Li, X.Z.; Wang, J.F. A fast method for making candidate clusters in spatial scan statistic method. J. Geoinf. Sci. 2013, 15, 505–511. [Google Scholar]
- Muhoho, N.D.; Katsumata, T.; Kimura, E. Cercarial density in the river of an endemic area of schistosomiasis haematobia in Kenya. Am. J. Trop Med. Hyg. 1997, 57, 162–167. [Google Scholar]
- Zhang, Z.J. Spatial Analysis on the High Risk Regions for Schistosomiasis Japonnica and Identification of Active Transmission Sites; Fudan University: Shanghai, China, 2010. [Google Scholar]
- Zhang, A.; Qi, Q.W.; Jiang, L.L. Population exposure to PM2.5 in the urban area of Beijing. PLoS One 2013, 8. [Google Scholar] [CrossRef]
- Liu, X.T. General description of spatial accessibility. Urban Transport. China 2007, 5, 36–43. [Google Scholar]
- Li, P.H.; Lu, Y.Q. Review and prospect of accessibility research. Progr. Geogr. 2005, 24, 69–78. [Google Scholar]
- Joseph, AE.; Phillips, D.R. Accessibility and Utilization: Geographical Perspectives on Health Care Delivery; Sage Publications Ltd.: London, UK, 1984. [Google Scholar]
- Radke, J.; Mu, L. Spatial decompositions, modeling and mapping service regions to predict access to social programs. Geogr. Infor. Sci. 2000, 6, 105–112. [Google Scholar]
- Hu, R.S.; Dong, X.C.; Hu, H. A two-step floating catchment area (2SFCA) method for measuring spatial accessibility to primary healthcare service in China: A case study of Donghai County in Jiangsu Province. Progr. Geogr. 2012, 31, 1600–1607. [Google Scholar]
- Qu, R. Research on Spatial Patterns of Epidemic Disease Based on Spatial Data Analysis: In Hepatitis B Disease as An Example; Wuhan University: Wuhan, China, 2013. [Google Scholar]
- National Bureau of Statistics of the People’s Republic of China. Major Figures on 2010 Population Census of China; China Statistics Press: Beijing, China, 2011. [Google Scholar]
- Paul, AL.; Michael, F.G.; David, J.M. Geographical Information Systems and Science 2nd Edition; Wiley: New York, NY, USA, 2004. [Google Scholar]
- Wu, L.; Liu, Y.; Zhang, J. The Principle, Method and Application of Geographic Information System; Science Press: Beijing, China, 2005. [Google Scholar]
- Li, J.X.; Li, C.K.; Yin, Z.H. ArcGIS based kriging interpolation method and its application. Bull. Surv. Mapp. 2013, 9, 87–90. [Google Scholar]
- Liu, A.L.; Wang, P.F.; Ding, Y.Y. Introduction to Geostatistics; Science Press: Beijing, China, 2012. [Google Scholar]
- Cao, Z.D.; Wang, J.F.; Gao, Y.H. Risk factors and autocorrelation characteristics on severe acute respiratory syndrome in Guangzhou. J. Geogr. Sci. 2008, 63, 981–993. [Google Scholar]
- Buda, A.; Jarynowski, A. Life-time of correlations and its applications. Wydawnictwo Niezalezne 2010, 1, 5–21. [Google Scholar]
- Cohen, J. Statistical Power Analysis for the Behavioral Sciences, 2nd ed.; Routledge: London, UK, 1988. [Google Scholar]
- Khan, A.A. An integrated approach to measuring potential spatial access to health care services. Socioecon. Plann. Sci. 1992, 26, 275–287. [Google Scholar] [CrossRef]
- Luo, W.; Qi, Y. An enhanced two-step floating catchment area (E2SFCA) method for measuring spatial accessibility to primary care physicians. Health Place 2009, 15, 1100–1107. [Google Scholar] [CrossRef]
- Cao, Z.D.; Zeng, D.J.; Zheng, X.L. Spatio-temporal evolution of Beijing 2003 SARS epidemic. Sci. China Earth Sci. 2010, 40, 776–788. [Google Scholar]
- Zhong, S.B. Application of GIS and Remote Sensing for Study of Epidemiology of Infectious Disease-Case Studies of Hepatitis B and Highly Pathogenic Avian Influenza; Academy of Science: Beijing, China, 2010. [Google Scholar]
- Chen, Y.S. Study of the risk of HBV Infection in the Public Service Place; Chinese Center for Disease Control and Prevention: Beijing, China, 2009. [Google Scholar]
- Wen, G.Y.; Chen, H.P.; Liu, Y. Investigation and analysis on risk factors of hepatitis B transmission in public places in Xining City. Chin. Prim. Health Care 2009, 23, 69–70. [Google Scholar]
- Song, D.H.; Zhang, S.R.; Zhao, J.H. The knowledge, attitude and behavior on hepatitis B prevention between hepatitis B patients and healthy people. Mod. Prevent. Med. 2009, 36, 688–691. [Google Scholar]
- Chen, Y.S.; Zhou, Y.Q.; Wang, X.J. Study on the status sanitizing and HBV contamination of appliances used in the public service places. Chin. J. Vaccines Immun. 2008, 14, 315–318. [Google Scholar]
- Shenzhen Statistics and Information Bureau. Shenzhen Statistical Yearbook 2010; China Statistics Press: Beijing, China, 2011. [Google Scholar]
© 2014 by the authors; licensee MDPI, Basel, Switzerland. This article is an open access article distributed under the terms and conditions of the Creative Commons Attribution license (http://creativecommons.org/licenses/by/4.0/).
Share and Cite
Xi, Y.; Ren, F.; Liang, S.; Zhang, J.; Lin, D.-N. Spatial Analysis of the Distribution, Risk Factors and Access to Medical Resources of Patients with Hepatitis B in Shenzhen, China. Int. J. Environ. Res. Public Health 2014, 11, 11505-11527. https://doi.org/10.3390/ijerph111111505
Xi Y, Ren F, Liang S, Zhang J, Lin D-N. Spatial Analysis of the Distribution, Risk Factors and Access to Medical Resources of Patients with Hepatitis B in Shenzhen, China. International Journal of Environmental Research and Public Health. 2014; 11(11):11505-11527. https://doi.org/10.3390/ijerph111111505
Chicago/Turabian StyleXi, Yuliang, Fu Ren, Shi Liang, Jinghua Zhang, and De-Nan Lin. 2014. "Spatial Analysis of the Distribution, Risk Factors and Access to Medical Resources of Patients with Hepatitis B in Shenzhen, China" International Journal of Environmental Research and Public Health 11, no. 11: 11505-11527. https://doi.org/10.3390/ijerph111111505