


Abstract
The relationships between meteorology and pregnancy outcomes are not well known. This article reviews available evidence on the relationships between seasonality or meteorology and three major pregnancy outcomes: the hypertensive disorders of pregnancy (including preeclampsia, eclampsia and gestational hypertension), gestational length and birth weight. In total 35, 28 and 27 studies were identified for each of these outcomes. The risks of preeclampsia appear higher for women with conception during the warmest months, and delivery in the coldest months of the year. Delivery in the coldest months is also associated with a higher eclampsia risk. Patterns of decreased gestational lengths have been observed for births in winter, as well as summer months. Most analytical studies also report decreases in gestational lengths associated with heat. Birth weights are lower for deliveries occurring in winter and in summer months. Only a limited number of studies have investigated the effects of barometric pressure on gestational length or the effects of temperature and sunshine exposure on birth weight, but these questions appear worth investigating further. Available results should encourage further etiological research aiming at enhancing our understanding of the relationships between meteorology and adverse pregnancy outcomes, ideally via harmonized multicentric studies.
Keywords:
preeclampsia; preterm birth; birth weight; meteorology; seasonality; climate; temperature; heat; cold; humidity 1. Introduction
Adverse pregnancy outcomes are responsible for a considerable burden of morbidity and mortality worldwide, both in pregnant women and their offspring throughout their lifespan [1]. Among the most frequent and serious outcomes of pregnancy are hypertensive disorders, preterm birth and intrauterine growth retardation.
Hypertensive disorders during pregnancy occur in approximately 10% of pregnant women [2]. One of the most common is preeclampsia, a hypertensive syndrome specific to pregnancy, generally defined as new hypertension (blood pressure > 140/90 mm Hg) and substantial proteinuria (≥300 mg in 24 h) at or after 20 weeks’ gestation [3]. Preeclampsia may be associated with placental insufficiency and maternal organ dysfunction. It can also cause seizures, in the more severe form called eclampsia. Preeclampsia and eclampsia affect 2% to 8% of pregnancies worldwide and are major causes of maternal diseases, disability and death [2]. Preterm birth is defined as birth before 37 completed weeks of gestation. It is the major cause for infant death and may be responsible for infant and long-term cognitive function impairments, decreased motor functioning, increased behavioral disorders, impaired vision and hearing, respiratory complications, and substantial associated hospital cost and loss of school and work days [4]. More than 10% of pregnancies worldwide result in preterm births [4]. By hampering fetuses to complete their full intrauterine growth, preterm birth can result in infants born with a restricted weight. Yet another cause for restricted birth weight may be intrauterine growth retardation (IUGR), which is characterized by a small birth weight for gestational age. IUGR is associated with impaired child growth and increased risk of adult diseases in later life including type II diabetes, hypertension, and cardiovascular disease [5]. In 2010, approximately 11% of all infants were born with low birth weight (LBW, defined as below 2,500 g) worldwide [6].
There is a growing interest in the health effects of meteorology, especially since the frequency and magnitude of extreme meteorological events (e.g., heat waves, violent storms) are expected to increase in a context of climate change [7]. Meteorological conditions have been shown to influence several health outcomes, either communicable such as cholera, malaria and bacterial meningitis [8] or non communicable such as cardiovascular diseases [9]. The health effects of meteorological conditions might well extent to a broader set of outcomes, which would then be important to identify. Considering the frequency and impacts of adverse pregnancy outcomes, studying their relations with meteorological conditions appears of primary interest.
This systematic review aimed at synthesizing available evidence on the potential effects of meteorology on major pregnancy outcomes: the hypertensive disorders of pregnancy (including preeclampsia, eclampsia and gestational hypertension), gestational length (including preterm birth) and birth weight.
2. Material and Methods
2.1. Search Strategy
A comprehensive and systematic literature review was conducted of all original studies published in English that examined meteorological influences on the hypertensive disorders of pregnancy, preterm birth and birth weight. Human studies published between 1 January 1990 and 1 November 2013 were identified using the PubMed and Web of Science (ISI) databases to search for articles published in academic, peer reviewed journals. Standard Boolean logic was applied using the following format in PubMed: ((preeclampsia OR pre-eclampsia OR eclampsia OR pregnancy-induced hypertension OR gestational hypertension) AND (season* OR climate OR weather OR meteorology OR humidity OR precipitation OR rainfall OR barometric pressure OR atmospheric pressure OR sunlight OR temperature OR wind) AND (“1990/01/01”[PDat]: “2013/03/31”[PDat]) AND Humans [Mesh]). The same query was repeated for the other study outcomes: (preterm OR pre-term OR premature OR gestational length) and (birth weight OR low birth weight OR term birth weight OR small for gestational age). The same logic was applied for the search in Web of Science (ISI) except that no criterion was available to select only human studies.
2.2. Screening Process
Articles were retrieved individually for each outcome using a two step approach. First, titles and abstracts were screened for mentions of season, meteorological variables and pregnancy outcomes. Second, articles passing this first step were reviewed in depth to assess if they reported results for associations between at least one meteorological variable or seasonality and at least one of the pregnancy outcomes of interest. Reviews and duplicate publications were excluded since they did not report original findings. References of the retrieved papers were further examined to ensure that all relevant published papers were included.
The Pubmed and Web of Science database searches retrieved 173 and 169 articles, respectively, for the hypertensive disorders of pregnancy (35 of them meeting the above inclusion criteria), 1,774 and 3,085 for length of gestation including preterm birth (28 of them met the above inclusion criteria), and 1,080 and 2,246 articles for birth weight (27 of them met the above inclusion criteria).
2.3. Data Extraction
The following detailed information was obtained and tabulated according to outcome for each included study: summarized meteorological or seasonal variable; first author (year) and setting; climate classification; detailed definition of exposure metric of meteorological variable or seasonality; study design; inclusion criteria; statistical model; sample size; summarized results including effect sizes when available; and complementary information including adjustment for confounders. Base data were also extracted when they were suitable for calculating effect sizes for meta-analyses but that these effect sizes were not directly reported in publications.
2.4. Meta-Analyses
Whenever feasible, we computed quantitative summaries of available evidence using a meta-analysis approach. Meta-analysis was conducted whenever three or more studies met the following criteria and were pooled for a specific combination of outcome and exposure.
- They reported the same pregnancy outcome.
- They reported sample sizes.
- They examined the same type of exposure variable (e.g., two studies on temperature will be pooled but one study on temperature will not be pooled with another one on a heat-humidity index (composite variable based on temperature and humidity and calculated according to different formulae).
- They reported effect sizes estimates with consistent temporal resolutions, or at least provided base data of consistent temporal resolutions (e.g., by month or pregnancy trimester) allowing to compute effect size estimates.
- For month-to-month variations in pregnancy outcomes, pooling was conducted only for studies from locations showing comparable relative trends in month-to-month temperature changes (these temporal profiles were assessed from [10]). For studies conducted in the North hemisphere, this means December and January were the coldest months, and July and August were the warmest, with monotonic transitions in between. A 6-month lag was applied for studies conducted in the South hemisphere as compared to the North hemisphere. Meta-analyses were therefore conducted using a monthly indicator defined as follows: “January in North hemisphere OR July in South hemisphere”, “February in North hemisphere OR August in South hemisphere”, and so on for the other months.
- For season-to-season variations in pregnancy outcomes, we relied on the definitions of seasons provided by authors in their original publications. Some studies documented only month-to-month variations in pregnancy outcomes, and did not report effect size estimates by season. However, if these studies reported number of cases and total pregnancies by month, we aggregated monthly data to seasonal data and subsequently included them in the meta-analyses on season. The following were adopted for seasons in the North hemisphere: winter (December–February), spring (March–May), summer (June–August), and autumn (September–October). Again, a lag of 6 months was applied to define seasons in the Southern hemisphere.
Meta-effect sizes estimates and associated 95% credible intervals were calculated using random effects models allowing to account for heterogeneity in effect sizes estimates between different studies [11,12].
2.5. Presentation of Results
In the results section, we summarize the findings by pregnancy outcome. We first describe patterns reported by season of conception and season of birth, and then by specific meteorological variables such as temperature, humidity, precipitations sunshine or wind patterns. Meta-effect size estimates are presented whenever three or more studies of sufficiently homogeneous designs provided necessary data to conduct meta-analyses (as detailed in Section 2.4 above). Otherwise, results are presented using a narrative review approach.
In this summary, we separate studies conducted in tropical and non-tropical settings, defined by the Köppen-Geiger climate classification system [13], which divides climates into five main groups: tropical/megathermal, dry temperate, mild temperate, continental/microthermal, and polar. Articles were classified as either tropical, if they fell into any of the tropical subtypes (i.e., tropical rainforest climate, tropical monsoon climate, or tropical wet and dry or savannah climate), or non-tropical if they did not. This distinction was made because many studies in tropical climates define season as rainy vs. dry, whereas seasons were generally defined as winter, spring, autumn and summer in the studies conducted in non-tropical settings.
3. Results
3.1. Findings from Hypertensive Disorders of Pregnancy
For hypertensive disorders of pregnancy, we retrieved 35 studies that examined three different pregnancy outcomes: preeclampsia (n = 24), eclampsia (n = 11) and gestational hypertension (n = 4).
3.1.1. Preeclampsia
Six studies examining preeclampsia focused on seasonality of conception (Table A1). Five of them were conducted in non tropical settings and reported month-to-month variations that allowed meta-analysis [14,15,16,17,18]. The result of the meta-analysis including 530,160 births (Figure 1) shows an increase in risks of preeclampsia from the coldest to the warmest months of conception, followed by a decrease from the warmest to the coldest months of conception, although pooled relative risks were statistically significant only for certain months. One single study in Australia contributed to 80% of pregnancies included in the meta-analysis [16]. After excluding this study, we still observed a similar temporal pattern, although most relative risks are not significant anymore (Table A2). One study conducted in the tropical setting of Thailand could not be pooled with the other studies included in the meta-analysis, which were all conducted in non-tropical settings. This study reported a higher risk of preeclampsia for conception in dry than in wet season [19].
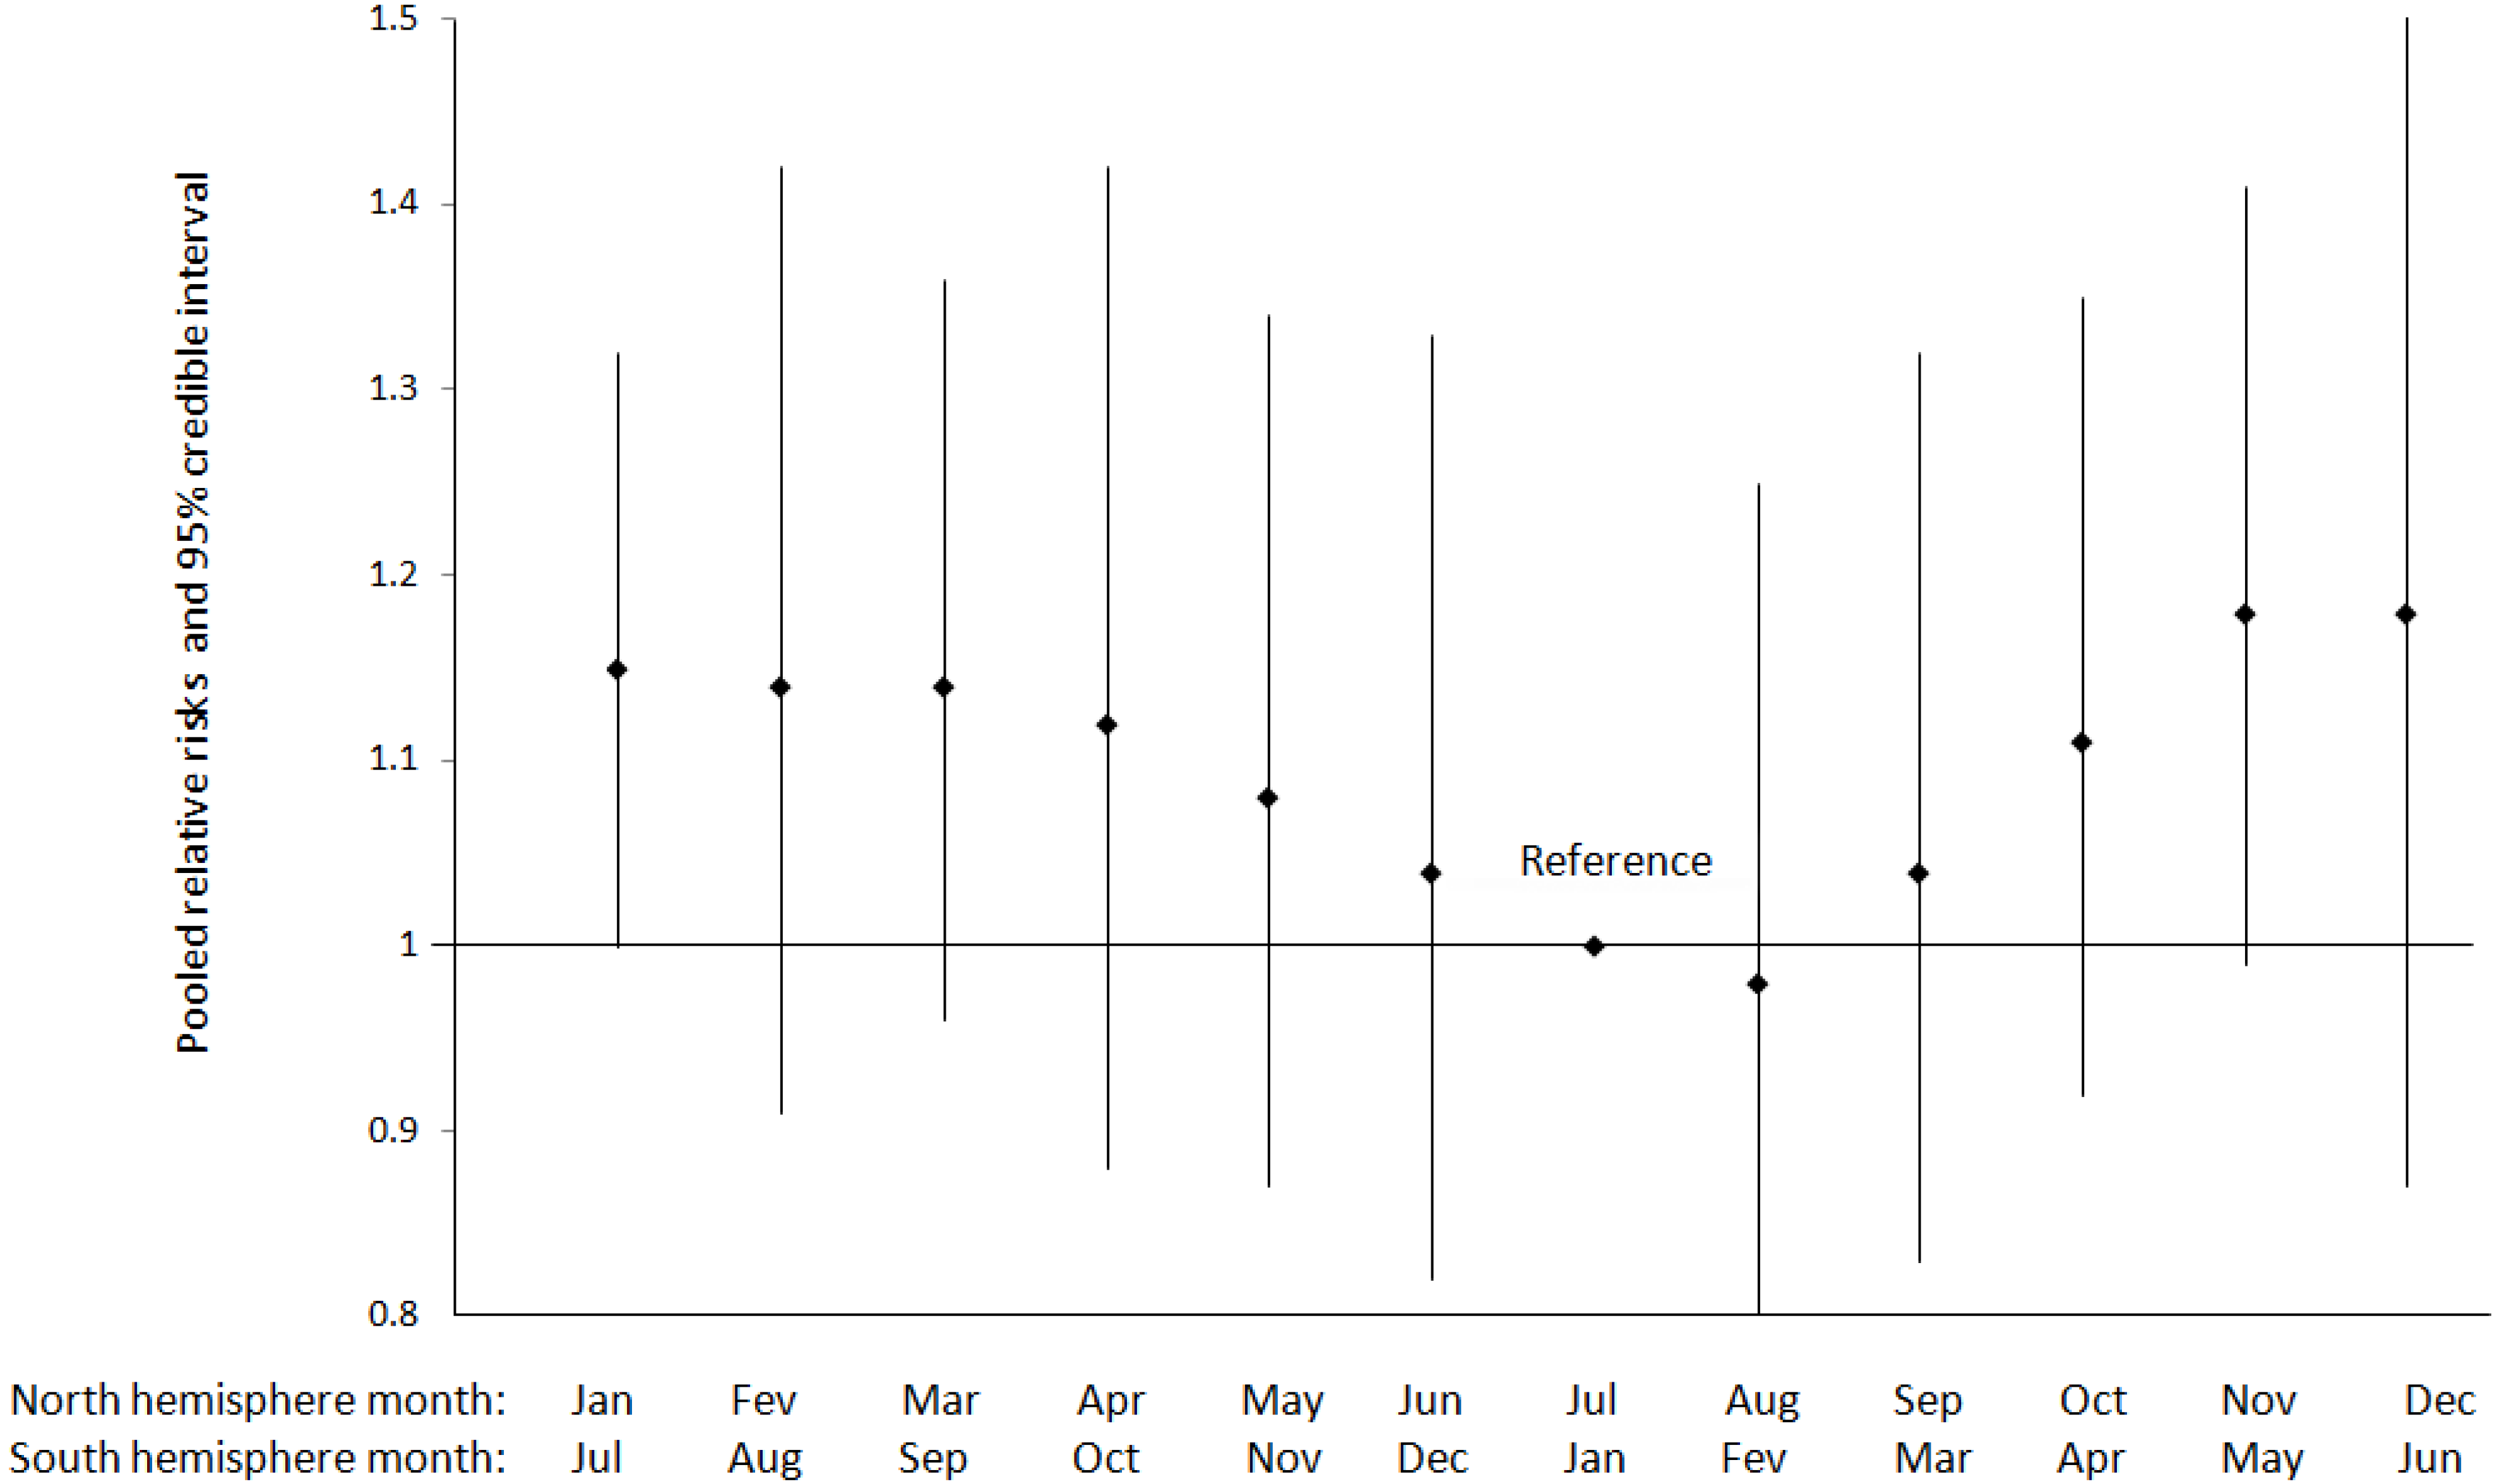
Among 19 studies focusing on seasonality of birth, 10 documented month-to-month variations (Table A3). Nine were conducted in non tropical settings and one in the tropical setting of Zimbabwe [20]. However, the monthly variations in temperature in Zimbabwe were judged sufficiently comparable with those of non-tropical settings to allow for a meta-analysis of 10 studies. The result of the meta-analysis including 2,552,887 births (Figure 2) shows a monotonic decrease in risks from the coolest to the warmest months of births, followed by an increase from the warmest to the coolest months of births, with significantly higher risk for the month of January/July (for the North/South hemisphere respectively) as compared to the month of July/January (for the North/South hemisphere respectively) but not for other months. This pattern is not affected by the exclusion of the sole tropical study [20] (data not shown). One study conducted in Norway accounted for 73% of all the pregnancies included in the meta-analysis [21]. The exclusion of this study led to less marked temporal pattern, and made the results insignificant (Table A4).
Figure 1.
Pooled relative risks and 95% credible interval for the variation in preeclampsia incidence by month of conception (N = 530,160 births).
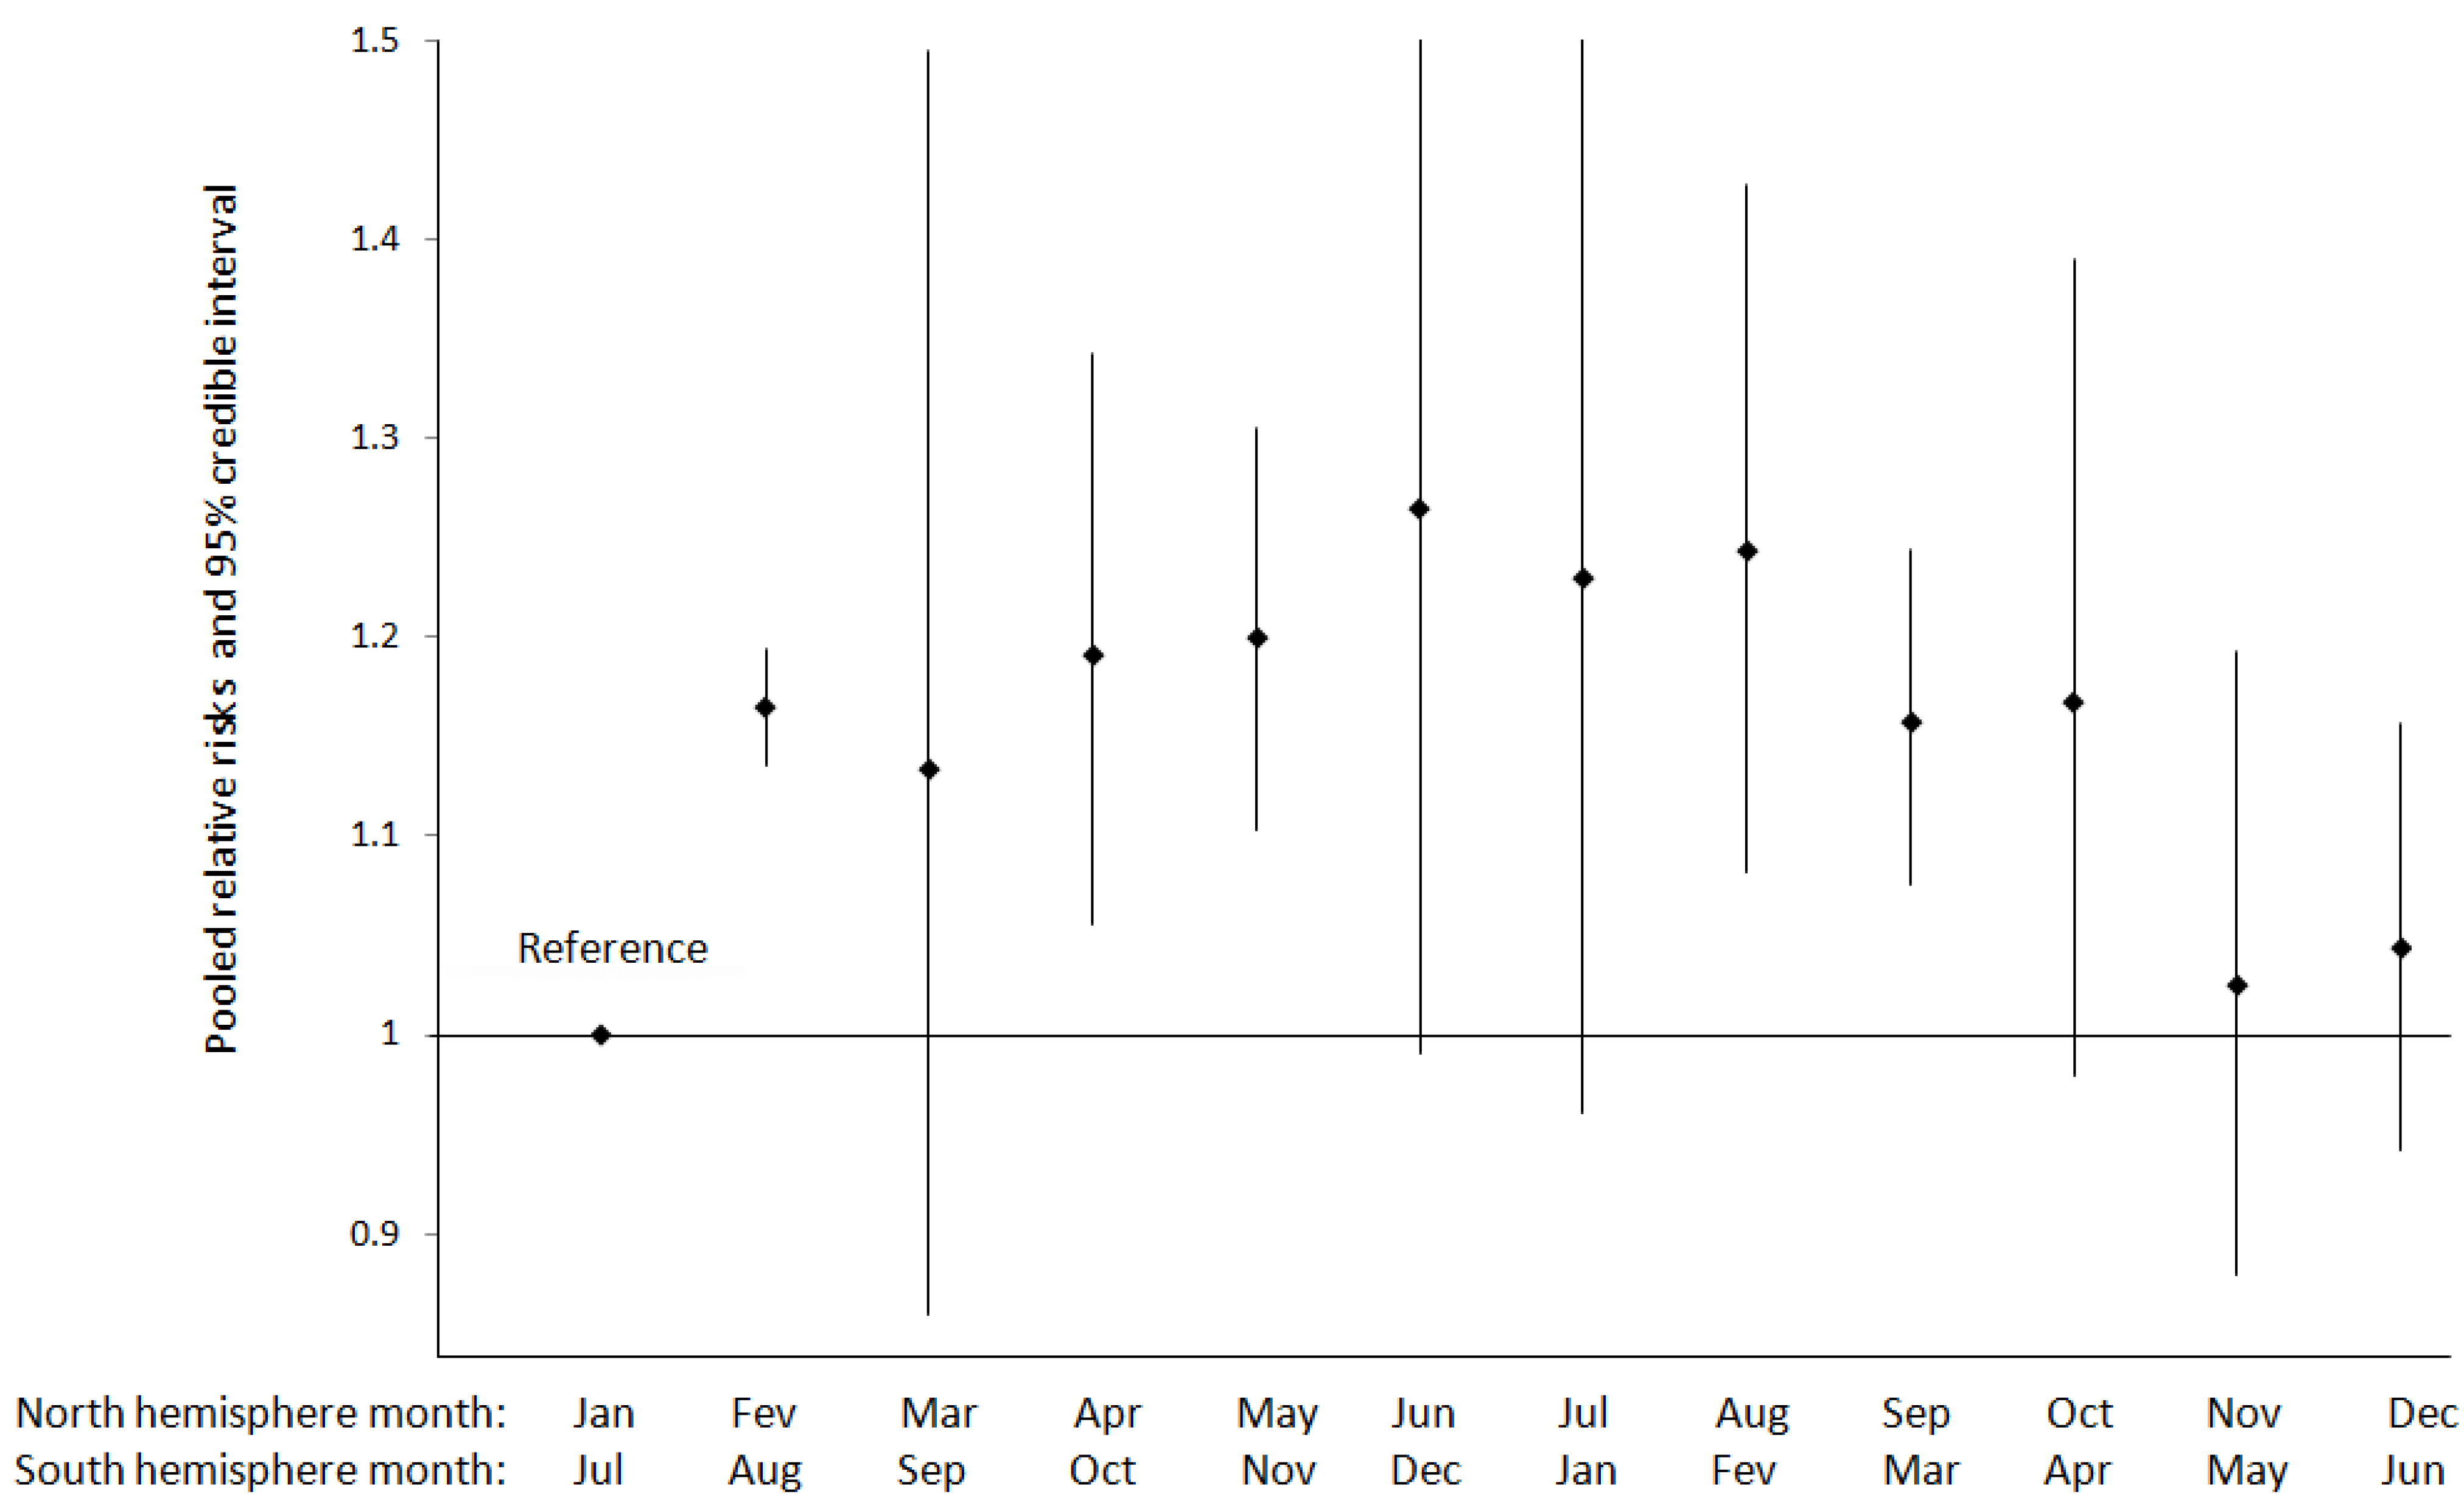
Figure 2.
Pooled relative risks and 95% credible interval for the variation in preeclampsia incidence by month of birth (N = 2,552,887 births).
Additional meta-analyses on seasonality of birth were conducted by including studies documenting season-to-season variations (or month-to-month variations but with sufficient information to obtain seasonal aggregates). We pooled a different set of eight studies (three of which were also included in the above month-to-month analyses) with 386,839 births (Table A5). The highest pooled relative risks are observed for births in both winter and spring (summer being considered as a reference category, with the lowest risk), but results are not statistically significant (Table A6). A study conducted in Texas (USA) contributed to 80% of pregnancies [22] included in the meta-analysis. After the exclusion of this study, the highest rate ratio was observed in spring and was statistically significant, while summer still showed the lowest risk (Table A7).
Some studies on the seasonal variability of birth could not be pooled with others (Table A5): A study in Mississippi (USA) reported no significant difference of preeclampsia risk by season of birth based on only 3 seasons (spring, summer, autumn) [23]. Three studies conducted in tropical settings in India, Thailand and Zimbabwe reported no significant difference in preeclampsia risk between the monsoon and dry season [19,20,24]. However, not enough details were available at seasonal resolution [20] to allow for a meta-analysis. Last in Nigeria, the number of caesarians for preeclampsia was higher during the rainy than during the dry season; however this study did not consider any control population of non-preeclamptic women to allow for a comparison [25].
Ten studies focused on the association between preeclampsia and temperature or heat-humidity indices (Table A8). A study in Canada associated occupational exposures to extreme temperatures during the first 20 weeks of pregnancy with an increased preeclampsia risk. However, the definition of extreme temperature employed did not allow differentiation between cold and hot temperatures [26]. Another study in China found preeclampsia to be positively associated with higher heat index (defined as a function of temperature and humidity) at the time of conception with a lag of two months [18].
Three studies conducted in Israel, Kuwait, and South Africa found that the risk of preeclampsia was inversely associated with temperature during the month of birth [27,28,29]. From a slightly different set of three studies providing base data [28,29,30] we computed a pooled correlation coefficient between preeclampsia rates and mean temperature during the month of birth (an inverse but insignificant association was observed: R = −0.22, 95% credible interval: –0.71; 0.27). Two studies found no association between preeclampsia and mean seasonal temperature in Iran [31] and in the USA [23]. A study in Israel found that preeclampsia risk was associated with changes in daily overall differences of temperature exceeding 10 °C in any direction [30]. In tropical settings, only two studies in India [24] and Thailand [19] focused on the relation between preeclampsia and seasonal temperature and both found no significant difference in preeclampsia risk by. However, inter-seasonal contrasts in average temperature were low (<2 °C) in both settings.
Six studies examined humidity. Three studies conducted in non-tropical climates in Israel [27,30] and Kuwait [29] found that risk of preeclampsia was positively associated with high humidity during the month of delivery. However, these results could not be pooled since one study [27] only reports a contrast in preeclampsia rates above or below a 70% humidity threshold and similar indicator could not be reconstructed from the two other studies [29,30]. In the Mississippi (USA), no association between preeclampsia risk and mean seasonal humidity (calculated for three seasons) was observed [23].
In the tropical settings of India and Thailand, [19,24] no significant contrast in preeclampsia rates was observed between births in the rainy and the dry seasons, which saw 5%–10% contrasts in relative humidity and 200 mm [32] to 500 mm [24] contrasts in precipitations, respectively. However in Thailand, conception during the dry season was associated with an increased risk of preeclampsia [19]. Three more studies examined precipitations. A study in Zimbabwe observed increased preeclampsia incidence rates during months of delivery with high precipitations, but the results based on a dichotomous indicator for rainfall (15 mm threshold) was not significant [20]. In South Africa, no significant correlation was observed between monthly average rainfall and preeclampsia rates [28]. In Iran, precipitations averaged on each of four seasons were not associated with preeclampsia rates [31].
Results were scarcer for the association between preeclampsia and other meteorological parameters. One study in Australia found that increased sunlight exposure around conception was inversely associated with early onset, but not late-onset, preeclampsia [16]. One study in India found no association between barometric pressure during the season of delivery and risk of preeclampsia [24]. One study in Israel found that risk of preeclampsia was positively associated with number of days with strong winds (exceeding a speed of 5 m/s) [30].
3.1.2. Eclampsia
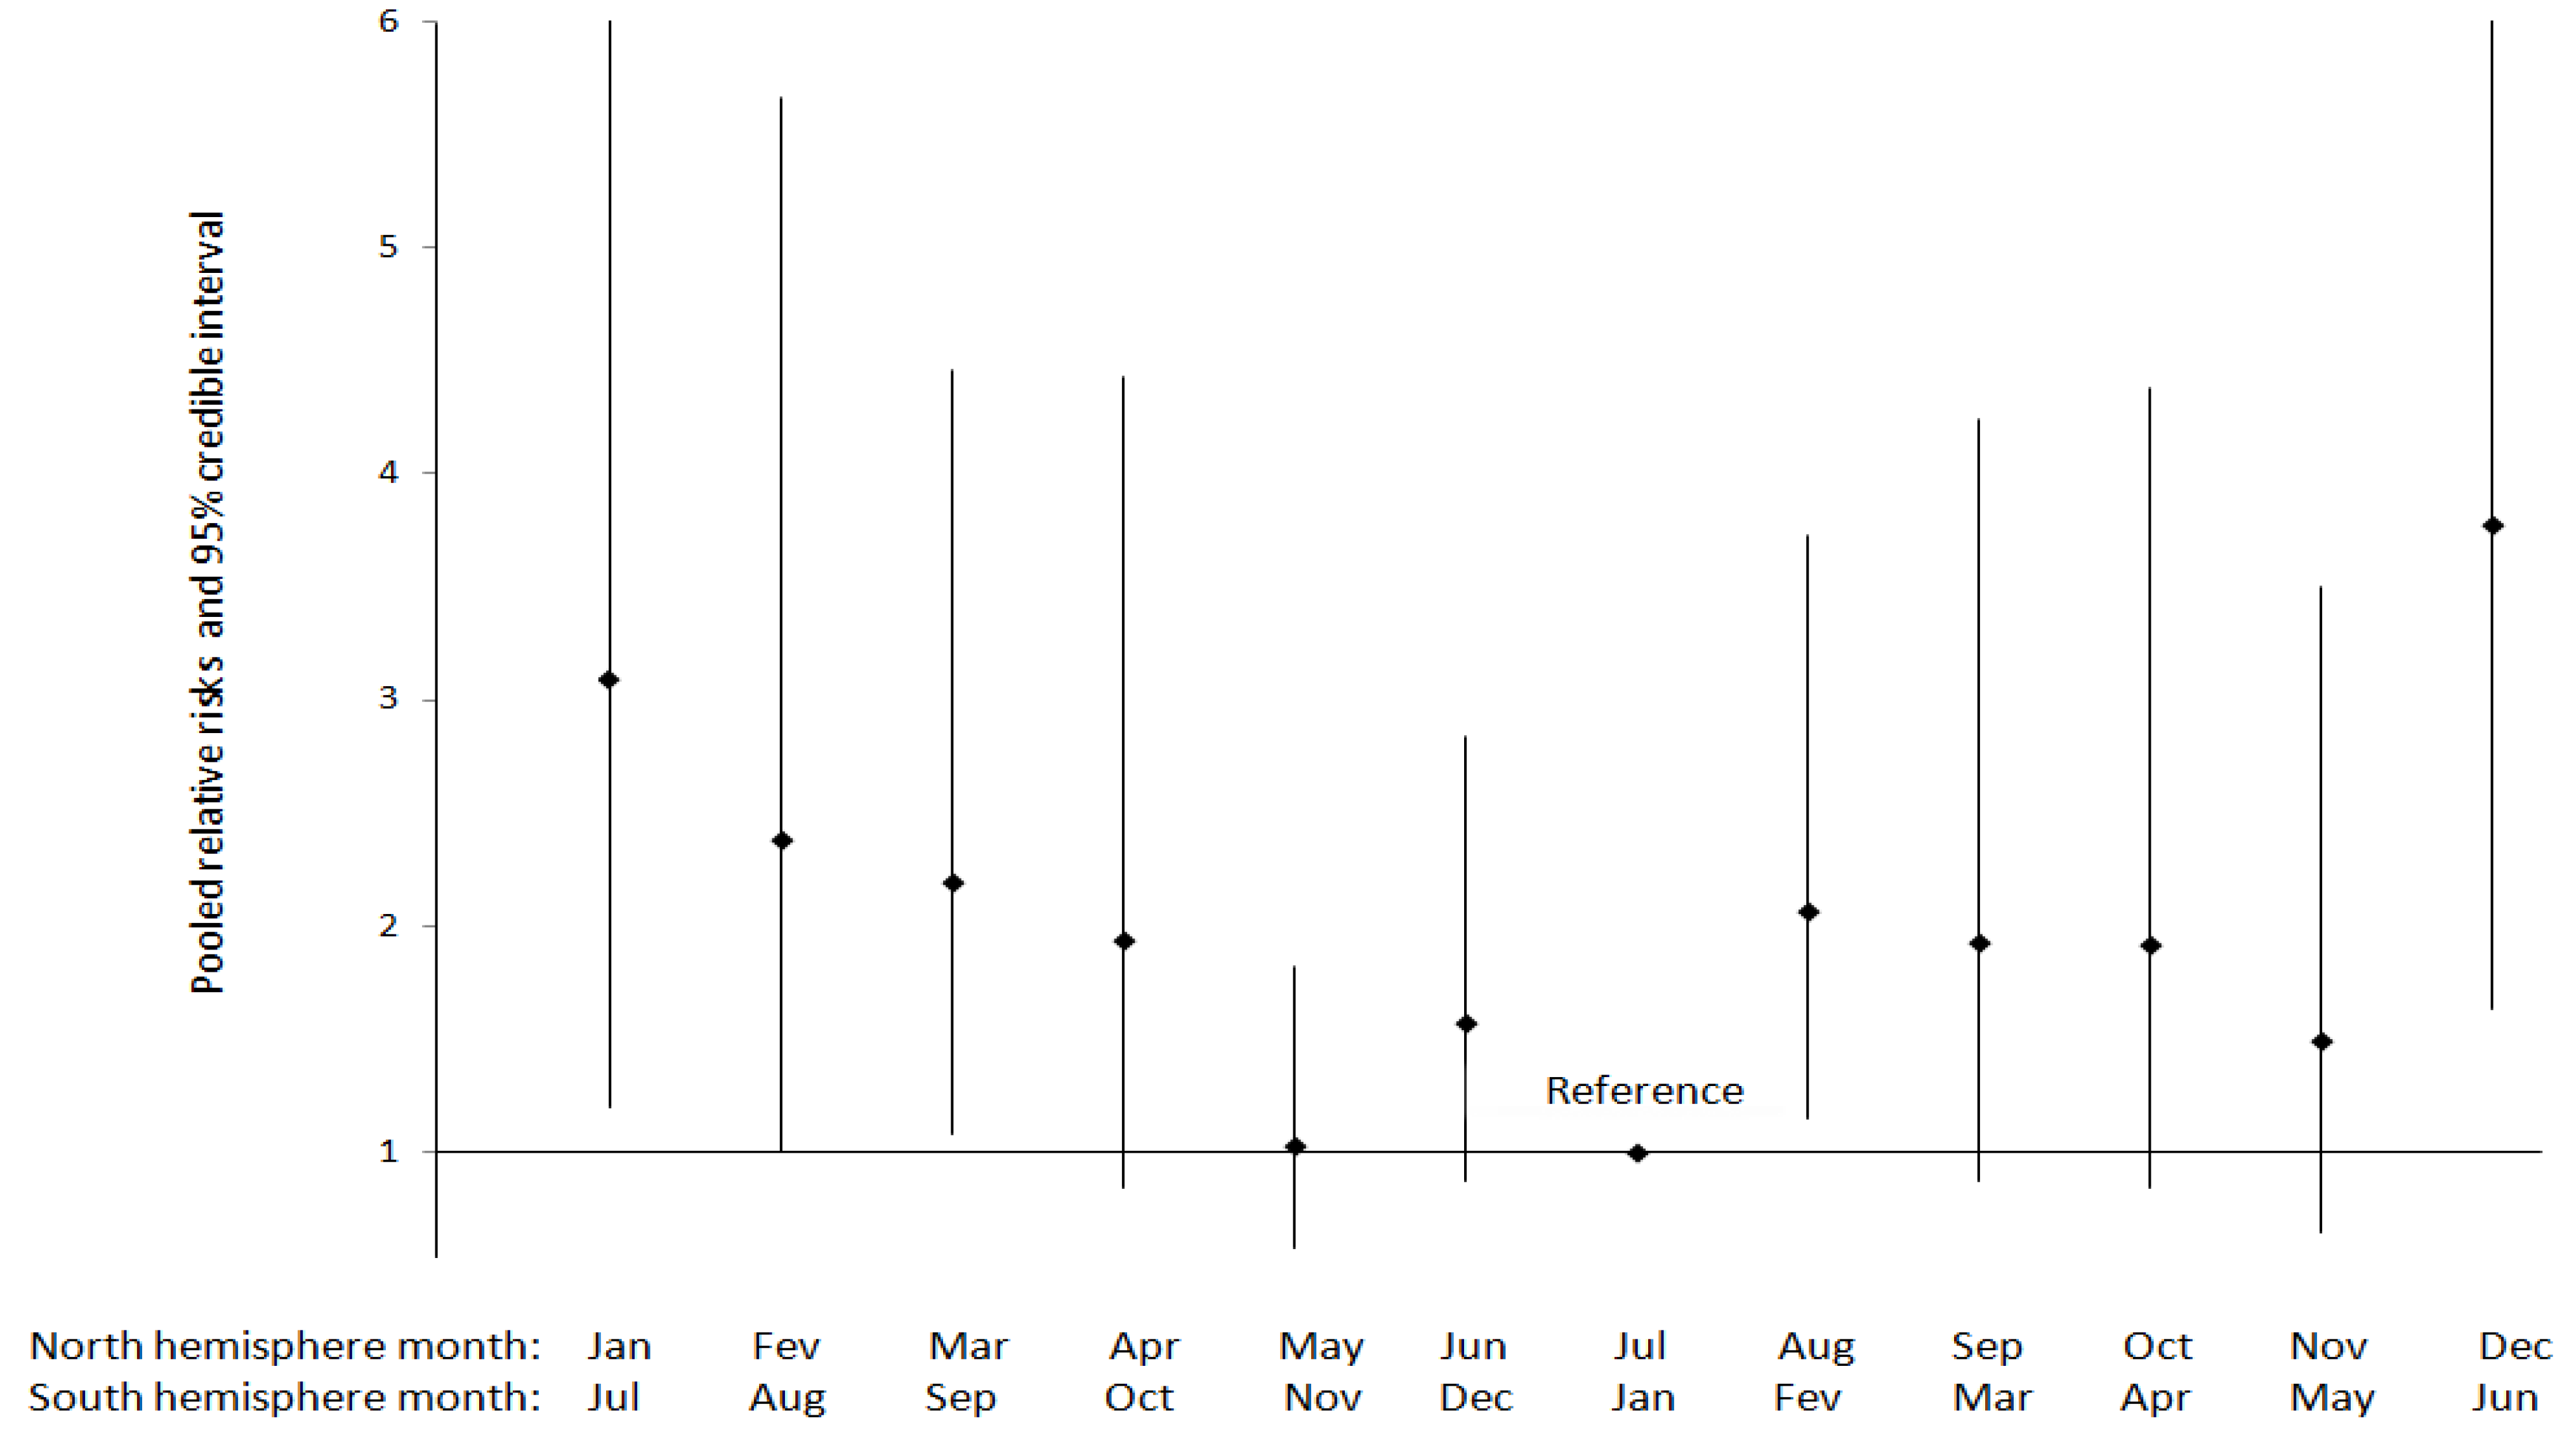
No study examined eclampsia risk in relation to the time of conception. However, ten studies examining eclampsia focused on seasonality of birth (Table 1). Four studies were identified for the meta-analysis of month-to-month variations (Table A9), with three in non-tropical countries and one in a tropical setting in India [33]. However, the monthly variations in temperature in the tropical setting were judged sufficiently comparable with those of non-tropical settings. The result of the meta-analysis including 550,881 births (Figure 3) shows a decrease in risk from the coolest to the warmest months of births, followed by an increase in risk from the warmest to the coolest months of births, with significantly higher risks for the months of December/June to March/September as compared to the month of July/January (for the North/South hemisphere respectively). A significantly increased risk is also observed for the August/February month. If the largest study in Sweden (contributed 88% of pregnancies) [34] is excluded, these patterns remain although statistical significance is lost (Table A10).
Additional analyses on seasonality of birth were conducted by including studies documenting season-to-season variations (and studies with monthly data that can reliably be aggregated into seasonal variations) (Table A11). The meta-analysis (574,433 births) shows that the highest risk for eclampsia is observed for births in the winter, and it is significantly different from the risk in summer (Table A12). The pattern is similar, but statistical significance is lost, if the largest study from Sweden [34] (N = 482,759 births) is excluded (Table A13). Some studies could not be pooled with others: a study in India also reported increased risk of preeclampsia during the coldest months of the year, but did not mention sample size [35]. Preeclampsia cases were reported to be more common during the winter than during other seasons in Pakistan [36] and during the rainy than during the dry season in Nigeria [37], however these studies did not consider any control population of non-eclamptic women to allow for a comparison. Two studies conducted in the tropical settings of Ghana and India [24,38] found higher preeclampsia rates during the rainy than the dry season.
Figure 3.
Pooled relative risks and 95% credible interval for the variation in eclampsia incidence by month of birth (N = 550,881 births).
Six studies focused on the association between eclampsia and temperature but these could not be pooled because of missing sample size information [35], lack of control population [37] or heterogeneous temporal resolutions for temperature indicators. In a study in Pakistan, a significant positive association was observed between eclampsia and average temperature during the month of birth in one hospital, but not in three other hospitals [39]. Two studies in the tropical settings of India and Mozambique found an inverse association between risk of eclampsia and average monthly temperature [35,40]. Another study in India reported a significantly higher preeclampsia rate for birth during the rainy season characterized by slightly cooler temperatures [24]. One study in Iran reported no association between risk of eclampsia and average temperature during the season of delivery [31]. A study in Nigeria found a higher number of eclampsia cases in cooler than in warmer months [37], but no control population was considered for comparison.
Four studies focused on humidity [24,35,39,40] and three on rainfall [24,31,37]. No pooling was possible, for the same reasons as mentioned above for temperature. Two studies in Pakistan and Mozambique found no association between eclampsia and relative humidity during the month of birth [39,40], whereas a study in India reported a positive and significant association [35]. This last finding agrees with another Indian study that associated higher eclampsia risk with higher seasonal relative humidity and higher levels of rainfall [24]. However, a study in Iran identified no association between eclampsia and seasonal rainfall [31]. More eclampsia cases were observed during higher precipitation months in Nigeria [37], but no control population was considered for comparison.
Two studies examined sunlight in non-tropical climates, and findings were mixed. One study in Sweden observed inverse association between eclampsia rates and mean daily sunlight hours during the season of birth [34], whereas one study in Iran found no association [31]. Two studies in tropical settings (Mozambique, India) reported positive associations between eclampsia and low monthly or seasonal average barometric pressure [24,40].
3.1.3. Gestational Hypertension
Only four studies, all conducted in non-tropical settings, examined gestational hypertension (GH) defined as new hypertension (blood pressure ≥ 140 mm Hg systolic and/or ≥90 mm Hg diastolic) arising after 20 weeks of gestation. One study in Australia reported that conception in spring was associated with an increased GH risk. GH was also positively correlated with solar radiation at one month after conception but inversely correlated with it at seven months after conception [16]. A study in Canada found no significant association between GH and occupational exposures to extreme temperatures at the onset of pregnancy [26]. Another study in Sweden found no significant differences in GH risk between seasons, although the highest rates were observed in winter [41]. Last, a study in Kuwait found higher GH risks for deliveries occurring in months of low humidity and high temperature [29]. Two studies documented the variation of blood pressure considered as a continuous variable in pregnant women. A study in the USA found that blood pressure declined steadily from January to August and rose August through December [42]. Consistently, one study in Japan found a 10 °C increase in daily minimum outdoor temperature reduced blood pressure by an average of 2.5 mmHg [43] (see Table 1).
Table 1.
Associations between meteorology and the hypertensive disorders of pregnancy.
3.2. Findings from Length of Gestation Including Preterm Birth
We identified 28 studies that examined different pregnancy outcomes related to length of gestation (Table 2): mean gestational length (n = 7), preterm birth (n = 19), the onset of labor (n = 5) and premature rupture of membranes (n = 3). A large study conducted in the USA (N = 1,435,213 births) found lower mean gestational length for conceptions during the first months of the year, with a sharp minimum for May conceptions [50]. Although the outcomes differ, this is compatible with another USA study showing the highest preterm birth rates for infants conceived in March and May [51]. Besides, when the three available studies focusing on conception season and preterm birth are pooled (562,852 births) (Table A14), the highest pooled relative risk, although not statistically significant, is observed for conception in spring (Table A15).
Four studies examined mean gestational length in relation with the time of birth. No pooling was feasible between these four studies, because of the important differences in the definition of seasons between one study [52] and the others [53,54,55] and the lack of sample size information in another study [55]. One study in Japan reported that infants born during the winter and summer seasons had shorter gestational lengths [53] than those born in spring or autumn. A Danish study reported gestational ages of winter-born infants were on average one day shorter than that of infants born in other months [55]. A Greece study reported that births in spring or summer had gestational ages about 4 days shorter than those in autumn or winter [54]. Lastly, in Zimbabwe infants born in the early dry season had gestational ages two to three weeks shorter than those born in the late rainy season [52].
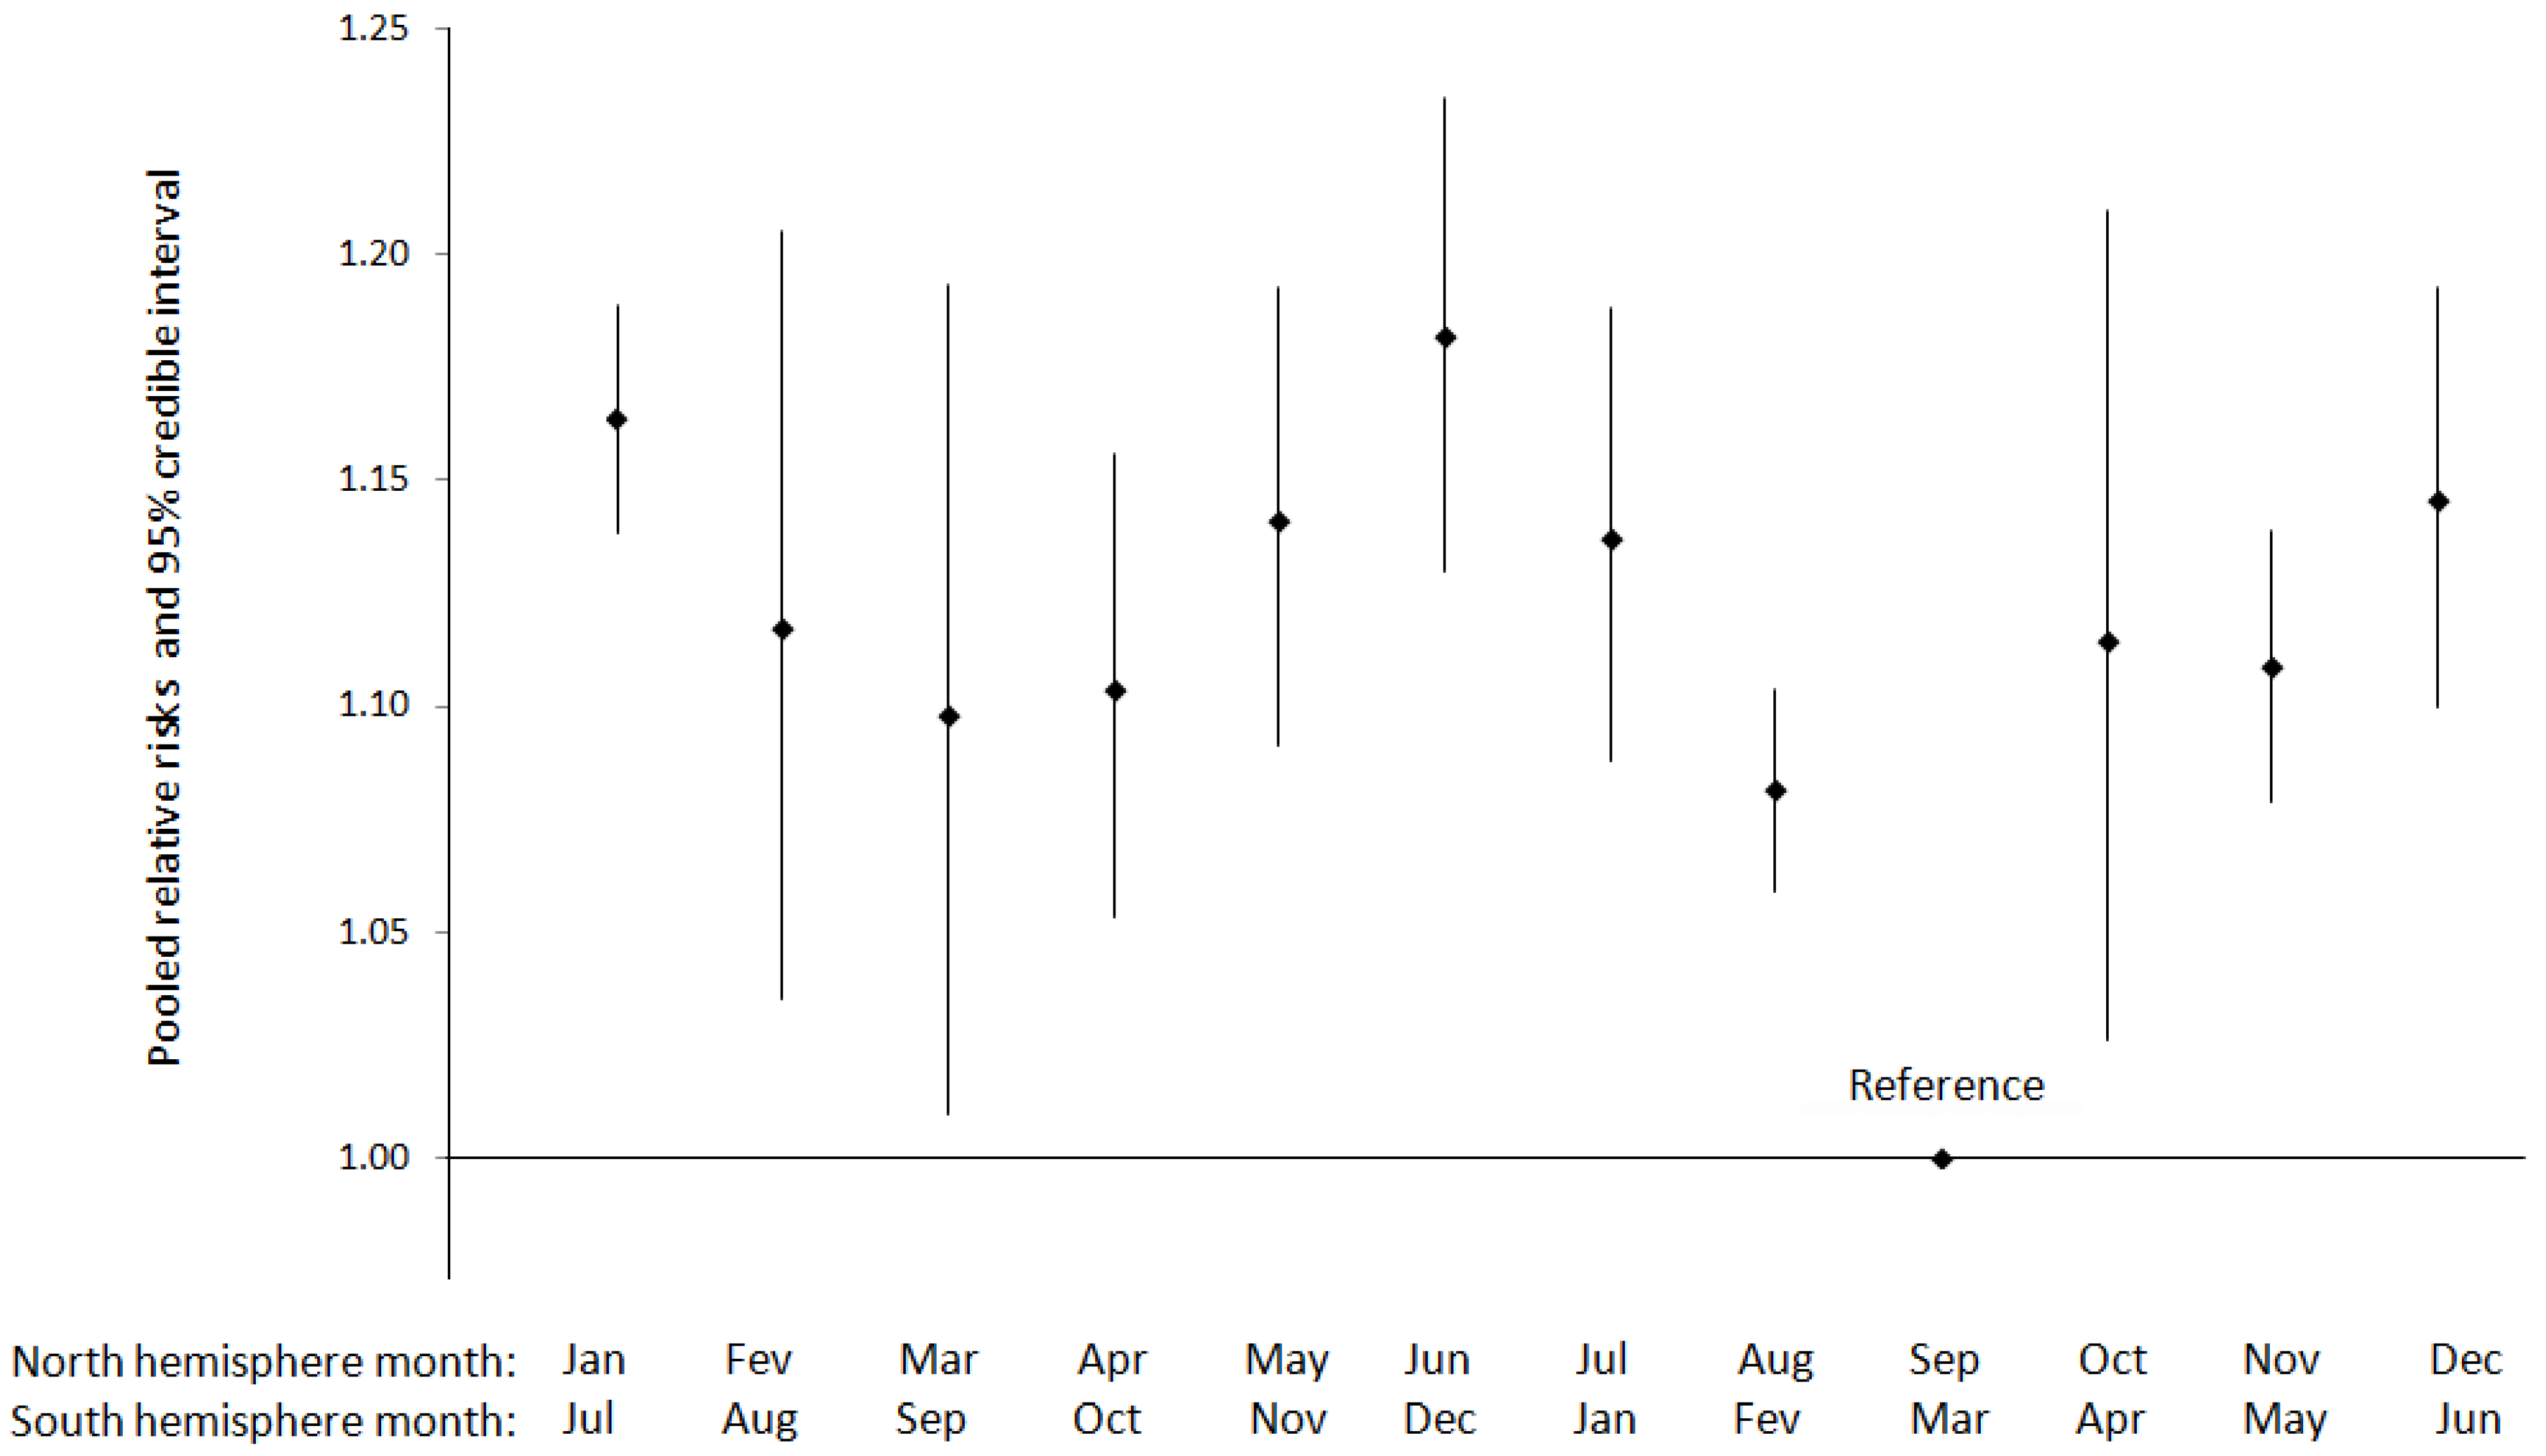
Six studies focused on the variations of preterm birth risk by month of birth. Five of them, all conducted in the North hemisphere, met the criteria for a meta-analysis and contributed 63,227,292 births (Table A16). The pooled relative risks show two peaks of preterm births during the winter months (maximum in January) and the beginning of summer (maximum in June) (Figure 4). Even if the largest study conducted in the USA (82% of births in this meta-analysis) [56] is removed these two peaks are still observed (Table A17).
For meta-analysis by four seasons of birth with a total of 11,703,114 births (Table A18), no significant difference is observed between seasons, although the lowest relative risks are observed for births in spring and autumn (Table A19).
Some studies were not eligible in the above meta-analyses. In Canada, an increased risk of preterm birth was observed during an ice storm season [57]. One study in the Gambia identified two peaks of preterm birth incidence in July and October, and an increased risk of preterm birth in the rainy season as compared to the dry season [58]. In Zimbabwe, infants born in the early dry season were significantly more likely to be preterm than those born in the late rainy season [52], whereas in Indonesia no difference in preterm birth risk was found between the dry and the rainy season [32].
Figure 4.
Pooled relative risks and 95% credible interval for the variation in preterm birth incidence by month of birth (N = 63,227,292 births).
Three studies focused on the associations between temperature and mean gestational length. Pooling them was not possible because of differences in the definitions and temporal resolution of temperature indicators. One large study in Greece (516,874 births) found that average temperature during the month of birth was inversely associated with mean gestational age [54]. A recent study of 7,585 births in Spain reported an inverse association between daily heat-humidity index and mean gestational age, with effects lagged by up to five days [59]. However a study of 11,972 births in the USA during a period of heat wave (June–August 1995) detected no association between daily temperature and mean gestational length [60], after examining effects lagged by up to three days.
Nine studies focused on the associations between temperature and preterm births [61,62,63,64,65,66,67,68,69]. No meta-analysis was feasible because of differences in the definitions and temporal resolution of temperature indicators. Six of them reported positive associations between increases in temperature and the risk of preterm birth. A large study in Japan (7,675,006 births) reported that rates of preterm births and monthly average temperature were inversely correlated (R = −0.424, p = 0.003) in the winter, but positively correlated in the summer (R = 0.549, p < 0.001) [61]. A study of 11,979 births in Israel found that preterm birth rates increased as monthly average maximum temperature increased [64]. In these two studies, temperatures were averaged based on all the days of the month of birth whether these days preceded or were subsequent to births. The influence of temperature during the exact four weeks preceding birth was examined in an Australian study of 101,870 births, which reported a positive association with preterm birth between 28 and 36 gestational weeks. A small USA study (3,972 births) reported no significant association between a heat-humidity index averaged on the week of birth and preterm birth, but a positive association between the heat-humidity index and preterm labor [67].
Other studies focused more precisely on the potential influence of temperature in the week and the few days preceding birth. One study of 291,517 births in Germany reported no association between preterm birth and temperature in the last week preceding delivery [66] or during the first month or trimester of pregnancy. An even larger study of 482,765 births in England reported no association between the risk of preterm birth and temperature in the day of, or 6 days preceding birth [65]. However, temperatures were mild in these two settings [66,70] which did not allow exploring the effects of extreme temperatures. In California (USA) that experiences hotter temperatures, a study found a positive association between apparent temperature and preterm births, with effects lagged by up to six days [63]. A study of 132,691 births in Italy reported a positive association between apparent temperature during the warm season and increased risk of preterm birth [69]. One study of 154,785 births in Australia examined the association between preterm birth and heat waves [68]. Risks for of preterm births increased by 13% to 100% depending on the heat wave definition (see Table 2). Last, a small study of 1,088 births in the USA failed to identify temperature as a significant predictor of onset of labor in term or preterm infants [71]. In summary, eight out of twelve studies reported a positive association between temperature and preterm birth or mean gestational length.
Five studies examined barometric pressure [65,71,72,73,74]. One large study conducted in England (482,765 births) [65] reported no association of preterm birth with daily mean barometric pressure, or with the largest daily drop in barometric pressure.
Three studies focused on labor onset [72,73,74], but could not be pooled because of the heterogeneity in the definition of categorical variables for barometric pressure. A small USA study (162 births) reported a significantly higher occurrence of labor onset in the day following, than preceding a drop in barometric pressure (defined as ≥0.06 inches of mercury in 24 h) [74]. Another USA study of 2,435 births reported no significant difference in the frequency of labor onset between days in the lower tertile of daily mean barometric pressure versus the two other (higher) tertiles, although a significant decrease in the frequency of labor onset was observed after 3 consecutive hours of falling barometric pressure [73]. A study of 2,278 births in Japan reported no differences in the frequency of labor onset, whether barometric pressure was above or below a threshold of 1,011 hPa, however an increase in the frequency of rupture of the membranes was associated with barometric pressure below that threshold [72]. A small USA study (1,088 births) jointly studied labor onset and rupture of membranes as a single outcome and reported no significant association with hourly barometric pressure [71].
Fewer results were available for other meteorological parameters. Studies conducted in England [65] and the USA [71] reported no association between preterm birth and humidity. However a study in Israel found preterm birth risk to be positively associated with sharp increases in relative humidity and with strong winds (wind speed > 6 m/s) [64] (see Table 2).
Table 2.
Associations between meteorology and the length of gestation, including preterm birth.
3.3. Findings from Birth Weight
We identified 27 studies that examined different forms of birth weight as outcomes (Table 3): mean birth weight as a continuous variable (in term births (n = 7) or in all births (n = 14)), low birth weight (LBW < 2,500 g) (in term births (n = 2) or in all births (n = 6)), and small for gestational age (SGA, n = 4).
Four studies focused on seasonality of conception and all were conducted in non-tropical settings, but could not be pooled since they covered different outcomes. A study of 3,333 births in Turkey associated conception in summer and autumn with lower mean birth weights in term born infants [78]. A study of 291,517 births in Germany reported an increased risk of term LBW for conceptions in spring [66]. A study of 188,276 births in the USA associated conception in winter and spring with an increased risk of SGA or LBW [75]. Another USA study of 1,435,213 births associated conceptions in summer months with higher mean birth weights (whether gestational age was adjusted for or not), and conception in spring was also associated with a slight trough in mean birth weight [50].
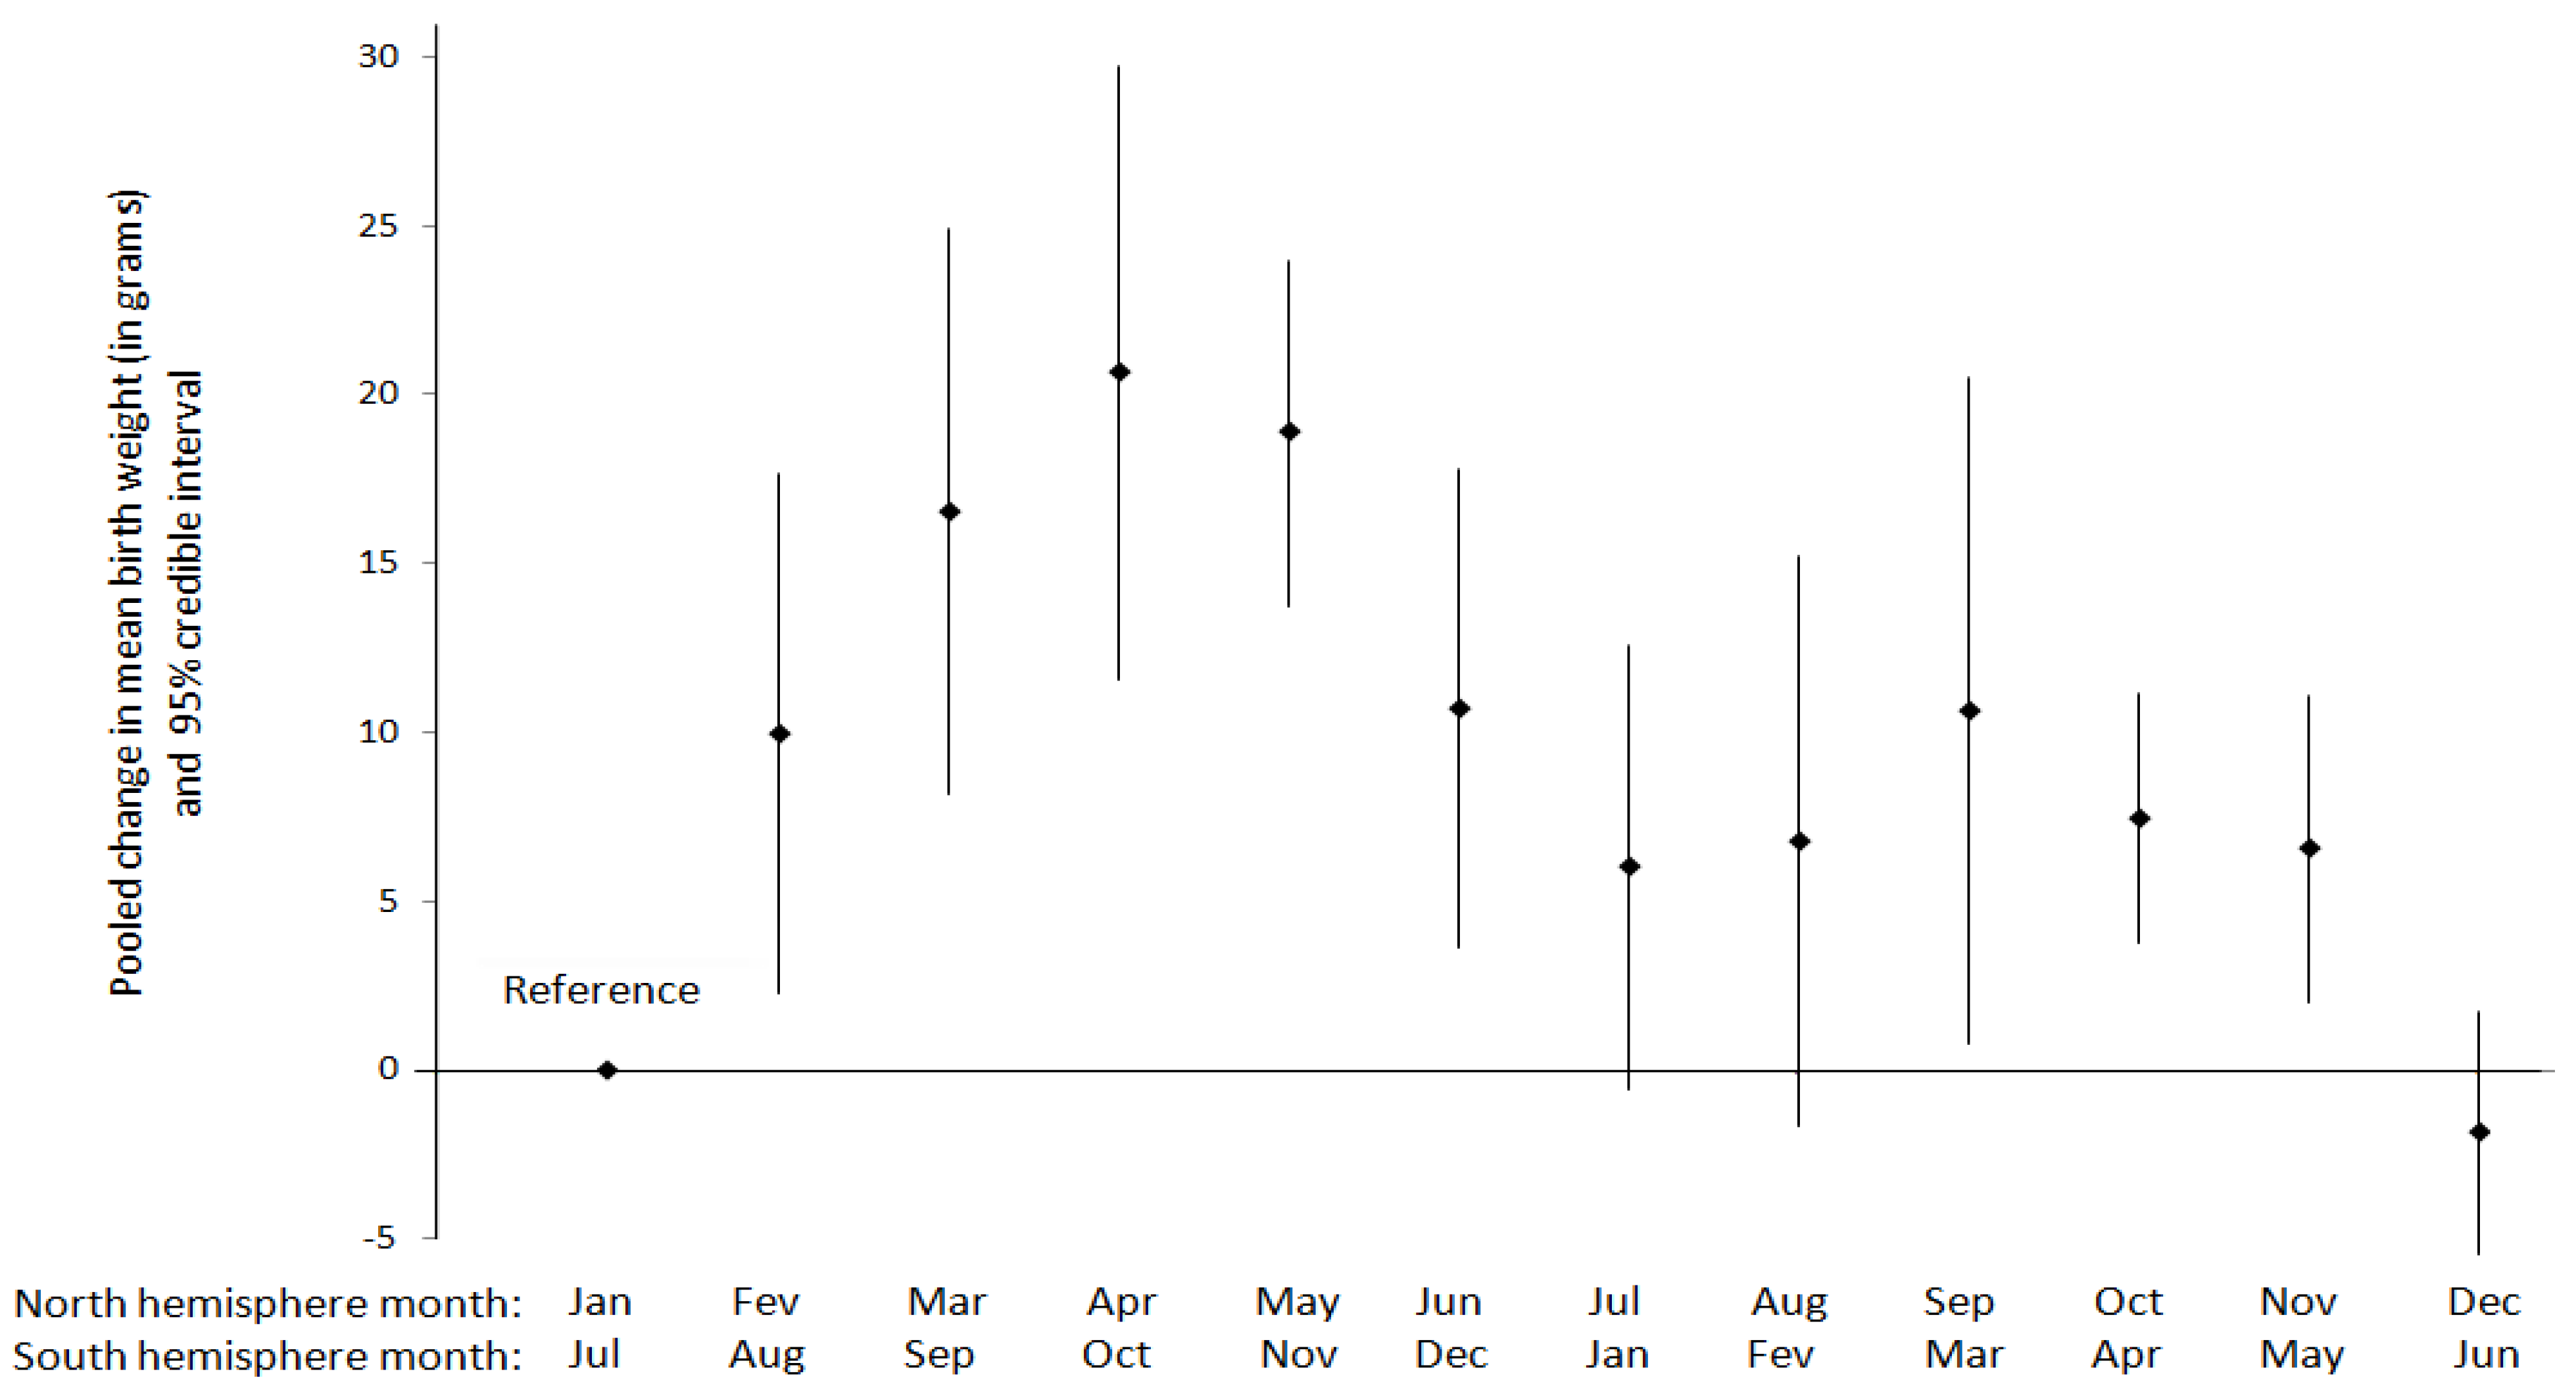
Thirteen studies examined mean birth weight and the time of birth (Table A20). Three focused on month-to-month variations in term born infants [79,80,81] and six on term and preterm births combined (Table A20) [53,56,82,83,84,85]. Meta-analyses were conducted separately for these two outcomes and included 5,398,360 and 70,652,872 births, respectively. The temporal patterns observed for each of these outcomes appear similar Figure 5, Figure 6: the lowest birth weights are observed during the coolest months of birth (December/June and January/July for the North/South hemisphere respectively), rise in the spring, slightly drop during the summer with a trough in July, and rise again in autumn.
Four articles analyzed the variations in mean birth weight only by season of birth. No meta-analysis was conducted because of insufficient papers for specific outcomes. In the Mediterranean setting of Greece a study of 516,874 births found mean birth weights to be lower during spring and summer than during other seasons [54]. Other studies reported mixed findings but all together included a lower number of 49,399 births [86,87].
Three studies focused on infants born SGA by season of birth. In a non tropical setting in Australia, a study of 147,357 births reported no difference in the odds of SGA between seasons [88]. Two tropical studies, in Indonesia [32] and the Gambia [58] found higher risks of SGA for infants born during the rainy season compared to the dry season.
Three studies examined term LBW by season of birth. In Germany, term LBW was associated with birth in winter [66]. Two tropical studies in Indonesia [32] and Tanzania [89] associated term LBW with birth in the rainy season.
Four studies focused on LBW (in term and preterm infants combined) by season of birth. In the entire USA, LBW risk was highest in the winter, and second highest in the summer [56]. In Greece, the highest LBW risk was observed in the summer [54] whereas in Israel no association was observed [83]. One study conducted in a tropical setting in Australia reported a significantly higher LBW risk for infants born during the wet than during the dry season [85].
Figure 5.
Pooled change in mean birth weight (and 95% credible interval) by month of birth in term born infants (N = 5,398,360 births).
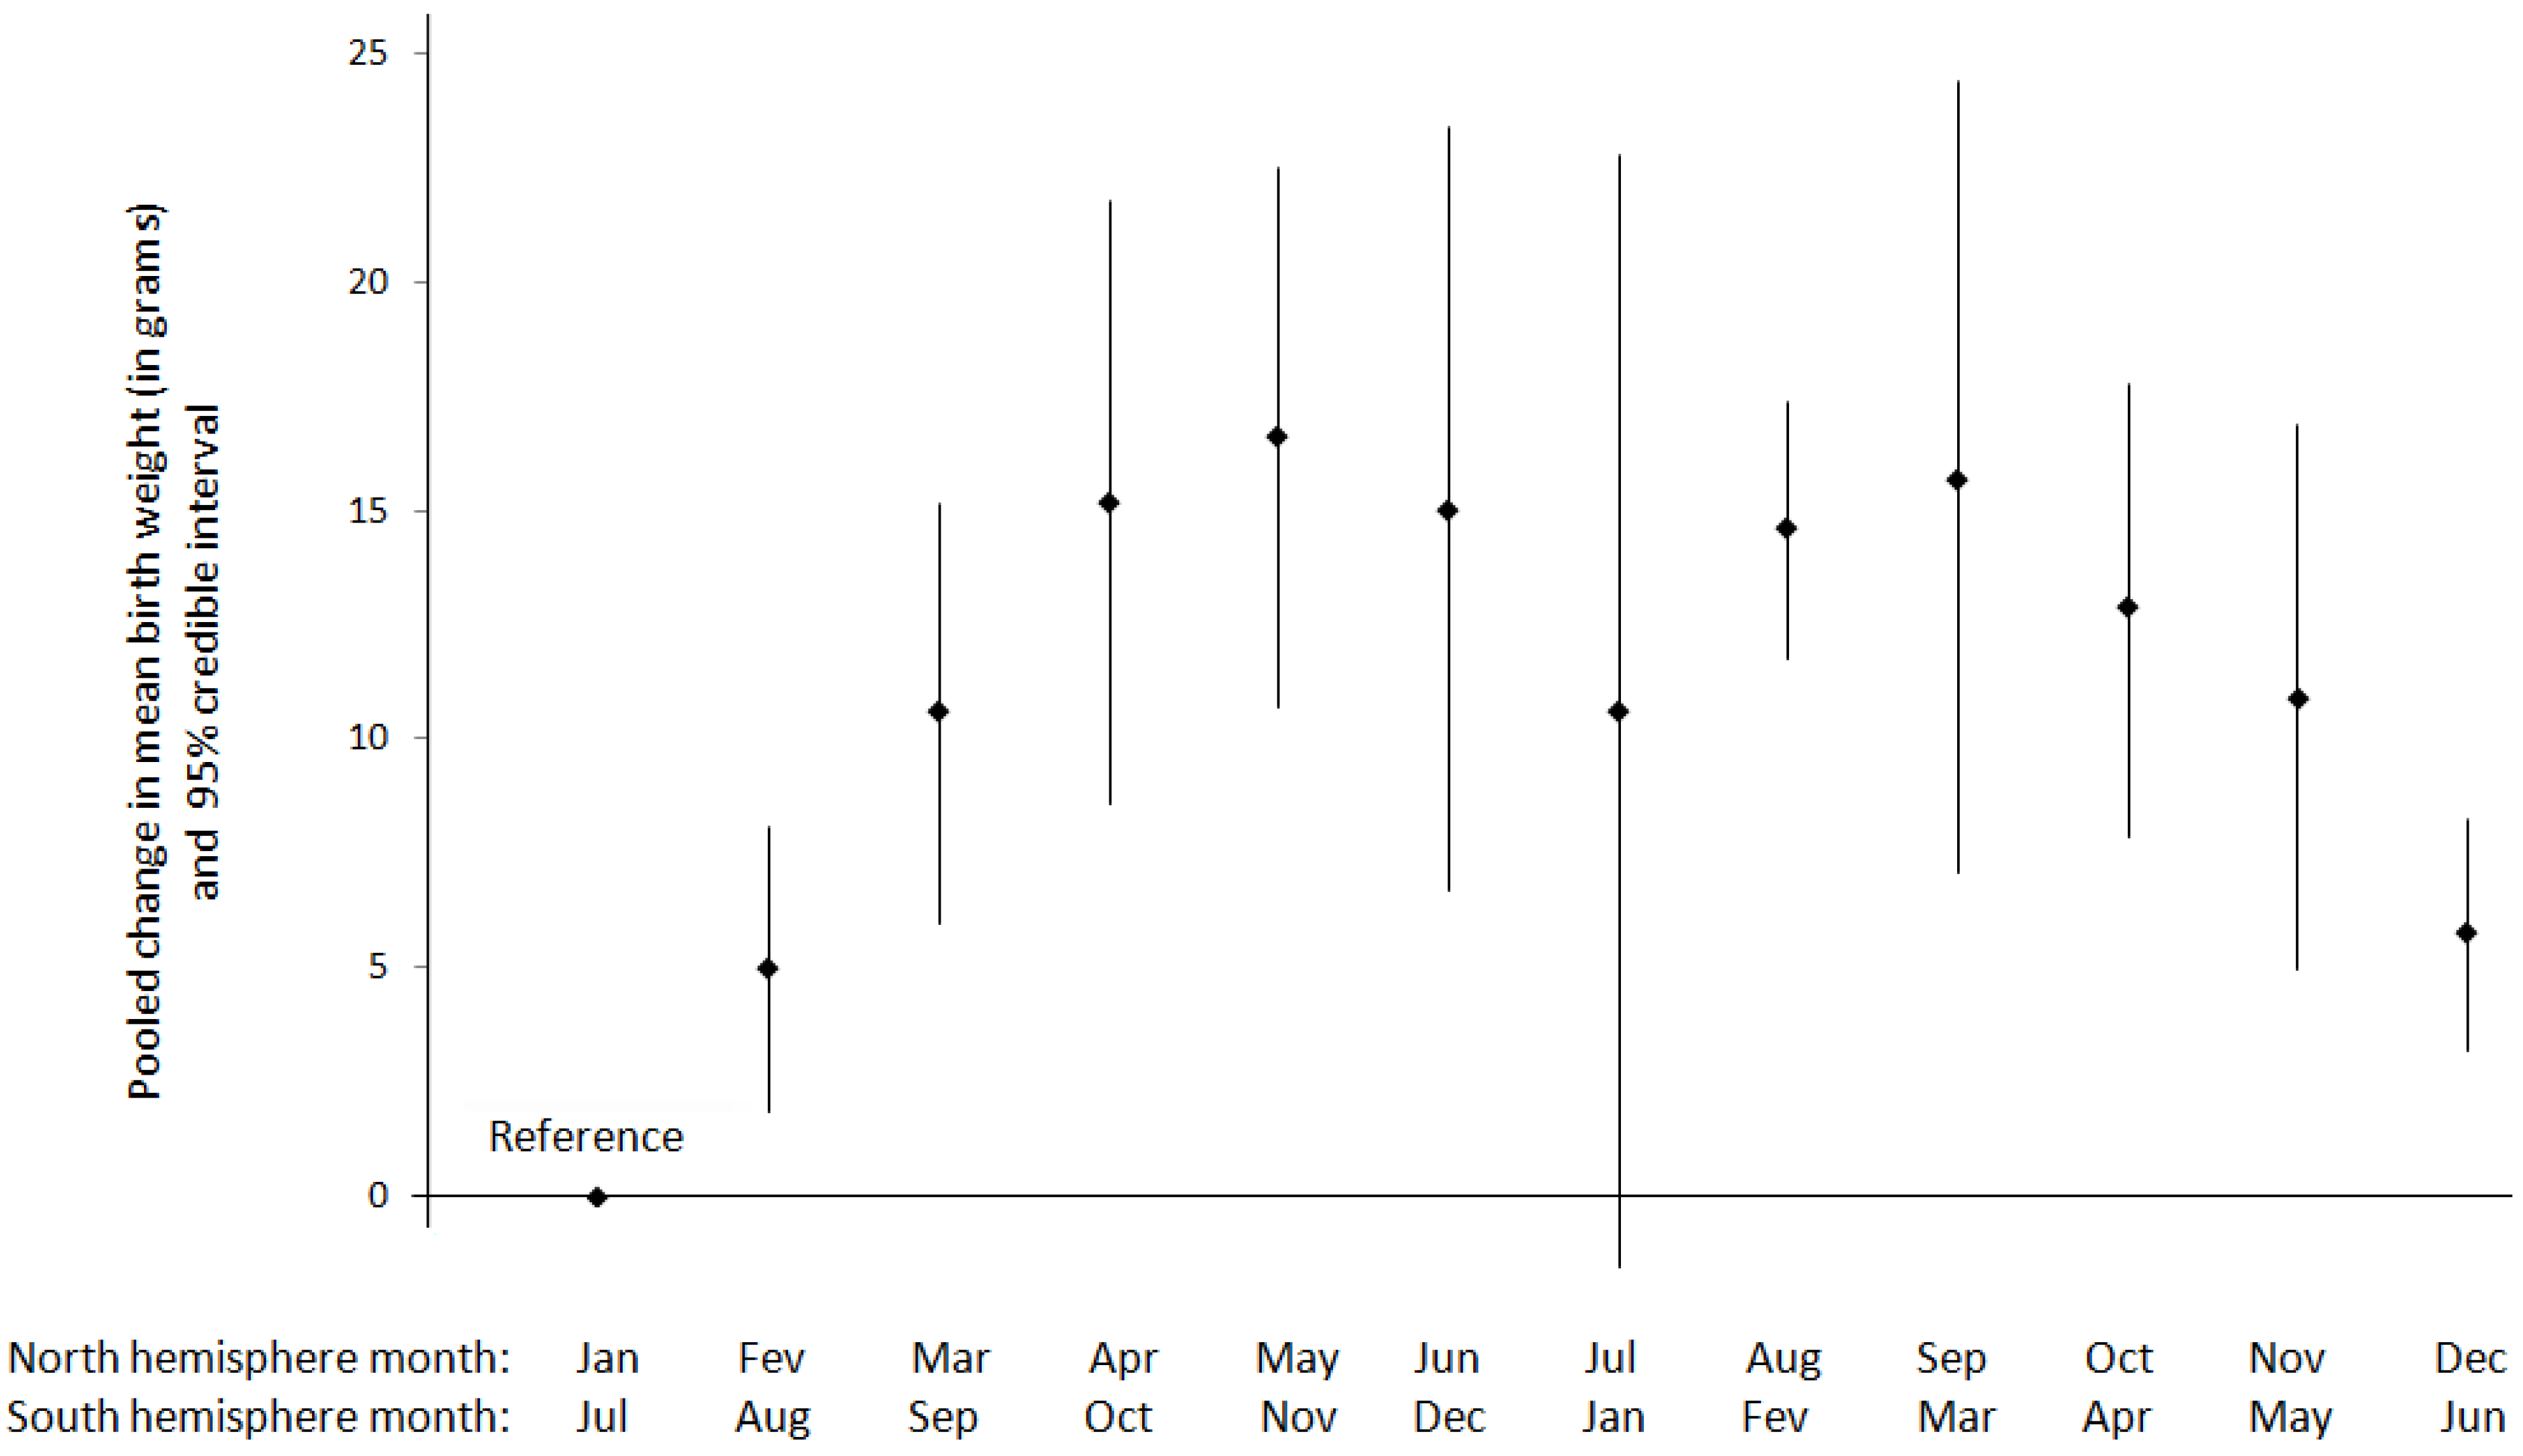
Figure 6.
Pooled change in mean birth weight (and 95% credible interval) by month of birth in all infants (N = 70,652,872 births).
The effects of temperature on birth weight were assessed in thirteen studies, with different questions explored by several approaches: some studies focused on the association between birth weight and the climate (or “temperature regime” [90]) prevailing in different locations, that was typically reflected by mean annual temperature [90,91,92]. These analyses were based on geographical contrasts in annual mean birth weights between locations of different climates. Other studies focused on temporal contrasts in exposure in fixed settings, with a focus either on the temporal contrasts in temperature typically experienced between different trimesters of pregnancy [80], or on the occurrence of extreme climatic events [92,93].
A pooled analysis of 140 populations from countries spanning all continents examined the relationship between mean birth weight and climates using a heat stress index defined as a combination of daily maximum temperature and afternoon humidity, subsequently averaged by year [91]. This analysis reported an inverse association between heat stress and mean birth weight, after controlling for covariates (altitude, latitude, mortality index, energy intake, gross domestic product and maternal height). This work was recently extended [90]; it was estimated that under projected climate change, mean birth weight will decrease by 0.44%–1.05% per °C increase in temperature. A similar analysis was conducted in the USA and reported an inverse association between annual average temperature of and mean birth weight at the county resolution [92].
Three studies examined the average temperature exposure by pregnancy trimester and mean birth weight in term born infants, but they could not be pooled since one of them used a dichotomous indicator for temperature [94]. A study of 418,817 births in Ireland reported a 3.5 g increase in mean birth weight in females and 1 g in males per 1 °C increase in the mean daily maximum temperature during the second trimester only [80]. A smaller study in Turkey (3,333 births) reported an association of similar magnitude, also for the second trimester [78]. However, a study of 8,516 births in New Zealand reported no effect of temperature “peaks” and “troughs” during any trimester on birth weight [94].
Three other studies assessed similar associations but did not exclude preterm births. Again, no meta-analysis was conducted because of differences in temporal resolutions of temperature indicators. A study of 516,874 births in Greece reported an inverse association between mean birth weight and the mean temperature during the month of birth [54]. Another study of 225,545 births in Israel found positive associations between birth weights and mean daily maximum temperature in the first pregnancy trimester [83]. On the contrary, a study of 12,150 births in Scotland reported inverse associations between birth weight and mean ambient temperature in the mid 10-day period of the first trimester and no association for the second trimester. However a positive association was observed for the third trimester [82].
Three studies focused on the associations between temperature and categorical birth weight indicators. In Australia, an increase in average temperature during the entire pregnancy was associated with increased odds of SGA [88]. In Germany, no association was observed between term LBW (<2,500 g) and temperature in any trimesters of pregnancy [66]. However in Sweden, very low birth weight (<1,500 g) was associated with colder than expected temperatures during summer months [95].
Two studies specifically examined the impact of extreme temperature episodes on mean birth weight. An analysis in the entire USA showed that the higher the number of days with temperature exceeding >85 °F within each pregnancy trimester, the lower the mean birth weight [93]. The number of days with temperature < 25° F during the first trimester was also associated with a decrement in mean birth weight, suggesting a possible inverse U-shaped relationship. A subsequent analysis that explored even more extreme events (days <20 °F and >90 °F) confirmed such relationships [92].
In the five studies examining sunlight hours or daylight hours (Table 3), findings were mixed across non-tropical settings. Studies in Ireland [80] and Turkey found no association between term birth weight and sunlight for any trimester of pregnancy [78]. Another study in Australia [88] found no association between sunlight and SGA. However, two New Zealand studies found that mean birth weight was positively associated with mean sunlight hours during the first trimester of pregnancy and inversely associated with sunlight hours during the second and third trimesters [94,96]. No study reported any association between rainfall (mm) during pregnancy and birth weight [78,80,83].
Table 3.
Associations between meteorology and birth weight.
4. Discussion
The results of this systematic literature review show that preeclampsia, eclampsia, gestational length and birth weight are seasonally patterned. The risks of preeclampsia appear higher for women with conception during the hottest months, and delivery in the coldest months of the year. Delivery in the coldest months is also associated with a higher eclampsia risk. However, direct evidence of the effects of temperature on preeclampsia and eclampsia is still insufficient. Patterns of decreased gestational lengths have been observed for births in winter, as well as summer months. Several recent studies also report decreases in gestational lengths associated with high temperature during the month of, or the few days preceding, delivery. Birth weights (either in all or in term born infants) are lower for deliveries occurring in winter and in summer. Only a few studies investigated the relationships between birth weight and temperature or sunshine exposure, which does not allow drawing conclusions on these relationships.
We identified several seasonal patterns of pregnancy outcomes after synthesizing available evidence via a meta-analysis approach. Overall, more studies documented variations in the risk of pregnancy outcomes related to the time of birth than the time of conception. The absence of individual information on gestational length in available papers precludes any rigorous comparison of results from studies based on the season of conception and the season of birth. We therefore examined these two exposure times separately. Most studies, and importantly, the biggest studies that carry more weight in the meta-analysis, have been conducted in non-tropical countries. We acknowledge that the patterns described above are mostly representative of non-tropical countries.
The patterns of higher preeclampsia risks for women with conception during the hottest months, and delivery in the coldest months might be explained by some direct effects of exposure to heat during the first trimester of pregnancy, and to cold temperatures at the end of pregnancy, both of which are biologically plausible [18,21]. However, available studies on the associations between measured temperature and preeclampsia do not provide sufficient evidence to draw conclusions on these relationships and further studies would be needed to explore them further.
The bimodal seasonal patterns observed for lower lengths of gestation and birth weights in winter and summer also call for explanations. Some researchers pointed at different seasonal patterns of time of conception correlated with sociodemographic profiles (e.g., age, education level, race/ethnicity, marital status) [56,97]. It was hypothesized that these differences in seasonal patterns of time of conception across socio-demographic groups might explain seasonal patterns in adverse pregnancy outcomes, since mothers with different sociodemographic characteristics experience contrasted risks of adverse pregnancy outcomes [97]. This hypothesis was recently examined in the USA by a sibling study that controlled for maternal characteristics by design [50]. This study concluded that seasonality of conception due to sociodemographic profiles might contribute no more than 22% of variation in gestational length by season.
Some large studies suggest potential influences of temperature extremes on the observed seasonal patterns in gestational length and birth weight [61,92,93]. In Japan, peaks of preterm births were identified both in winter and summer, but the winter peak was most prominent in the North of Japan (that experiences a cooler climate), whereas the summer peak was most prominent in the South of Japan (that experiences a hotter climate) [61]. The observation of short-term associations (lag time of a few days) between heat and reduced length of gestation [59,63,68,69] also provide convincing evidence, especially since associations on such short temporal scales cannot be explained by socioeconomically differentiated seasonal patterns in the time of conception [97]. Last, a large study in the USA reported reductions in birth weight associated with the number of extremely hot or cold days during the month or the season of birth [92]. If such associations were causal and reflected the effects of extreme temperatures on birth weight, temperature might contribute to explain the bimodal seasonal pattern we observed for birth weight (i.e., a trough during the summer and winter).
These observations justify exploring further the association between specific meteorological parameters and pregnancy outcomes. However, meta-analysis could not be applied to summarize available evidence on these relations (with the exception of preeclampsia and mean temperature during the month of birth for which a pooled correlation coefficient could be estimated) because the definitions of exposure metrics for meteorological parameters varied substantially between studies, even when a single pregnancy outcome was considered. These exposure metrics differed in nature (e.g., heat waves with different definitions [68], maximum or minimum daily temperature as a continuous variable [69], indices combining temperature and humidity [59]). Some composite indicators were calculated out of the same variables (e.g., temperature and humidity) but using different formulae (apparent temperature [69], heat-humidity indices [67]). Indicators used to study the same outcome were frequently of different temporal resolutions (pregnancy trimester, month/week of birth, month, or a few days preceding birth). In addition, some authors conducted analyses using categorized exposure metrics defined according to different thresholds for meteorological parameters [94].
The diversity of the natures, temporal resolutions and categorizations used to defined exposure to meteorological variables have advantages in representing a wealth of hypotheses (e.g., related to the respective effects of acclimation, of exposures averaged on specific periods of fetal development and of sudden changes toward temperature extremes). However, these differences also hamper conducting a rigorous meta-analysis to synthesize such diverse information. Even if more studies were available, important differences between definitions of meteorological variables and other methodological aspects would likely persist, unless a more coordinated research strategy is defined. Multi-centric studies using harmonized methodologies, (as was done recently for air pollution and pregnancy outcomes [98]) would better help address current research needs. Since routine (i.e., daily, hourly) meteorological parameters are collected throughout the world, such coordination appears technically feasible. Centralizing such meteorological data from different regions (along with the corresponding data for pregnancy outcomes) would then allow for a posteriori calculations of specific (either previously used or new) exposure metrics across regions and exploring hypotheses within a consistent and powerful framework. Especially, the exploration of non linear relationships between temperature and pregnancy outcomes could more effectively be explored via such a pooled analysis than via a meta-analysis (relying either on a single parameter from regression models assuming linear dose-response relationships, or on categorized indicators based on various cut-points defined by uncoordinated investigators).
Beside the above sources of heterogeneity, most published studies share a number of methodological limitations. Only a few of them explored the influence of some established or potential risk factors for pregnancy outcomes that follow seasonal patterns and/or are correlated with meteorological conditions [99]. Such factors might act as confounders in the observed associations between meteorological variables and pregnancy outcomes. Among them stands ambient air pollution which is strongly influenced by meteorology. Only six studies included in our review adjusted for air pollution, though no evidence for confounding was reported in any of these studies. Several studies reported positive associations between temperature and preterm births [62,63,68,69] or birth weight [88] even after adjusting for air pollutants, whereas another study on preterm birth reported no association [65].
Infection is an established risk factor for preeclampsia [100], preterm birth and low birth weight [101], although the full array of infectious agents leading to these outcomes is probably not known. Malaria may induce preterm delivery and low birth weight [101] and influenza has been suspected to cause preterm birth [50]. Many infections follow seasonal patterns and are influenced by meteorological factors including malaria, influenza [8] and genital tract infections [14,70]. For instance, a high humidity may increase micro-organisms proliferation, thus increasing the odds of infection. Rainfall, a direct cause of humidity, contributes to the spread of several infectious diseases [8]. Infections might therefore either mediate or confound the association between seasonality and/or meteorological conditions and pregnancy outcomes [50,69]. However, only a few studies accounted for maternal infection in this review, either by statistical adjustment or via applying exclusion criteria [50,52,58,59,69,71,102].
Maternal nutrition is another factor potentially correlated with seasonality and/or meteorology and pregnancy outcomes. Nutritional status encompasses a range of factors that vary seasonally, including availability of vegetables and fruits [82] and dietary intake [31]. Such factors may exert a direct effect on birth weight. Only a few studies measured maternal nutrition [32,89,90] and only one adjusted for it [90].
Ecological estimates were used to estimate exposure to meteorological factors in all studies. No study utilized individual modeling of exposure, and none considered the influence of time-activity patterns, heating, air conditioning and ventilation that may mitigate exposure of pregnant women to meteorological conditions.
Only a few studies employed statistical approaches dealing with temporal or spatial autocorrelation in data (e.g., [61,65,92]. Autocorrelation, if not accounted for, may notably result in erroneous variance estimates, and subsequent conclusions on the statistical significance of associations. Since both meteorological factors and pregnancy outcomes tend to be auto-correlated in space and time, the use of statistical approaches addressing these properties should be recommended for future studies.
Only one third of studies on birth weight or low birth weight focused on term born infants, and four on small for gestational age [32,58,75,88]. Only such studies taking the length of gestation into account (either by selecting term births only, or by using definitions of small for gestational age) allow examining the possible influence of meteorology on IUGR. Birth weight studies without consideration for gestational age do not allow disentangling whether any association between birth weight and meteorological factors is mediated by the influence of meteorology on IUGR and/or on gestational length. Clearly, more studies on term birth weight and small for gestational age are needed to address these issues.
An additional difficulty associated with research on meteorological factors is that different meteorological parameters tend to be correlated with each other: for instance, high barometric pressure (anticyclonic conditions) is associated with sunshine exposure, dry weather, high temperatures and low wind speeds. This may make the respective influence of each of these factors difficult to disentangle in individualized study settings. Yet, the diversity of climatic types on Earth offers a wide variety of combinations of meteorological factors. International multi-centric studies using harmonized methodologies would thus show improved potential to address these issues.
Several mechanisms have been proposed for the potential direct impact of meteorology on pregnancy outcomes. The hypertensive disorders of pregnancy such as preeclampsia have been hypothesized to be influenced by physiological responses to cold including vasospasm and ischemia [21]. Increases in blood pressure have been associated with cold temperatures in pregnant women [43]. Humidity might intensify cold-induced adrenergic discharges from cutaneous receptors [29]. Temperature and humidity effects on placental vascular development and spiral artery remodeling are also suspected [18]. Preeclampsia might also be related to seasonal variations of fluid balance, plasma volume, and osmolality [24], as well as sunlight effect possibly mediated by vitamin D levels [16,34].
Effects of heat stress on reduced length of gestation have been hypothesized [64,67], via heat-shock protein production [59], and dehydration, which could decrease uterine blood flow and increase pituitary secretion of antidiuretic hormone and oxytocin to induce labor [63]. Additional hypothesized pathways include temperature effect on blood viscosity and cholesterol levels [63] and a seasonal effect on maternal weight loss [58]. Barometric pressure might affect fetal hormone production, triggering preterm labor and preterm birth [72]. Last, experimental studies have shown that artificial changes in the light-dark cycle may induce onset of labor in rats [76]. For IUGR, proposed hypotheses include temperature effects on uteroplacental blood flow [80,84], changes in maternal energy expenditure [84,91] and sunlight effects on prenatal growth hormone production such as Vitamin D [94].
5. Conclusions and Recommendations
In conclusion, available research shows that the risks of preeclampsia appear higher for women with conception during the hottest months, and delivery in the coldest months of the year. Delivery in the coldest months is also associated with a higher eclampsia risk. However, direct evidence of the effects of temperature on preeclampsia and eclampsia is still insufficient. Patterns of decreased gestational lengths have been observed for births in winter, as well as summer months. Several recent studies also report decreases in gestational lengths associated with high temperature during the month of, or the few days preceding, delivery. Birth weights (either in all or in term born infants) are lower for deliveries occurring in winter and in summer. Only a few studies investigated the impact of temperature and sunshine exposure on birth weight, which does not allow drawing conclusions on these relationships.
Further etiological research is necessary to improve our understanding of the relationshipsbetween seasonality, specific meteorological parameters and adverse pregnancy outcomes. A few recommendations can be proposed to maximize the potential of future studies in the field:
- Further research should be preferentially conducted within the framework of international multicentric studies using harmonized methodologies. They would offer enhanced opportunities to disentangle the potential influence of different meteorological factors, thanks to the various combinations of these factors represented across Earth’s climates.
- Investigating non-linear relationships between meteorological parameters and pregnancy outcomes appears important.
- Future studies need to measure, and if necessary adjust for, risk factors that exhibit seasonal variability and may be correlated with meteorological factors such as nutritional patterns, air pollution and infections. Since nutritional pattern and maternal infections are seldom documented while meteorological stations are ubiquitous, research on the effects of meteorological conditions on pregnancy outcome might be most cost efficient if conducted within preexisting cohorts of nutrition and/or infections and pregnancy outcomes.
- They should ideally focus on individual indicators for exposure to meteorological conditions and cofactors, which would take into account time-activity patterns of pregnant women, and the mitigating effects of time spent indoors and associated heating, air conditioning and ventilation, on exposure.
- Future studies on birth weight should take into account the length of gestation as part of their study design, in order to disentangle the possible effects of meteorology on intrauterine growth restriction and/or the length of gestation.
- Lastly, fine temporal exposure windows over the entire gestational period are needed to identify critical windows of vulnerability to meteorological stressors.
Although such research efforts appear considerable, they would be worthwhile given the major impacts and high frequency of adverse pregnancy outcomes, and the seasonal patterns and suggested associations with meteorological parameters we identified in this review. Improved understanding would help proposing adequate recommendations for the prevention of adverse pregnancy outcomes, in face of the global threat of climate change.
Acknowledgments
The study was supported by the Health Effect Institute (HEI 4787-RFA09-4110-3 WU). We are grateful to Loraine Escobedo (University of Southern California), Florencia Torche (New York University), Patrizia Schifano (Lazio Regional Health Service), Ira M. Bernstein (University of Vermont College of Medicine), Hamideh Mohaddesi (Urmia University), Jennyfer Wolf (London School of Hygiene and Tropical Medicine) and Sławomir Kozieł (Polish Academy of Sciences) for their help in accessing some included material and providing additional information, as well as all authors of included studies who agreed to provide their manuscripts.
Conflicts of Interest
The authors declare no conflict of interest.
References
- Kramer, M.S. The epidemiology of adverse pregnancy outcomes: An overview. J. Nutr. 2003, 133, 1592S–1596S. [Google Scholar]
- World Health Organization. WHO Recommendations for Prevention and Treatment of Pre-Eclampsia and Eclampsia; WHO: Geneva, Switzerland, 2011. [Google Scholar]
- Steegers, E.A.; von Dadelszen, P.; Duvekot, J.J.; Pijnenborg, R. Pre-eclampsia. Lancet 2010, 376, 631–644. [Google Scholar] [CrossRef]
- World Health Organization. M.o.D., PMNCH, and Save the Children, Born Too Soon: The Global Action Report on Preterm Birth; Howson, C.P., Kinney, M.V., Lawn, J.E., Eds.; WHO: Geneva, Switzerland, 2012. [Google Scholar]
- Barker, D. Fetal and Infant Origins of Adult Disease; BMJ Books: London, UK, 1992. [Google Scholar]
- Blencowe, H.; Cousens, S.; Oestergaard, M.Z.; Chou, D.; Moller, A.B.; Narwal, R.; Adler, A.; Vera Garcia, C.; Rohde, S.; Say, L.; et al. National, regional, and worldwide estimates of preterm birth rates in the year 2010 with time trends since 1990 for selected countries: A systematic analysis and implications. Lancet 2012, 379, 2162–2172. [Google Scholar] [CrossRef]
- World Health Organization and World Meteorological Organization. Atlas of Health and Climate; WHO Press: Geneva, Switzerland, 2012. [Google Scholar]
- Patz, J.A.; Githeko, A.K.; McCarty, J.P.; Hussein, S.; Confalonieri, U.; de Wet, N. Climate Change and Infectious Diseases. In Climate Change and Human Health - Risk and Responses; World Health Organization: Geneva, Switzerland, 2003; Chapter 6; pp. 103–132. [Google Scholar]
- Luo, B.; Zhang, S.; Ma, S.; Zhou, J.; Wang, B. Effects of cold air on cardiovascular disease risk factors in rat. Int. J. Environ. Res. Public Health 2012, 9, 2312–2325. [Google Scholar] [CrossRef]
- Weatherbase. Available online: http://www.weatherbase.com/ (accessed on 3 November 2013).
- Hunter, J.E.; Schmidt, F.L. Methods of Meta-Analysis: Correcting Error and Bias in Research Findings, 2nd ed.; Sage: Newbury Park, CA, USA, 2004. [Google Scholar]
- Field, A.P.; Gilett, R. How to do a a meta analysis. Br. J. Math. Stat. Psychol. 2010, 63, 665–694. [Google Scholar] [CrossRef]
- Köppen, W.; Geiger, R. Das Geographische System der Klimate; Verlag von Gebrüder Borntraeger: Berlin, Gremany, 1936. [Google Scholar]
- Rudra, C.B.; Williams, M.A. Monthly variation in preeclampsia prevalence: Washington State, 1987–2001. J. Matern.-Fetal Neonatal Med. 2005, 18, 319–324. [Google Scholar] [CrossRef]
- Phillips, J.K.; Bernstein, I.M.; Mongeon, J.A.; Badger, G.J. Seasonal variation in preeclampsia based on timing of conception. Obstet. Gynecol. 2004, 104, 1015–1020. [Google Scholar] [CrossRef]
- Algert, C.S.; Roberts, C.L.; Shand, A.W.; Morris, J.M.; Ford, J.B. Seasonal variation in pregnancy hypertension is correlated with sunlight intensity. Am. J. Obstet. Gynecol. 2010, 203, e211–e215. [Google Scholar]
- Nanbakhsh, F.; Broomand, F.; Mohaddesi, H.; Nefoozi, S.; Mazloomi, P. Seasonal variation in the incidence of preeclampsia based on the time of conception. Life Sci. J. 2012, 9, 1310–1314. [Google Scholar]
- Tam, W.H.; Sahota, D.S.; Lau, T.K.; Li, C.Y.; Fung, T.Y. Seasonal variation in pre-eclamptic rate and its association with the ambient temperature and humidity in early pregnancy. Gynecol. Obstet. Investig. 2008, 66, 22–26. [Google Scholar] [CrossRef]
- Pitakkarnkul, S.; Phaloprakarn, C.; Wiriyasirivaj, B.; Manusirivithaya, S.; Tangjitgamol, S. Seasonal variation in the prevalence of preeclampsia. J. Med. Assoc. Thail. 2011, 94, 1293–1298. [Google Scholar]
- Wacker, J.; Schulz, M.; Fruhauf, J.; Chiwora, F.M.; Solomayer, E.; Bastert, G. Seasonal change in the incidence of preeclampsia in Zimbabwe. Acta Obstet. Gynecol. Scand. 1998, 77, 712–716. [Google Scholar] [CrossRef]
- Magnus, P.; Eskild, A. Seasonal variation in the occurrence of pre-eclampsia. BJOG 2001, 108, 1116–1119. [Google Scholar]
- Wellington, K.; Mulla, Z.D. Seasonal trend in the occurrence of preeclampsia and eclampsia in Texas. Am. J. Hypertens. 2012, 25, 115–119. [Google Scholar] [CrossRef]
- Magann, E.F.; Perry, K.G., Jr.; Morrison, J.C.; Martin, J.N., Jr. Climatic factors and preeclampsia-related hypertensive disorders of pregnancy. Am. J. Obstet. Gynecol. 1995, 172, 204–205. [Google Scholar] [CrossRef]
- Subramaniam, V. Seasonal variation in the incidence of preeclampsia and eclampsia in tropical climatic conditions. BMC Womens Health 2007, 7, 18. [Google Scholar] [CrossRef]
- Okafor, U.V.; Ezegwui, H.U. Cesarean delivery in preeclampsia and seasonal variation in a tropical rainforest belt. J. Postgrad. Med. 2010, 56, 21–23. [Google Scholar] [CrossRef]
- Haelterman, E.; Marcoux, S.; Croteau, A.; Dramaix, M. Population-based study on occupational risk factors for preeclampsia and gestational hypertension. Scand. J. Work Environ. Health 2007, 33, 304–317. [Google Scholar] [CrossRef]
- Bider, D.; Sivan, E.; Seidman, D.S.; Dulitzky, M.; Mashiach, S.; Serr, D.M.; Ben-Rafael, Z. Meteorological factors in hypertensive disorders, vaginal bleeding and premature rupture of membranes during pregnancy. Gynecol. Obstet. Investig. 1991, 32, 88–90. [Google Scholar] [CrossRef]
- Immink, A.; Scherjon, S.; Wolterbeek, R.; Steyn, D.W. Seasonal influence on the admittance of pre-eclampsia patients in Tygerberg Hospital. Acta Obstet. Gynecol. Scand. 2008, 87, 36–42. [Google Scholar] [CrossRef]
- Makhseed, M.; Musini, V.M.; Ahmed, M.A.; Monem, R.A. Influence of seasonal variation on pregnancy-induced hypertension and/or preeclampsia. Aust. N. Z. J. Obstet. Gynaecol. 1999, 39, 196–199. [Google Scholar] [CrossRef]
- Yackerson, N.S.; Piura, B.; Friger, M. The influence of weather state on the incidence of preeclampsia and placental abruption in semi-arid areas. Clin. Exp. Obstet. Gynecol. 2007, 34, 27–30. [Google Scholar]
- Soroori, Z.; Sharami, S.; Faraji, R. Seasonal variation of the onset of preeclampsia and eclampsia. JRMS 2007, 12, 198–202. [Google Scholar]
- Sebayang, S.K.; Dibley, M.J.; Kelly, P.J.; Shankar, A.V.; Shankar, A.H.; Group, S.S. Determinants of low birthweight, small-for-gestational-age and preterm birth in Lombok, Indonesia: Analyses of the birthweight cohort of the SUMMIT trial. Trop. Med. Int. Health 2012, 17, 938–950. [Google Scholar] [CrossRef]
- Garg, V.; Khandelwal, S. Seasonal trends in the occurrence of eclampsia. JK Sci. 2011, 13, 50–51. [Google Scholar]
- Rylander, A.; Lindqvist, P.G. Eclampsia is more prevalent during the winter season in Sweden. Acta Obstet. Gynecol. Scand. 2011, 90, 114–117. [Google Scholar] [CrossRef]
- Neela, J.; Raman, L. Seasonal trends in the occurrence of eclampsia. Natl. Med. J. India 1993, 6, 17–18. [Google Scholar]
- Halimi, S.; Halimi, S.M.A. Eclampsia and its association with external factors. J. Ayub. Med. Coll. Abbottabad 2010, 22, 110–112. [Google Scholar]
- Okafor, U.V.; Efetie, E.R.; Ekumankama, O. Eclampsia and seasonal variation in the tropics - a study in Nigeria. Pan Afr. Med. J. 2009, 2, 7. [Google Scholar]
- Obed, S.A.; Wilson, J.B.; Elkins, T.E. Eclampsia: 134 consecutive cases. Int. J. Gynaecol. Obstet. 1994, 45, 97–103. [Google Scholar] [CrossRef]
- Jamelle, R.N. Eclampsia: Is there a seasonal variation in incidence? J. Obstet. Gynaecol. Res. 1998, 24, 121–128. [Google Scholar] [CrossRef]
- Bergstrom, S.; Povey, G.; Songane, F.; Ching, C. Seasonal incidence of eclampsia and its relationship to meteorological data in Mozambique. J. Perinat. Med. 1992, 20, 153–158. [Google Scholar] [CrossRef]
- Ros, H.S.; Cnattingius, S.; Lipworth, L. Comparison of risk factors for preeclampsia and gestational hypertension in a population-based cohort study. Am. J. Epidemiol. 1998, 147, 1062–1070. [Google Scholar] [CrossRef]
- Bodnar, L.M.; Daftary, A.; Markovic, N.; Schatzman, C.L.; Roberts, J.M. Seasonal variation in gestational blood pressure. Hypertens. Pregnancy 2006, 25, 271–283. [Google Scholar] [CrossRef]
- Metoki, H.; Ohkubo, T.; Watanabe, Y.; Nishimura, M.; Sato, Y.; Kawaguchi, M.; Hara, A.; Hirose, T.; Obara, T.; Asayama, K.; et al. Seasonal trends of blood pressure during pregnancy in Japan: The babies and their parents’ longitudinal observation in Suzuki Memorial Hospital in Intrauterine Period study. J. Hypertens. 2008, 26, 2406–2413. [Google Scholar] [CrossRef]
- Bullock, N.; Breese McCoy, S.J.; Payton, M.E. Role of race in the seasonality of deliveries with preeclampsia. Med. Hypotheses 2011, 77, 674–676. [Google Scholar] [CrossRef]
- Khojasteh, F.; Safarzadeh, A.; Burayri, T. Survey of correlation between preeclampsia and season & some of its risk factor in pregnant women. J Women’s Health Care 2012, 1, 1000114:1–1000114:3. [Google Scholar]
- Kashanian, M.; Baradaran, H.R.; Bahasadri, S.; Alimohammadi, R. Risk factors for pre-eclampsia: A study in Tehran, Iran. Arch. Iran. Med. 2011, 14, 412–415. [Google Scholar]
- Shental, O.; Friger, M.; Sheiner, E. Ethnic differences in the monthly variation of preeclampsia among Bedouin and Jewish parturients in the Negev. Hypertens. Pregnancy 2010, 29, 342–349. [Google Scholar] [CrossRef]
- Bodnar, L.M.; Catov, J.M.; Roberts, J.M. Racial/ethnic differences in the monthly variation of preeclampsia incidence. Am. J. Obstet. Gynecol. 2007, 196, e321–e325. [Google Scholar]
- Daniilidis, A.; Chastamouratidis, C.; Balaouras, D.; Chitzios, D.; Loufopoulos, P.D.; Fotinakis, I.; Hatzis, P. Seasonal variation in the incidence of severe preeclampsia in mediterranean climatic conditions. Eur. J. Inflamm. 2013, 11, 527–529. [Google Scholar]
- Curie, J.; Schwandt, H. Within-mother analysis of seasonal patterns in health at birth. Proc. Natl. Acad. Sci. Early Ed. USA 2013. [Google Scholar] [CrossRef]
- Bodnar, L.M.; Simhan, H.N. The prevalence of preterm birth and season of conception. Paediatr. Perinat. Epidemiol. 2008, 22, 538–545. [Google Scholar] [CrossRef]
- Friis, H.; Gomo, E.; Nyazema, N.; Ndhlovu, P.; Krarup, H.; Kaestel, P.; Michaelsen, K.F. Maternal body composition, HIV infection and other predictors of gestation length and birth size in Zimbabwe. Br. J. Nutr. 2004, 92, 833–840. [Google Scholar] [CrossRef]
- Matsuda, S.; Sone, T.; Doi, T.; Kahyo, H. Seasonality of mean birth weight and mean gestational period in Japan. Hum. Biol. 1993, 65, 481–501. [Google Scholar]
- Flouris, A.D.; Spiropoulos, Y.; Sakellariou, G.J.; Koutedakis, Y. Effect of seasonal programming on fetal development and longevity: Links with environmental temperature. Am. J. Hum. Biol. 2009, 21, 214–216. [Google Scholar] [CrossRef]
- Wohlfahrt, J.; Melbye, M.; Christens, P.; Andersen, A.M.; Hjalgrim, H. Secular and seasonal variation of length and weight at birth. Lancet 1998, 352, 1990. [Google Scholar] [CrossRef]
- Buckles, K.S.; Hungerman, D.M. Season of birth and later outcomes: Old questions, new answers. Rev. Econ. Stat. 2013, XCV, 711–724. [Google Scholar] [CrossRef]
- Auger, N.; Kuehne, E.; Goneau, M.; Daniel, M. Preterm birth during an extreme weather event in Quebec, Canada: A “natural experiment”. Matern. Child Health J. 2011, 15, 1088–1096. [Google Scholar] [CrossRef]
- Rayco-Solon, P.; Fulford, A.J.; Prentice, A.M. Differential effects of seasonality on preterm birth and intrauterine growth restriction in rural Africans. Am. J. Clin. Nutr. 2005, 81, 134–139. [Google Scholar]
- Dadvand, P.; Basagana, X.; Sartini, C.; Figueras, F.; Vrijheid, M.; de Nazelle, A.; Sunyer, J.; Nieuwenhuijsen, M.J. Climate extremes and the length of gestation. Environ. Health Perspect. 2011, 119, 1449–1453. [Google Scholar] [CrossRef]
- Porter, K.R.; Thomas, S.D.; Whitman, S. The relation of gestation length to short-term heat stress. Am. J. Public Health 1999, 89, 1090–1092. [Google Scholar] [CrossRef]
- Matsuda, S.; Kahyo, H. Geographic differences in seasonality of preterm births in Japan. Hum. Biol. 1998, 70, 919–935. [Google Scholar]
- Strand, L.B.; Barnett, A.G.; Tong, S. Maternal exposure to ambient temperature and the risks of preterm birth and stillbirth in Brisbane, Australia. Am. J. Epidemiol. 2012, 175, 99–107. [Google Scholar]
- Basu, R.; Malig, B.; Ostro, B. High ambient temperature and the risk of preterm delivery. Am. J. Epidemiol. 2010, 172, 1108–1117. [Google Scholar] [CrossRef]
- Yackerson, N.; Piura, B.; Sheiner, E. The influence of meteorological factors on the emergence of preterm delivery and preterm premature rupture of membrane. J. Perinatol. 2008, 28, 707–711. [Google Scholar] [CrossRef]
- Lee, S.J.; Hajat, S.; Steer, P.J.; Filippi, V. A time-series analysis of any short-term effects of meteorological and air pollution factors on preterm births in London, UK. Environ. Res. 2008, 106, 185–194. [Google Scholar] [CrossRef]
- Wolf, J.; Armstrong, B. The association of season and temperature with adverse pregnancy outcome in two German states, a time-series analysis. PLoS One 2012, 7, e40228. [Google Scholar] [CrossRef]
- Lajinian, S.; Hudson, S.; Applewhite, L.; Feldman, J.; Minkoff, H.L. An association between the heat-humidity index and preterm labor and delivery: A preliminary analysis. Am. J. Public Health 1997, 87, 1205–1207. [Google Scholar] [CrossRef]
- Wang, J.; Williams, G.; Guo, Y.; Pan, X.; Tonga, S. Maternal exposure to heatwave and preterm birth in Brisbane, Australia. BJOG 2013. [Google Scholar] [CrossRef]
- Schifano, P.; Lallo, A.; Asta, F.; de Sario, M.; Davoli, M.; Michelozzi, P. Effect of ambient temperature and air pollutants on the risk of preterm birth, Rome 2001–2010. Environ. Int. 2013, 61, 77–87. [Google Scholar] [CrossRef]
- Lee, S.J.; Steer, P.J.; Filippi, V. Seasonal patterns and preterm birth: A systematic review of the literature and an analysis in a London-based cohort. BJOG 2006, 113, 1280–1288. [Google Scholar] [CrossRef]
- Hirsch, E.; Lim, C.; Dobrez, D.; Adams, M.G.; Noble, W. Meteorological factors and timing of the initiating event of human parturition. Int. J. Biometeorol. 2011, 55, 265–272. [Google Scholar] [CrossRef]
- Akutagawa, O.; Nishi, H.; Isaka, K. Spontaneous delivery is related to barometric pressure. Arch. Gynecol. Obstet. 2007, 275, 249–254. [Google Scholar] [CrossRef]
- Noller, K.L.; Resseguie, L.J.; Voss, V. The effect of changes in atmospheric pressure on the occurrence of the spontaneous onset of labor in term pregnancies. Am. J. Obstet. Gynecol. 1996, 174, 1192–1197. [Google Scholar] [CrossRef]
- King, E.A.; Fleschler, R.G.; Cohen, S.M. Association between significant decrease in barometric pressure and onset of labor. J. Nurse Midwifery 1997, 42, 32–34. [Google Scholar] [CrossRef]
- Miranda, M.L.; Anthopolos, R.; Edwards, S.E. Seasonality of poor pregnancy outcomes in North Carolina. N. C. Med. J. 2011, 72, 447–453. [Google Scholar]
- Matsuda, S.; Kahyo, H. Seasonality of preterm births in Japan. Int. J. Epidemiol. 1992, 21, 91–100. [Google Scholar] [CrossRef]
- Baroutis, G.; Mousiolis, A.; Hoffman, D.; Antsaklis, A. Preterm birth seasonality in Greece: An epidemiological study. J. Matern.-Fetal Neonatal Med. 2012, 25, 1406–1412. [Google Scholar]
- Elter, K.; Ay, E.; Uyar, E.; Kavak, Z.N. Exposure to low outdoor temperature in the midtrimester is associated with low birth weight. Aust. N. Z. J. Obstet. Gynaecol. 2004, 44, 553–557. [Google Scholar] [CrossRef]
- Torche, F.; Corvalan, A. Seasonality of birth weight in Chile: Environmental and socioeconomic factors. Ann. Epidemiol. 2010, 20, 818–826. [Google Scholar] [CrossRef]
- Murray, L.J.; O’Reilly, D.P.; Betts, N.; Patterson, C.C.; Davey Smith, G.; Evans, A.E. Season and outdoor ambient temperature: Effects on birth weight. Obstet. Gynecol. 2000, 96, 689–695. [Google Scholar] [CrossRef]
- Siniarska, A.; Koziel, S. Association of birth weight and length with air temperature, sunlight, humidity and rainfall in the city of Warsaw, Poland. Homo 2010, 61, 373–380. [Google Scholar] [CrossRef]
- Lawlor, D.A.; Leon, D.A.; Davey Smith, G. The association of ambient outdoor temperature throughout pregnancy and offspring birthweight: Findings from the Aberdeen Children of the 1950s cohort. BJOG 2005, 112, 647–657. [Google Scholar] [CrossRef]
- Chodick, G.; Shalev, V.; Goren, I.; Inskip, P.D. Seasonality in birth weight in Israel: New evidence suggests several global patterns and different etiologies. Ann. Epidemiol. 2007, 17, 440–446. [Google Scholar] [CrossRef]
- McGrath, J.J.; Keeping, D.; Saha, S.; Chant, D.C.; Lieberman, D.E.; O’Callaghan, M.J. Seasonal fluctuations in birth weight and neonatal limb length; does prenatal vitamin D influence neonatal size and shape? Early Hum. Dev. 2005, 81, 609–618. [Google Scholar] [CrossRef]
- Rousham, E.K.; Gracey, M. Seasonality of low birthweight in indigenous Australians: An increase in pre-term birth or intrauterine growth retardation? Aust. N. Z. J. Public Health 1998, 22, 669–672. [Google Scholar] [CrossRef]
- Gloria-Bottini, F.; Meloni, G.F.; Finocchi, A.; Porcu, S.; Amante, A.; Bottini, E. Rh system and intrauterine growth. Interaction with season of birth. Dis. Markers 2000, 16, 139–142. [Google Scholar]
- De Jong, L.V.; Waller, G.; Stettler, N. Ethnicity modifies seasonal variations in birth weight and weight gain of infants. J. Nutr. 2003, 133, 1415–1418. [Google Scholar]
- Pereira, G.; Cook, A.; Haggar, F.; Bower, C.; Nassar, N. Seasonal variation in fetal growth: Accounting for sociodemographic, biological, and environmental exposures. Am. J. Obstet. Gynecol. 2012, 206, e71–e77. [Google Scholar]
- Kinabo, J. Seasonal-variation of birth-weight distribution in Morogoro, Tanzania. East Afr. Med. J. 1993, 70, 752–755. [Google Scholar]
- Jensen, P.M.; Sorensen, M. Differences in human birth weight and corollary attributes as a result of temperature regime. Ann. Hum. Biol. 2013, 40, 385–395. [Google Scholar] [CrossRef]
- Wells, J.C.; Cole, T.J. Birth weight and environmental heat load: A between-population analysis. Am. J. Phys. Anthropol. 2002, 119, 276–282. [Google Scholar] [CrossRef]
- Lin, G.; Zhang, T.L. Examining extreme weather effects on birth weight from the individual effect to spatiotemporal aggregation effects. J. Agric. Biol. Environ. Stat. 2012, 17, 490–507. [Google Scholar] [CrossRef]
- Deschêne, O.; Greenstone, M.; Guryan, J. Climate change and birth weight. Am. Econ. Rev. 2009, 99, 211–217. [Google Scholar] [CrossRef]
- Tustin, K.; Gross, J.; Hayne, H. Maternal exposure to first-trimester sunshine is associated with increased birth weight in human infants. Dev. Psychobiol. 2004, 45, 221–230. [Google Scholar] [CrossRef]
- Hartig, T.; Catalano, R. Cold summer weather, constrained restoration, and very low birth weight in Sweden. Health Place 2013, 22, 68–74. [Google Scholar] [CrossRef]
- Waldie, K.E.; Poulton, R.; Kirk, I.J.; Silva, P.A. The effects of pre- and post-natal sunlight exposure on human growth: Evidence from the Southern Hemisphere. Early Hum. Dev. 2000, 60, 35–42. [Google Scholar] [CrossRef]
- Darrow, L.A.; Strickland, M.J.; Klein, M.; Waller, L.A.; Flanders, W.D.; Correa, A.; Marcus, M.; Tolbert, P.E. Seasonality of birth and implications for temporal studies of preterm birth. Epidemiology 2009, 20, 699–706. [Google Scholar] [CrossRef]
- Pedersen, M.; Giorgis-Allemand, L.; Bernard, C.; Aguilera, I.; Nybo Andersen, A.-M.; Ballester, F.; Beelen, R.M.J.; Chatzi, L.; Cirach, M.; Danileviciute, A.; et al. Ambient air pollution and low birthweight: A European cohort study (ESCAPE). Lancet. 2013, 1, pp. 695–704. Available online: http://dx.doi.org/10.1016/S2213-2600(13)70192-9 (accessed on 15 October 2013).
- Slama, R.; Darrow, L.; Parker, J.; Woodruff, T.J.; Strickland, M.; Nieuwenhuijsen, M.; Glinianaia, S.; Hoggatt, K.J.; Kannan, S.; Hurley, F.; et al. Meeting report: Atmospheric pollution and human reproduction. Environ. Health Perspect. 2008, 116, 791–798. [Google Scholar] [CrossRef]
- Rustveld, L.O.; Kelsey, S.F.; Sharma, R. Association between maternal infections and preeclampsia: A systematic review of epidemiologic studies. Matern. Child Health J. 2008, 12, 223–242. [Google Scholar] [CrossRef]
- Takem, E.N.; D’Alessandro, U. Malaria in pregnancy. Mediterr. J. Hematol. Infect. Dis. 2013, 5, e2013010. [Google Scholar]
- Basu, R.; Woodruff, T.J.; Parker, J.D.; Saulnier, L.; Schoendorf, K.C. Comparing exposure metrics in the relationship between PM2.5 and birth weight in California. J. Expo. Anal. Environ. Epidemiol. 2004, 14, 391–396. [Google Scholar] [CrossRef]
Appendix
Table A1.
Studies examined for the meta analysis of the influence of month of conception on preeclampsia incidence.
Table A2.
Pooled relative risks and 95% credible interval for the association between month of conception on preeclampsia incidence after excluding [16].
Table A3.
Studies examined for the meta analysis of the influence of month of birth on preeclampsia incidence.
Table A4.
Pooled relative risks and 95% credible interval for the association between month of birth on preeclampsia incidence after excluding [21].
Table A5.
Studies examined for the meta analysis of the influence of season of birth on preeclampsia incidence.
Table A6.
Pooled relative risks and 95% credible interval for the association between season of birth on preeclampsia incidence.
Table A7.
Pooled relative risks and 95% credible interval for the association between season of birth on preeclampsia incidence after excluding [22].
Table A8.
Studies examined for the meta analysis of the association between temperature and preeclampsia incidence.
Table A9.
Studies examined for the meta analysis of the influence of month of birth on eclampsia incidence.
Table A10.
Pooled relative risks and 95% credible interval for the association between month of birth on eclampsia incidence after excluding [34].
Table A11.
Studies examined for the meta analysis of the influence of season of birth on eclampsia incidence.
Table A12.
Pooled relative risks and 95% credible interval for the association between season of birth on eclampsia incidence.
Table A13.
Pooled relative risks and 95% credible interval for the association between season of birth on eclampsia after excluding [34].
Table A14.
Studies examined for the meta analysis of the influence of season of conception on preterm birth and gestational length.
Table A15.
Pooled relative risks and 95% credible interval for the association between season of conception and preterm birth.
Table A16.
Studies examined for the meta analysis of the influence of month of birth on preterm birth and gestational length.
Table A17.
Pooled relative risks and 95% credible interval for the association between month of birth and preterm birth after excluding [56].
Table A18.
Studies examined for the meta analysis of the influence of season of birth on preterm birth or gestational length.
Table A19.
Pooled relative risks and 95% credible interval for the association between season of birth and preterm birth.
Table A20.
Studies examined for the meta analysis of the influence of month of birth on birth weight.
© 2013 by the authors; licensee MDPI, Basel, Switzerland. This article is an open access article distributed under the terms and conditions of the Creative Commons Attribution license (http://creativecommons.org/licenses/by/3.0/).