Associations of Meteorology with Adverse Pregnancy Outcomes: A Systematic Review of Preeclampsia, Preterm Birth and Birth Weight


Abstract
:1. Introduction
2. Material and Methods
2.1. Search Strategy
2.2. Screening Process
2.3. Data Extraction
2.4. Meta-Analyses
- They reported the same pregnancy outcome.
- They reported sample sizes.
- They examined the same type of exposure variable (e.g., two studies on temperature will be pooled but one study on temperature will not be pooled with another one on a heat-humidity index (composite variable based on temperature and humidity and calculated according to different formulae).
- They reported effect sizes estimates with consistent temporal resolutions, or at least provided base data of consistent temporal resolutions (e.g., by month or pregnancy trimester) allowing to compute effect size estimates.
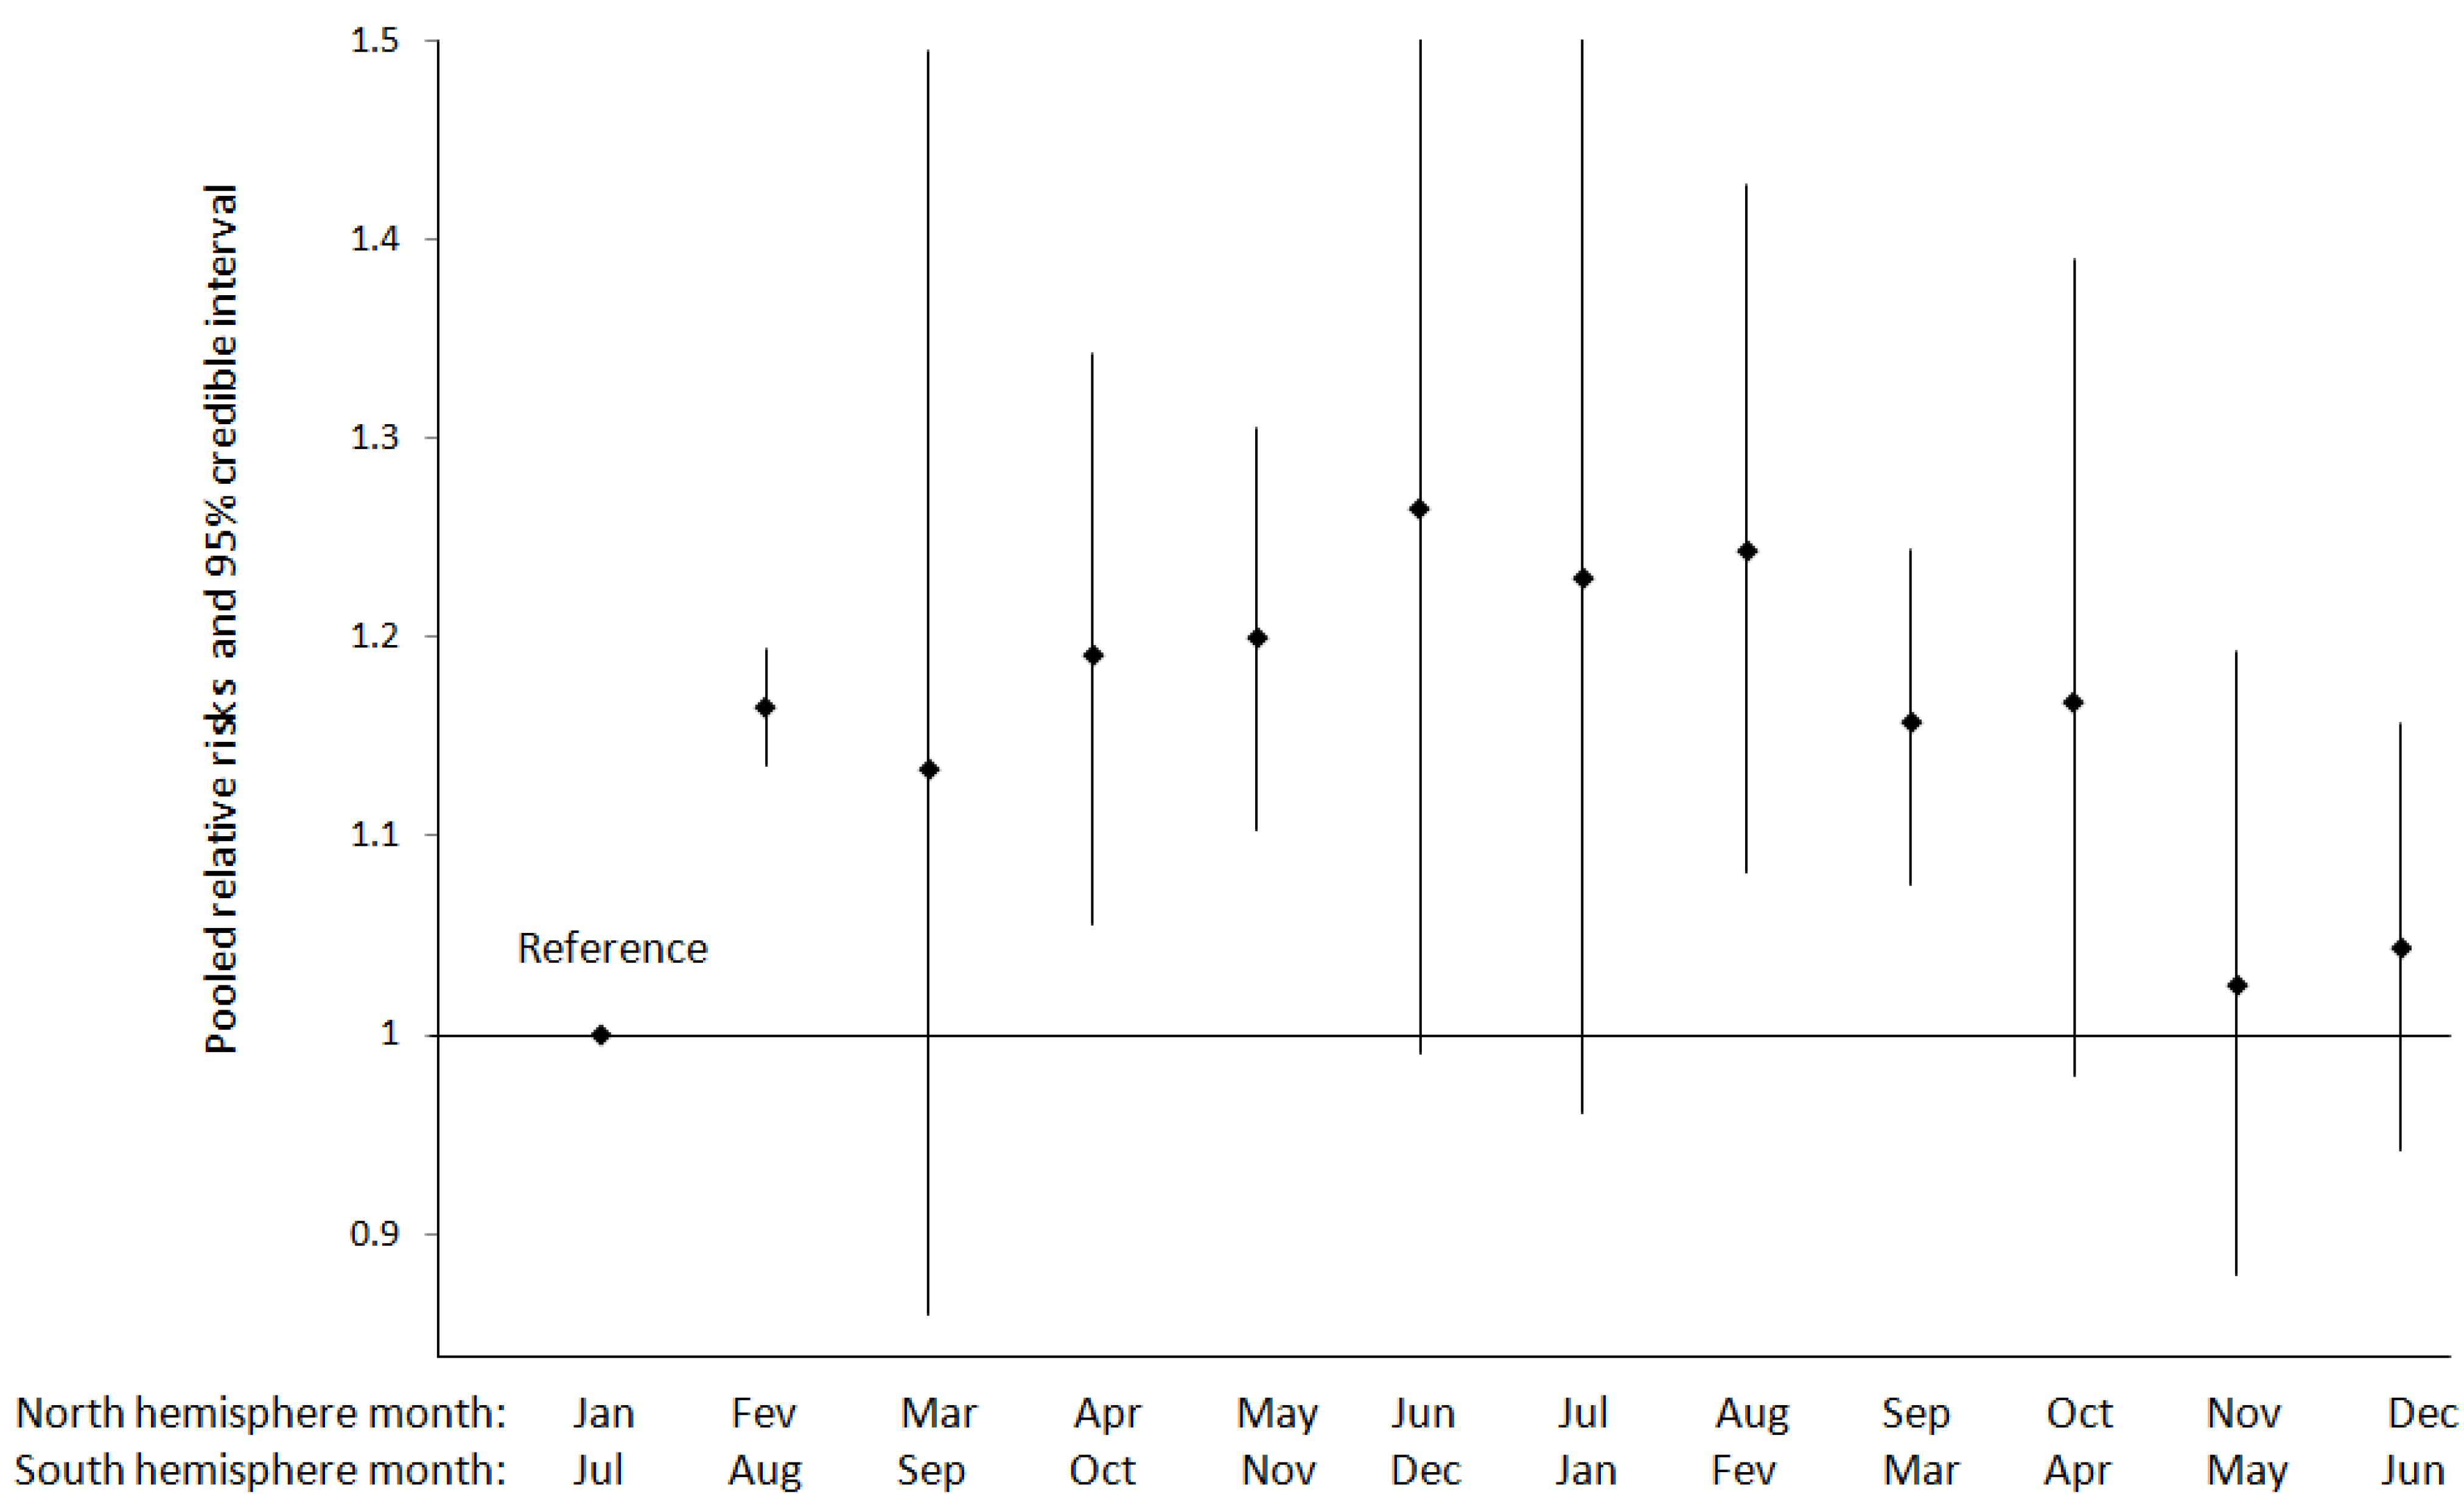
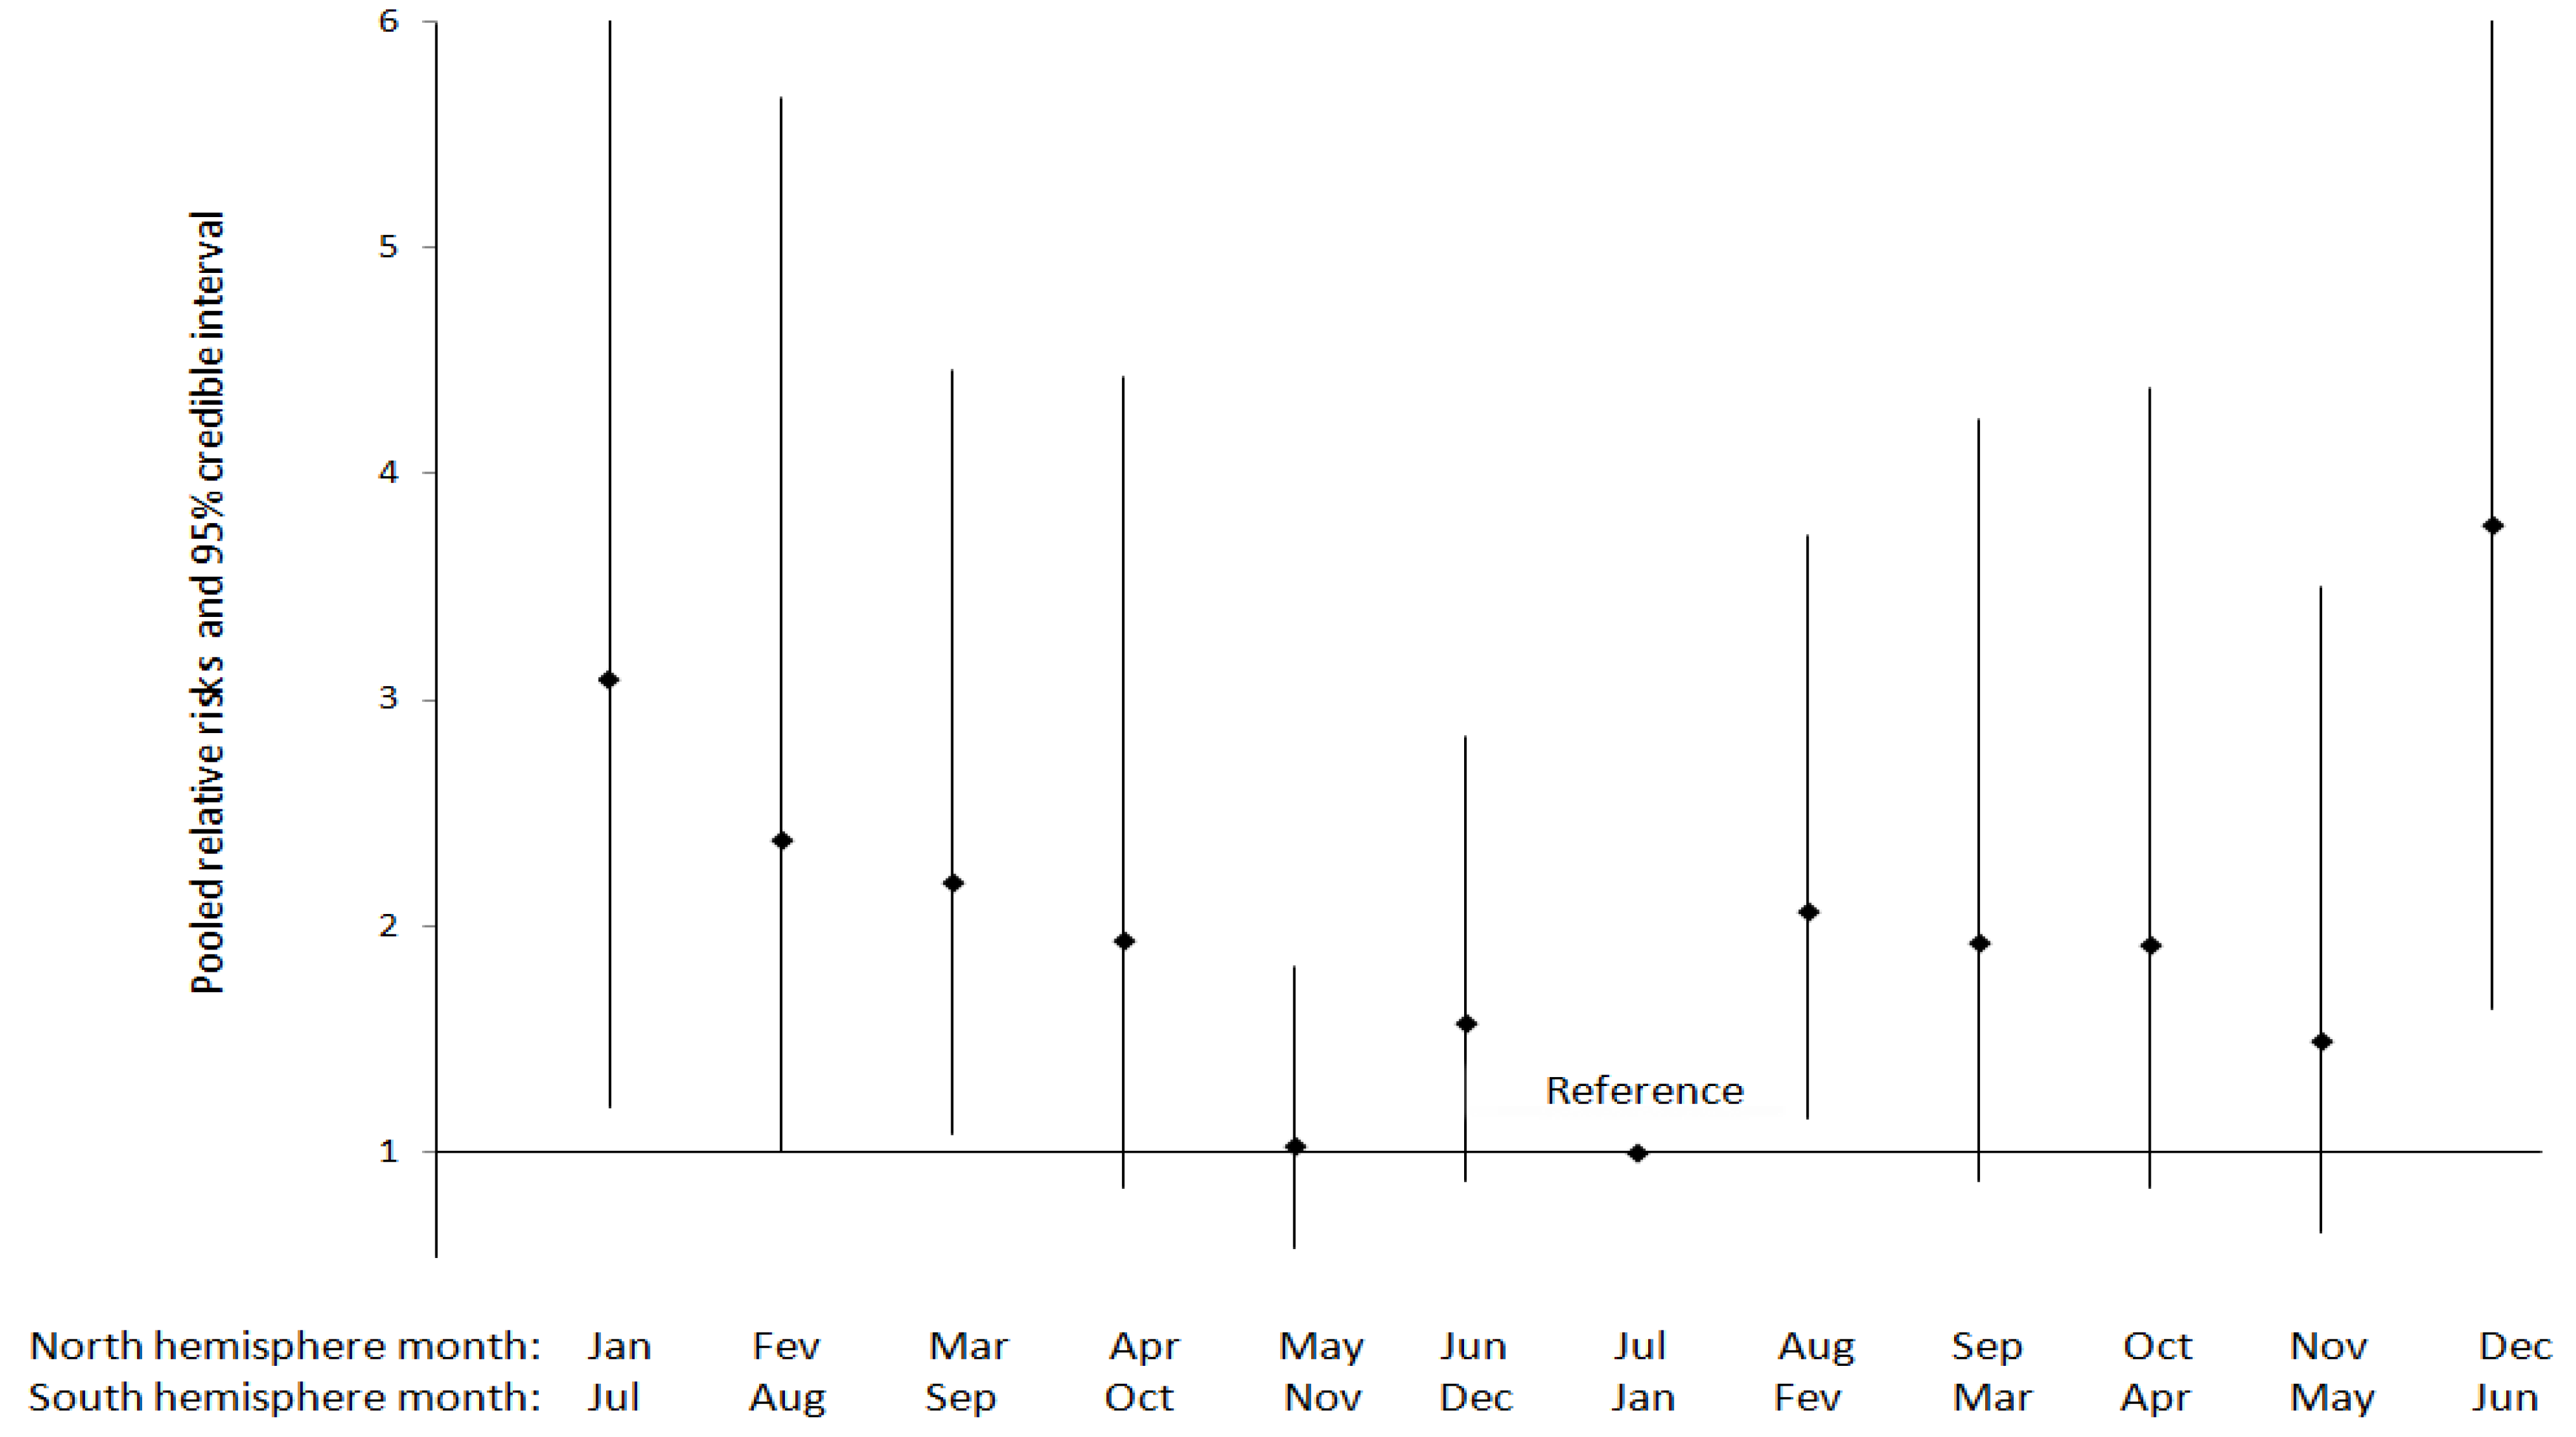
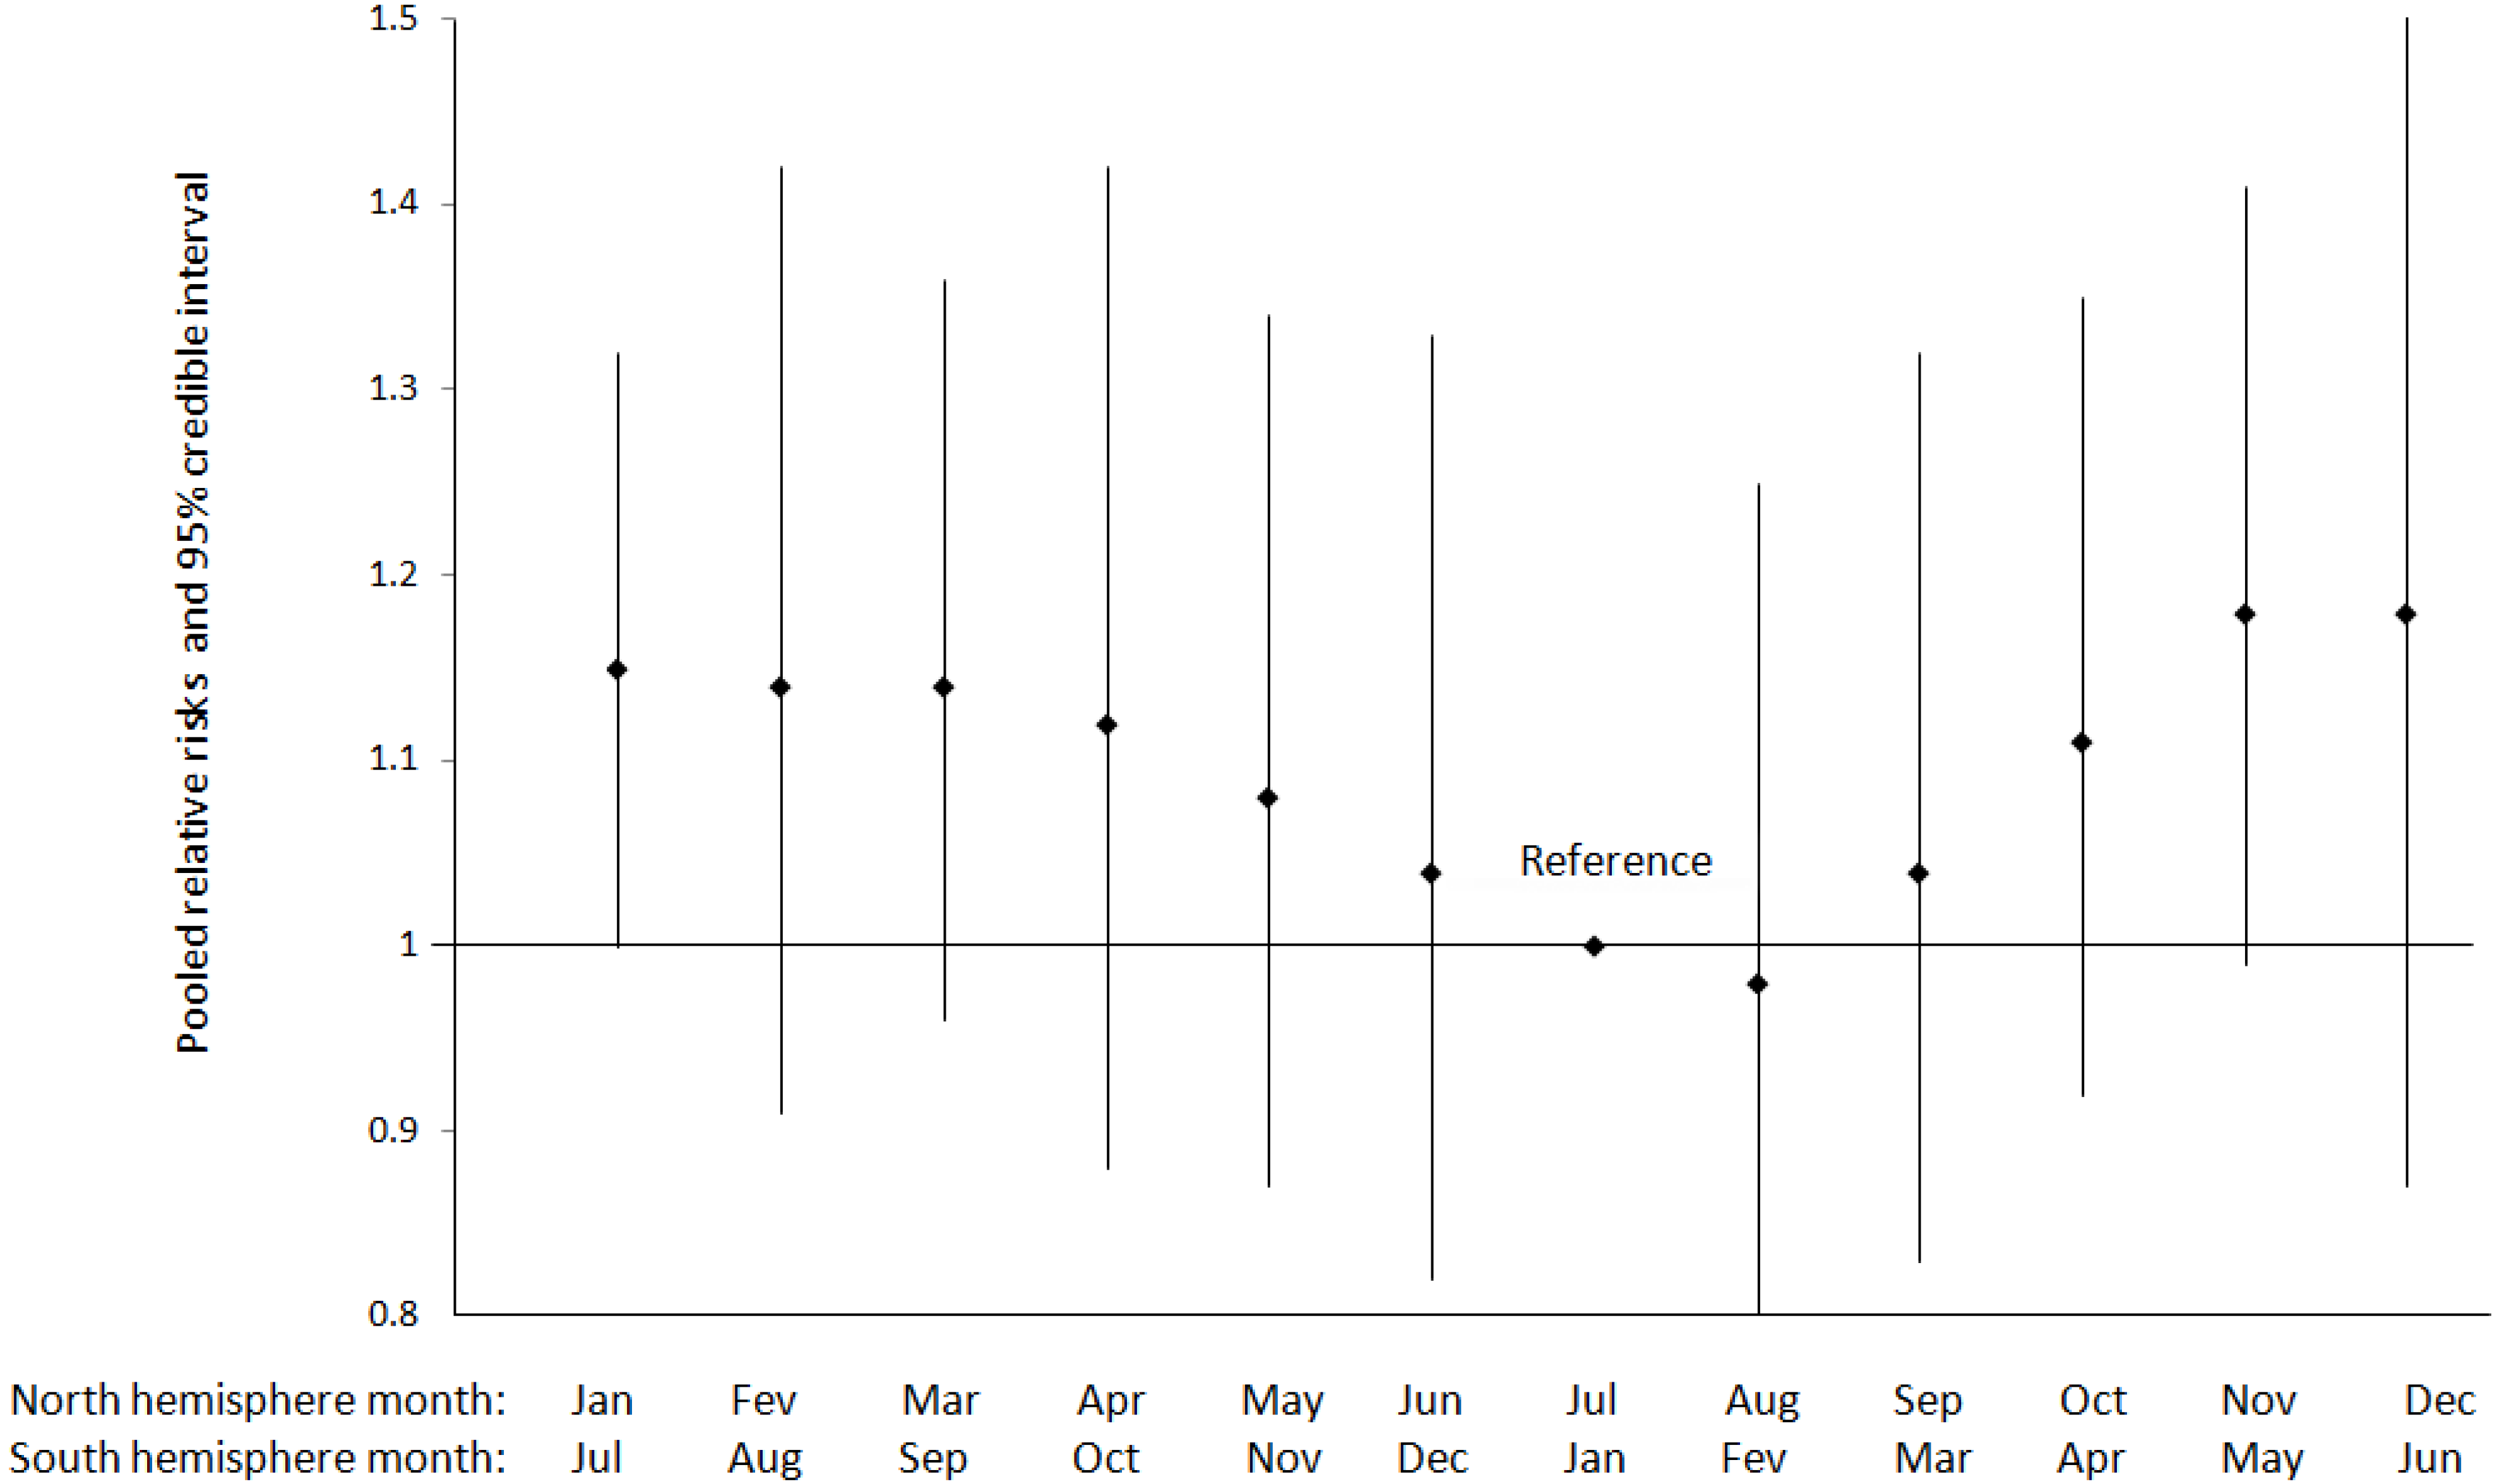
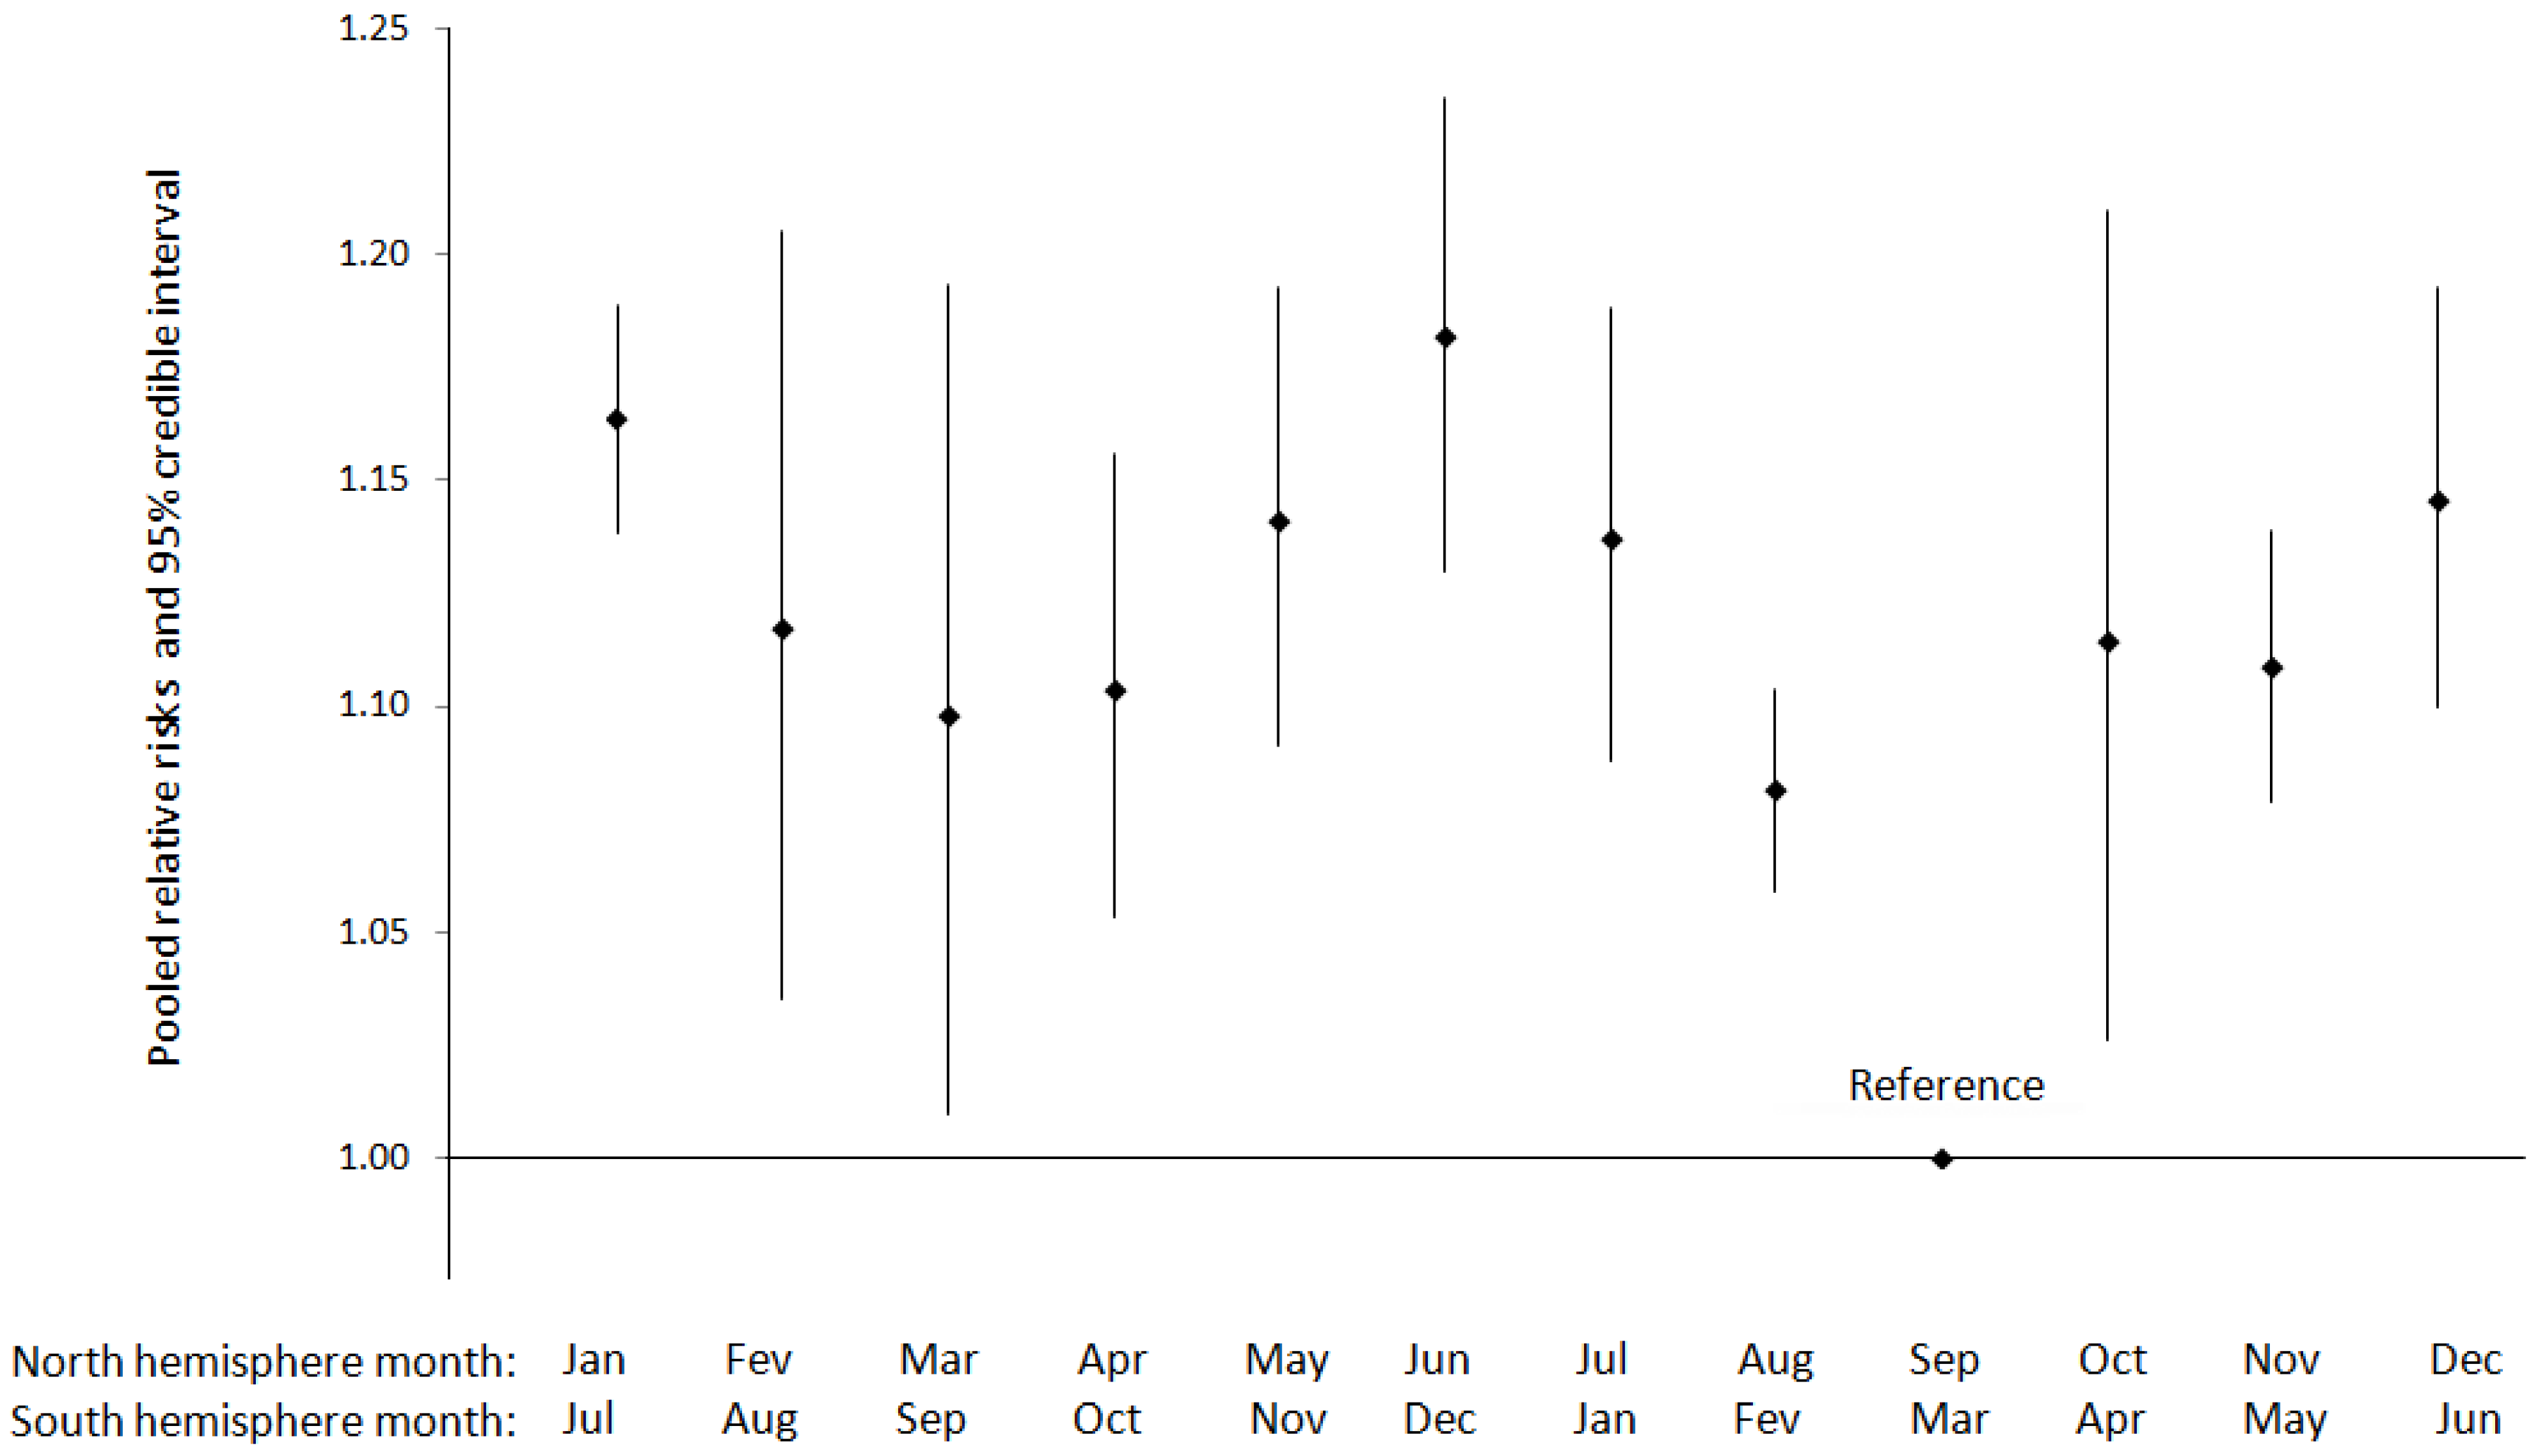
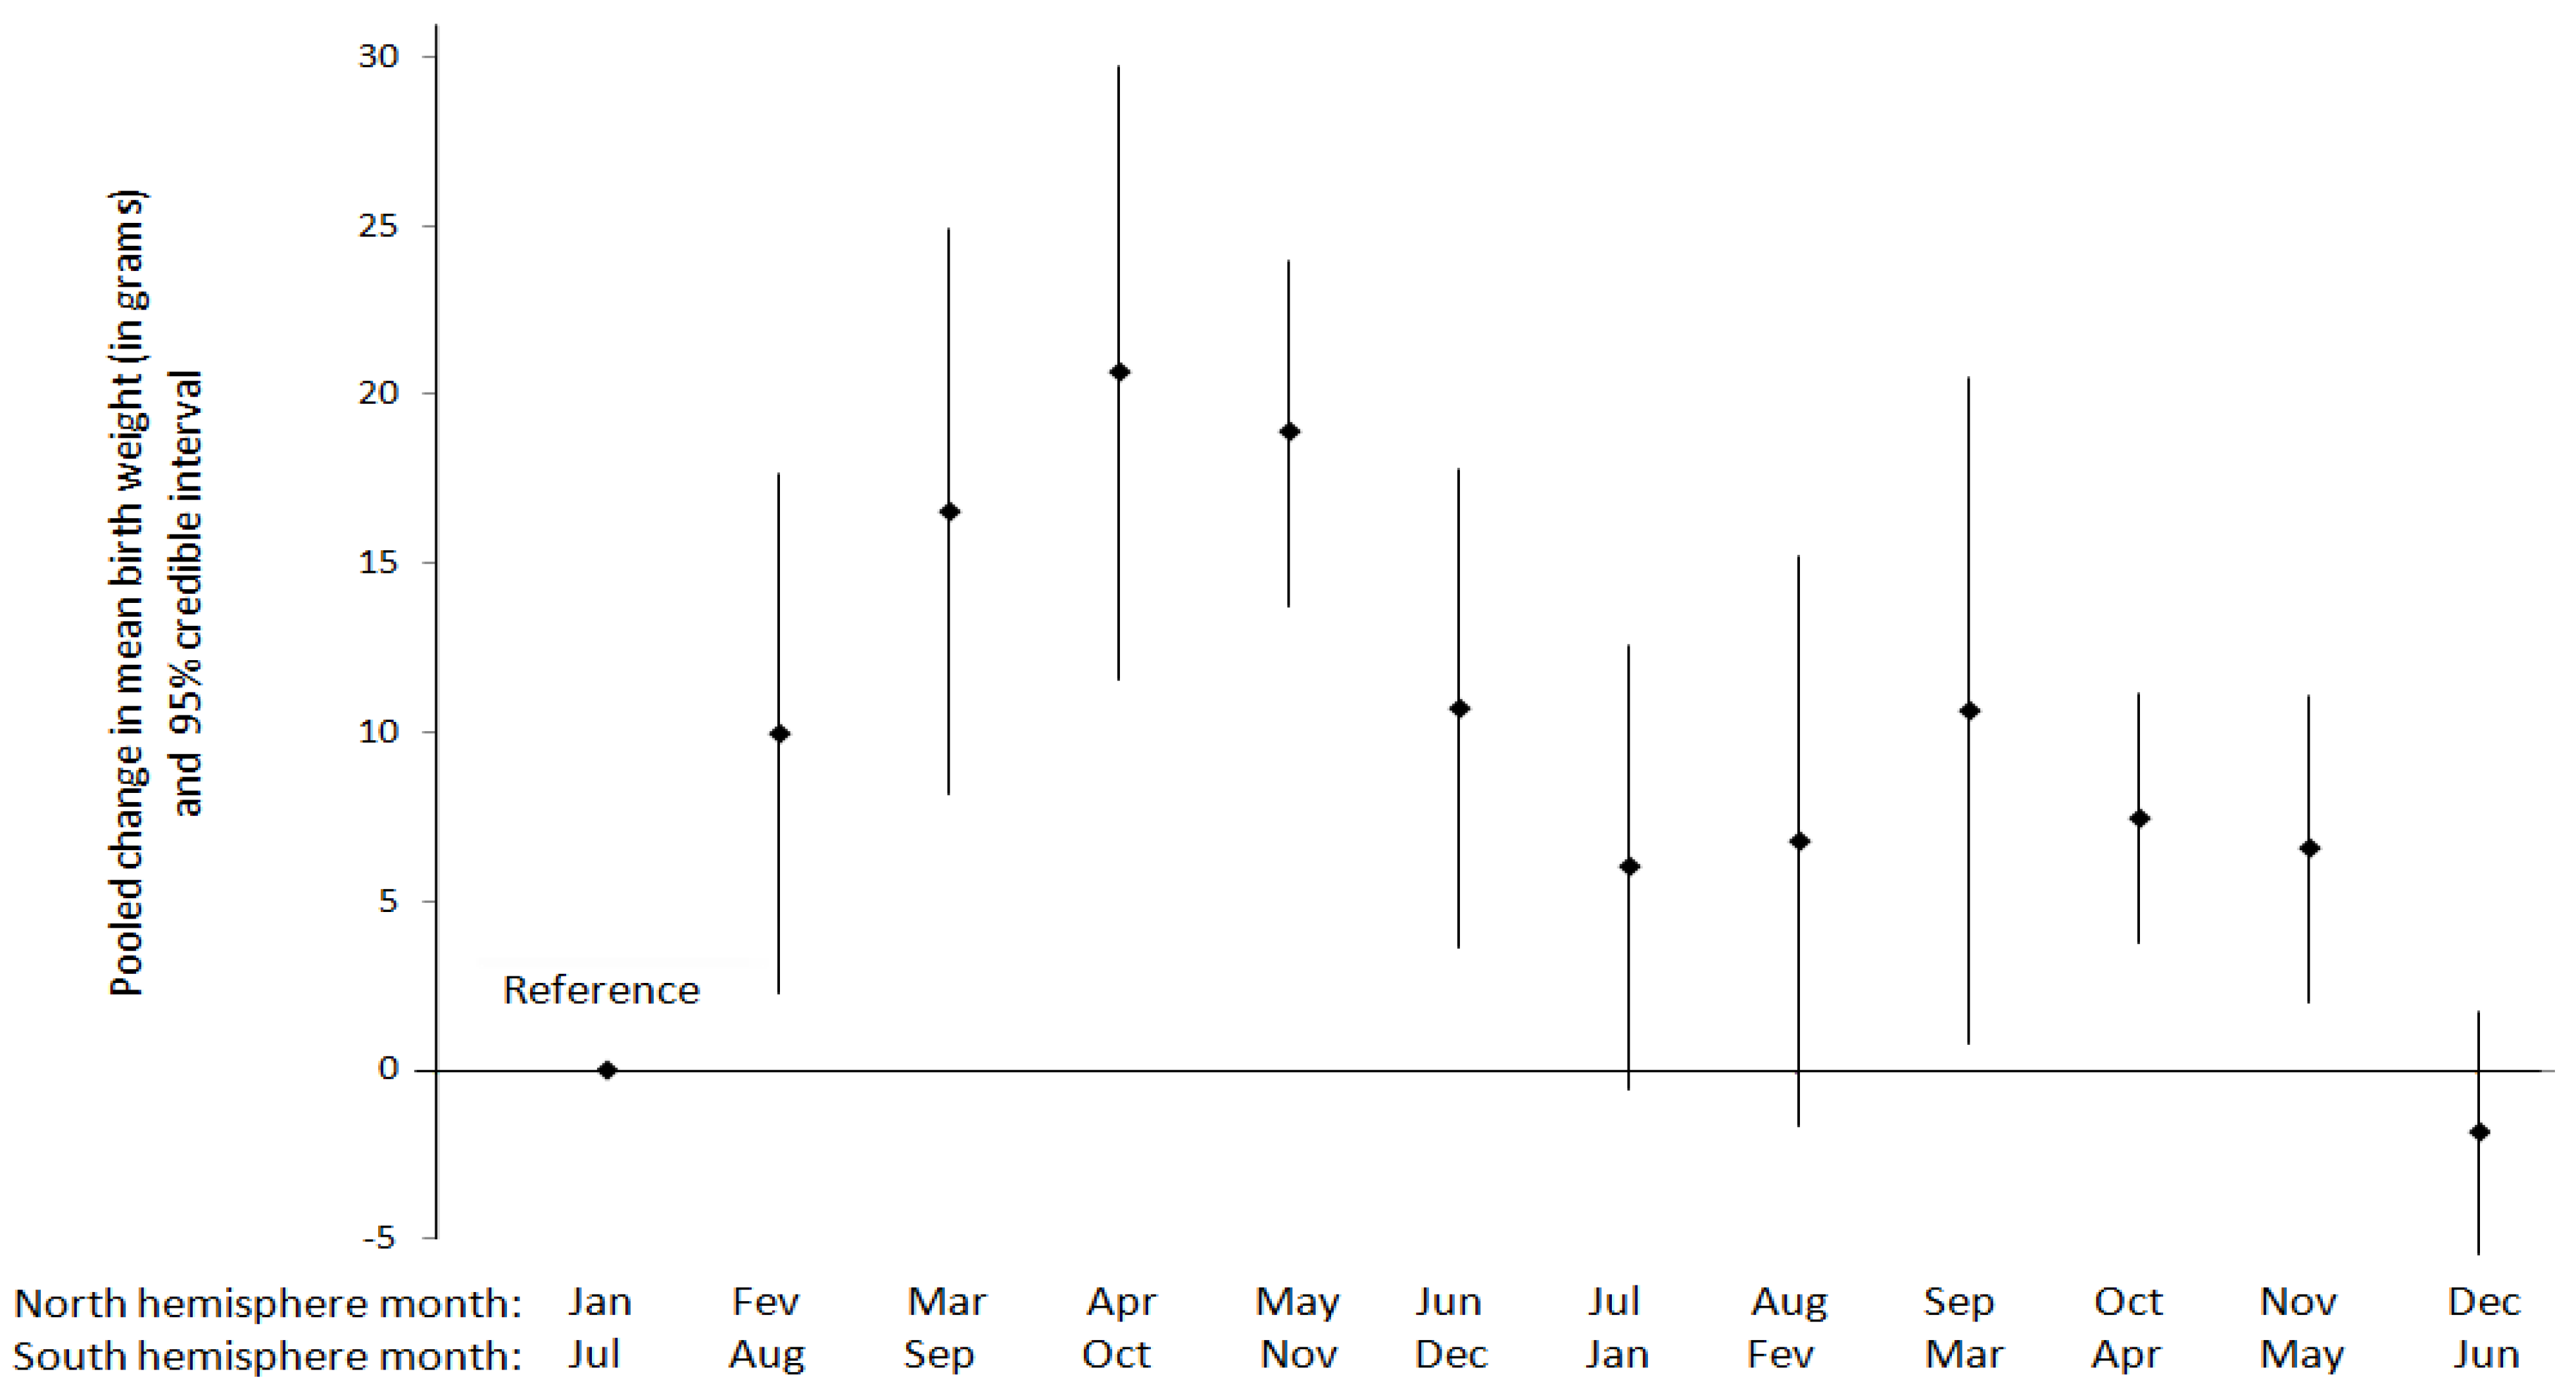
- For month-to-month variations in pregnancy outcomes, pooling was conducted only for studies from locations showing comparable relative trends in month-to-month temperature changes (these temporal profiles were assessed from [10]). For studies conducted in the North hemisphere, this means December and January were the coldest months, and July and August were the warmest, with monotonic transitions in between. A 6-month lag was applied for studies conducted in the South hemisphere as compared to the North hemisphere. Meta-analyses were therefore conducted using a monthly indicator defined as follows: “January in North hemisphere OR July in South hemisphere”, “February in North hemisphere OR August in South hemisphere”, and so on for the other months.
- For season-to-season variations in pregnancy outcomes, we relied on the definitions of seasons provided by authors in their original publications. Some studies documented only month-to-month variations in pregnancy outcomes, and did not report effect size estimates by season. However, if these studies reported number of cases and total pregnancies by month, we aggregated monthly data to seasonal data and subsequently included them in the meta-analyses on season. The following were adopted for seasons in the North hemisphere: winter (December–February), spring (March–May), summer (June–August), and autumn (September–October). Again, a lag of 6 months was applied to define seasons in the Southern hemisphere.
2.5. Presentation of Results
3. Results
3.1. Findings from Hypertensive Disorders of Pregnancy
3.1.1. Preeclampsia

3.1.2. Eclampsia
3.1.3. Gestational Hypertension

| Reference | Seasonal or meteorological variable | Outcome | Setting (climate type a), study period | Exposure metric | Study Design | Inclusion criteria | Statistical method | Population size | Summarized Main Results | Confounders adjusted for/ other comments |
|---|---|---|---|---|---|---|---|---|---|---|
| [27] | Seasonality of birth (month) Temperature Humidity | Preeclampsia | Tel Aviv, Israel (NT), 1984–1988 | - Year divided into months: December–May (cooler), June–November (warmer) - Monthly average humidity and temperature | Hospital based cohort study | All women | unspecified | N = not stated but estimated to 18,500 using the average preeclampsia incidence. Preeclampsia cases: 276 | - Statistically significant increase in incidence rates between January–June (1.5%) compared to July–December (1.15%) p < 0.035 - Statistically significant increase in incidence rates between December–May (1.6%) compared to June–November (1.1%), p < 0.001 -Incidence rates increased in months of low temperature and high humidity (>70%) | |
| [23] | Seasonality of birth (3 seasons) Temperature Humidity | Preeclampsia | Jackson, MS, USA (NT), January 1990–December 1992 | - Year divided into seasons: spring (February–May), summer (June–September) and fall (October–January) - Daily maximum mean temperatures and relative humidity averaged by season | Hospital based cohort study | All women who delivered at a referral center | Chi square test | N = 11,958 cases: 995 | - No association between preeclampsia and season of birth: Spring 7.8%; Summer 8.1%, and Fall 9.0% (p = 0.158). - No association of meteorological factors with mild preeclampsia p = 0.269), severe preeclampsia-eclampsia (p = 0.895), or superimposed preeclampsia (p = 0.193) | Maximum temperatures averaged by season were 73” F, 90.8” F and 65” F for spring, summer and fall respectively, whereas relative humidity was 85% , 89.7%. and 84%, respectively. |
| [29] | Seasonality of birth (month) Temperature Humidity | Preeclampsia Gestational hypertension | Safata, Kuwait (NT), 1992–1994 | - Year divided monthly - Monthly average temperature and relative humidity | Hospital based cohort study | All women | Pearson correlation and linear regression | N = 28,262 Gestational hypertension cases: 1,457 Preeclampsia cases: 692 | - No association between seasonal variation and preeclampsia or gestational hypertension - Preeclampsia cases peaked in November (temperature = 20.9 °C, humidity = 53.2) and were low in August (temperature = 37.7 °C, humidity = 19.5%) - Gestational hypertension rates were highest in June (temperature = 36.7 °C, humidity = 48.5%) and lowest in March (temperature = 18.6 °C, humidity = 48.5%). | |
| [44] | Seasonality of birth (month) | Preeclampsia | Tulsa, OK, USA (NT), January 2005–December 2007 | - Year divided monthly | Hospital based cohort study | All women at least 18 years of age | ANOVA Contingency table analysis | N = 3,050 Preeclampsia cases: 176 | Neither analysis of variance nor contingency table analysis revealed a significant seasonality of preeclamptic deliveries, (p = 0.94 and 0.95, respectively) | |
| [28] | Seasonality of birth (month) Temperature Rainfall | Preeclampsia | Cape Town, South Africa (NT), 2002–2003 | - Year divided into seasons: summer (mid-December–March), autumn (mid-March–June), winter (mid-June–September) and spring (mid-September–December) - Daily minimum and maximum temperatures and daily rainfall averaged by month | Hospital based cohort study | All pregnancies | Logistic regression | N = 11,585 Preeclampsia cases: 1,329 | Incidence highest in winter (13.6%) and lowest in summer (8.5%) (OR = 1.69, 95% CI: 1.07–1.53). Risk of developing pre-eclampsia in June higher than in February (OR = 2.81, 95% CI: 2.06–3.83). No significant correlation between rainfall and pre-eclampsia rates (r = 0.265, p = 0.405) Dose-response gradient according to minimum temperature: Tmin ≤ 8.5 °C: OR = 1.00 (ref) 8.5 < Tmin ≤ 10.5 °C, OR = 0.904, 95% CI: 0.764;1.068 10.5 < Tmin ≤ 12.5 °C, OR = 0.964 95% CI: 0.813; 1.144 12.5 < Tmin ≤ 14.5 °C, OR = 0.897 95% CI: 0.709; 1.119 14.5 < Tmin ≤ 16.5 °C , OR = 0.615 95% CI: 0.527; 0.717 | |
| [20] | Seasonality of birth (month) Rainfall | Preeclampsia | Southern, Zimbabwe (T), January 1992–August 1995 | -Year divided monthly -Mean monthly precipitation | Multi-hospital based cohort study including 3 hospitals: Mpilo Hospital Gwanda Hospital Beitbridge Hospital | All pregnancies | Kruskal-Wallis-Test | -Mpilo Hospital N = 40,456 Preeclampsia cases: 3538 -Gwanda Hospital N = 4,880 Preeclampsia cases: 50 -Beitbridge Hospital N = 5,870 Preeclampsia cases: 49 | Preeclampsia rates increase at the end of the dry season and onset of rainy season with a statistically significant association for two out of three of the hospitals. Gwanda Hospital p = 0.077 Beitbridge Hospital p = 0.086 Mpilo Hospital p = 0.259 -Preeclampsia rates positively associated with mean monthly precipitation with incidence rates increasing during months of high precipitation | |
| [25] | Seasonality of birth (rainy vs. dry) | Caesarian for preeclampsia | Enugu, Southern Nigeria (T), 1996–2006 | Rainy season (April–October) vs. Dry season (November–March) | Hospital based cohort study | All caesarean deliveries due to preeclampsia | N/A | 1,579 caesarean deliveries | Among the eclamptics, 26 presented during the rainy season and four during the dry season (p < 0.05). | Rainy season runs from April to October (average rainfall 147–211 mm. The dry season extends from November to March (average rainfall 35–81 mm) No control population was considered for comparison |
| [45] | Seasonality of birth (4 seasons) | Preeclampsia | Zahedan, Iran, 2004–2007 | Season (Spring, Summer, Autumn, Winter) | Case—control study | Age 15–45 years and gravid 1–3 | Pearson’s correlation coefficient | 2,488 cases vs. 2,488 controls | Pre eclampsia (%) Spring, 38.7 Summer, 41.9 Autumn, 58.6 Winter, 48.4 | |
| [46] | Seasonality of birth (4 seasons) | Preeclampsia | Tehran, Iran, 2005–2006 | Hospital based case-control study | Women over 35 or below 18 years of age, history diabetes, chronic hypertension and renal disease, any drug use, multi-fetal pregnancy, smoking, erythroblastosis fetalis, and non-Iranian were excluded | Logistic regression | 318 pre-eclamptic vs. 318 control women | Odds ratio (95% confidence interval) Spring : reference Summer: 1.1 (0.7–1.6) Autumn: 0.8 (0.5–1.3) Winter: 2.1 (1.3–3.4) | ||
| [26] | Extreme temperature | Preeclampsia Gestational hypertension | Quebec, Canada (NT), January 1997–March 1999 | High temperature producing sweating in most people or low temperature obliging people to wear a coat, (never, rarely, often or always) | Case control | All women with singleton live births who had been employed since the first month of pregnancy, during at least 4 consecutive weeks and at least 20 h weekly, excluding those with several employments | Logistic regression | Preeclampsia cases = 102 Gestational hypertension cases = 92 Normotensive controls = 4,381 | Increased risk of Preeclampsia when exposed to extreme temperature (OR = 1.6, 95% CI: 1.0–2.6) No significant increase in risk of Gestational hypertension when exposed to extreme temperature (OR = 1.3, 95% CI: 0.8–2.2) | Age, Parity, history of abortion, body mass index, smoking during the last 3 months of pregnancy, education, and leisure-time physical activity during the first trimester of pregnancy |
| [47] | Seasonality of birth (month) | Preeclampsia | Negev, Israel (NT), 1988–2007 | -Year divided monthly | Hospital based cohort study | All singleton pregnancies | Time series Poisson regression | N = 203,462 Preeclampsia cases: 8,421 | Incidence highest in the winter months with OR = 1.31 (1.18–1.46) in December, OR = 1.33 (1.19–1.48) in January. and OR = 1.38 (95% CI 1.24–1.54) in February vs. lowest in the summer months (with Aug. as the reference) | Ethnicity (i.e., Jewish or Bedouin Arabs), maternal age, parity, gestational age at delivery, gender and birth weight |
| [30] | Seasonality of birth (month) Temperature Humidity Strong winds | Preeclampsia | Negev, Israel (NT), 1999 | -Daily overall differences of temperature and humidity, duration of strong winds (speeds of ≥5 m per second) | Hospital based cohort study | All pregnancies | Time series Poisson regression | N = 11,979 Preeclampsia cases: 109 | Preeclampsia rates increased with daily overall differences of temperature and humidity (p < 0.03), sharp variations in temperature with an average of 3-day lag (p < 0.003) and strong winds (p < 0.002) | |
| [22] | Seasonality of birth (4 seasons) | Preeclampsia | Texas, USA (NT), 2007 | -Year divided into seasons: winter (December, January, Febember), spring (March, April, May), summer (June, July, August), and fall (September, October, November). | Hospital based cohort study | All initial cases | Logistic regression | N = 312,207 Preeclampsia cases: 12,418 | -Odds ratios (95% CI) for delivery in the four season: Winter: reference Spring: 0.97 (0.92; 1.02) Summer: 0.96 (0.91; 1.01) Fall 0.94 (0.89; 0.99) | Maternal age, race, health insurance, co-morbidities |
| [21] | Seasonality of birth (month) | Preeclampsia (ICD-8 codes 637.4, 637.5, 637.6 , 637.7, 637.8 and 637.9) | Norway (entire country) (NT), 1967–1998 | - Year divided monthly | Population based cohort study | All women | Logistic regression | N = 1,869,388 Preeclampsia cases: 51,801 | Preeclampsia risk highest in winter months (October–January) with peak in December OR = 1.26, 95% CI 1.20–1.31) vs. August | Parity, maternal age, fetal gender, region, time period. |
| [41] | Seasonality of birth (4 seasons) | Preeclampsia (ICD-9 codes 642E and 642F) Gestational hypertension (ICD-9 codes 642D and 642X) | Uppsala, Sweden (NT), 1987–1993 | - Year divided into seasons: winter (December–February), spring (March–May), summer (June-August), or fall (September–November) | Hospital based cohort study | All nulliparous women aged 34 years or less | Logistic regression | N = 10,659 Gestational hypertension cases: 10,666 | Compared with winter, preeclampsia risk was significantly lower in summer (odds ratio = 0.68), p < 0.05. No significant association for gestational hypertension | Maternal smoking, age, height, education, place of birth, history of fertility, multiple pregnancy, type 1 and gestational diabetes, gender. |
| [48] | Seasonality of birth (month) | Preeclampsia (systolic blood pressure of 140–159 mm Hg and/or diastolic blood pressure of 90–109 mm Hg for the first time after 24 weeks of gestation and 2 random urine dipsticks of 1+ protein or 1 dipstick of 2+ protein) | USA (Boston, MA; Buffalo, NY; New Orleans, LA; New York–Columbia; Baltimore, MD; Richmond, VA; Minneapolis, MN; New York–Metropolitan; Portland, OR; Philadelphia, PA; Providence, RI; and Memphis, TN) (NT), 1958–1964 | - Day 75 (16 March), day 150 (30 May), day 225 (13 August), and day 300 (27 October) chosen as representative days, with day 1 (1 January) as the referent. | Hospital-based cohort study from Collaborative Perinatal Project | All singleton pregnancies identified women as non-Hispanic white or non-Hispanic black, who gave birth from 20-45 weeks of gestation, without chronic hypertension or elevated blood pressure at 24 weeks of gestation | Logistic regression | N = 39,710 Preeclampsia cases: 1,350 (3.4%) | - In white women, incidence highest in winter months (November, December, and January), and lowest in summer months (July, August, September) with a trough in mid-Aug (p < 0.05). - In black women, no association between month of delivery and preeclampsia risk (p = 0.81). | Parity, race/ethnicity, smoking, maternal age, delivery year, marital status, study site, gestational age at delivery |
| [19] | Seasonality of birth and conception (rainy vs. dry) Temperature Humidity Rainfall | Preeclampsia | Bangkok, Thailand (T), 2008–2009 | - Year divided into monsoon and dry seasons. - Daily mean maximum temperature, morning humidity and rainfall | Hospital based cohort study | Women without chronic hypertension, overt diabetes, renal or collagen vascular disease, or hyperthyroidism, history of irregular menstrual period within the past three months, or incomplete clinical data | Logistic regression | N = 7,013 Preeclampsia cases: 327 | Women who conceived in the dry season at greater risk to develop preeclampsia than those who conceived in the monsoon season (5.3% vs. 3.7%, adjusted OR 1.51; 95% CI 1.18–1.93). Preeclampsia rates of women who delivered in both seasons were not significantly different: 5.0% in the dry season vs. 4.3% in the monsoon, p = 0.178 | Age, parity, BMI, pre-pregnancy weight, pregnancy weight gain, gestational diabetes mellitus, smoking status Monsoon season significantly associated with humidity (77.0% vs. 68.7%,) and rainfall (196.5 mm vs. 37.0 mm), but not with mean maximum temperature (37.0 °C vs. 38.1 °C) |
| [14] | Seasonality of conception (month) | Preeclampsia (ICD-9 642.4, 642.5, 642.6 or birth record indication of preeclampsia and/or eclampsia) | WA (entire state), USA (NT), 1987–2001 | Year divided monthly | Population based cohort study | Primiparous who gave birth to a singleton live infant; excluding those with pre-existing hypertension, renal disease, diabetes mellitus or missing date of conception | Multi-variable logistic regression | N = 79,298 Preeclampsia cases: 6,680 | Lowest incidence among women who conceived during November (7.8%) and January (7.7%) and highest among those who conceived in April and July (both 8.9%). After adjustment, incidence rates significantly higher among women conceiving in February and April through August vs. January: 1.14–1.19). | Last Menstrual Period (LMP) year, maternal age, race/ethnicity, marital status, education, prenatal care timing, smoking, alcohol, weight at LMP |
| [15] | Seasonality of conception and birth (month) | Preeclampsia | Burlington, VT, USA (NT), 1 January 1995–1 July 2003 | - Year divided monthly and seasonally in 3-month blocks based on conception and delivery | Hospital based Case control study | All women with singleton pregnancies | Logistic regression | N = 7,904 Preeclampsia cases: 142 | No significant association of month (p = 0.2) of delivery with the risk of preeclampsia: winter 2.0%, spring 2.2%, summer 1.4%, fall 1.4% Significant association of month of conception (p = 0.003) with risk of preeclampsia with the highest risk in summer 2.3% (OR = 1.7; 95% CI 1.06, 2.75) compared with spring 1.4%, fall 1.7% and winter 1.6%. | Maternal age, race/ethnicity, fetal sex, diabetes mellitus, chronic hypertension, chronic renal disease, thrombophilia |
| [18] | Seasonality of conception (month) Heat Index (function of temperature and humidity) | Preeclampsia | Hong Kong, China (NT), 1995–2002 | - Year divided into four seasons: spring (March–May), summer (June–August), autumn (September–November), winter (December–February) - Daily maximum temperature and relative humidity (Heat Index) averaged by month | Hospital based case control study | All singleton primiparous pregnancies excluding those with chronic hypertension, renal disease, pre-existing diabetes mellitus, or SARS | Logistic regression Cross correlation function | N = 15,402 Cases: 245 | Conception during summer associated with a higher risk as compared with autumn (2.3 vs. 1.6%, OR 1.7, 95% CI 1.2–2.5) with highest rates in June (OR 2.8, 95% CI 1.5–5.2). - Monthly incidence of pre-eclampsia positively associated with heat index at the time of conception time lag by 2 months (r = 0.78, 95% CI 0.36–0.93). | Adjusted for maternal age and fetal gender |
| [16] | Seasonality of conception (month) Sunlight | Pregnancy induced hypertension (PIH) Early-onset preeclampsia (delivery by ≤34 weeks) Late-onset preeclampsia (delivery after 34 completed weeks) | New South Wales, Australia (NT), January 2000–December 2005 | -Year divided into seasons: Winter (June–August), Spring (September–November), Summer (December–February), Autumn (March–May) -Monthly means of daily solar radiation | Hospital based cohort study | All singleton pregnancies but superimposed preeclampsia (on preexisting hypertension) excluded | Pearson correlation coefficients | N = 424,732 Pregnancy hypertension cases: 34,828 Preeclampsia cases: 11,902 | - PIH rates lowest for autumn (7.3%) and highest for spring (8.9%) conceptions - Early-onset preeclampsia rates lowest for pregnancies conceived in November December (0.26%) and highest for pregnancies conceived in April (0.39%). - Late-onset preeclampsia rates lowest for conceptions in May/June (2.2%) and highest in October-February (2.6%). - PIH strongly and positively correlated (r = 0.67) with solar radiation at 1 month after conception. - Increased sunlight before delivery associated with decreased PIH (r = −0.67) - Sunlight around conception inversely associated with early onset preeclampsia (r = −0.51; p = 0.09). - No association between sunlight and late onset preeclampsia. | None |
| [24] | Seasonality of birth (rainy vs. dry) Temperature Humidity Rainfall Barometric Pressure | Preeclampsia Eclampsia | Mumbai, India (T), March 1993–February 1996 | - Year divided into two seasons: Monsoon (June–August) Dry (September–May) - Daily temperature, humidity, rainfall and barometric pressure averaged by season | Hospital based cohort study | Only pre-registered patients, who have received antenatal care at hospital | Chi Square Mann-Whitney and Fisher’s Exact Test | N = 29,562 Preeclampsia cases: 1,238 Eclampsia cases: 34 | - No association between meteorological and preeclampsia incidence and rates did not differ between the monsoon and the dry season (4.3% vs. 4.2%, p = 0.5, respectively) - Eclampsia incidence significantly higher in the monsoon (0.2% vs. 0.08%, p = 0.01). | Monsoon was cooler (median maximum temperature 30.7 °C vs. 32 °C, p = 0.01), more humid (median relative humidity 85% vs. 70%, p = 0.0008), and received higher rainfall (median 504.9 mm vs. 0.3 mm, p = 0.0002) than the rest of the year. Median barometric pressure during the monsoon (1,005 mb) significantly lower than the rest of the year (1,012 mb, p < 0.0001) |
| [31] | Seasonality of birth (4 seasons) Temperature Rainfall Sunlight | Preeclampsia Eclampsia | Rasht, Iran (NT), 1991–2001 | - Year divided into seasons: (spring, summer, autumn and winter) - Mean seasonal temperature, rainfall, and hours of sunlight | Hospital based cohort study | All women referred to Gynecologic ward with a gestational age more than 20 weeks | Chi-square test | N = 12,142 Preeclampsia cases: 397 Eclampsia cases: 17 | - No association between preeclampsia or eclampsia and season of birth although the highest rate of preeclampsia was in spring (3.6%), and the lowest rate was in summer (3%). - No association between meteorological variables and preeclampsia or eclampsia. | Parity, maternal age The mean temperatures of spring, summer, autumn and winter in these three years were 18.36, 25.56, 14.61 and 7.47 centigrade, respectively. |
| [37] | Seasonality of birth (rainy vs. dry) Temperature Rainfall | Eclampsia | Abuja, Nigeria (T), March 2000–March 2005 | - Year divided into rainy season (late April–October) and dry season (November–early April) - Monthly average temperature & precipitation | Hospital based cohort study | All pregnancies | Monthly incidence comparison | N = 5,987 Eclampsia cases: 46 | Thirty-one eclamptics (67.4%) admitted during the rainy season and fifteen (32.6%) during the dry season. Increased risk of eclampsia in the rainy season compared to the dry season. Greater risk of Eclampsia when temperature is low and rainfall is high | None No information is provided on the temporal distribution of control pregnancies |
| [40] | Seasonality of birth (month) Temperature Barometric pressure Humidity | Eclampsia | Maputo City, Mozambique (T), 1984 | -Year divided monthly -Monthly averages of temperature, humidity and atmospheric pressure | Hospital based cohort study | All women | Linear regression | N = 37,469 Eclampsia cases: 70 | Eclampsia incidence rates inversely associated with temperature (R = −0.78, p < 0.05) and atmospheric pressure (p < 0.001) Highest incidence for delivery in coldest months of June-August (0.31%); lowest in warmest months December-February (0.10%). No significant association with humidity | None |
| [35] | Temperature Humidity | Eclampsia | Hyderabad, India (T), September 1987–August 1988 | Mean monthly temperature and relative humidity | Hospital based cohort study | N/A | Pearson’s correlation coefficient | N/A | Eclampsia incidence positively associated with humidity (R = 0.74, p < 0.01) and inversely associated with temperature (R = −0.77, p < 0.01) | |
| [49] | Seasonality of birth (4 seasons) | Eclampsia (“Severe preeclampsia”) | Thessaloniki, Greece (NT), 2008–2011 | Season | Hospital based cohort study | Patients with mild preeclampsia or chronic hypertension were excluded | Unpaired t-test | N = 12,722 deliveries, including 94 “severe preeclampsia” cases | Higher incidence during the summer but not statistically significant (p = 0.12) Incidence: Summer 0.90% Autumn 0.67% Winter 0.61% Spring 0.76% | |
| [36] | Seasonality of birth (4 seasons) | Eclampsia | Peshawar, Pakistan (NT), 2007–2009 | Season | Hospital based cohort study | Pregnant patients with other convulsive disorders and more than 7 days postpartum excluded | N/A | N = 23,000 including 108 eclampsia cases | Higher number of eclampsia cases in the winter: Autumn 17.59% Winter 34.25% Spring 26.85% Summer 21.29% | |
| [38] | Seasonality of birth (months) Humidity Rainfall Monthly variation | Eclampsia | Accra, Ghana (T), 1991 | Amounts and number of days of monthly rainfall | Hospital based cohort study | All pregnancies managed at Korle Bu Teaching Hospital | N = 10,301, including 134 eclampsia cases | More cases of eclampsia in the months in which the rainfall was high and the relationship was more associated with the number of days of rainfall than the monthly amount of rainfall. | Patients had blood samples tested for malaria parasites and none was positive. | |
| [17] | Seasonality of conception (4 seasons) | Preeclampsia | Urmia, Iran (NT), 2007–2008 | Year divided into four seasons: spring, summer, autumn, winter | Hospital based cohort study | Single pregnancies, no history of hypertension, coagulative or renal disease or anti phospholipids syndrome | T-test, Fisher test, Chi Square test | N = 2,824 n = 166 preeclampsia cases | - Preeclampsia incidence was higher following conception during warm seasons (spring and summer) p = 0.038 - temperature at conception non significantly higher in preeclampic women | |
| [39] | Seasonality of birth (month) Temperature Humidity | Eclampsia | Karachi, Rawalpindi, Peshawar, and Quetta, Pakistan (NT, T), 1996 | - Year divided monthly by region -Mean monthly temperature and humidity | Multi-hospital based cohort study of 4 hospitals: Jinnah Post Graduate Medical Centre, Sandeman Hospital Quetta, Holy Family Hospital, Lady Reading Hospital Peshawar | All pregnancies | Pearson’s correlation coefficients | N = 18,483 Eclampsia cases: 395 | - Jinnah Post Graduate Medical Centre: Eclampsia rates highest in summer months April–September. Eclampsia rates not significantly correlated with temperature (r = 0.21). - Sandeman Hospital Quetta: Eclampsia rates highest in winter months with two peaks in May and August. Eclampsia rates not significantly correlated with temperature (r = 0.03). - Holy Family Hospital: Eclampsia rates highest in summer (May–September) Eclampsia rates positively correlated with temperature (r = 0.74, p < 0.01). - Lady Reading Hospital Peshawar: Eclampsia rates highest in winter months as well as summer with a peak in May–July. Eclampsia rates not significantly correlated with temperature (r = 0.42) - No association with humidity | None |
| [34] | Seasonality of birth (4 seasons) Sunlight | Eclampsia | Sweden (NT), 1990–1994 | - Year divided into winter (December–February), spring (March–May), summer (June–August) and autumn (September–November) - Mean daily hours of sunlight | Population based cohort study | All singleton pregnancies | Logistic regression | N = 482,759 cases: 182 | Incidence of eclampsia nearly doubled during the winter season as compared to other seasons (reference). Summer OR 1.1; 95% CI (0.7–1.7)
vs. winter OR 1.9 95% CI (1.3–3.0). - Eclampsia rates inversely associated with sunlight hours | Smoking, maternal age, parity, region and fetal gender. |
| [33] | Seasonality of birth (month and season) | Eclampsia | Jodhpur, India (T), January−December 2001 | Month Season (winter from December to February, Dry summer from March to May, Monsoon from June to September and Post monsoon from October to November) | Hospital based cohort study | All women delivering at hospital during study period | Incidence rate and incidence ratio | N = 12,170 n = 197 eclampsia cases | - Incidence of eclampsia was highest in monsoon season (2.05%) and winter season (1.70%) (p = 0.048) and a minimum in summer (1.22%) | None |
| [43] | Temperature, Atmospheric pressure Humidity | Blood pressure | Miyagi Prefecture, Japan 2006–2007 | Daily minimum, maximum and mean outside temperatures, daily mean atmospheric pressure, relative humidity and duration of sunshine | Panel study | Healthy pregnant women | Linear mixed model with individuals as a random effect. | 101 | A 10 °C increase in daily minimum outdoor temperature reduced blood pressure by an average of 2.5 mmHg Atmospheric pressure positively and humidity inversely associated with blood pressure. No association with sunshine | Gestational age When two meteorological parameters were entered into the same model, only the effect of daily minimum outside temperature remained significant |
| [42] | Seasonal variation | Blood pressure | Pittsburgh, PA (USA) 1997–2001 | Month of measurement | Hospital base panel study | Women without spontaneous abortion, ectopic pregnancy or other adverse event, chronic hypertension , another pre-existing medical complication (n = 17), unknown pregnancy outcome, multiple gestation | Generalized estimating equations | 1,919 | Blood pressure declined steadily from January to August and rose August through December. After adjusting for gestational age, year, prepregnancy BMI, race, and multiparity, systolic blood pressure was 1.0 to 1.7 mm Hg higher from January to May, 0.6 mm Hg higher in September and October, and 0.8 mm Hg higher in November and December compared with August. Similar but not statistically significant seasonal trends were seen in diastolic blood pressure | Gestational age, year, prepregnancy BMI, race, and multiparity, |
3.2. Findings from Length of Gestation Including Preterm Birth

| Reference | Seasonal or Meteorological Variable | Outcome | Setting (climate type a), study period | Exposure metric | Study Design | Inclusion criteria | Statistical method | Population size | Summarized Main Results | Confounders adjusted for/other comments |
|---|---|---|---|---|---|---|---|---|---|---|
| [64] | Seasonality of birth (month) Temperature Humidity Wind | Preterm birth (<37 gestational weeks) Preterm premature rupture of membranes | Negev, Israel (NT), 1999 | - Monthly mean relative minimum humidity and mean daily overall differences of relative humidity - Monthly mean temperature and daily overall differences of temperature - Number of days with strong winds | Retrospective cohort study | All deliveries before 37 completed weeks of gestation | Time series Poisson regression | N = 11,979 992 (8.3%) preterm 862 (7.2%) were complicated with PPROM | Preterm birth incidence: highest in June and December and positively associated with monthly mean relative humidity and maximum temperature (p < 0.01). - Positively associated with semiannual (p < 0.02) and seasonal (p < 0.05) variations of windIncreased rates of preterm delivery preceded sharp variations of relative humidity and maximum temperature by 3 days (p < 0.01). | |
| [57] | Seasonality of birth (according to period of ice storm) | Preterm birth (<37 gestational weeks) | Québec, Canada (NT), 1993–2003 | Three periods (1993–1997, 1998 and 1999–2003, the referent period) corresponding to intervals prior to the storm, the year of the storm, and well after the storm | Population based study | Singleton live born infants from the Québec birth file; gestational age is confirmed with ultrasound examinations | Logistic regression | N = 855,320 | - 28% higher odds of preterm birth for 1998 relative to 1999–2003 in areas affected by an ice storm | Region, time period, education level, maternal age, marital status, parity, maternal birth place |
| [69] | Temperature Heat waves | Preterm birth (early preterm (22–32 weeks) and late preterm (33–36 weeks)) | Rome, Italy (NT), 2001–2010 | - Daily maximum apparent temperature (MAT, index including both air and dew-point temperatures) during the warm season (April–October) - Daily minimum temperature (TMIN) in the cold season (November–March) lag 0–2 days selected for final analysis (from up to 30 days) - Heat waves (at least two consecutive days with MAT above the monthly 90th percentile or TMIN above the monthly 90th percentile and MAT above the median monthly value) | Hospital based cohort study | Exclusion of multiple births, all cesarean sections where spontaneous onset of labor was not reported, labor inductions, births referred with congenital malformations, and stillbirths, mothers younger than 11 years or older than 55 years | Times series analysis (Poisson generalized additive model conducted separately for cold and warm Seasons) | 132,691 births, 7,259 (5.5%) of which were preterm | For the warm season: - increase of 1.9% (95% confidence interval 0.86–2.87) in preterm births per 1 °C increase in maximum apparent temperature in the 2 days preceding delivery - increase of 19% (95% CI 7.91–31.69) in preterm births during heat waves During the cold season, temperature had no significant effect When stratifying the analysis by gestational-week categories, the effect of temperature was only significant for late preterm births (late preterm: 1.93% change, 95% CI 0.88; 2.98; early preterm: −1.02% change, 95% CI −2.46; 45) | Long term trend, seasonality holiday, influenza in winter, particles with aerodynamic diameter of 10 µm or less, ozone, and nitrogen dioxide in the month preceding delivery No modification of the temperature effect by ozone was observed |
| [68] | Heat wave | Preterm birth (<37 weeks of gestation) | Brisbane, Australia (NT), 2000–2010 | - 9 definitions of heat waves according to combinations of daily maximum temperature exceeding the 90th, 95th, and 98th percentiles of daily maximum temperature distribution of the study period for at least 2, 3, or 4 consecutive days during the last gestational weeks before delivery. | Population based study using birth certificates | Spontaneous singleton live births Warm season (between November and March) and cold season (November–March) | Cox-proportional hazards model | N = 154,785 including 50,848 preterm | - Hazard ratios of preterm birth ranged from 1.13 (95% CI: 1.03–1.24) to 2 (95% CI: 1.37–2.91) compared to women unexposed to at least one heat wave in warm season Results changed to some extent when different air pollutants were added into the model separately | Particulate Matter < 10 µm in diameter, nitrogen dioxide, ozone, carbon monoxide Sex and weight of baby, onset of labor (spontaneous, induced, and caesarean), mother’s residential area (postcode), maternal age, marital status, indigenous status, parity, year, month neighborhood socioeconomic level |
| [63] | Temperature | Preterm birth (<37 gestational weeks) | CA (16 counties), USA (NT), May–September 1999–2006 | - Daily mean, maximum and minimum apparent temperature during the warm season (1 May to 30 September) | Population-based cohort of 16 counties | All cases of preterm birth from a state registry of births | Case-crossover (logistic regression) | N = 58,681 | - Significant positive association between apparent temperature and preterm birth with effect estimates significantly elevated for up to 6 days lags, a weekly average of apparent temperature being the best predictor. - No association for full-term births (37–44 weeks) | Air pollutants: Particulate matter with aerodynamic diameter <2.5 mm , ozone, nitrogen dioxide, carbon monoxide, and sulfur dioxide |
| [66] | Seasonality of conception and birth (4 seasons) Temperature | Preterm birth (<37 gestational weeks) | Brandenburg, Germany (NT), 2002–2010 Saxony, Germany (NT), 2005–2009 | - Year divided into seasons: winter (December–February), spring (March–May), summer (June–August), autumn (September–November) - Daily mean temperature averaged on the first month, first trimester and last week of pregnancy | Time series analysis | All singleton births ≥ 20 weeks and ≤ 37 weeks of gestation with birth weight greater than 200 g | Time series logistic regression Fourier series | Brandenburg N = 128,604, including 8,717 preterm Saxony N = 162,913, including 10,277 preterm | - Weak association between preterm birth and conception in spring in Brandenburg (OR = 1.08, 95% CI 1.01–1.15) - Weak association between preterm birth and season of birth in winter in Saxony (OR = 1.07, 95% CI 1.01–1.13) - No association between preterm birth and temperature in Brandenburg in first trimester (OR = 0.94, 95% CI 0.85–1.04), second trimester (OR = 0.97, 95% CI 0.84–1.12), or third trimester (OR = 1.00, 95% CI 0.93–1.08) - No association between preterm birth and temperature in Saxony in first trimester (OR = 1.03, 95% CI 0.94–1.14), second trimester (OR = 1.06, 95% CI 0.94–1.21), or third trimester (OR = 1.00, 95% CI 0.94–1.07) | Maternal age available for Saxony only No adjustment was made for air pollution, hypertensive disorders of pregnancy or infections. |
| [75] | Seasonality of conception (4 seasons) | Preterm birth (<37 gestational weeks) | NC (entire state), USA (NT), 2001–2005 | Year divided into seasons: winter (December–February), spring (March–May), summer (June–August), and fall (September–November) | Retrospective cohort study | Singleton first births to non-Hispanic white and black women, excluding births with missing covariate data, congenital anomalies, birth weight < 400 g, extreme gestational age, and maternal age > 44 years | Logistic regression | N = 188,276 | Spring conceptions had the highest rates of preterm birth among non-Hispanic white births (p < 0.05). Among non-Hispanic black summer conceptions had the highest rate of preterm birth (p < 0.05). | Maternal age, education level, marital status, smoking status, region of North Carolina, county urbanization |
| [76] | Seasonality of birth (month) | Preterm birth (<37 gestational weeks) | Japan (entire country) (NT) January 1979–1983 | Seasons: spring (March–May), summer (June–August), autumn (September–November), and winter (December–February). -rainy season (June–July) and typhoon season (August–October) | Retrospective cohort study | N/A | Time series regression | N = 7,665,006 | Preterm, term, and post term all have a similar appearance with two peaks in winter and summer (or rainy season), and with two troughs in spring and autumn. | |
| [51] | Seasonality of conception (month) | Preterm birth (<37 gestational weeks) Very preterm birth (<32 gestational weeks) | Pittsburgh, PA, USA (NT), 1995–2005 | Conception date was grouped by month of the year or by season: winter (December, January, February), spring (March, April, May), summer (June, July, August) and autumn September, October, November) | Retrospective cohort hospital based study | All births with available length of gestation information were included | Fourier series | N = 83,059 | -Preterm birth associated with conception season (p < 0.05). Peak incidence occurred in winter and spring an average trough among late summer/early autumn conceptions -Similar pattern for very preterm birth (p < 0.05) | Parity, race/ethnicity, smoking, maternal age, delivery year, marital status, study site, |
| [61] | Seasonality of birth (month) temperature | Preterm birth (<37 gestational weeks) | Japan (entire country) (NT), 1979–1983 | Month of birth Monthly mean temperature | Retrospective cohort study | N/A | Time series, Box-Jenkins autoregressive integrated moving average model | N = 7,675,006 | For Japan the seasonality shows two peaks in the summer and the winter. The winter peak is most prominent in the North, the winter peak most prominent in the South The average risk of preterm births in winter is inversely correlated with mean temperature (r = −0.424, p < 0.01) The average risk of preterm births in summer is positively correlated with mean temperature (r = 0.549, p < 0.01) | Average maternal age, subsequent/first birth ratio, infant mortality rate, total fertility rate, population density, prefectural per capita income, and number of hospital beds and doctors per 100,000 inhabitant |
| [32] | Seasonality of birth (rainy/dry) | Preterm birth (<37 gestational weeks) | Lombok, Indonesia (T), 2001–2004 | Rainy season (November–March) | Double blind cluster randomized controlled trial | All singleton live births with birth weight measured within 72 h of birth | Hierarchical logistic regression | N = 14,040 | No significant association between preterm birth and the rainy season, p-value = 0.14, OR = 0.94, (0.87–1.01) | Infant’s sex, mothers’ residence, nutritional status, education, household wealth, mid-upper arm circumference, height, birth order and pregnancy interval |
| [58] | Seasonality of birth (month) | Preterm birth (<37 gestational weeks) | Keneba, Manduar, and Kantong Kunda, The Gambia (T), 1976–2003 | -Year divided monthly | Retrospective cohort study | All live births in 3 subsistence-farming villages of the West Kiang District | Fourier series | N = 1,916 | Preterm birth showed 2 peaks—in July (17.2%) and October (13.9%) | Malarial infection, maternal workload |
| [54] | Seasonality of birth (4 seasons) Temperature | Preterm birth (<37 gestational weeks) Gestational Length (continuous variable) | Greece (entire country) (NT), 1999–2003 | -year divided into four seasons: winter (December–February), spring (March–May), summer (June–August), and autumn (September–November) -mean air temperature during birth month | Retrospective cohort study using birth registries | All Greek citizens born between the years 1999-2003 and all Greek citizens who died between the period. | General log-linear regression | N = 516,874 | Incidence rates of fetal growth restriction and premature birth statistically lower (p < 0.05) for infants born during the autumn and winter than other seasons. -Mean ambient temperature during the month of birth in the infant database inversely correlated with gestational age (r = −0.22, p < 0.001) | Bonferroni correction |
| [56] | Seasonality of birth (month) | Preterm birth (<37 gestational weeks) | USA (entire country) (NT, 1989– 2001) | Year divided into months: | Population-based cohort study | All birth certificates included | Linear regression | 52,041,052 | Early spring and late summer births are less likely to be premature | |
| [52] | Seasonality of birth (rainy/dry) | Preterm birth (<37 gestational weeks) Gestational length (continuous variable) | Harare, Zimbabwe (NT), 1996–1997 | Year divided into seasons: early (June–August) and late (September–November) dry, and early (December–February) and late (March–May) rainy | Randomized, controlled multi-micronutrient trial | All women between 22 and 36 weeks gestation | Linear regression | N = 1,669 | Those born in the early dry season had a 2·3 (95% CI: 1·7; 2·8) weeks shorter gestation than those born in the late rainy season. Those born in the early rain season had a −0.8 (95% CI: −1.3; −0.3) weeks shorter gestation | HIV infection, malaria parasitaemia |
| [59] | Heat Index (function of temperature and humidity) | Gestational length (continuous variable) | Barcelona, Spain (NT), 2001–2005 | Three daily indicators of extreme values of heat index (HI) percentile 90, 95 and 99) | Retrospective hospital cohort study | All deliveries excluding multiple births (n = 150), elective (n = 553) and emergency (n = 282) cesarean sections, labor inductions (462), and mothers referred for obstetrical pathology (n = 159) | First stage: a dynamic model was fitted to predict log-transformed region wide monthly average of gestational age Second stage: linear regression | N = 7,585 | - non significant reduction (0.2 day) in average gestational age associated with an HI95 episode on the day of delivery –HI90 episode on the day before delivery associated with a 1-day reduction in average gestational age -more extreme HI95 episode on the day before delivery associated with a 2-day average gestational age reduction, - most extreme condition (HI99) associated with a 5-day average gestational age reduction | Ethnicity, maternal education level, parity, maternal history of preterm birth, use of assisted reproductive technique, maternal infection, maternal age, smoking status, occupational status, maternal diabetes, maternal obstetrical-gynecological pathology, infant sex |
| [50] | Season of conception (month) | Gestational length (continuous variable) | NJ (entire state), USA (NT), 1997–2006, New York, NY, USA (NT), 1994–2004 PA (entire state), USA (NT), 2004–2010 | Month of birth | Population based cohort | Single births with nonmissing information on gestation length | Cohort study based on comparison between siblings | N = 1,435,213 | The gestation length decreases from conception in January to May and jumps back to the January level for conception in June. A May decrease in gestation length by 0.8 wk leads to a 13% increase in premature births | Stable maternal characteristics (by design) Influenza Strong correlation of gestation length and the prevalence of influenza (the correlation coefficient is −0.71) |
| [71] | Temperature, Humidity Barometric pressure | Labor onset or premature rupture of membranes (time of parturition) | Evanston, IL, USA (NT), summer, fall, and winter of 2001 | - hourly barometric pressure, temperature, and humidity (with lags of 0, 1 or 2 days) | Retrospective hospital cohort study | All patients delivering at hospital after spontaneous labor or rupture of membranes at ≥20 weeks of gestation | Logistic regression. E | N = 1,088 | None of the individual weather variables identified as a statistically significant predictor of labor onset or premature rupture of membranes | Maternal age, gestational age, parity, multiple gestation and intrauterine infection |
| [60] | Temperature | Gestational length (continuous variable) | Illinois, USA (NT), June–August 1995 | - daily maximum apparent temperature during the warm season (June–August) 0-, 1- and 2-day lag explored | Population-based cohort study | All singleton vaginal births | t tests for difference in means between categories of maximum apparent temperature: <90° F, 90 to 99° F, 100 to 109° F ≥ 110° F | N = 11,972 | No evidence that increasing maximum apparent temperature was associated with shortened gestation length. | Maternal race/ethnicity, educational status and community area median household income |
| [53] | Seasonality of birth (month) | Gestational length (continuous variable) | Japan (entire country) (NT), January 1974–December 1983 | - Year divided into seasons: spring (March–May), summer (June–August), autumn (September–November), and winter (December–February). | Time series analysis | All live singletons | Time series, analysis of variance | N = 16,796,415 | Seasonal heterogeneity of mean gestational period (p < 0.001): two peaks for infants born in October and February–March, a deep trough in winter and a smaller one in June–September | |
| [55] | Seasonality of birth (one statement on winter month VS rest of the year) | Gestational length (continuous variable) | Denmark (NT), 1973–1994 | - Year divided monthly with two adjoining 10-year secular trends as independent variables. | Population based cohort study | All children born within study period | Linear regression analysis | N = 1,166,206 | Gestational ages of children born in December, January, and February were on average 1 day shorter than for children born in other months | |
| [65] | Temperature Humidity Precipitation Sunlight Barometric pressure | Preterm birth (<37 gestational weeks) | London, UK (NT), 1988–2000 | -Year divided monthly -Daily temperature, rainfall, sunshine, relative humidity, barometric pressure, and largest drop in barometric pressure Cumulative exposure from 0 to 6 days before births explored | Time series analysis | All infants excluding those born before 24 weeks of gestation, weighing 200 g or less, and infants with congenital anomalies | Time-series regression | N = 482,765 | - 10% (95% confidence interval 7%–14%) increase in risk of being born preterm in winter when compared with summer - no increased risk associated with exposure on the day of birth to daily mean levels of maximum and minimum temperatures, relative humidity, precipitation, hours of daily sunshine, mean barometric pressure or the largest daily drop in barometric pressure | Adjusting for public holidays, seasonality, day of the week and between year variations Daily mean levels of ambient ozone and particulate matter with aerodynamic diameter <10 micrometers; on the day of birth, cumulative exposure up to 1 week |
| [67] | Heat Index (function of temperature and humidity) | Preterm birth (<37 gestational weeks) Preterm labor | New York, NY, USA (NT), 21 March 1993–20 March 1994 | -weekly averaged heat-humidity indexes (2 summer and 2 winter weeks that showed the with highest and lowest heat-humidity index values for each season) | Retrospective hospital cohort study | Excluded twins, patients with cerclage, and deliveries induced prematurely for obstetrical complications | Exact trend test | N = 3,972 | - The preterm labor rate increased from 1.23% to 3.0% for an increase of heat-humidity index from 25 to 79.5 degrees F, p < 0.002) - For all preterm births, similar but not statistically significant trend (p < 0.29) | [67] |
| [62] | Temperature | Preterm birth (extreme immaturity (<28 completed weeks of gestation) and preterm birth (28–36 completed weeks)) | Brisbane, Australia (NT), 2005–2009 | - weekly mean temperature and relative humidity in the 4 weeks or the week preceding the time at risk From week 15 of gestation to birth | Hospital cohort study | All births with conception dates ranging from 19 weeks before the cohort study to 43 weeks before it ended | Cox proportional hazards model with gestational age as the time axis | N = 101,870 | The hazard ratio for a live preterm infant (28–36 weeks) was 1.20 at 27 °C as compared with the reference temperature of 21 °C. - Humidity adjusted for but no results reported. | Particulate matter with aerodynamic diameter <2.5 µm and <10 µm, ozone, nitrogen dioxide, carbon monoxide and sulfur dioxide; sex of the infant, maternal age, smoking, marital status, indigenous status, preeclampsia and gestational hypertension). |
| [77] | Seasonality of birth (month) | Preterm birth (<37 gestational weeks) | Greece (entire country) (NT), 1980-2008 | Month of birth - winter (December–February) - summer (June–August), - fall (September–November) - spring (March–May). | Retrospective cohort study | live births at or beyond 24 gestational weeks | Time series Logistic regression | 3,217,738 births 15,150 (4.71%) premature | Preterm births risk higher during the winter and summer months | Maternal age, sex |
| [73] | Barometric pressure | Labor onset | Massachusetts, USA (NT), October 1993–October 1994. | - Daily mean barometric pressure (lowest tercile compared with the other two terciles) 3 consecutive hours of falling or rising barometric pressure | Retrospective hospital cohort study | All women with spontaneous onset of labor between 37–42 weeks | Least squares regression comparing onsets of labor occurring in the lowest tercile of daily mean pressure compared to other terciles | N = 2,435 | No significant difference in spontaneous onset risk between days with high or low pressure Significant decrease in the onset of labor after 3 consecutive hours of falling, but not rising, pressure | Parity, date and time of onset of contractions, date and time of spontaneous rupture of membranes, date and time of delivery, sex of infant, type of delivery |
| [72] | Barometric pressure | Labor onset Premature rupture of membranes | Tokyo, Japan (NT), January 1997–December 2003 | - Averaged (daily?) barometric pressure assigned women to two groups (>1010.7 hPa or <1010.7 hPa at delivery) | Retrospective hospital cohort study | All infants who had a spontaneous cephalic delivery in this hospital | Paired t test or Wilcoxon’s signed rank test | N = 2,278 | - No significant association between onset of labor and barometric pressure. - Increase in the number of rupture of the membranes at lower than 1,010.7 hPa (p < 0.01). - Increase in the number of deliveries on days with larger changes in barometric pressure (decreasing or increasing), (p < 0.01). | Membrane rupture, maternal age, fetal gender, parity, birth weight, gestational age |
| [74] | Barometric pressure | Labor onset | Texas, USA (NT), 1992 | - rapid decrease in barometric pressure defined as drop of 0.06 inches of mercury in 24 h | Retrospective descriptive study | All births 36 weeks of gestation or more, spontaneous onset of labor, delivered at hospital during 24 h before/after pressure drop | Chi square test | N = 162 | - Significantly more occurrences of labor after drop in barometric pressure than before (p = 0.02) | None |
3.3. Findings from Birth Weight


| Reference | Seasonal or Meteorological Variable | Outcome | Setting (climate type a), study period | Exposure metric | Study Design | Inclusion criteria | Statistical method | Population size | Summarized Main Results | Confounders adjusted for/other comments |
|---|---|---|---|---|---|---|---|---|---|---|
| [81] | Season of birth (month) | Term birth weight (continuous variable) | Warsaw, Poland (NT), May 2004-April 2005 | - Year divided into four seasons: Spring (April–June); Summer (July–September); Autumn (October–December) and Winter (January-March) | Hospital based cohort study | All singleton live births after 36 weeks of pregnancy | One way analysis of variance of birth weight transformed to z score Weighted Spearman rank correlation | N = 10,631 | - Average Z-scores for birth weight associated with month of birth for boys (p = 0.01) respectively, and for girls (p < 0.01). - Peak Z-score values for boys born in October with a trough in March. Peak Z-score values for girls born in July and August with a trough in April. -No association between birth weight and season of birth. | None |
| [78] | Seasonality of conception (month) Temperature Humidity Rainfall Daylight | Term birth weight (continuous variable) | Istanbul, Turkey (NT), 1992–2003 | - Women were divided into four groups according to season of last monthly period - Year divided into four seasons: Spring, Summer, Autumn and Winter - Mean daily temperature (°C) and humidity (%), total daily rainfall (mm) and daily duration of daylight (hours) for each trimester of pregnancy | Hospital based cohort study | All live births after 36 weeks of gestation, except multiple pregnancies | Stepwise multiple linear regression | N = 3,333 | - Women who conceived in winter and spring were exposed to higher temperatures during the second trimester and delivered babies with higher birth weights than those who conceived in summer and autumn. Regression parameter for “Temperature to which the subject was exposed during the second trimester (°C)”: 0.001 multiples of the mean. The mean being about 3,700 g, The gain would be about 3.7 g per °C.) - No association between birth weight and humidity, rainfall, and daylight in any trimester. | maternal age and parity, mode of delivery, sex |
| [80] | Seasonality of birth (month) Rainfall Sunshine Temperature | Term birth weight (continuous variable) | Northern, Ireland (NT), 1971–1986 | - Year divided monthly -Mean daily maximum and minimum temperatures, rainfall, and hours of bright sunshine for each pregnancy trimester | Population based cohort study | Singleton live births after 36 completed wks of gestation | Linear regression | N = 418,817 | - The lowest adjusted mean birth weights were 25.5 g, 29.6 g, and 31.6 g lower in May, June, and July, respectively, than in January - In females, an increase of 1 °C in the mean daily maximum temperature during the second trimester was associated with an increase in mean birth weight of 3.5 g. (SE 0.88) -In males 1.02 (SE 0.88) -No significant association for other trimesters or for rainfall, sunshine, or mean daily minimum temperature | -Year of birth, duration of gestation, maternal age, number of previous pregnancies, sex, and social class |
| [89] | Seasonality of birth (rainy vs. dry) | Term birth weight (continuous variable) Term low birth weight (<2,500 g) | Morogoro, Tanzania (T), | N/A | Hospital based cohort study | All live singleton babies at full term gestation | N/A | N = 19,783, including 2,354 low birth weight infants | - Mean birth weight low during the rainy season and high during the dry season - Low birth weight incidence higher during the rainy than the dry season | Food intake, energy expenditure |
| [87] | Seasonality of birth (4 seasons) | Term birth weight (continuous variable) | 12 cities in the USA (NT) 1959–1965 | - Year divided into four seasons: winter (December, January, February); spring (March, April, May); summer (June, July, August); and fall (September, October, November) | Multi- hospital based cohort study | All live births at full term gestation | ANOVA Multiple linear regression | N = 24,325 | Infants born in fall had lower birth weight than those born in winter (t test = 2.15, p = 0.03) and spring (t test = 2.48, p = 0.01), but no association remained after adjustment for confounders. | Sex, race, maternal age, maternal education, maternal BMI, first born, ever breast fed, weight gain in first four months |
| [79] | Seasonality of birth (month) | Term birth weight (continuous variable) | Chile (entire country) (NT), 1987–2007 | Year divided monthly and regionally: North, Central-coast, Central-interior and South | Population based cohort study | All live-born singletons with gestations between 37 and 41 weeks in study period | Multivariate regression | N = 4,968,912 | Birth weight has a bimodal peak in spring (p < 0.001) and fall (p < 0.001) and a pronounced nadir in winter and smaller nadir in summer | Maternal age, marital status, college education, urban region |
| [86] | Seasonality of birth (4 seasons) | Birth weight (continuous variable) | Rome, Italy and Sassary, Italy (NT), January 1993–December 1996 | - Year divided into four seasons: winter, spring, summer, autumn | Hospital based cohort study | All live births | Variance analysis | N = 5,291 | - Birth weight is significantly lower in infants born in winter than in autumn. - mean differenceis 327 g (p < 0.003); after correction for multiple comparison (p < 0.02) | Population and gestational duration, season of birth (with birth weight as dependent variable) |
| [54] | Seasonality of birth (4 seasons) Temperature | Birth weight (continuous variable) Low Birth Weight (<2,500 g) | Greece (entire country) (NT), 1999–2003 | - Year divided into four seasons: winter (December–February), spring (March–May), summer (June–August), and autumn (September–November) - mean air temperature during month of birth | Population based cohort study | All Greek citizens born or deceased during the period of study | Chi square Tests for contrasts in low birth weight probability between seasons Pearson’s R for association of continuous birth weight with temperature | N = 516,874 born N = 554,101 died | - Infants born during autumn and winter had higher birth weight than those born in other seasons of the year - Low birth weight rates were lower (p < 0.05) for infants born during the autumn and winter seasons. -Mean air temperature during the month of birth associated with birth weight r = −0.218 (p < 0.001) | None |
| [91] | Temperature regime (climate, not seasonal variation) reflected by heat stress (humidity and temperature) | Birth weight (continuous variable) | 140 populations from the WHO (1992) population data | Heat stress index considering yearly average of maximum daily temperature and afternoon humidity | Pooled analysis of population based studies | Population with specific data on birth weight and thermal climate. | Linear regression | 140 populations | - Significant correlation between heat stress and birth weight R2 = −0.59 (p < 0.001) | Data on both birth weight and heat stress were reduced to an annual average value, thus ignored seasonal variation in climate |
| [90] | Temperature regime (climate, not seasonal variation) | Birth weight (continuous variable, log-transformed) | 63 countries from the WHO (1992) population data 1971–2000 | Climate characterized by the mean of daily minimum and maximum temperature from the coolest and warmest months, respectively | Ecological study | Linear regression | 63 countries, number of births not provided | Overall reductions in BW at increasing mean temperatures vary from 0.44% per °C in temperature range 0–5 °C to 1.05% per °C in the temperature range 20–25 °C, subject to adjustment for variation in nutrition, altitude and age of motherhood. | Altitude, prevalence of under-nourishment, obesity, mean age at motherhood, fertility rate, malaria prevalence, geographic origin. | |
| [93] | Extreme temperatures | Birth weight (continuous variable) | USA (entire country), 1972–1988 | Number of days within each pregnancy trimester that fall into different bins of daily average temperature (average of maximum and minimum temperature) <25° F, 25°–45° F, 45°–65° F, 65°–85° F, >85° F). Aggregated at the county level | Cohort study | Mothers aged 16–45, 48 continental states + DC | Linear regression | N = 37,100,000 | As compared to 45–65° F, each additional day <25° F is associated with a −0.000025 (95% CI: −0.00001; −0.00004) detriment in log birth weight each additional day>85° F is associated with a −0.000025 (95% CI: −0; −0.00005) detriment in log birth weight Linear relationships for temperature exposure during the 2nd and 3rd trimesters: <25° F is associated with a 0.000025 (95% CI: 0.00001; 0.00004) increment in log birth weight each additional day> 85° F is associated with a −0.000075 (95% CI: −0.00006; −0.000012) detriment in log birth weight | Smooth function for the date of conception. Conditioning by county and year, mother’ s age, fertility history, educational level and marital status Inverse U-shaped dose response relationship between log birth weight and number of days falling within the different bins during the first trimester |
| [92] | Temperature regime (climate) Extreme temperatures | Birth weight (continuous variable) | USA (entire country) (NT), 1974–1978 And 1984–1988 | Number of days during the month or season of birth that fall into different categories of daily average temperature: <20° F,<25° F, 25°–45° F, 45°–65° F, 65°–85° F, >85° F, 90° F, >95° F Winter (December to February), Spring (March to May), Summer (June to August), Fall (September to November) -study period+ annual average temperature from 1960 to 1969 (“climate”) | Ecological study (county-level resolution) | 20% sample of White mothers aged 19 to 38 | Multilevel linear regression with spatial autocorrelation terms | 4,921,561 | The warmer the yearly average temperature of a county, the lower the birth weight. After controlling for these climatic patterns, birth weight was inversely related to both extremely cold and extremely hot temperatures. In birth month (1974–1978): birth reduction associated with each day <20° F: −0.0761 (SD: 0.0734) >90° F: −0.7449 (SD: 0.0802) With mean county temperature: −1.1409 (SD: 0.3683) In birth month (1984−1988): birth reduction associated with each day <20° F: −0.4749 (SD: 0.0739) >90° F: −0.2927 (SD: 0.06147) With mean county temperature: −4.7054 (SD: 0.2594) | County per capita income, average elevation |
| [53] | Seasonality of birth (month) | Birth weight (continuous variable) | Japan (entire country) (NT), January 1974–December 1983 | Year divided into spring (March–May), summer (June–August), autumn (September–November), and winter (December–February) | Time series analysis | All live singletons | Time series regression | N = 16,796,415 | Significant inter-seasonal variability in mean birth weight (p < 0.001): two peaks in May and October–November and two troughs in June–September and December. | None |
| [50] | Seasonality of conception (month) | Birth weight (continuous variable) Adjusted or not for gestational age | NJ (entire state), USA, (1997-2006), New York, NY, USA, (1994–2004) PA (entire state), USA, (2004–2010) | Month of conception | Retrospective cohort study | Single births with no missing information on gestation length | Cohort study based on comparison between siblings | N = 1,435,213 | Gain of 8–9 additional g for summer conceptions compared with January conceptions (both before and after adjusting for gestational age) | Stable maternal characteristics (by design) Influenza Gestational age |
| [82] | Seasonality of birth (Month) Temperature | Birth weight (continuous variable) | Aberdeen, Scotland (NT), 1950–1956 | -Year divided into Winter (December–February); Spring (March–May); Summer (June–August and Autumn (September–November) -Mean ambient minimum and maximum temperature for 10 days around conception, the middle of Each pregnancy trimester | Population based cohort study | All births | Linear regression models | N = 12,150 | -lowest birth weights in the winter months (December–February) and highest in the autumn months (September–November) -1 °C increase in mean ambient outdoor temperature in the mid 10-day period of the first trimester -first trimester associated with a 5.4 g (95% CI 2.9, 7.9 g) decrease in birth weight -second trimester associated with a 1.8 g (95% CI −0.7, 4.3 g) decrease in birth weight -third trimester associated with a 1.3 g (95% CI 0.50, 2.1 g) increase in birth weight | Sex, maternal age, birth year, birth order, social class |
| [96] | Sunlight | Birth weight (continuous variable) | Dunedin, New Zealand (NT), August 1967–July 1978 | -Daily sunlight maximal hours during pregnancy | Hospital based cohort study | All singleton live births | Cross-correlation functions from Fourier transforms | N = 20,021 | - Monthly means for neonate weight varied sinusoidally with monthly variation in mean bright sunlight hours - effect of mean sunlight hours on birth weight most evident when maximal sunlight was positive during the first 3 pre-natal months and negative during the last 6 pre-natal months. | None |
| [84] | Seasonality of birth (4 seasons) | Birth weight (continuous variable) | Queensland, Australia (T), January 1987–December 1999 | Year divided into spring (September–November); summer(December–February); fall (March–May); winter(June–August) | Time series analysis | All singleton pregnancies with a gestation of at least 37 weeks | Spectral analysis | N = 350,171 | Winter and spring infants born slightly heavier compared to summer and autumn born infants (25-g difference between neonates born in October vs. May). | None |
| [94] | Temperature Sunlight | Term Birth weight (continuous variable) | Dunedin, New Zealand (NT), January 1999–December 2003 | Temperature and sunshine hours by pregnancy trimester | Hospital based cohort study | Full term births >38 weeks of gestation | One-way analyses of variance | N = 8,516 | - No association between birth weight and temperature in the second trimester. -Infants exposed to high levels of sunshine during the first trimester born heavier than infants exposed to low levels of sunshine. - Infants whose mothers were exposed to trough periods of sunshine during their second and third trimesters heavier than infants whose mothers who were exposed to peak periods of sunshine during the same trimesters | None |
| [56] | Seasonality of birth (month) | Birth weight (continuous variable) Low birth weight (<2,500 g) | USA (entire country) (NT), 1989–2001 | Year divided into months | Population-based cohort study | All birth certificates | Linear regression | 52,041,052 | Children born in December and January have lower average birth weights than other children Infants born in April weigh 23.3 grams more on average than those born in January Early spring and late summer births are less likely to have a low birth weight | |
| [83] | Seasonality of birth (month) Temperature Precipitation | Birth weight (continuous variable) Low birth weight (<2,500 g) High birth weight (macrosomia >4,000 g) | Israel (entire country) (NT), 1998–2004 | -Year divided into seasons: winter (December–February), spring (March–May), summer (June–August), and fall (September–November) - monthly means of maximum and minimum daily temperature, precipitation, and number of rainy days | Population based cohort study | All live births | Linear regression (mean birth weight) Logistic regression (Low birth weight) | N = 225,545 | - Significant association between birth weights and season with a peak in July and trough in January - No association between low birth weight and seasonality -Babies born in summer had an OR = 1.12, 95% CI (1.07–1.18) for macrosomia compared with winter. - Positive association between mean birth weight and monthly minimal temperatures at the first month of first and third trimesters. - Monthly means of precipitation and number of rainy days not associated with birth weight | Maternal age, sex, year of birth, maternal diabetes |
| [85] | Seasonality of birth (month) | Birth weight (continuous variable) Low birth weight (<2,500 g) Very low birth weight (<1,500 g) | Kimberly, Australia (T), 1981–1993 | Year divided into seasons: very hot summer (January–June) and heavy rainfall from (January–April); Winter (July–December) | Population based cohort study | All singleton live births | Logistic regression analysis: OR of wet season compared to dry season | N = 4,058 | - Mean birth weight varied by month of birth (p = 0.003) -low birth weight more common during the wet season: OR 2.73; 95% CI (2.3–3.67) with the lowest birth weight in March - Increased risk of very low birth weight during the wet season compared with the dry season: OR 2.73; 95% CI (2.3–3.67), but low birth weight not associated with the wet season OR 1.06; 95% CI (0.96–1.17; p = ns) | None |
| [75] | Seasonality of conception (4 seasons) | Low birth weight (<2500 g) Small for gestational age (<10th percentile of birth weight for gestational age) | NC (entire state), USA (NT), 2001–2005 | -Season defined as: winter (December–February), spring (March–May), summer (June–August), and fall (September–November) | Population based cohort study | Singleton first births to non-Hispanic white and black women, excluding births with missing covariate data, congenital anomalies, birth weight <400 g, extremely high or low gestational age, and maternal age >44 years | Linear regression for mean birth weight logistic regression for low birth weight and small for gestational age | N = 188,276 | -Spring and winter conceptions were associated with higher rates of low birth weight for gestational age among statewide births (p < 0.05), as well as among rural county births for the non-Hispanic white group (p < 0.05). - Rates of small for gestational age were lowest among non-Hispanic white group spring conceptions across all North Carolina counties, urban, and rural counties (p < 0.05) | Maternal age, education level, marital status, smoking status, region of North Carolina, county urbanization |
| [58] | Seasonality of birth | Small for gestational age (<10th percentile of reference standard gestational age) | Keneba, Manduar, and Kantong Kunda, The Gambia (T), (3 villages of the West Kiang District) 1976–2003 | Year divided into agricultural season that revolves around the rainy season (July–November). | Population based cohort study | All live births | Fourier series | N = 1,916 | Incidence of SGA highest at the end of the annual hungry season, from August to December (peaking in November at 30.6%), with a nadir of 12.9% in June. | Thick and thin blood smears obtained from antenatal clinics to measure malarial infection; activity diaries and 24-hour activity recall to assess maternal workload |
| [66] | Seasonality of conception and birth (4 seasons) Temperature | Term low birth weight (<2,500 g) | Brandenburg, Germany (NT), 2002–2010 Saxony, Germany (NT), 2005–2009 | -Year divided into four seasons: December to February (winter), March to May: (spring), June to August: (summer), September to November: (autumn) -Daily mean temperature for each trimester of pregnancy | Time series analysis | All singleton births ≥37 weeks of gestation and with birth weight greater than 200 g | Logistic time series regression Fourier series | Brandenburg N = 128,604, including 6,242 low birth weight infants Saxony N = 162,913, including 8,034 low birth weight infants | - Association between low birth weight and conception in Spring in Brandenburg OR = 1.19, 95% CI (1.05–1.35) - Association between low birth weight and birth in Winter in Brandenburg OR = 1.15, 95% CI (1.02–1.30) - No association between low birth weight and temperature in Brandenburg in first OR = 0.93, 95% CI (0.70–1.23), second OR = 0.91, 95% CI (0.66–2.25), or third trimester OR = 0.86, 95% CI (0.64–1.17) - No association between low birth weight and temperature in Saxony in first OR = 0.89, 95% CI (0.70–1.12), second OR = 1.09, 95% CI (0.82–1.45), or third trimester OR = 1.15, 95% CI (0.87–1.52) | Maternal age available for Saxony only |
| [95] | Temperature | Very low birth weight (<1,500 g) | Sweden (entire country), (NT), 1973–2010 | Mean daily temperature averaged for the month of birth | Population based cohort study | All singleton live births during the summer season (June, July, August) | Time series analysis | N = 3,757,440 | - Inverse association between very low birth weight risk and mean monthly temperature in summer season - 13.6% increase in odds of a very low birth weight male for a colder than expected June and 5.4% increase in odds for a colder than expected August | |
| [32] | Seasonality of birth (rainy vs. dry) | Low birth weight (<2,500 g) Small-for-gestation age (birth weight <10th centile of the gestational age- and sex-specific US reference for fetal growth) | Lombok, Indonesia (T), 2001–2004 | Year divided into rainy season (November–March) and dry season (April–October) | Double blind cluster randomized controlled trial | All singleton live births with birth weight measured within 72 h of birth | Hierarchical logistic regression | N = 14,040 | 22% increased odds of low birth weight in babies born in the rainy season; 18% increased odds of small for gestational age in babies born in the rainy season | Infant’s sex, season at birth, mothers’ residence, nutritional status, education, household wealth, mid-upper arm circumference, height and a composite variable of birth order and pregnancy interval |
| [88] | Seasonality of birth (4 seasons) Temperature Sunlight | Small for gestational age and sex (infants with a weight for gestational age <10th percentile for their sex) Proportion of optimal birth weight (POBW) | Perth, Australia (NT), 1998–2006 | -Year divided into seasons: winter (June–August) and summer (December–February) -temperature and sunlight averaged over the entire duration pregnancy and over each trimester of pregnancy separately. | Population based cohort study | All singleton live births ≥400 g birth weight and/or ≥20 weeks’ gestation | Multiple linear regression, multivariate models | N = 14,7357 | - POBW with third trimesters predominantly in summer was 0.18%, 95% CI (0.00%–0.36%) lower than for those in winter. - No association between season of birth and small for gestational age - Inter-quartile range increase in temperature during entire pregnancy (0.73 °C) was associated with small for gestational age and sex with an OR = 1.02, 95% CI (1.00–1.05). - POBW decreased by 0.14%, 95% CI (0.01%–0.27%) per inter-quartile range increase in third-trimester temperature (9.15 °C). - No significant effect observed for sunlight exposure | Criteria air pollutants: Particulate matter with aerodynamic diameter <2.5 micrometers and <10 micrometers, ozone, nitric oxide, nitrogen dioxide and carbon monoxide |
4. Discussion
5. Conclusions and Recommendations
- Further research should be preferentially conducted within the framework of international multicentric studies using harmonized methodologies. They would offer enhanced opportunities to disentangle the potential influence of different meteorological factors, thanks to the various combinations of these factors represented across Earth’s climates.
- Investigating non-linear relationships between meteorological parameters and pregnancy outcomes appears important.
- Future studies need to measure, and if necessary adjust for, risk factors that exhibit seasonal variability and may be correlated with meteorological factors such as nutritional patterns, air pollution and infections. Since nutritional pattern and maternal infections are seldom documented while meteorological stations are ubiquitous, research on the effects of meteorological conditions on pregnancy outcome might be most cost efficient if conducted within preexisting cohorts of nutrition and/or infections and pregnancy outcomes.
- They should ideally focus on individual indicators for exposure to meteorological conditions and cofactors, which would take into account time-activity patterns of pregnant women, and the mitigating effects of time spent indoors and associated heating, air conditioning and ventilation, on exposure.
- Future studies on birth weight should take into account the length of gestation as part of their study design, in order to disentangle the possible effects of meteorology on intrauterine growth restriction and/or the length of gestation.
- Lastly, fine temporal exposure windows over the entire gestational period are needed to identify critical windows of vulnerability to meteorological stressors.
Acknowledgments
Conflicts of Interest
References
- Kramer, M.S. The epidemiology of adverse pregnancy outcomes: An overview. J. Nutr. 2003, 133, 1592S–1596S. [Google Scholar]
- World Health Organization. WHO Recommendations for Prevention and Treatment of Pre-Eclampsia and Eclampsia; WHO: Geneva, Switzerland, 2011. [Google Scholar]
- Steegers, E.A.; von Dadelszen, P.; Duvekot, J.J.; Pijnenborg, R. Pre-eclampsia. Lancet 2010, 376, 631–644. [Google Scholar] [CrossRef]
- World Health Organization. M.o.D., PMNCH, and Save the Children, Born Too Soon: The Global Action Report on Preterm Birth; Howson, C.P., Kinney, M.V., Lawn, J.E., Eds.; WHO: Geneva, Switzerland, 2012. [Google Scholar]
- Barker, D. Fetal and Infant Origins of Adult Disease; BMJ Books: London, UK, 1992. [Google Scholar]
- Blencowe, H.; Cousens, S.; Oestergaard, M.Z.; Chou, D.; Moller, A.B.; Narwal, R.; Adler, A.; Vera Garcia, C.; Rohde, S.; Say, L.; et al. National, regional, and worldwide estimates of preterm birth rates in the year 2010 with time trends since 1990 for selected countries: A systematic analysis and implications. Lancet 2012, 379, 2162–2172. [Google Scholar] [CrossRef]
- World Health Organization and World Meteorological Organization. Atlas of Health and Climate; WHO Press: Geneva, Switzerland, 2012. [Google Scholar]
- Patz, J.A.; Githeko, A.K.; McCarty, J.P.; Hussein, S.; Confalonieri, U.; de Wet, N. Climate Change and Infectious Diseases. In Climate Change and Human Health - Risk and Responses; World Health Organization: Geneva, Switzerland, 2003; Chapter 6; pp. 103–132. [Google Scholar]
- Luo, B.; Zhang, S.; Ma, S.; Zhou, J.; Wang, B. Effects of cold air on cardiovascular disease risk factors in rat. Int. J. Environ. Res. Public Health 2012, 9, 2312–2325. [Google Scholar] [CrossRef]
- Weatherbase. Available online: http://www.weatherbase.com/ (accessed on 3 November 2013).
- Hunter, J.E.; Schmidt, F.L. Methods of Meta-Analysis: Correcting Error and Bias in Research Findings, 2nd ed.; Sage: Newbury Park, CA, USA, 2004. [Google Scholar]
- Field, A.P.; Gilett, R. How to do a a meta analysis. Br. J. Math. Stat. Psychol. 2010, 63, 665–694. [Google Scholar] [CrossRef]
- Köppen, W.; Geiger, R. Das Geographische System der Klimate; Verlag von Gebrüder Borntraeger: Berlin, Gremany, 1936. [Google Scholar]
- Rudra, C.B.; Williams, M.A. Monthly variation in preeclampsia prevalence: Washington State, 1987–2001. J. Matern.-Fetal Neonatal Med. 2005, 18, 319–324. [Google Scholar] [CrossRef]
- Phillips, J.K.; Bernstein, I.M.; Mongeon, J.A.; Badger, G.J. Seasonal variation in preeclampsia based on timing of conception. Obstet. Gynecol. 2004, 104, 1015–1020. [Google Scholar] [CrossRef]
- Algert, C.S.; Roberts, C.L.; Shand, A.W.; Morris, J.M.; Ford, J.B. Seasonal variation in pregnancy hypertension is correlated with sunlight intensity. Am. J. Obstet. Gynecol. 2010, 203, e211–e215. [Google Scholar]
- Nanbakhsh, F.; Broomand, F.; Mohaddesi, H.; Nefoozi, S.; Mazloomi, P. Seasonal variation in the incidence of preeclampsia based on the time of conception. Life Sci. J. 2012, 9, 1310–1314. [Google Scholar]
- Tam, W.H.; Sahota, D.S.; Lau, T.K.; Li, C.Y.; Fung, T.Y. Seasonal variation in pre-eclamptic rate and its association with the ambient temperature and humidity in early pregnancy. Gynecol. Obstet. Investig. 2008, 66, 22–26. [Google Scholar] [CrossRef]
- Pitakkarnkul, S.; Phaloprakarn, C.; Wiriyasirivaj, B.; Manusirivithaya, S.; Tangjitgamol, S. Seasonal variation in the prevalence of preeclampsia. J. Med. Assoc. Thail. 2011, 94, 1293–1298. [Google Scholar]
- Wacker, J.; Schulz, M.; Fruhauf, J.; Chiwora, F.M.; Solomayer, E.; Bastert, G. Seasonal change in the incidence of preeclampsia in Zimbabwe. Acta Obstet. Gynecol. Scand. 1998, 77, 712–716. [Google Scholar] [CrossRef]
- Magnus, P.; Eskild, A. Seasonal variation in the occurrence of pre-eclampsia. BJOG 2001, 108, 1116–1119. [Google Scholar]
- Wellington, K.; Mulla, Z.D. Seasonal trend in the occurrence of preeclampsia and eclampsia in Texas. Am. J. Hypertens. 2012, 25, 115–119. [Google Scholar] [CrossRef]
- Magann, E.F.; Perry, K.G., Jr.; Morrison, J.C.; Martin, J.N., Jr. Climatic factors and preeclampsia-related hypertensive disorders of pregnancy. Am. J. Obstet. Gynecol. 1995, 172, 204–205. [Google Scholar] [CrossRef]
- Subramaniam, V. Seasonal variation in the incidence of preeclampsia and eclampsia in tropical climatic conditions. BMC Womens Health 2007, 7, 18. [Google Scholar] [CrossRef]
- Okafor, U.V.; Ezegwui, H.U. Cesarean delivery in preeclampsia and seasonal variation in a tropical rainforest belt. J. Postgrad. Med. 2010, 56, 21–23. [Google Scholar] [CrossRef]
- Haelterman, E.; Marcoux, S.; Croteau, A.; Dramaix, M. Population-based study on occupational risk factors for preeclampsia and gestational hypertension. Scand. J. Work Environ. Health 2007, 33, 304–317. [Google Scholar] [CrossRef]
- Bider, D.; Sivan, E.; Seidman, D.S.; Dulitzky, M.; Mashiach, S.; Serr, D.M.; Ben-Rafael, Z. Meteorological factors in hypertensive disorders, vaginal bleeding and premature rupture of membranes during pregnancy. Gynecol. Obstet. Investig. 1991, 32, 88–90. [Google Scholar] [CrossRef]
- Immink, A.; Scherjon, S.; Wolterbeek, R.; Steyn, D.W. Seasonal influence on the admittance of pre-eclampsia patients in Tygerberg Hospital. Acta Obstet. Gynecol. Scand. 2008, 87, 36–42. [Google Scholar] [CrossRef]
- Makhseed, M.; Musini, V.M.; Ahmed, M.A.; Monem, R.A. Influence of seasonal variation on pregnancy-induced hypertension and/or preeclampsia. Aust. N. Z. J. Obstet. Gynaecol. 1999, 39, 196–199. [Google Scholar] [CrossRef]
- Yackerson, N.S.; Piura, B.; Friger, M. The influence of weather state on the incidence of preeclampsia and placental abruption in semi-arid areas. Clin. Exp. Obstet. Gynecol. 2007, 34, 27–30. [Google Scholar]
- Soroori, Z.; Sharami, S.; Faraji, R. Seasonal variation of the onset of preeclampsia and eclampsia. JRMS 2007, 12, 198–202. [Google Scholar]
- Sebayang, S.K.; Dibley, M.J.; Kelly, P.J.; Shankar, A.V.; Shankar, A.H.; Group, S.S. Determinants of low birthweight, small-for-gestational-age and preterm birth in Lombok, Indonesia: Analyses of the birthweight cohort of the SUMMIT trial. Trop. Med. Int. Health 2012, 17, 938–950. [Google Scholar] [CrossRef]
- Garg, V.; Khandelwal, S. Seasonal trends in the occurrence of eclampsia. JK Sci. 2011, 13, 50–51. [Google Scholar]
- Rylander, A.; Lindqvist, P.G. Eclampsia is more prevalent during the winter season in Sweden. Acta Obstet. Gynecol. Scand. 2011, 90, 114–117. [Google Scholar] [CrossRef]
- Neela, J.; Raman, L. Seasonal trends in the occurrence of eclampsia. Natl. Med. J. India 1993, 6, 17–18. [Google Scholar]
- Halimi, S.; Halimi, S.M.A. Eclampsia and its association with external factors. J. Ayub. Med. Coll. Abbottabad 2010, 22, 110–112. [Google Scholar]
- Okafor, U.V.; Efetie, E.R.; Ekumankama, O. Eclampsia and seasonal variation in the tropics - a study in Nigeria. Pan Afr. Med. J. 2009, 2, 7. [Google Scholar]
- Obed, S.A.; Wilson, J.B.; Elkins, T.E. Eclampsia: 134 consecutive cases. Int. J. Gynaecol. Obstet. 1994, 45, 97–103. [Google Scholar] [CrossRef]
- Jamelle, R.N. Eclampsia: Is there a seasonal variation in incidence? J. Obstet. Gynaecol. Res. 1998, 24, 121–128. [Google Scholar] [CrossRef]
- Bergstrom, S.; Povey, G.; Songane, F.; Ching, C. Seasonal incidence of eclampsia and its relationship to meteorological data in Mozambique. J. Perinat. Med. 1992, 20, 153–158. [Google Scholar] [CrossRef]
- Ros, H.S.; Cnattingius, S.; Lipworth, L. Comparison of risk factors for preeclampsia and gestational hypertension in a population-based cohort study. Am. J. Epidemiol. 1998, 147, 1062–1070. [Google Scholar] [CrossRef]
- Bodnar, L.M.; Daftary, A.; Markovic, N.; Schatzman, C.L.; Roberts, J.M. Seasonal variation in gestational blood pressure. Hypertens. Pregnancy 2006, 25, 271–283. [Google Scholar] [CrossRef]
- Metoki, H.; Ohkubo, T.; Watanabe, Y.; Nishimura, M.; Sato, Y.; Kawaguchi, M.; Hara, A.; Hirose, T.; Obara, T.; Asayama, K.; et al. Seasonal trends of blood pressure during pregnancy in Japan: The babies and their parents’ longitudinal observation in Suzuki Memorial Hospital in Intrauterine Period study. J. Hypertens. 2008, 26, 2406–2413. [Google Scholar] [CrossRef]
- Bullock, N.; Breese McCoy, S.J.; Payton, M.E. Role of race in the seasonality of deliveries with preeclampsia. Med. Hypotheses 2011, 77, 674–676. [Google Scholar] [CrossRef]
- Khojasteh, F.; Safarzadeh, A.; Burayri, T. Survey of correlation between preeclampsia and season & some of its risk factor in pregnant women. J Women’s Health Care 2012, 1, 1000114:1–1000114:3. [Google Scholar]
- Kashanian, M.; Baradaran, H.R.; Bahasadri, S.; Alimohammadi, R. Risk factors for pre-eclampsia: A study in Tehran, Iran. Arch. Iran. Med. 2011, 14, 412–415. [Google Scholar]
- Shental, O.; Friger, M.; Sheiner, E. Ethnic differences in the monthly variation of preeclampsia among Bedouin and Jewish parturients in the Negev. Hypertens. Pregnancy 2010, 29, 342–349. [Google Scholar] [CrossRef]
- Bodnar, L.M.; Catov, J.M.; Roberts, J.M. Racial/ethnic differences in the monthly variation of preeclampsia incidence. Am. J. Obstet. Gynecol. 2007, 196, e321–e325. [Google Scholar]
- Daniilidis, A.; Chastamouratidis, C.; Balaouras, D.; Chitzios, D.; Loufopoulos, P.D.; Fotinakis, I.; Hatzis, P. Seasonal variation in the incidence of severe preeclampsia in mediterranean climatic conditions. Eur. J. Inflamm. 2013, 11, 527–529. [Google Scholar]
- Curie, J.; Schwandt, H. Within-mother analysis of seasonal patterns in health at birth. Proc. Natl. Acad. Sci. Early Ed. USA 2013. [Google Scholar] [CrossRef]
- Bodnar, L.M.; Simhan, H.N. The prevalence of preterm birth and season of conception. Paediatr. Perinat. Epidemiol. 2008, 22, 538–545. [Google Scholar] [CrossRef]
- Friis, H.; Gomo, E.; Nyazema, N.; Ndhlovu, P.; Krarup, H.; Kaestel, P.; Michaelsen, K.F. Maternal body composition, HIV infection and other predictors of gestation length and birth size in Zimbabwe. Br. J. Nutr. 2004, 92, 833–840. [Google Scholar] [CrossRef]
- Matsuda, S.; Sone, T.; Doi, T.; Kahyo, H. Seasonality of mean birth weight and mean gestational period in Japan. Hum. Biol. 1993, 65, 481–501. [Google Scholar]
- Flouris, A.D.; Spiropoulos, Y.; Sakellariou, G.J.; Koutedakis, Y. Effect of seasonal programming on fetal development and longevity: Links with environmental temperature. Am. J. Hum. Biol. 2009, 21, 214–216. [Google Scholar] [CrossRef]
- Wohlfahrt, J.; Melbye, M.; Christens, P.; Andersen, A.M.; Hjalgrim, H. Secular and seasonal variation of length and weight at birth. Lancet 1998, 352, 1990. [Google Scholar] [CrossRef]
- Buckles, K.S.; Hungerman, D.M. Season of birth and later outcomes: Old questions, new answers. Rev. Econ. Stat. 2013, XCV, 711–724. [Google Scholar] [CrossRef]
- Auger, N.; Kuehne, E.; Goneau, M.; Daniel, M. Preterm birth during an extreme weather event in Quebec, Canada: A “natural experiment”. Matern. Child Health J. 2011, 15, 1088–1096. [Google Scholar] [CrossRef]
- Rayco-Solon, P.; Fulford, A.J.; Prentice, A.M. Differential effects of seasonality on preterm birth and intrauterine growth restriction in rural Africans. Am. J. Clin. Nutr. 2005, 81, 134–139. [Google Scholar]
- Dadvand, P.; Basagana, X.; Sartini, C.; Figueras, F.; Vrijheid, M.; de Nazelle, A.; Sunyer, J.; Nieuwenhuijsen, M.J. Climate extremes and the length of gestation. Environ. Health Perspect. 2011, 119, 1449–1453. [Google Scholar] [CrossRef]
- Porter, K.R.; Thomas, S.D.; Whitman, S. The relation of gestation length to short-term heat stress. Am. J. Public Health 1999, 89, 1090–1092. [Google Scholar] [CrossRef]
- Matsuda, S.; Kahyo, H. Geographic differences in seasonality of preterm births in Japan. Hum. Biol. 1998, 70, 919–935. [Google Scholar]
- Strand, L.B.; Barnett, A.G.; Tong, S. Maternal exposure to ambient temperature and the risks of preterm birth and stillbirth in Brisbane, Australia. Am. J. Epidemiol. 2012, 175, 99–107. [Google Scholar]
- Basu, R.; Malig, B.; Ostro, B. High ambient temperature and the risk of preterm delivery. Am. J. Epidemiol. 2010, 172, 1108–1117. [Google Scholar] [CrossRef]
- Yackerson, N.; Piura, B.; Sheiner, E. The influence of meteorological factors on the emergence of preterm delivery and preterm premature rupture of membrane. J. Perinatol. 2008, 28, 707–711. [Google Scholar] [CrossRef]
- Lee, S.J.; Hajat, S.; Steer, P.J.; Filippi, V. A time-series analysis of any short-term effects of meteorological and air pollution factors on preterm births in London, UK. Environ. Res. 2008, 106, 185–194. [Google Scholar] [CrossRef]
- Wolf, J.; Armstrong, B. The association of season and temperature with adverse pregnancy outcome in two German states, a time-series analysis. PLoS One 2012, 7, e40228. [Google Scholar] [CrossRef]
- Lajinian, S.; Hudson, S.; Applewhite, L.; Feldman, J.; Minkoff, H.L. An association between the heat-humidity index and preterm labor and delivery: A preliminary analysis. Am. J. Public Health 1997, 87, 1205–1207. [Google Scholar] [CrossRef]
- Wang, J.; Williams, G.; Guo, Y.; Pan, X.; Tonga, S. Maternal exposure to heatwave and preterm birth in Brisbane, Australia. BJOG 2013. [Google Scholar] [CrossRef] [Green Version]
- Schifano, P.; Lallo, A.; Asta, F.; de Sario, M.; Davoli, M.; Michelozzi, P. Effect of ambient temperature and air pollutants on the risk of preterm birth, Rome 2001–2010. Environ. Int. 2013, 61, 77–87. [Google Scholar] [CrossRef]
- Lee, S.J.; Steer, P.J.; Filippi, V. Seasonal patterns and preterm birth: A systematic review of the literature and an analysis in a London-based cohort. BJOG 2006, 113, 1280–1288. [Google Scholar] [CrossRef]
- Hirsch, E.; Lim, C.; Dobrez, D.; Adams, M.G.; Noble, W. Meteorological factors and timing of the initiating event of human parturition. Int. J. Biometeorol. 2011, 55, 265–272. [Google Scholar] [CrossRef]
- Akutagawa, O.; Nishi, H.; Isaka, K. Spontaneous delivery is related to barometric pressure. Arch. Gynecol. Obstet. 2007, 275, 249–254. [Google Scholar] [CrossRef]
- Noller, K.L.; Resseguie, L.J.; Voss, V. The effect of changes in atmospheric pressure on the occurrence of the spontaneous onset of labor in term pregnancies. Am. J. Obstet. Gynecol. 1996, 174, 1192–1197. [Google Scholar] [CrossRef]
- King, E.A.; Fleschler, R.G.; Cohen, S.M. Association between significant decrease in barometric pressure and onset of labor. J. Nurse Midwifery 1997, 42, 32–34. [Google Scholar] [CrossRef]
- Miranda, M.L.; Anthopolos, R.; Edwards, S.E. Seasonality of poor pregnancy outcomes in North Carolina. N. C. Med. J. 2011, 72, 447–453. [Google Scholar]
- Matsuda, S.; Kahyo, H. Seasonality of preterm births in Japan. Int. J. Epidemiol. 1992, 21, 91–100. [Google Scholar] [CrossRef]
- Baroutis, G.; Mousiolis, A.; Hoffman, D.; Antsaklis, A. Preterm birth seasonality in Greece: An epidemiological study. J. Matern.-Fetal Neonatal Med. 2012, 25, 1406–1412. [Google Scholar]
- Elter, K.; Ay, E.; Uyar, E.; Kavak, Z.N. Exposure to low outdoor temperature in the midtrimester is associated with low birth weight. Aust. N. Z. J. Obstet. Gynaecol. 2004, 44, 553–557. [Google Scholar] [CrossRef]
- Torche, F.; Corvalan, A. Seasonality of birth weight in Chile: Environmental and socioeconomic factors. Ann. Epidemiol. 2010, 20, 818–826. [Google Scholar] [CrossRef]
- Murray, L.J.; O’Reilly, D.P.; Betts, N.; Patterson, C.C.; Davey Smith, G.; Evans, A.E. Season and outdoor ambient temperature: Effects on birth weight. Obstet. Gynecol. 2000, 96, 689–695. [Google Scholar] [CrossRef]
- Siniarska, A.; Koziel, S. Association of birth weight and length with air temperature, sunlight, humidity and rainfall in the city of Warsaw, Poland. Homo 2010, 61, 373–380. [Google Scholar] [CrossRef]
- Lawlor, D.A.; Leon, D.A.; Davey Smith, G. The association of ambient outdoor temperature throughout pregnancy and offspring birthweight: Findings from the Aberdeen Children of the 1950s cohort. BJOG 2005, 112, 647–657. [Google Scholar] [CrossRef]
- Chodick, G.; Shalev, V.; Goren, I.; Inskip, P.D. Seasonality in birth weight in Israel: New evidence suggests several global patterns and different etiologies. Ann. Epidemiol. 2007, 17, 440–446. [Google Scholar] [CrossRef]
- McGrath, J.J.; Keeping, D.; Saha, S.; Chant, D.C.; Lieberman, D.E.; O’Callaghan, M.J. Seasonal fluctuations in birth weight and neonatal limb length; does prenatal vitamin D influence neonatal size and shape? Early Hum. Dev. 2005, 81, 609–618. [Google Scholar] [CrossRef]
- Rousham, E.K.; Gracey, M. Seasonality of low birthweight in indigenous Australians: An increase in pre-term birth or intrauterine growth retardation? Aust. N. Z. J. Public Health 1998, 22, 669–672. [Google Scholar] [CrossRef]
- Gloria-Bottini, F.; Meloni, G.F.; Finocchi, A.; Porcu, S.; Amante, A.; Bottini, E. Rh system and intrauterine growth. Interaction with season of birth. Dis. Markers 2000, 16, 139–142. [Google Scholar]
- De Jong, L.V.; Waller, G.; Stettler, N. Ethnicity modifies seasonal variations in birth weight and weight gain of infants. J. Nutr. 2003, 133, 1415–1418. [Google Scholar]
- Pereira, G.; Cook, A.; Haggar, F.; Bower, C.; Nassar, N. Seasonal variation in fetal growth: Accounting for sociodemographic, biological, and environmental exposures. Am. J. Obstet. Gynecol. 2012, 206, e71–e77. [Google Scholar]
- Kinabo, J. Seasonal-variation of birth-weight distribution in Morogoro, Tanzania. East Afr. Med. J. 1993, 70, 752–755. [Google Scholar]
- Jensen, P.M.; Sorensen, M. Differences in human birth weight and corollary attributes as a result of temperature regime. Ann. Hum. Biol. 2013, 40, 385–395. [Google Scholar] [CrossRef]
- Wells, J.C.; Cole, T.J. Birth weight and environmental heat load: A between-population analysis. Am. J. Phys. Anthropol. 2002, 119, 276–282. [Google Scholar] [CrossRef]
- Lin, G.; Zhang, T.L. Examining extreme weather effects on birth weight from the individual effect to spatiotemporal aggregation effects. J. Agric. Biol. Environ. Stat. 2012, 17, 490–507. [Google Scholar] [CrossRef]
- Deschêne, O.; Greenstone, M.; Guryan, J. Climate change and birth weight. Am. Econ. Rev. 2009, 99, 211–217. [Google Scholar] [CrossRef]
- Tustin, K.; Gross, J.; Hayne, H. Maternal exposure to first-trimester sunshine is associated with increased birth weight in human infants. Dev. Psychobiol. 2004, 45, 221–230. [Google Scholar] [CrossRef]
- Hartig, T.; Catalano, R. Cold summer weather, constrained restoration, and very low birth weight in Sweden. Health Place 2013, 22, 68–74. [Google Scholar] [CrossRef]
- Waldie, K.E.; Poulton, R.; Kirk, I.J.; Silva, P.A. The effects of pre- and post-natal sunlight exposure on human growth: Evidence from the Southern Hemisphere. Early Hum. Dev. 2000, 60, 35–42. [Google Scholar] [CrossRef]
- Darrow, L.A.; Strickland, M.J.; Klein, M.; Waller, L.A.; Flanders, W.D.; Correa, A.; Marcus, M.; Tolbert, P.E. Seasonality of birth and implications for temporal studies of preterm birth. Epidemiology 2009, 20, 699–706. [Google Scholar] [CrossRef]
- Pedersen, M.; Giorgis-Allemand, L.; Bernard, C.; Aguilera, I.; Nybo Andersen, A.-M.; Ballester, F.; Beelen, R.M.J.; Chatzi, L.; Cirach, M.; Danileviciute, A.; et al. Ambient air pollution and low birthweight: A European cohort study (ESCAPE). Lancet. 2013, 1, pp. 695–704. Available online: http://dx.doi.org/10.1016/S2213-2600(13)70192-9 (accessed on 15 October 2013).
- Slama, R.; Darrow, L.; Parker, J.; Woodruff, T.J.; Strickland, M.; Nieuwenhuijsen, M.; Glinianaia, S.; Hoggatt, K.J.; Kannan, S.; Hurley, F.; et al. Meeting report: Atmospheric pollution and human reproduction. Environ. Health Perspect. 2008, 116, 791–798. [Google Scholar] [CrossRef]
- Rustveld, L.O.; Kelsey, S.F.; Sharma, R. Association between maternal infections and preeclampsia: A systematic review of epidemiologic studies. Matern. Child Health J. 2008, 12, 223–242. [Google Scholar] [CrossRef]
- Takem, E.N.; D’Alessandro, U. Malaria in pregnancy. Mediterr. J. Hematol. Infect. Dis. 2013, 5, e2013010. [Google Scholar]
- Basu, R.; Woodruff, T.J.; Parker, J.D.; Saulnier, L.; Schoendorf, K.C. Comparing exposure metrics in the relationship between PM2.5 and birth weight in California. J. Expo. Anal. Environ. Epidemiol. 2004, 14, 391–396. [Google Scholar] [CrossRef]
Appendix
| Reference | Sample size | Setting | Tropical setting | Resolution | Hemisphere | Reason for exclusion from meta-analysis |
|---|---|---|---|---|---|---|
| [14] | 79,298 | WA (entire state), USA | No | Month | North | N.A. |
| [15] | 7,904 | Burlington, VT, USA | No | Month | North | N.A. |
| [16] | 424,732 | New South Wales, Australia | No | Month | South | N.A. |
| [18] | 15,402 | Hong Kong, China | No | Month | North | N.A. |
| [17] | 2,824 | Urmia, Iran | No | Month | North | N.A. |
| [19] | 7,013 | Bangkok, Thailand | Yes | 2 seasons | North | Sole study in tropical climate |
| Month in North hemisphere | January | February | March | April | May | June | July | August | September | October | November | December |
|---|---|---|---|---|---|---|---|---|---|---|---|---|
| Month in South hemisphere | July | August | September | October | November | December | January | February | March | April | May | June |
| Pooled relative risk | 1 (ref) | 1.16 | 1.01 | 1.12 | 1.17 | 1.33 | 1.15 | 1.22 | 1.12 | 1.02 | 0.96 | 1.06 |
| Lower bound for 95% credible interval | 1.1 | 0.57 | 0.89 | 0.98 | 0.78 | 0.67 | 0.89 | 0.97 | 0.79 | 0.7 | 0.84 | |
| Higher bound for 95% credible interval | 1.22 | 1.79 | 1.43 | 1.4 | 2.27 | 1.97 | 1.65 | 1.3 | 1.31 | 1.31 | 1.33 |
| Reference | Sample size | Setting | Tropical setting | Resolution | Hemisphere | Reason for exclusion from meta-analysis |
|---|---|---|---|---|---|---|
| [27] | 18,500 | Tel Aviv, Israel | No | Month | North | NA |
| [29] | 28,262 | Safata, Kuwait | No | Month | North | NA |
| [44] | 3,050 | Tulsa, OK, USA | No | Month | North | NA |
| [47] | 203,462 | Negev, Israel | No | Month | North | NA |
| [64] | 11,979 | Negev, Israel | No | Month | North | NA |
| [22] | 312,207 | TX (entire state), USA | No | Month | North | NA |
| [21] | 1,869,388 | Norway (entire country) | No | Month | North | NA |
| [48] | 39,710 | USA (12 cities) (12 hospitals) | No | Month | North | NA |
| [28] | 11,585 | Cape Town, South Africa | No | Month | South | NA |
| [20] | 54,744 | Southern, Zimbabwe | Yes | Month | South | NA |
| Month in North hemisphere | January | February | March | April | May | June | July | August | September | October | November | December |
|---|---|---|---|---|---|---|---|---|---|---|---|---|
| Month in South hemisphere | July | August | September | October | November | December | January | February | March | April | May | June |
| Pooled relative risk | 1.14 | 1.07 | 1.12 | 1.08 | 1.02 | 1.1 | 1 (ref) | 0.96 | 0.98 | 1.04 | 1.08 | 1 |
| Lower bound for 95% credible interval | 0.83 | 0.67 | 0.76 | 0.64 | 0.65 | 0.65 | 0.56 | 0.6 | 0.7 | 0.77 | 0.56 | |
| Higher bound for 95% credible interval | 1.56 | 1.7 | 1.64 | 1.8 | 1.61 | 1.85 | 1.66 | 1.61 | 1.54 | 1.53 | 1.77 |
| Reference | Sample size | Setting | Tropical setting | Resolution | Hemisphere | Reason for exclusion from meta-analysis |
|---|---|---|---|---|---|---|
| [22] | 312,207 | TX (entire state), USA | No | 4 seasons | North | NA |
| [15] | 7,904 | Burlington, VT, USA | No | 4 seasons | North | NA |
| [31] | 12,142 | Rasht, Iran (NT), | No | 4 seasons | North | NA |
| [41] | 10,659 | Uppsala, Sweden | No | 4 seasons | North | NA |
| [29] | 28,262 | Safata, Kuwait | No | Month | North | NA |
| [44] | 3,050 | Tulsa, OK, USA | No | Month | North | NA |
| [30] | 11,979 | Negev, Israel | No | Month | North | NA |
| [46] | 636 | Tehran, (Iran), | No | 4 seasons | North | NA |
| [45] | 4,976 | Zahedan, (Iran), | No | 4 seasons | North | Unusable information |
| [23] | 11,958 | Jackson, MS, USA | No | 3 seasons | North | No other study based on 3 seasons |
| [19] | 7,013 | Bangkok, Thailand | yes | 2 seasons | North | Only 2 studies based on dry vs. rainy season with sufficient information |
| [24] | 29,562 | Mumbai, India | yes | 2 seasons | North | Only 2 studies based on dry vs. rainy season with sufficient information |
| [25] | 1,579 | Enugu, Southern Nigeria | yes | 2 seasons | North | No information on the seasonal distribution of the reference population |
| [20] | 54,744 | Southern, Zimbabwe | Yes | Month | South | Not enough information available to group by season |
| Season | Winter | Spring | Summer | Fall | |
|---|---|---|---|---|---|
| Pooled relative risk | 1.05 | 1.05 | 1 (ref) | 1.01 | |
| Lower bound for 95% credible interval | 0.91 | 0.87 | 0.89 | ||
| Higher bound for 95% credible interval | 1.21 | 1.27 | 1.15 |
| Season | Winter | Spring | Summer | Fall | |
|---|---|---|---|---|---|
| Pooled relative risk | 1.11 | 1.26 | 1 (ref) | 1.14 | |
| Lower bound for 95% credible interval | 0.82 | 1.05 | 1.01 | ||
| Higher bound for 95% credible interval | 1.5 | 1.5 | 1.29 |
| Reference | Sample size | Setting | Definition of temperature indicator | Temporal resolution for temperature indicator |
|---|---|---|---|---|
| [29] | 28,262 | Safata, Kuwait | Daily mean temperature | Month of birth |
| [28] | 11,585 | Cape Town, South Africa | Daily minimum and maximum temperatures | Month of birth |
| [30] | 11,979 | Beer Sheva, Israel | Daily maximum temperature | Month of birth |
| [31] | 12,142 | Rasht, Iran | Daily mean temperature | Season of birth (4) |
| [23] | 11,958 | Jackson, MS, USA | Daily maximum temperature | Season of birth (3) |
| [19] | 7,013 | Bangkok, Thailand | Daily maximum temperature | Season of birth (2) |
| [24] | 29,562 | Mumbai, India | Daily mean temperature | Season of birth (2) |
| [18] | 15,402 | Hong Kong, China | Heat Index (function of temperature and humidity) | Time of conception |
| [26] | 4,400 | Quebec, Canada | Grouped extreme high and low temperatures | 20 first weeks of pregnancy |
| [27] | 18,500 | Tel Aviv, Israel | Average temperature | Month of birth |
| Reference | Sample size | Location | Tropical | Resolution | Hemisphere | Reason for exclusion from meta-analysis |
|---|---|---|---|---|---|---|
| [40] | 37,469 | Maputo City, Mozambique | No | Month | South | NA |
| [39] | 18,483 | Karachi, Rawalpindi, Peshawar, and Quetta, Pakistan | No | Month | North | NA |
| [34] | 482,759 | Sweden (entire country) | No | Month | North | NA |
| [34] | 12,170 | Rajasthan, India | Yes | Month | North | NA |
| [37] | Abuja, Nigeria | Yes | Month | North | No control population | |
| [38] | 10,301 | Accra, Ghana | Yes | Month | North | Study conducted in a setting with relative trends in month-to-month temperature changes markedly different from other studies |
| Month in North hemisphere | January | February | March | April | May | June | July | August | September | October | November | December |
|---|---|---|---|---|---|---|---|---|---|---|---|---|
| Month in South hemisphere | July | August | September | October | November | December | January | February | March | April | May | June |
| Pooled relative risk | 3.47 | 2.49 | 1.55 | 1.89 | 1.83 | 1.98 | 1 (ref) | 2.22 | 2.21 | 2.16 | 2.20 | 3.33 |
| Lower bound for 95% credible interval | 0.24 | 0.21 | 0.23 | 0.18 | 0.62 | 0.40 | 0.42 | 0.24 | 0.21 | 0.23 | 0.31 | |
| Higher bound for 95% credible interval | 50.20 | 29.08 | 10.17 | 19.73 | 5.40 | 9.85 | 11.64 | 20.31 | 21.92 | 21.18 | 35.48 |
| Reference | Sample size | Location | Tropical | Resolution | Hemisphere | Reason for exclusion from meta-analysis |
|---|---|---|---|---|---|---|
| [49] | 12,722 | Thessaloniki, Greece | No | 4 seasons | North | NA |
| [40] | 37,469 | Maputo City, Mozambique | No | Month | South | NA |
| [39] | 18,483 | Karachi, Rawalpindi, Peshawar, and Quetta , Pakistan | No | Month | North | NA |
| [34] | 482,759 | Sweden (entire country) | No | Month | North | NA |
| [36] | 23,000 | Peshawar, Pakistan | No | 4 seasons | North | No reference at risk pregnancy number |
| [35] | Unknown | Hyderabad, India | Yes | Month | North | No sample size provided |
| [24] | 29,562 | Mumbai, India | Yes | 2 seasons | North | No other tropical study available for an analysis of dry vs. rainy season |
| [38] | 10,301 | Accra, Ghana | Yes | Month | North | Study conducted in a setting with relative trends in month-to-month temperature changes markedly different from other studies |
| Season | Winter | Spring | Summer | Fall |
|---|---|---|---|---|
| Pooled relative risk | 1.94 | 1.10 | 1 (ref) | 1.14 |
| Lower bound for 95% credible interval | 1.19 | 0.90 | 0.79 | |
| Higher bound for 95% credible interval | 3.16 | 1.33 | 1.66 |
| Season | Winter | Spring | Summer | Fall |
|---|---|---|---|---|
| Pooled relative risk | 1.66 | 1.06 | 1 (ref) | 1.28 |
| Lower bound for 95% credible interval | 0.43 | 0.61 | 0.46 | |
| Higher bound for 95% credible interval | 6.32 | 1.83 | 3.56 |
| Outcome | Reference | Sample size | Country | Tropical | Resolution | Hemisphere |
|---|---|---|---|---|---|---|
| Preterm birth | [66] | 291,517 | Brandenburg and Saxony, Germany | No | 4 seasons (OR) | North |
| Preterm birth | [75] | 18,8276 | NC (entire state), USA | No | 4 seasons | North |
| Preterm birth | [51] | 83,059 | Pittsburgh, PA, USA | No | Month | North |
| Gestational length | [50] | 1,435,213 | 3 US cities | No | Month | North |
| Season | Winter | Spring | Summer | Fall |
|---|---|---|---|---|
| Pooled relative risk | 1 | 1.05 | 1 (ref) | 0.98 |
| Lower bound for 95% credible interval | 0.89 | 0.97 | 0.92 | |
| Higher bound for 95% credible interval | 1.13 | 1.14 | 1.04 |
| Reference | Sample size | Location | Tropical | Resolution | Hemisphere | Reason for exclusion from meta-analysis |
|---|---|---|---|---|---|---|
| [64] | 11,979 | Negev, Israel | No | Month | North | N.A. |
| [77] | 321,7738 | Greece (entire country) | No | Month | North | N.A. |
| [66] | 29,1517 | Brandenburg and Saxony, Germany | No | Month | North | N.A. |
| [76] | 7,665,006 | Japan (entire country) | No | Month | North | N.A. |
| [56] | 52,041,052 | USA (entire country) | No | Month | North | N.A. |
| [58] | 1,916 | Keneba, Manduar, and Kantong Kunda, The Gambia | Yes | Month | North | Sole tropical study |
| Month in North hemisphere | January | February | March | April | May | June | July | August | September | October | November | December |
|---|---|---|---|---|---|---|---|---|---|---|---|---|
| Pooled relative risk | 1.14 | 1.04 | 1.01 | 1.05 | 1.09 | 1.18 | 1.1 | 1.08 | 1 (ref) | 1.02 | 1.13 | 1.2 |
| Lower bound for 95% credible interval | 1.12 | 0.95 | 0.95 | 1.02 | 1.04 | 1.06 | 1.02 | 1.03 | 0.99 | 1.09 | 1.18 | |
| Higher bound for 95% credible interval | 1.15 | 1.14 | 1.07 | 1.09 | 1.14 | 1.31 | 1.2 | 1.13 | 1.05 | 1.18 | 1.21 |
| Outcome | Reference | Sample size | Location | Tropical | Resolution | Hemisphere | Reason for exclusion from meta-analysis |
|---|---|---|---|---|---|---|---|
| Preterm birth | [54] | 516,874 | Greece (entire country) | No | 4 seasons | North | N.A. |
| Preterm birth | [66] | 291,517 | Brandenburg and Saxony, Germany | No | 4 seasons | North | N.A. |
| Preterm birth | [76] | 7,665,006 | Japan (entire country) | No | month | North | N.A. |
| Preterm birth | [30] | 11,979 | Negev, Israel | No | month | North | N.A. |
| Preterm birth | [77] | 3,217,738 | Greece (entire country) | No | month | North | N.A. |
| Preterm birth | [52] | 1,669 | Harare, Zimbabwe | Yes | 4 seasons | South | Seasons defined as early/late dry/rainy, not consistent with other included studies |
| Preterm birth | [32] | 14,040 | Lombok, Indonesia | Yes | 2 seasons | South | Seasons definition as dry/rainy, not consistent with other included studies |
| Preterm birth | [57] | 855,320 | Québec, Canada | No | 2 seasons | North | Seasons definition according to the presence/absence of ice storm |
| Gestational length | [53] | 16,796,415 | Japan (entire country) | No | month | North | |
| Gestational length | [54] | 516,874 | Greece (entire country) | No | 4 seasons | North | |
| Gestational length | [55] | 1,166,206 | Denmark (entire country) | No | 4 seasons | North | Only 1 statement for results, lack of descriptive data |
| Gestational length | [52] | 1,669 | Harare, Zimbabwe | Yes | 2 seasons | South | Seasonal definitions too different between this study and the other ones |
| Season | Winter | Spring | Summer | Fall |
|---|---|---|---|---|
| Pooled relative risk | 1.01 | 0.94 | 1 (ref) | 0.94 |
| Lower bound for 95% credible interval | 0.90 | 0.83 | 0.85 | |
| Higher bound for 95% credible interval | 1.13 | 1.07 | 1.03 |
| Reference | Term birth | Sample size | Setting | Tropical | Resolution | Hemisphere |
|---|---|---|---|---|---|---|
| [81] | Yes | 10,631 | Warsaw, Poland | No | month | North |
| [80] | Yes | 418,817 | Northern, Ireland | No | month | North |
| [79] | Yes | 4,968,912 | Chile (entire country) | No | month | South |
| [87] | Yes | 24,325 | 12 US cities | No | 4 seasons | North |
| [89] | Yes | 19,783 | Morogoro, Tanzania | Yes | 2 seasons | South |
| [53] | No | 16,796,415 | Japan (entire country) | No | month | North |
| [82] | No | 12,150 | Aberdeen, Scotland | No | month | North |
| [56] | No | 52,041,052 | USA (entire country) | No | month | North |
| [83] | No | 225,545 | Israel (entire country) | No | month | North |
| [85] | No | 4,507 | Kimberly, Australia | No | month | North |
| [84] | No | 1,573,203 | Queensland, Australia | No | month | North |
| [86] | No | 5,291 | Rome, Italy and Sassary, Italy | No | 4 seasons | North |
| [54] | No | 516,874 | Greece (entire country) | No | 4 seasons | North |
© 2013 by the authors; licensee MDPI, Basel, Switzerland. This article is an open access article distributed under the terms and conditions of the Creative Commons Attribution license (http://creativecommons.org/licenses/by/3.0/).
Share and Cite
Beltran, A.J.; Wu, J.; Laurent, O. Associations of Meteorology with Adverse Pregnancy Outcomes: A Systematic Review of Preeclampsia, Preterm Birth and Birth Weight. Int. J. Environ. Res. Public Health 2014, 11, 91-172. https://doi.org/10.3390/ijerph110100091
Beltran AJ, Wu J, Laurent O. Associations of Meteorology with Adverse Pregnancy Outcomes: A Systematic Review of Preeclampsia, Preterm Birth and Birth Weight. International Journal of Environmental Research and Public Health. 2014; 11(1):91-172. https://doi.org/10.3390/ijerph110100091
Chicago/Turabian StyleBeltran, Alyssa J., Jun Wu, and Olivier Laurent. 2014. "Associations of Meteorology with Adverse Pregnancy Outcomes: A Systematic Review of Preeclampsia, Preterm Birth and Birth Weight" International Journal of Environmental Research and Public Health 11, no. 1: 91-172. https://doi.org/10.3390/ijerph110100091