Objectively Measured Activity Patterns among Adults in Residential Aged Care

 ,
,
Abstract
:1. Introduction
2. Methods
2.1. Context
2.2. Data Collection
2.3. Measures
2.3.1. Sociodemographic Measures
2.3.2. Physical Measures
2.3.3. Cognitive Measures
2.3.4. Activity Outcomes
2.3.5. Evaluation of Feasibility
2.4. Data Processing
2.5. Sample Size
2.6. Statistical Analyses
3. Results
3.1. Sample Characteristics

| Characteristics | Activity Patterns Study (n = 31) | Eligible Non-Participants (n = 45) | p value | |
|---|---|---|---|---|
| Age (years) mean | 84.2 | 83.6 | 0.767 | |
| Women | 20 (64.5%) | 26 (57.8%) | 0.273 | |
| Current smoker | 7 (22.2%) | 6 (13.3%) | 0.458 | |
| Currently consume alcohol | 6 (19.4%) | 16 (35.6%) | 0.203 | |
| Education–Secondary or higher | 16 (51.6%) | 27 (60.0%) | 0.624 | |
| Body Mass Index (kg∙m−2) a mean (SD) | 27.2 (5.7) | 27.9 (5.6) | 0.939 | |
| Underweight (<18.5) | 1 (3.0%) | 0 (0.0%) | ||
| Normal (18.5–24.99) | 10 (32.3%) | 12 (27.9%) | ||
| Overweight (25.0–29.99) | 11 (35.5%) | 16 (37.2%) | ||
| Obese (≥30.0) | 9 (29.0%) | 15 (34.9%) | ||
| Any falls in previous 6 months—Yes | 11 (35.5%) | 17 (37.8%) | 0.837 | |
| Seniors Physical Performance Battery (0–12) b | 4.0 (1–9) | 2.0 (0–11) | 0.063 | |
| Repeated Chair Stands (s) c | 21 (16.4–29.5) | 22.5 (12.9–29.4) | ||
| Standing Balance (s) | 20 (10–30) | 20 (10–30) | ||
| Walking Speed (m∙s−1) | 0.43 (0.14–0.75) | 0.34 (0.02–1.0) | ||
| Mini Mental State Exam (0–30) b | 0.468 | |||
| Moderate/Severe Cog Impairment (0–18) | 9 (29.0%) | 11 (24.4%) | ||
| Mild Cog Impairment (19–24) | 8 (25.8%) | 19 (42.2%) | ||
| No Cog Impairment (25–30) | 14 (45.2%) | 15 (33.3%) | ||
| Geriatric Depression Scale (0–30) b | 0.552 | |||
| Severe (0–9) | 19 (61.3%) | 25 (55.6%) | ||
| Mild (10–19) | 5 (16.1%) | 8 (17.8%) | ||
| None (20–30) | 7 (22.6%) | 12 (26.7%) | ||
3.1.1. Aim 1: Feasibility of Measurement
3.1.2. Aim 2: Activity Patterns
Overall Activity Patterns
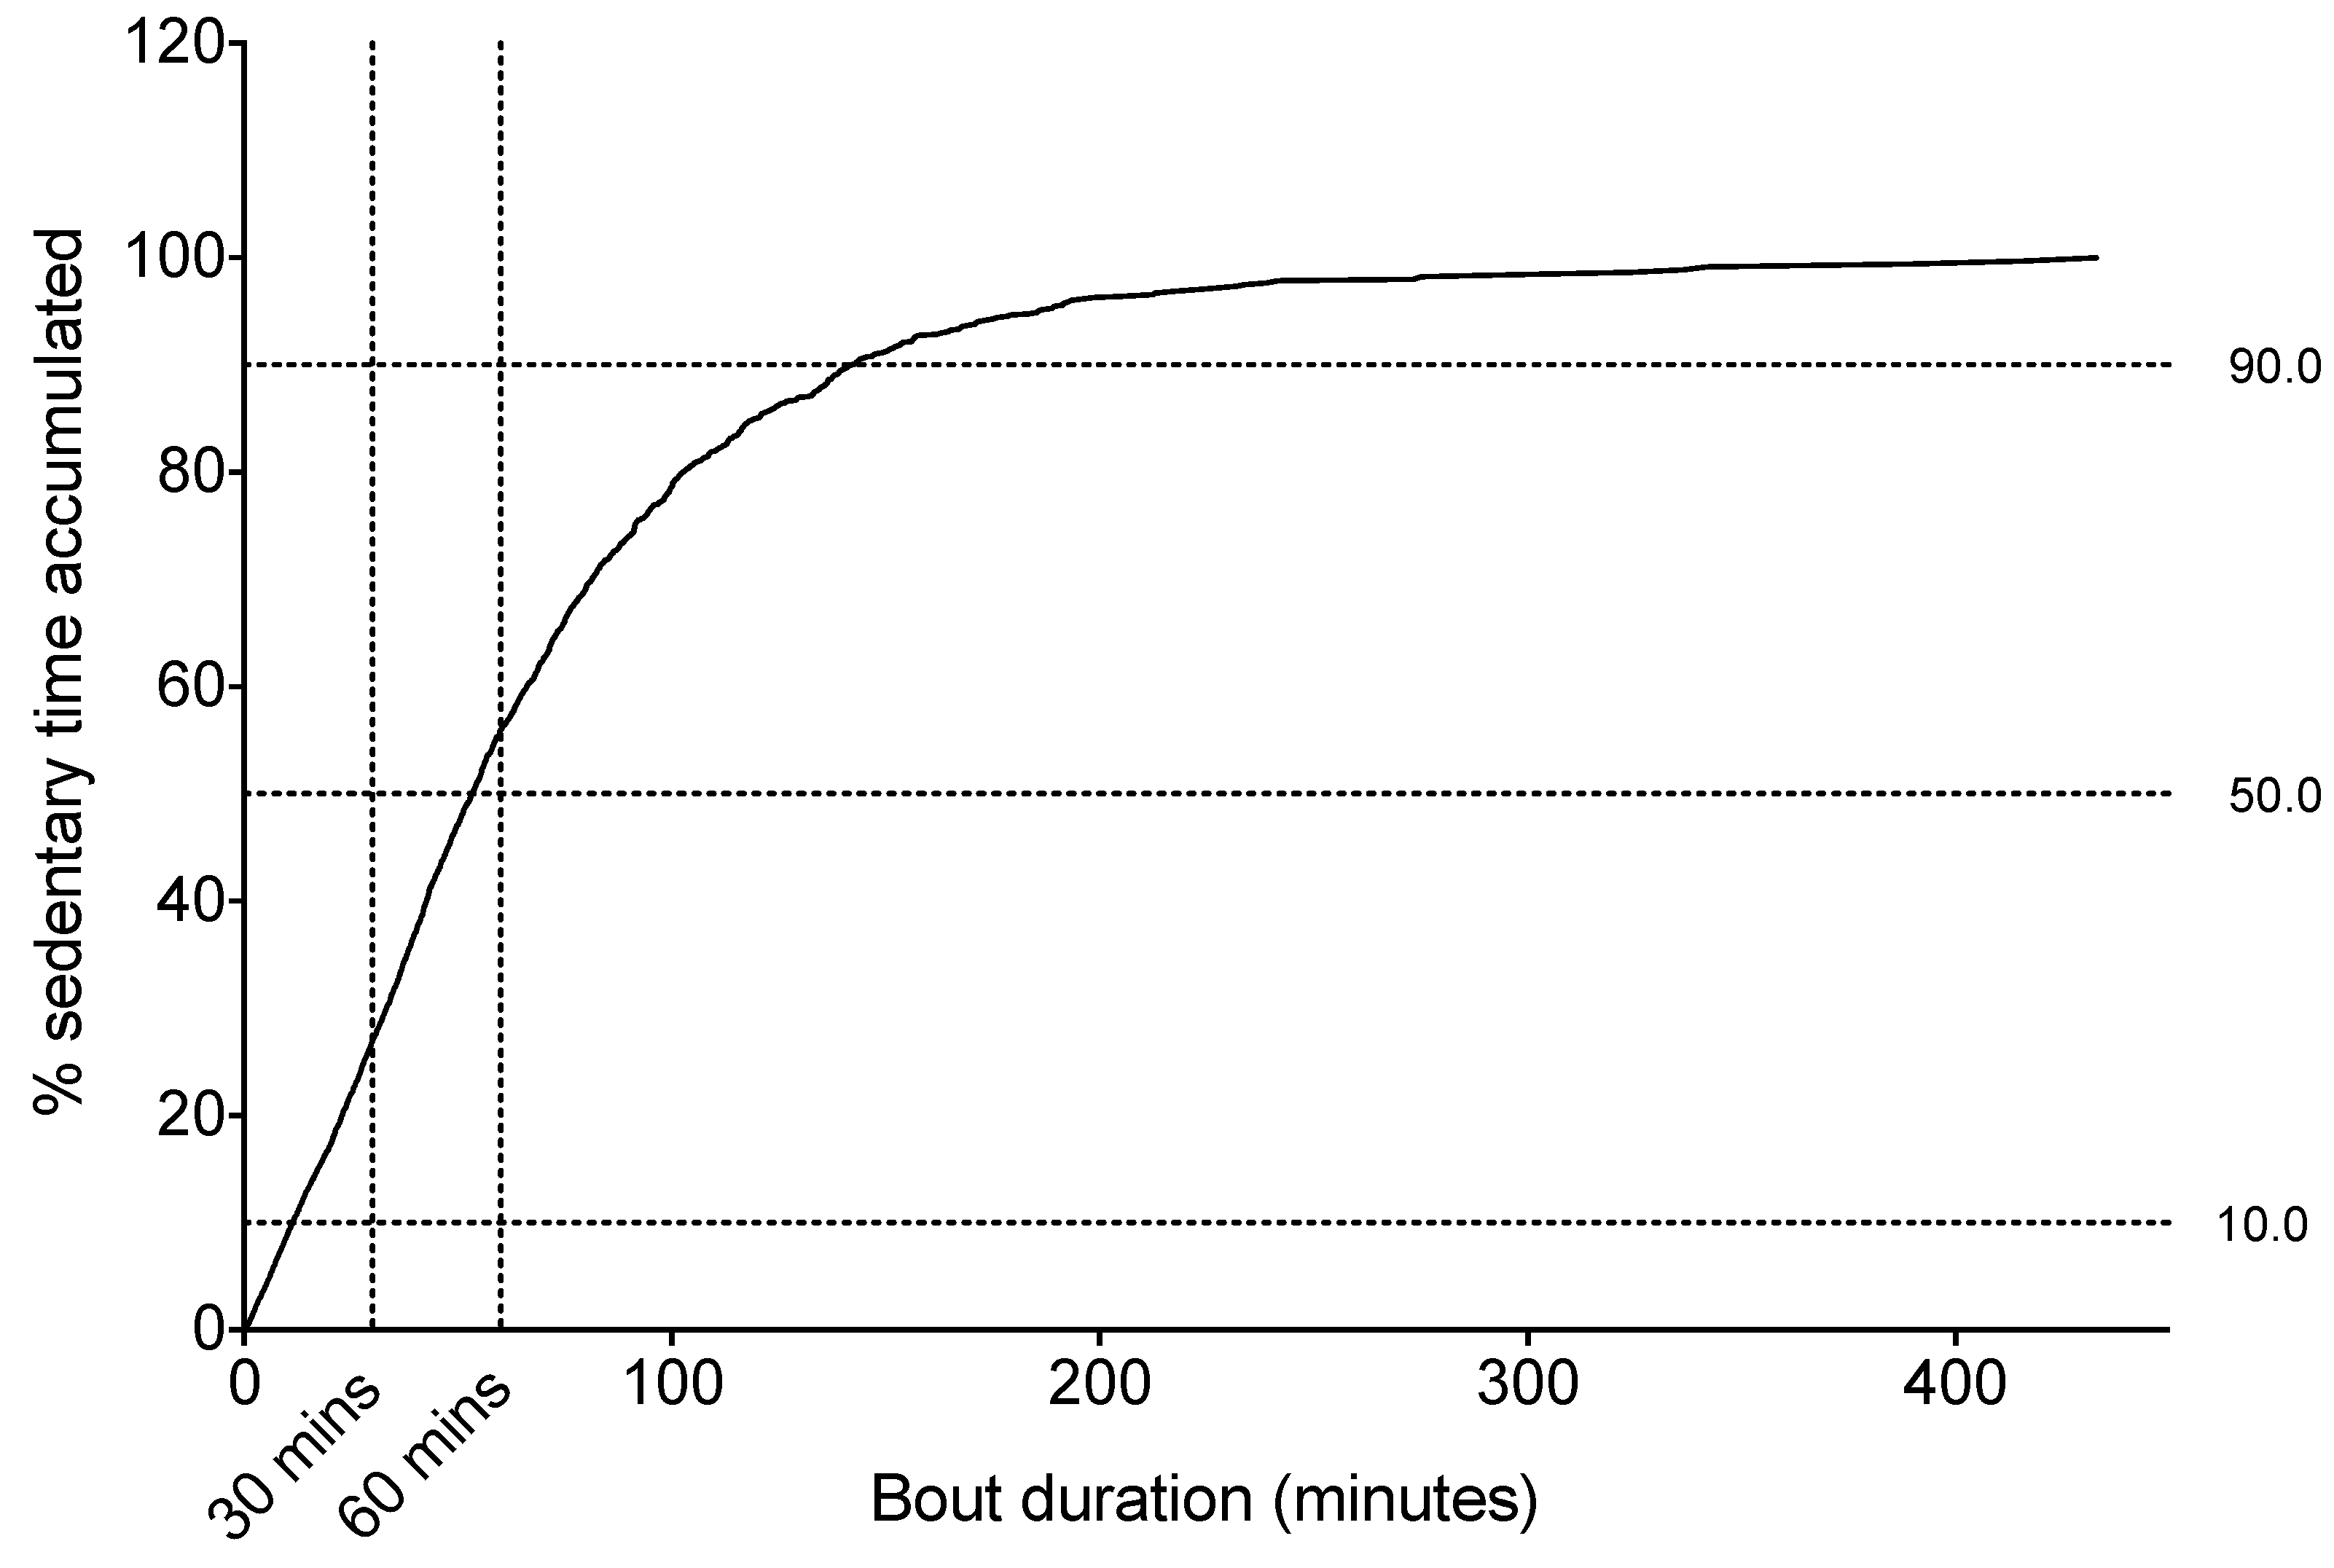
Sitting Time Accrual
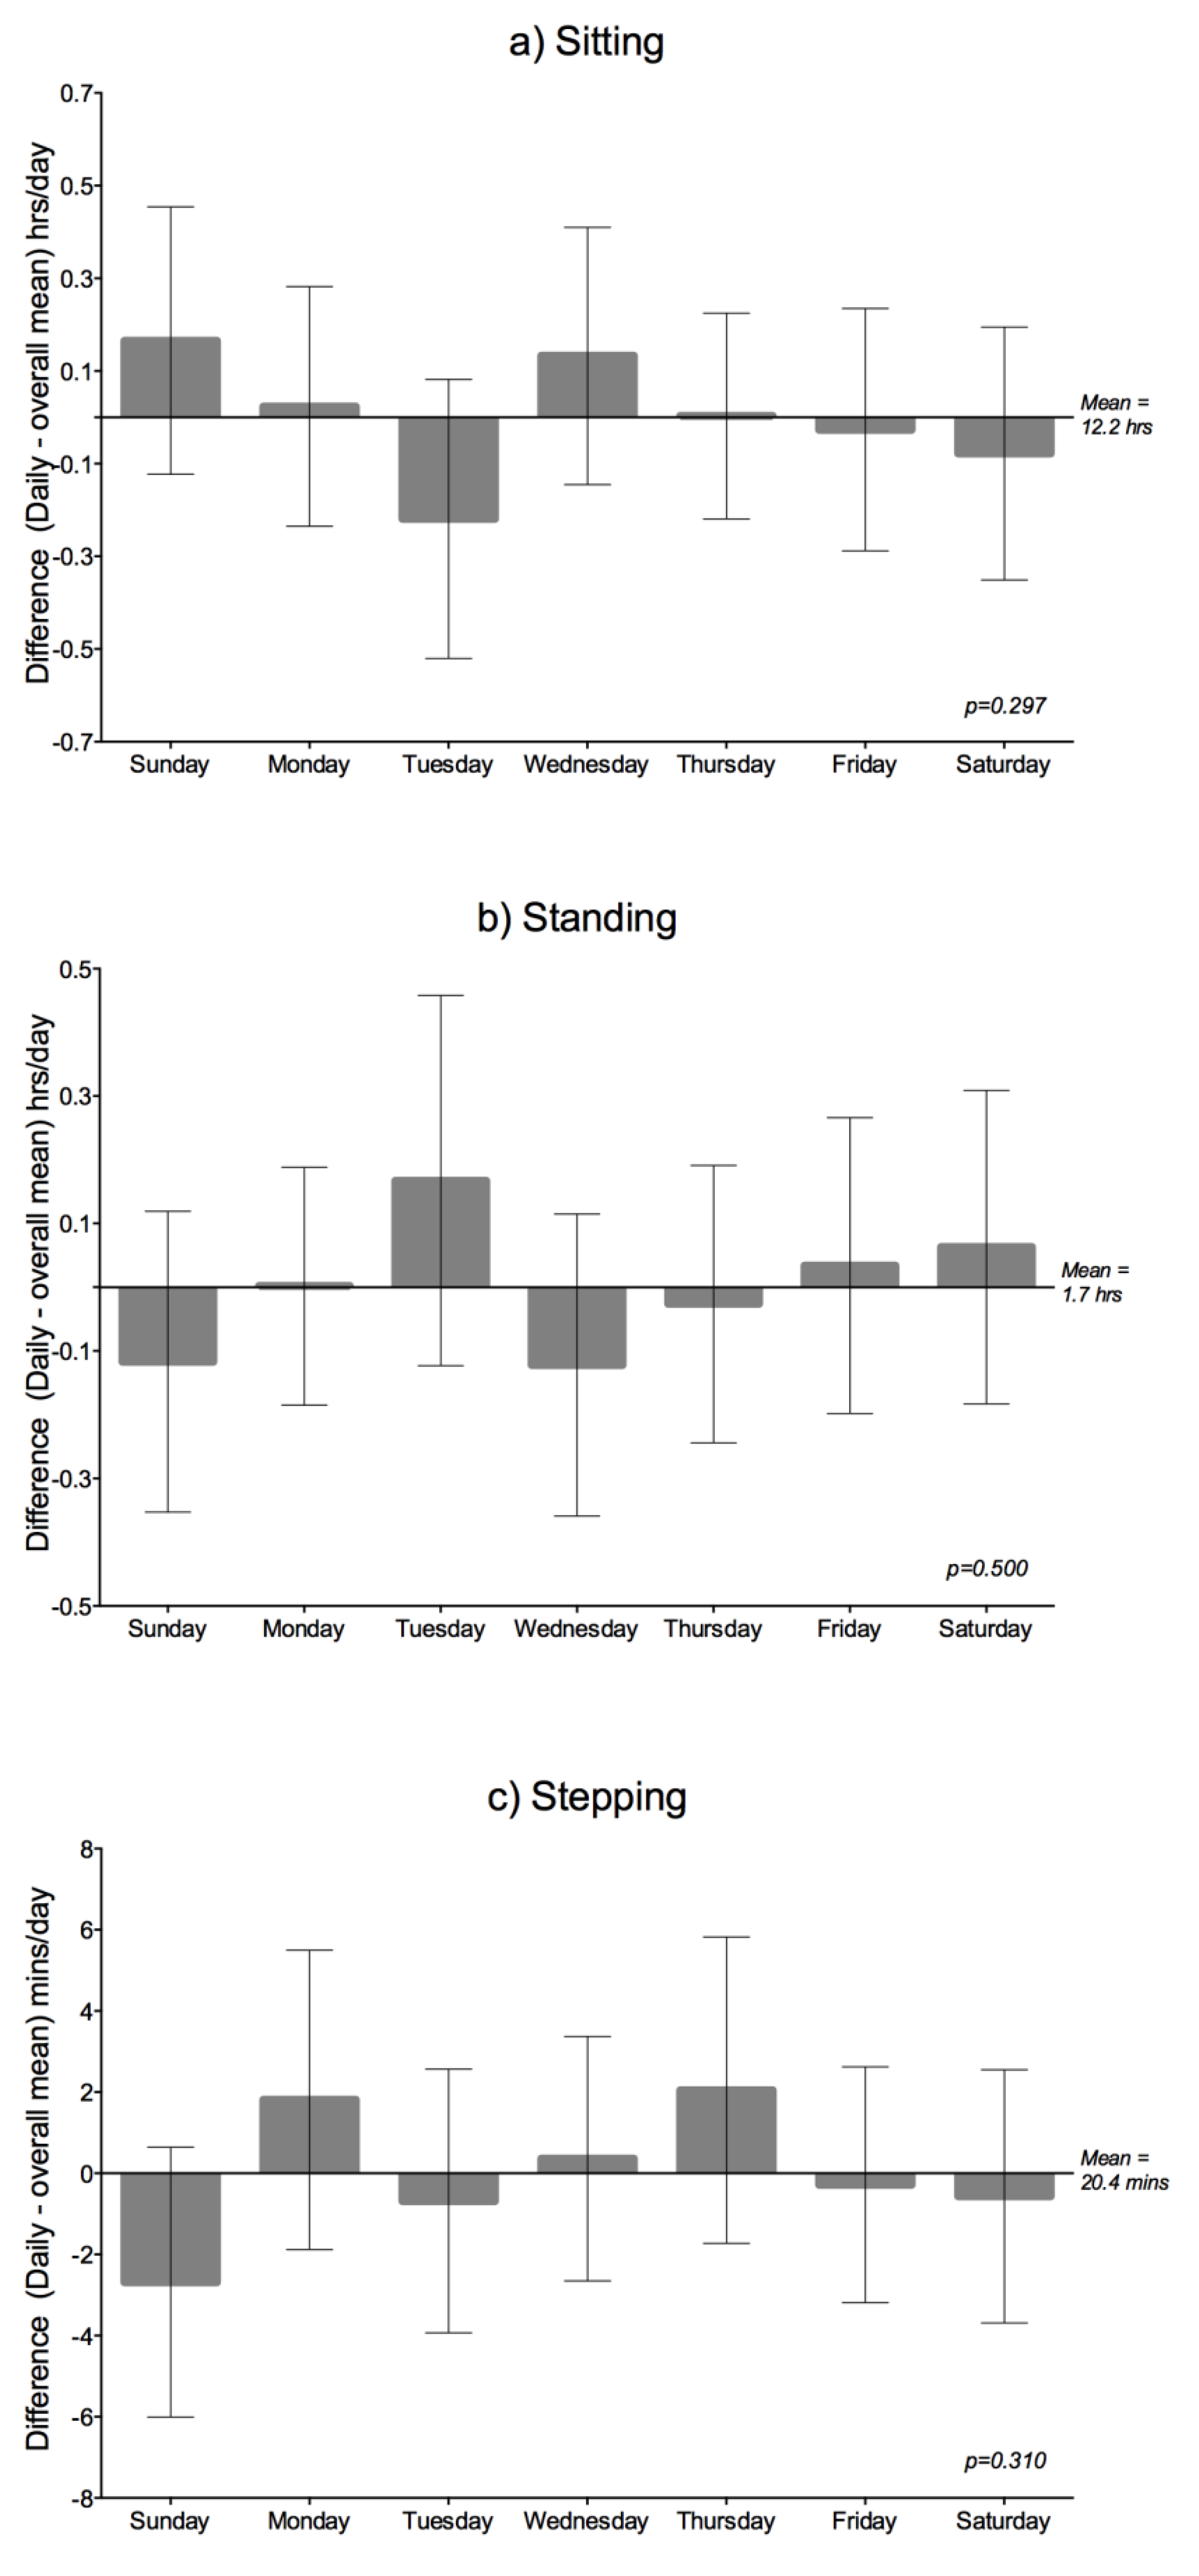
Daily Variation

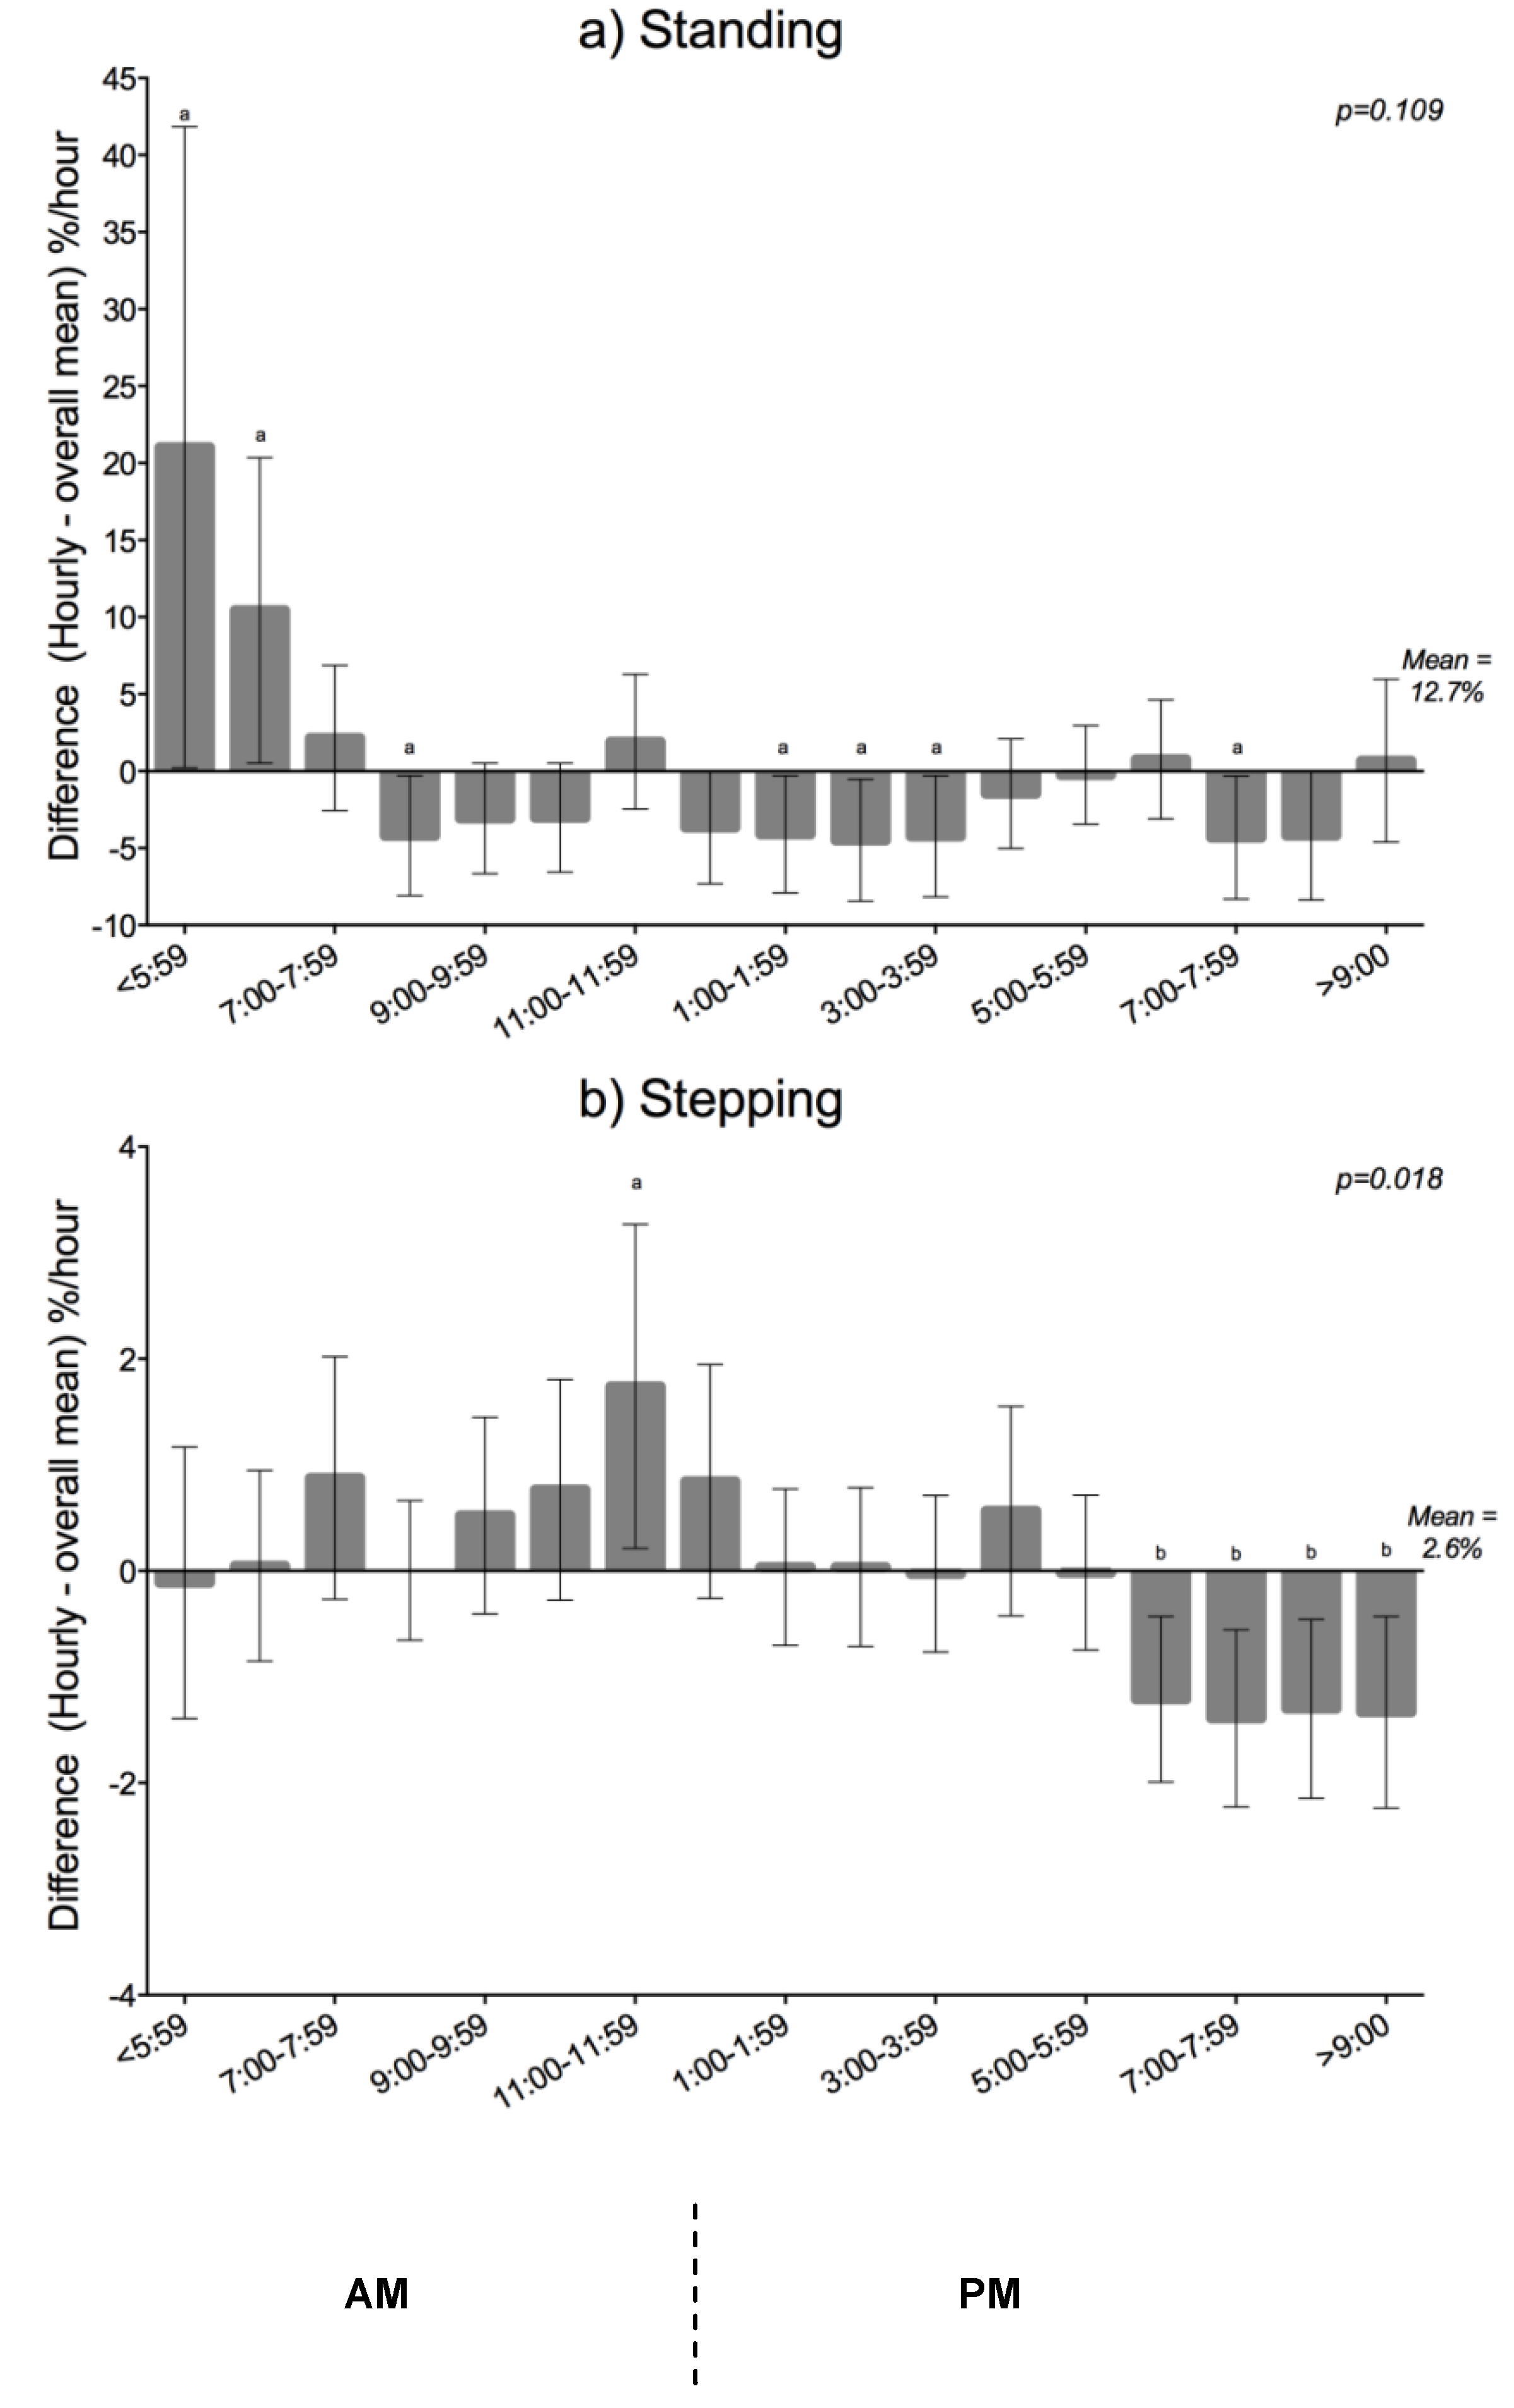
Hourly Variation
4. Discussion
5. Conclusions
Acknowledgments
Conflicts of Interest
References
- Matthews, C.E.; Hagstromer, M.; Pober, D.M.; Bowles, H.R. Best practices for using physical activity monitors in population-based research. Med. Sci. Sports Exerc. 2012, 44, S68–S76. [Google Scholar] [CrossRef]
- Physical Activity Guidelines for Americans: Active Older Adults; US Department of Health and Human Services: Washington, DC, USA, 2008.
- Matthews, C.E.; Chen, K.Y.; Freedson, P.S.; Buchowski, M.S.; Beech, B.M.; Pate, R.R.; Troiano, R.P. Amount of time spent in sedentary behaviors in the United States, 2003–2004. Am. J. Epidemiol. 2008, 167, 875–881. [Google Scholar] [CrossRef]
- Healy, G.N.; Clark, B.K.; Winkler, E.A.; Gardiner, P.A.; Brown, W.J.; Matthews, C.E. Measurement of adults’ sedentary time in population-based studies. Am. J. Prev. Med. 2011, 41, 216–227. [Google Scholar] [CrossRef]
- Blair, A.; Connelly, J.C. How much physical activity should we do? The case for moderate amounts and intensities of physical activity. Res. Q. Exerc. Sport 1996, 67, 193–205. [Google Scholar] [CrossRef]
- Hamilton, M.T.; Healy, G.N.; Dunstan, D.W.; Zderic, T.W.; Owen, N. Too little exercise and too much sitting: Inactivity physiology and the need for new recommendations on sedentary behavior. Curr. Cardiovasc. Risk Rep. 2008, 2, 292–298. [Google Scholar] [CrossRef]
- Owen, N.; Healy, G.N.; Matthews, C.E.; Dunstan, D.W. Too much sitting: The population health science of sedentary behavior. Exerc. Sport Sci. Rev. 2010, 38, 105–113. [Google Scholar] [CrossRef]
- Arnardottir, N.Y.; Koster, A.; van Domelen, D.R.; Brychta, R.J.; Caserotti, P.; Eiriksdottir, G.; Sverrisdottir, J.E.; Launer, L.J.; Gudnason, V.; Johannsson, E.; et al. Objective measurements of daily physical activity patterns and sedentary behaviour in older adults: Age, gene/environment susceptibility-reykjavik study. Age Ageing 2013, 42, 222–229. [Google Scholar] [CrossRef]
- World Health Organisation. Global Health and Aging; National Institute of Health: Bethesda, MD, USA, 2011. [Google Scholar]
- Australian Institute of Health and Welfare. Residential Aged Care in Australia 2010–11: A Statistical Overview; AIHW: Canberra, ACT, Australia, 2012.
- Lee, I.M.; Shiroma, E.J.; Lobelo, F.; Puska, P.; Blair, S.N.; Katzmarzyk, P.T.; Lancet Physical Activity Series Working Group. Effect of physical inactivity on major non-communicable diseases worldwide: An analysis of burden of disease and life expectancy. Lancet 2012, 380, 219–229. [Google Scholar] [CrossRef] [Green Version]
- Alzheimer’s Australia. In Dementia Care in Residential Aged Care—Specialised Care or Core Business? Productivity Commission, Australian Government: Canberra, ACT, Australia, 2010.
- Davison, T.E.; Mccabe, M.P.; Mellor, D.; Ski, C.; George, K.; Moore, K.A. The prevalence and recognition of major depression among low-level aged care residents with and without cognitive impairment. Aging Ment. Health 2007, 11, 82–88. [Google Scholar] [CrossRef]
- Mutrie, N.; Doolin, O.; Fitzsimons, C.F.; Grant, P.M.; Granat, M.; Grealy, M.; Macdonald, H.; MacMillan, F.; McConnachie, A.; Rowe, D.A.; et al. Increasing older adults’ walking through primary care: Results of a pilot randomized controlled trial. Fam. Pract. 2012, 29, 633–642. [Google Scholar] [CrossRef]
- Clark, D.J.; Pojednic, R.M.; Reid, K.F.; Patten, C.; Pasha, E.P.; Phillips, E.M.; Fielding, R.A. Longitudinal decline of neuromuscular activation and power in healthy older adults. J. Gerontol. A Biol. Sci. Med. Sci. 2013, 68, 1419–1425. [Google Scholar] [CrossRef]
- Freire, A.N.; Guerra, R.O.; Alvarado, B.; Guialnik, J.M.; Zunzunegui, M.V. Validity and reliability of the short physical performance battery in two diverse older adult populations in Quebec and Brazil. J. Aging Health 2012, 24, 863–878. [Google Scholar] [CrossRef]
- Guralnik, J.M.; Simonsick, E.M.; Ferrucci, L.; Glynn, R.J.; Berkman, L.F.; Blazer, D.G.; Scherr, P.A.; Wallace, R.B. A short physical performanc battery assessing lower extremity function: Association with self-reported disability and prediction of mortality and nursing home admission. J. Gerontol. 1994, 49, M85–M94. [Google Scholar] [CrossRef]
- Folstein, M.F.; Folstein, S.E.; McHugh, P.R. “Mini-mental state”: A practical method for grading the cognitive state of patients for the clinician. J. Psychiatr. Res. 1975, 12, 189–198. [Google Scholar] [CrossRef]
- Tombaugh, T.N.; McIntyre, N.J. The mini-mental state examination: A comprehensive review. J. Am. Geriatr. Soc. 1992, 40, 922–935. [Google Scholar]
- Brink, T.L.; Yesavage, J.A.; Lum, O.; Heersema, P.H.; Adey, M.; Rose, T.L. Screening tests for geriatric depression. Clin. Gerontol. 1982, 1, 37–43. [Google Scholar] [CrossRef]
- Parmelee, P.A.; Lawton, M.P.; Katz, I.R. Psychometric properties of the geriatric depression scale among the institutionalised aged. J. Consul. Clin. Psychol. 1989, 1, 331–338. [Google Scholar]
- Grant, P.M.; Dall, P.M.; Mitchell, S.L.; Granat, M.H. Activty-monitor accuracy in measuring step number and cadence in community-dwelling older adults. J. Aging Phys. Act. 2008, 16, 201–214. [Google Scholar]
- Australian Institute of Health and Welfare. Older Austalia at a Gland; AIHW: Canberra, ACT, Australia, 2007.
- Kelly, T.L. The applicability of the spearman-brown formula for the measurmance of reliability. J. Educ. Psychol. 1925, 16, 300–303. [Google Scholar] [CrossRef]
- Rosie, J.; Taylor, D. Sit-to-stand as home exercise for mobility-limited adults over 80 years of age—Grandstand system may keep you standing? Age Ageing 2007, 36, 555–562. [Google Scholar] [CrossRef]
- Hart, T.L.; Swartz, A.M.; Cashin, S.E.; Strath, S.J. How many days of monitoring predict physical activity and sedentary behaviour in older adults? Int. J. Behav. Nutr. Phys. Act 2011, 8. [Google Scholar] [CrossRef]
- Clemson, L.; Singh, M.F.; Bundy, A.; Cumming, R.G.; Weissel, E.; Munro, J.; Manollaras, K.; Black, D. Life pilot study: A randomised trial of balance and strength training embedded in daily life activity to reduce falls in older adults. Aust. Occup. Ther. J. 2010, 57, 42–50. [Google Scholar] [CrossRef]
- Goodpastor, B.H.; Park, S.W.; Harris, T.B.; Kritchevsky, S.B.; Nevitt, M.; Schwartz, A.Z.; Simonsick, E.M.; Tylavsky, F.A.; Visser, M.; Newman, A.B. The loss of skeletal muscle strength, mass, and quality in older adults: The health, aging and body composition study. J. Gerontol. A Biol. Sci. Med. Sci. 2006, 61A, 1059–1064. [Google Scholar]
- O’Halloran, J.; Britt, H.; Valenti, L. General practitioner consultations at residential aged-care facilities. Med. J. Aust. 2007, 187, 88–91. [Google Scholar]
- Troiano, R.P.; Berrigan, D.; Dodd, K.W.; Masse, L.C.; Tilert, T.; McDowell, M. Physical activity in the United States measured by accelerometer. Med. Sci. Sports Exerc. 2008, 40, 181–188. [Google Scholar]
- Grant, P.M.; Granat, M.H.; Thow, M.K.; Maclaren, W.M. Analyzing free-living physical activity of older adults in different environments using body-worn activity monitors. J. Aging Phys. Act. 2010, 18, 171–184. [Google Scholar]
- van Deursen, L.L.; Patijn, J.; Durinck, J.R.; Brouwer, R.; van Erven-sommers, J.R.; Vortman, B.J. Sitting and low back pain: The positive effect of rotatory dynamic stimuli during prolonged sitting. Eur. Spine J. 1999, 8, 187–193. [Google Scholar] [CrossRef]
- Makhsous, M.; Lin, F.; Bankard, J.; Hendrix, R.W.; Hepler, M.; Press, J. Biomechanical effects of sitting with adjustable ischial and lumbar support on occupational low back pain: Evaluation of sitting load and back muscle activity. BMC Musculoskelet Disord 2009, 10. [Google Scholar] [CrossRef]
- Stranden, E. Dynamic leg volume changes when sitting in a locked and free floating tilt office chair. Ergonomics 2000, 43, 421–433. [Google Scholar] [CrossRef]
- Stein, T.P.; Wade, C.E. Metabolic consequences of muscle disuse atrophy. J. Nutr. 2005, 135, 1824S–1828S. [Google Scholar]
- Thibaud, M.; Bloch, F.; Tournoux-Facon, C.; Breque, C.; Rigaud, A.S.; Dugue, B.; Kemoun, G. Impact of physical activity and sedentary behaviour on fall risks in older people: A systematic review and meta-analysis of observational studies. Eur. Rev. Aging Phys. Act. 2011, 9, 5–15. [Google Scholar]
- Dunstan, D.W.; Kingwell, B.A.; Larsen, R.; Healy, G.N.; Cerin, E.; Hamilton, M.T.; Shaw, J.E.; Bertovic, D.A.; Zimmet, P.Z.; Salmon, J.; et al. Breaking up prolonged sitting reduces postprandial glucose and insulin reponses. Diabetes Care 2012, 35, 976–983. [Google Scholar] [CrossRef]
- Duvivier, B.M.F.; Schaper, N.C.; Bremers, M.A.; van Crombrugge, G.; Menheere, P.P.; Kars, M.; Savelberg, H.H. Minimal intensity physical activity (standing and walking) of longer duration improves insulin action and plasma lipids more than shorter periods of moderate to vigorous exercise (cycling) in sedentary subjects when energy expenditure is comparable. PLoS One 2013, 8. [Google Scholar] [CrossRef]
- Dowd, K.P.; Harrington, D.M.; Bourke, A.K.; Nelson, J.; Donnelly, A.E. The measuremnt of sedentary patterns and behaviours using the activPALTM Professional physical activity monitor. Physiol. Meas. 2012, 22, 1887–1899. [Google Scholar]
Supplementary Files
© 2013 by the authors; licensee MDPI, Basel, Switzerland. This article is an open access article distributed under the terms and conditions of the Creative Commons Attribution license (http://creativecommons.org/licenses/by/3.0/).
Share and Cite
Reid, N.; Eakin, E.; Henwood, T.; Keogh, J.W.L.; Senior, H.E.; Gardiner, P.A.; Winkler, E.; Healy, G.N. Objectively Measured Activity Patterns among Adults in Residential Aged Care. Int. J. Environ. Res. Public Health 2013, 10, 6783-6798. https://doi.org/10.3390/ijerph10126783
Reid N, Eakin E, Henwood T, Keogh JWL, Senior HE, Gardiner PA, Winkler E, Healy GN. Objectively Measured Activity Patterns among Adults in Residential Aged Care. International Journal of Environmental Research and Public Health. 2013; 10(12):6783-6798. https://doi.org/10.3390/ijerph10126783
Chicago/Turabian StyleReid, Natasha, Elizabeth Eakin, Timothy Henwood, Justin W. L. Keogh, Hugh E. Senior, Paul A. Gardiner, Elisabeth Winkler, and Genevieve N. Healy. 2013. "Objectively Measured Activity Patterns among Adults in Residential Aged Care" International Journal of Environmental Research and Public Health 10, no. 12: 6783-6798. https://doi.org/10.3390/ijerph10126783