Article

Suitability of Optical, Physical and Chemical Measurements for Detection of Changes in Bacterial Drinking Water Quality

Water and Health Unit, Department of Environmental Health, National Institute for Health and Welfare, P.O. Box 95, FI-70701 Kuopio, Finland
*
Author to whom correspondence should be addressed.
Int. J. Environ. Res. Public Health 2013, 10(11), 5349-5363; https://doi.org/10.3390/ijerph10115349
Submission received: 28 August 2013 / Revised: 10 October 2013 / Accepted: 13 October 2013 / Published: 25 October 2013

Abstract

:
In this study, different optical, physical and chemical measurements were tested for their capacity to detect changes in water quality. The tests included UV-absorbance at 254 nm, absorbance at 420 nm, turbidity, particle counting, temperature, pH, electric conductivity (EC), free chlorine concentration and ATP concentration measurements. Special emphasis was given to investigating the potential for measurement tools to detect changes in bacterial concentrations in drinking water. Bacterial colony counts (CFU) and total bacterial cell counts (TBC) were used as reference methods for assessing the bacterial water quality. The study consists of a series of laboratory scale experiments: monitoring of regrowth of Pseudomonas fluorescens, estimation of the detection limits for optical measurements using Escherichia coli dilutions, verification of the relationships by analysing grab water samples from various distribution systems and utilisation of the measurements in the case of an accidentally contaminated distribution network. We found significant correlations between the tested measurements and the bacterial water quality. As the bacterial contamination of water often co-occurs with the intrusion of matrixes containing mainly non-bacterial components, the tested measurement tools can be considered to have the potential to rapidly detect any major changes in drinking water quality.

1. Introduction

Prevention and control of unfavourable changes in drinking water quality are daily challenges in waterworks worldwide. The origin of raw water, water treatment techniques, and bacterial regrowth (biofilm formation) in distribution systems influences water quality and distribution systems can be considered as biological and chemical reactors that interact with transported water [1,2,3] . The growth potential of heterotrophic microbes in water distribution systems has been considered to have a relationship with the assimilable organic carbon (AOC) concentration in water [4] and in boreal regions, bacterial growth is known to be regulated by the availability of phosphorus [5]. Thus, efficient removal of nutrients is required to prevent bacterial regrowth in distribution systems. The quality of the distributed drinking water is also threatened by changes in water hydraulics and intrusions, i.e., changes in water velocities, due to maintenance work such as pipe flushing, or injuries or other accidental events in the distribution system such as breaks in pipes [6,7]. Also heavy rainfall events can affect drinking water quality [8]. The monitoring of drinking water quality focuses on verification of the water quality in the distribution system [9]. Continuous monitoring of water quality in distribution systems is rare in routine water quality verification procedures and therefore transient deterioration of water quality in the system might not been detected.
Bacterial drinking water quality is usually measured as heterotrophic plate count (HPC), commonly by cultivation on YEA or R2A media [10,11]. The ability of HPC to predict the total bacterial load of the water sample has been criticised since it has been reported that HPC’s have been only 25.2% [12] or less [13] of the total bacterial counts. Another method for detecting bacteria in the drinking water is total bacterial counting, utilising fluorochromes and an epiflurecence microscope [14,15,16]. Total bacterial cell count detects all, but do not differentiate between viable, including viable but not culturable (VBNC), and non-viable cells [17]. The viability of the bacterial cells can be observed by measuring adenosine triphosphate (ATP) [18,19], since all viable cells contain ATP [20]. Recently, rapid and cultivation-independent approaches combining ATP measurement and flow cytometry have been developed for monitoring microbial activity in the drinking water [13,21,22], bringing new options for use of ATP as an early warning tool for monitoring drinking water quality.
In addition to the aforementioned applications, various optical, physical and chemical measurements may provide useful information on the characteristics of the water. The applications include optical measurements of UV-absorbance at 254 nm, absorbance at 420 nm, turbidity and particle counts. On-line monitoring applications for these parameters have been tested in karst springs [23,24], in drinking water treatment [25] and distribution networks [26,27]. As the use of optical measurements require resources, i.e., investments in equipment, the potential for conventional physical water quality measurements, including temperature, pH and electric conductivity (EC), to detect rapid water quality changes are also worthy of investigation [24]. Moreover, measurements of free chlorine concentration may have important value in water quality characterization especially in terms of controlling bacterial regrowth by ensuring a sufficient amount of residual disinfectant in the drinking water distribution networks [28].
In this work, the capacity of selected optical, physical and chemical measurements to detect microbiological impurities in the water was studied. Many of these measurements are already in use on a daily basis at waterworks and therefore have the potential to be utilised more efficiently as early warning tools for detecting changes in water quality. Different approaches were used to observe how bacterial regrowth or emerging bacterial contamination could be detected, utilising non-bacterial measurements, i.e., UV-absorbance at 254 nm, absorbance at 420 nm, turbidity, particle counting, temperature, pH, EC, free chlorine concentration and ATP concentration. The relationships between measured parameters and bacterial counts were sought by following Pseudomonas fluorescens regrowth in nutrient solution and by estimating the detection limits of the measurements according to different concentrations of Escherichia coli in spring water. In addition, the detected relationships were verified by analysing drinking water samples from different distribution systems and utilising the measurements for drinking water accidentally contaminated by sewage.

2. Material and Methods

2.1. Monitoring Growth of Pseudomonas fluorescens

The bacterial strain Pseudomonas fluorescens P17, biotype 7.2 (ATCC 49642) was used as a test strain in this study. A nutrient solution for P. fluorescens was prepared with commercial spring water and contained 1 mg/L acetate C/L and 1.5 g/L inorganic nutrient salt solution [29]. The solution was sterilized in an autoclave (120 °C) for a minimum of 15 min. After sterilizing, zero samples were taken and P. fluorescens bacteria inoculation was pipetted into duplicate nutrient solution flasks (1,500 mL). The flasks were incubated at room temperature (20.9–26.6 °C) and samples were taken every day for one week after the inoculation, apart from the first experiment, in which the bacterial growth was followed for two weeks. The colony counts (CFU) were measured on Reasoner`s 2 Agar (R2A) medium (Difco, Detroit, MI, USA) incubated at 22 ± 2 °C for 7 days [10]. Acridine orange direct counting (AODC) [14] using an Olympus BX51TF epifluorescence microscope (Olympus Co. Ltd., Tokyo, Japan) was used to analyse the total bacterial counts (TBC). The experiment was repeated nine times.
During the experiment, several optical and physical parameters were measured from the samples. UV-absorbance at 254 nm and absorbance at 420 nm were measured using a spectrophotometer (UV 1601, Shimadzu Corporation, Kyoto, Japan). Turbidity (at 860 nm) was measured using a turbidity meter (Turb 555-IR WTW, Weilheim, Germany) and for total particle counts, a particle counter WaterViewer S/N 604-2 (Pamas GmbH, Rutesheim, Germany) was used with a sensor having a 1 µm particle size detection limit (max. 120,000 particles/mL). The particle counter separated the number of particles per millilitre into 8 size classes in the ranges: 1–1.5, 1.5–2, 2–4, 4–8, 8–15, 15–25, 25–50 µm and >50 μm. Temperature, pH and electric conductivity were measured using a pH-meter (340i WTW, Weilheim, Germany). The ATP concentrations were measured with an ATP Biomass Kit HS Prod. No. 266-311 (BioThema AB, Handen, Sweden) using a luminometer (BioOrbit, Turku, Finland).

2.2. Monitoring Escherichia coli in Spring Water

E. coli (ATCC 8739) was cultured on Tryptone soya agar (TSA) and incubated overnight at 36 ± 2 °C. The bacterial mass was suspended into a test tube that contained 5 mL of spring water (Novelle, Turku, Finland). Series of ten-fold dilutions were made into end volumes of 100 mL of spring water. The E. coli counts were measured on Cromocult© coliform agar (CC) medium (Merck KgaA, Darmstadt, Germany).
UV-absorbance at 254 nm and turbidity were measured from the samples, as described in Section 2.1. Total particle counts were measured utilising a particle counter SVSS-C (Pamas GmbH) with a sensor SLS 25/25 with a 0.5 µm detection limit (max. 13,000 particles/mL) that detected particles in the size classes of 0.5–0.6, 0.6–0.7, 0.7–0.8, 0.8–0.9, 0.9–1, 1–1.1, 1.1–1.5, 1.5–2, 2–3, 3–4, 4–5, 5–7, 7–10 10–15, 15–20 and >20 µm/mL. The experiment was repeated three times. The detection limit was defined based on the standard deviation and linearity of the results over the range of E. coli concentrations.

2.3. Monitoring of Water Samples from Distribution Systems

Drinking water samples were analysed from the drinking water distribution systems of five towns with populations of ca. 9,400–92,600 inhabitants and one rural community with a population of ca. 7,500 in central Finland. Water samples were collected in three consecutive sampling rounds between May and December in 2007 with a total of 52 water samples being analysed. In three towns (A, B, C), the raw water source was groundwater. In town D, artificially produced groundwater was distributed. Town E distributed drinking water originating from a mixture of groundwater and treated surface water. In the rural community F, groundwater was used. Post-chlorination was used as the disinfection in four towns (A, C, D and E). There was no disinfection in town B. UV disinfection was used in the waterworks of rural community F. The selection criterion of sampling locations from the distribution system was any prior detected water quality deterioration. At the time of sampling, sodiumthiosulphate was used to neutralize active chlorine from the samples. Water samples were delivered to the laboratory in coolers and analysed within 24 h.
The optical and physical parameters were measured as described in Section 2.1 exception for the particle counter used with the two latter sampling rounds, which was the PAMAS SVSS-C with sensor HCB-LD 50/50 having a 1µm detection limit (max. 24,000 particles/mL) and measured size classes of 1–1.5, 1.5–2, 2–2.5, 2.5–3, 3–3.5, 3.5–4, 4–4.5, 4.5–5, 5–5.5, 5.5–6, 6–6.5, 6.5–7, 7–7.5, 7.5–8 µm/mL. The concentration of free chlorine was measured using a photometer (Chlorometer 1000, Palintest, Gateshead, UK). The heterotrophic plate count (HPC) was analysed on R2A medium (Difco) at 22 ± 2 °C for 7 days [10] and on Yeast extract agar (YEA) at 22 °C (ISO 6222, 1999). Counts of coliform bacteria (including E. coli) and intestinal enterococci were analysed with a membrane filtration method utilising the mEndo Agar Les medium (SFS 3016, 2001) and the Slanetz & Bartley medium (ISO 7899-2, 2000), respectively. The TBC was counted as described in Section 2.1. The nutrient concentrations were analysed from the distribution water system of town D (number of samples, N = 14). Assimilable organic carbon (AOC) was analysed according to Miettinen et al. [29] and total organic carbon (TOC) with a high temperature combustion method (5000 TOC analyser, Shimadzu). Microbially available phosphorus (MAP) was analysed according to Lehtola et al. [30] and the standard method SFS-EN 1189 (1997) was used to analyse total phosphorus (total P).

2.4. The Case of an Accidentally Contaminated Distribution Network

During this work we had an opportunity to utilise the measurements with drinking water samples (N = 3) originating from an accidental sewage contamination episode. The contamination led to a serious waterborne outbreak in the Nokia municipality in December 2007. Turbidity, particle counts, temperature, pH and EC were measured as described in Section 2.3. The cause of the contamination was an illegal connection between a sewage pipe and the distribution system [31].

2.5. Statistical Analysis

Statistical analyses were performed using PASW Statistics 18 for Windows (SPSS Inc., Chicago, IL, USA). The relationship between optical, physical and chemical parameters and bacterial counts was assessed using Spearman’s rank correlation test.

3. Results

The number of samples, and median and range (min–max) of the bacterial numbers in the Pseudomonas fluorescens experiment (Section 3.1) and the E. coli experiment (Section 3.2) are presented in Table 1.
Table 1. Descriptive statistics of bacterial numbers (CFU/mL and cells/mL) in the Pseudomonas fluorescens regrowth experiment and the E. coli experiments in spring water.
NMedianMin–Max
Pseudomonas fluorescens
colony counts749.3 × 1051.0 × 102–8.8 × 10⁶
total cell counts588.9 × 1051.9 ×102–4.6 × 10⁷
E. coli colony counts203.05 × 1040–3.6 × 10⁷

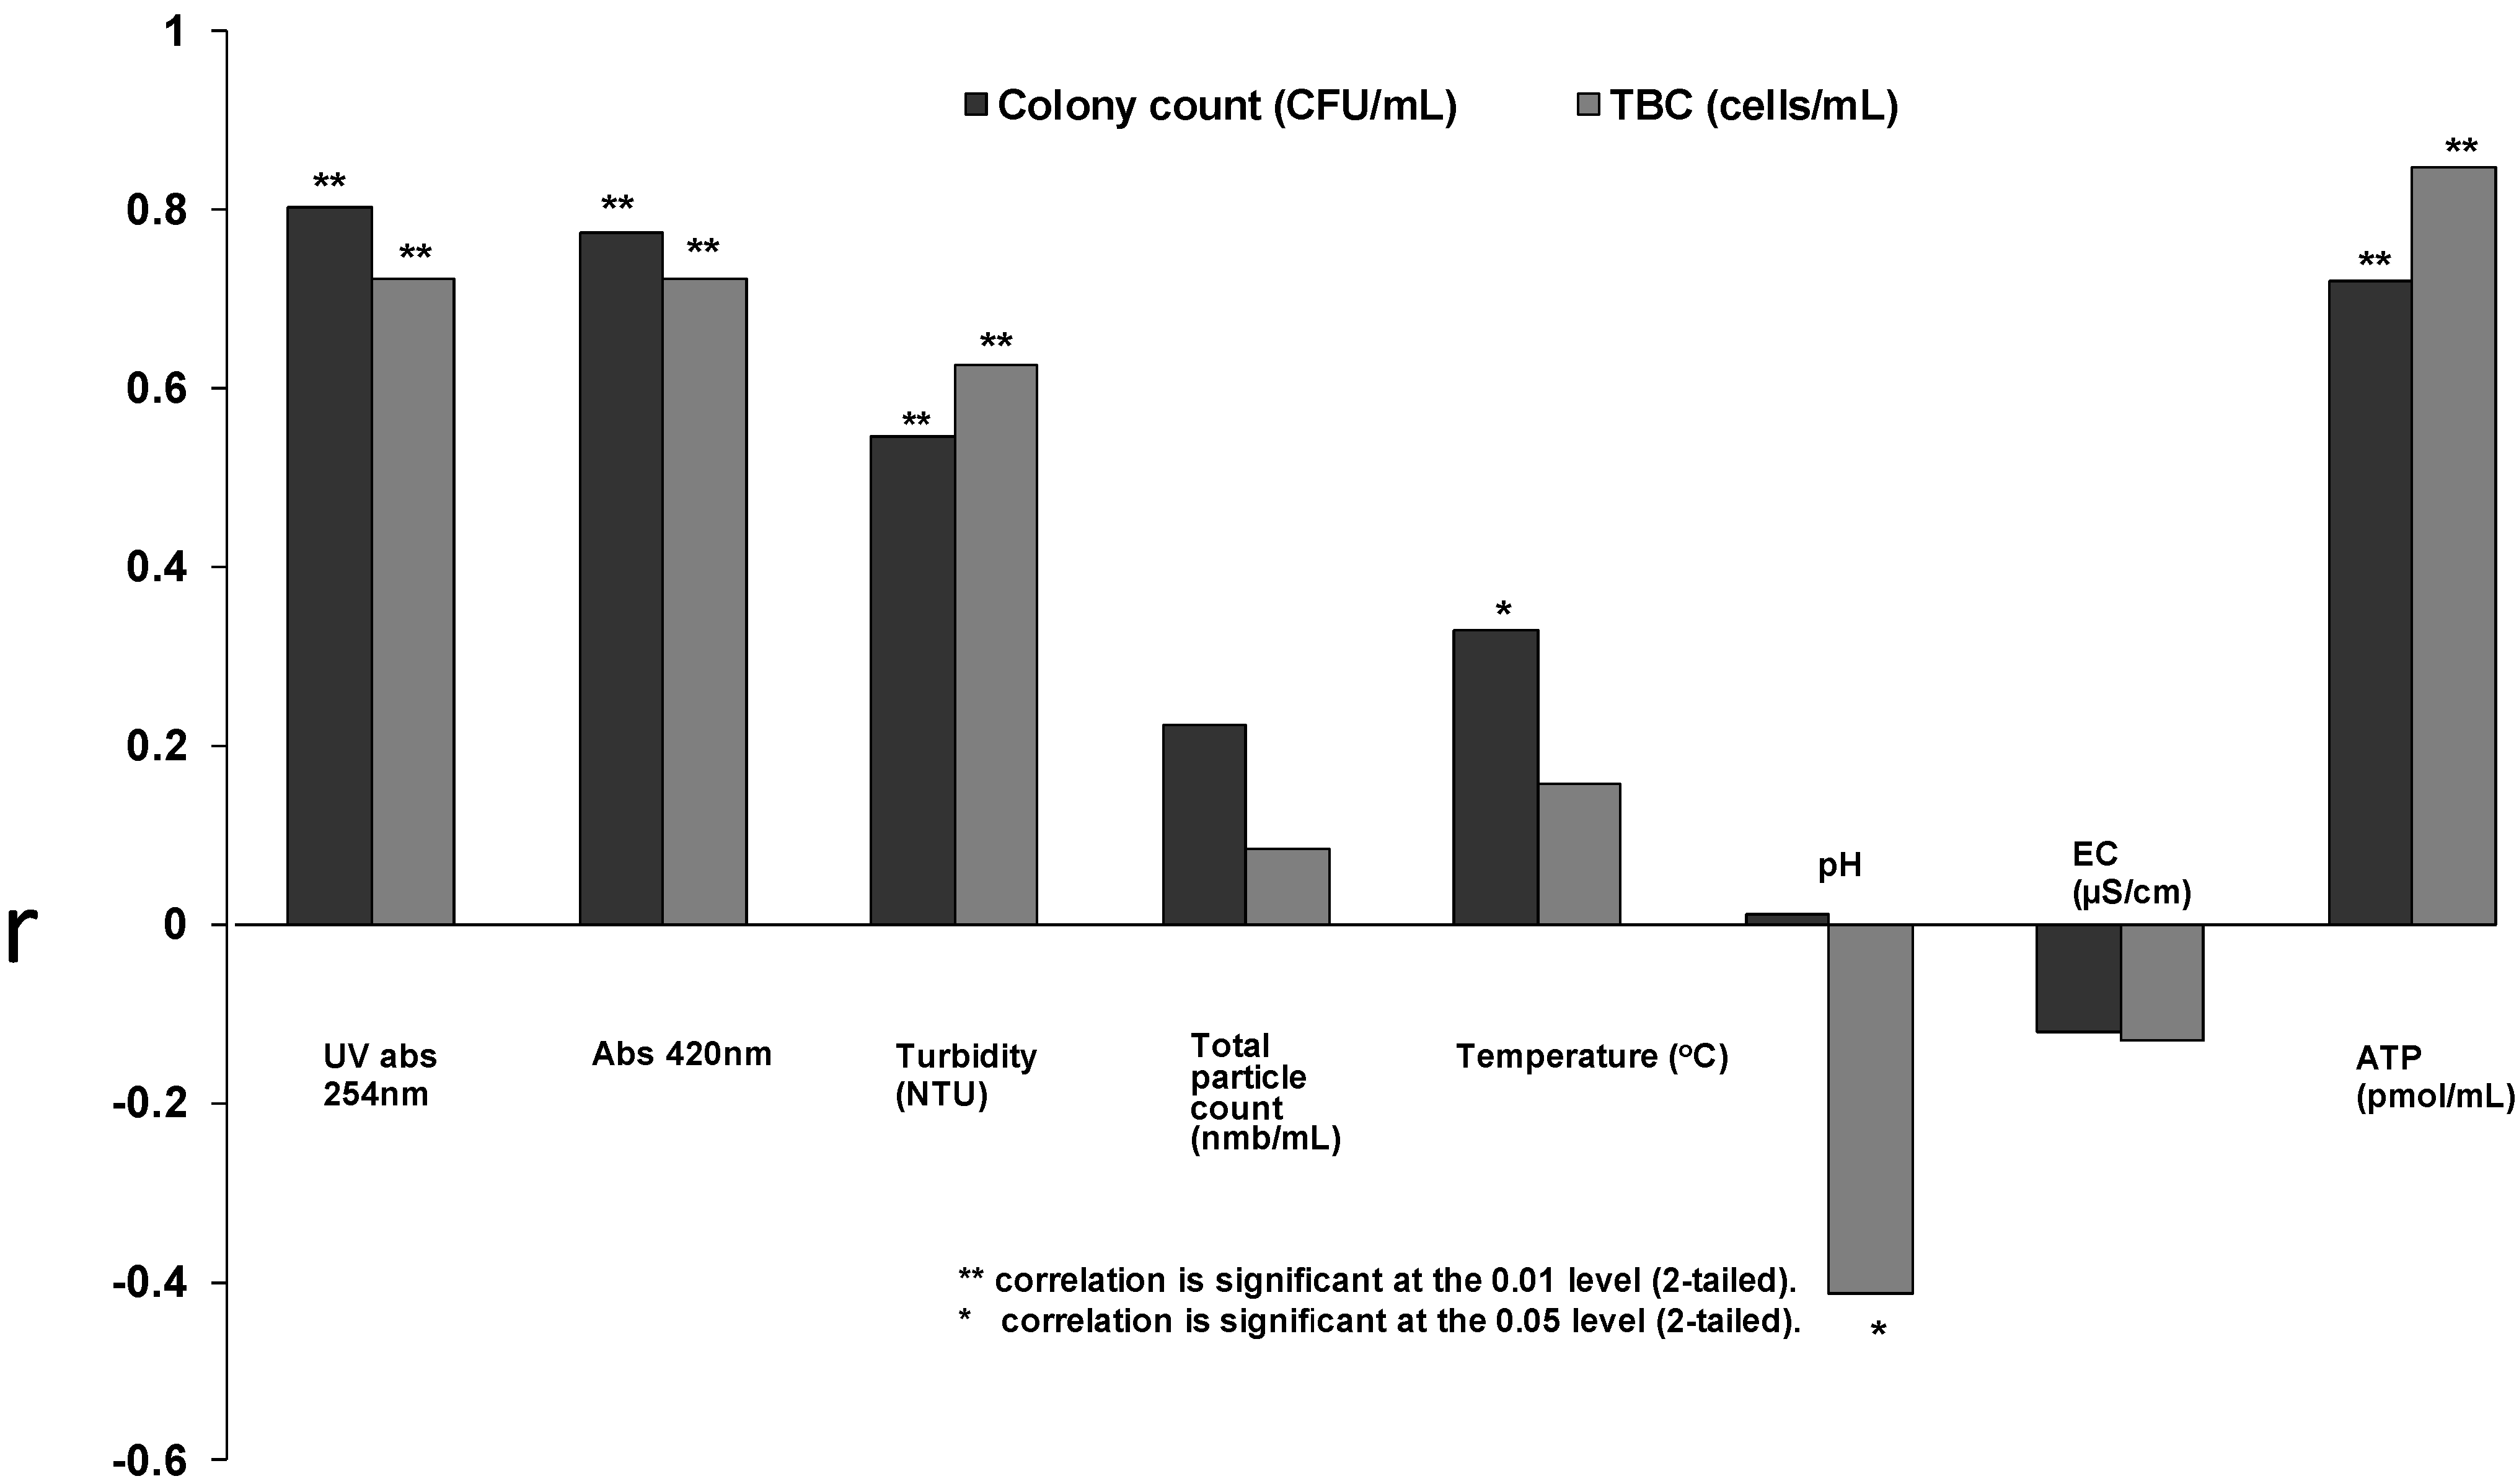
3.1. Growth of Pseudomonas fluorescens

The mean P. fluorescens count (±SD) in the nutrient solution immediately after inoculation was 180 ± 80 CFU/mL. The stationary state of colony counts (3.3 × 10⁷ ± 1.1 × 10⁶ CFU/mL) and total cell counts (4.6 × 10⁷ ± 5.6 × 10⁶ cells/mL) was achieved before the fifth day of incubation at room temperature. Correlation coefficients between P. fluorescens colony counts and optical measurements showed an association with UV-absorbance at 254 nm (r = 0.802, p < 0.001) and absorbance at 420 nm (r = 0.774, p < 0.001), while turbidity showed a moderate relationship with P. fluorescens counts (r = 0.546, p < 0.001) (Figure 1). No relationship between particle and colony counts was detected. Instead, a connection between ATP concentration and the colony counts was found (r = 0.721, p < 0.001). Temperature (16.8–25.8 °C), pH (6.3–7.9) and EC (50–70 µS/cm) remained almost stable during the experiments. When the results of the measurements were compared with TBC, somewhat similar relationships were found (Figure 1). TBC and UV-absorbance at 254 nm and absorbance at 420 nm both exhibited significant correlations (r = 0.723, p < 0.001) while the relationship between turbidity and TBC was also significant (r = 0.626, p < 0.001). The highest correlation was found between ATP concentration and TBC (r = 0.847, p < 0.001). Colony counts and TBC correlated at the 99% significance level (r = 0.671, p < 0.001).
Figure 1. Spearmann’s rank correlation coefficients (r) of bacterial colony counts (CFU/mL) and total cell counts (TBC) with UV-absorbance at 254 nm (N = 77) and absorbance 420 nm (N = 82), turbidity (N = 64), total particle count (N = 47), temperature (N = 61), pH (N = 62), electric conductivity (N = 62) and ATP concentration (N = 33) in the P. fluorescens growth experiments in nutrient solution.
Ijerph 10 05349 g001

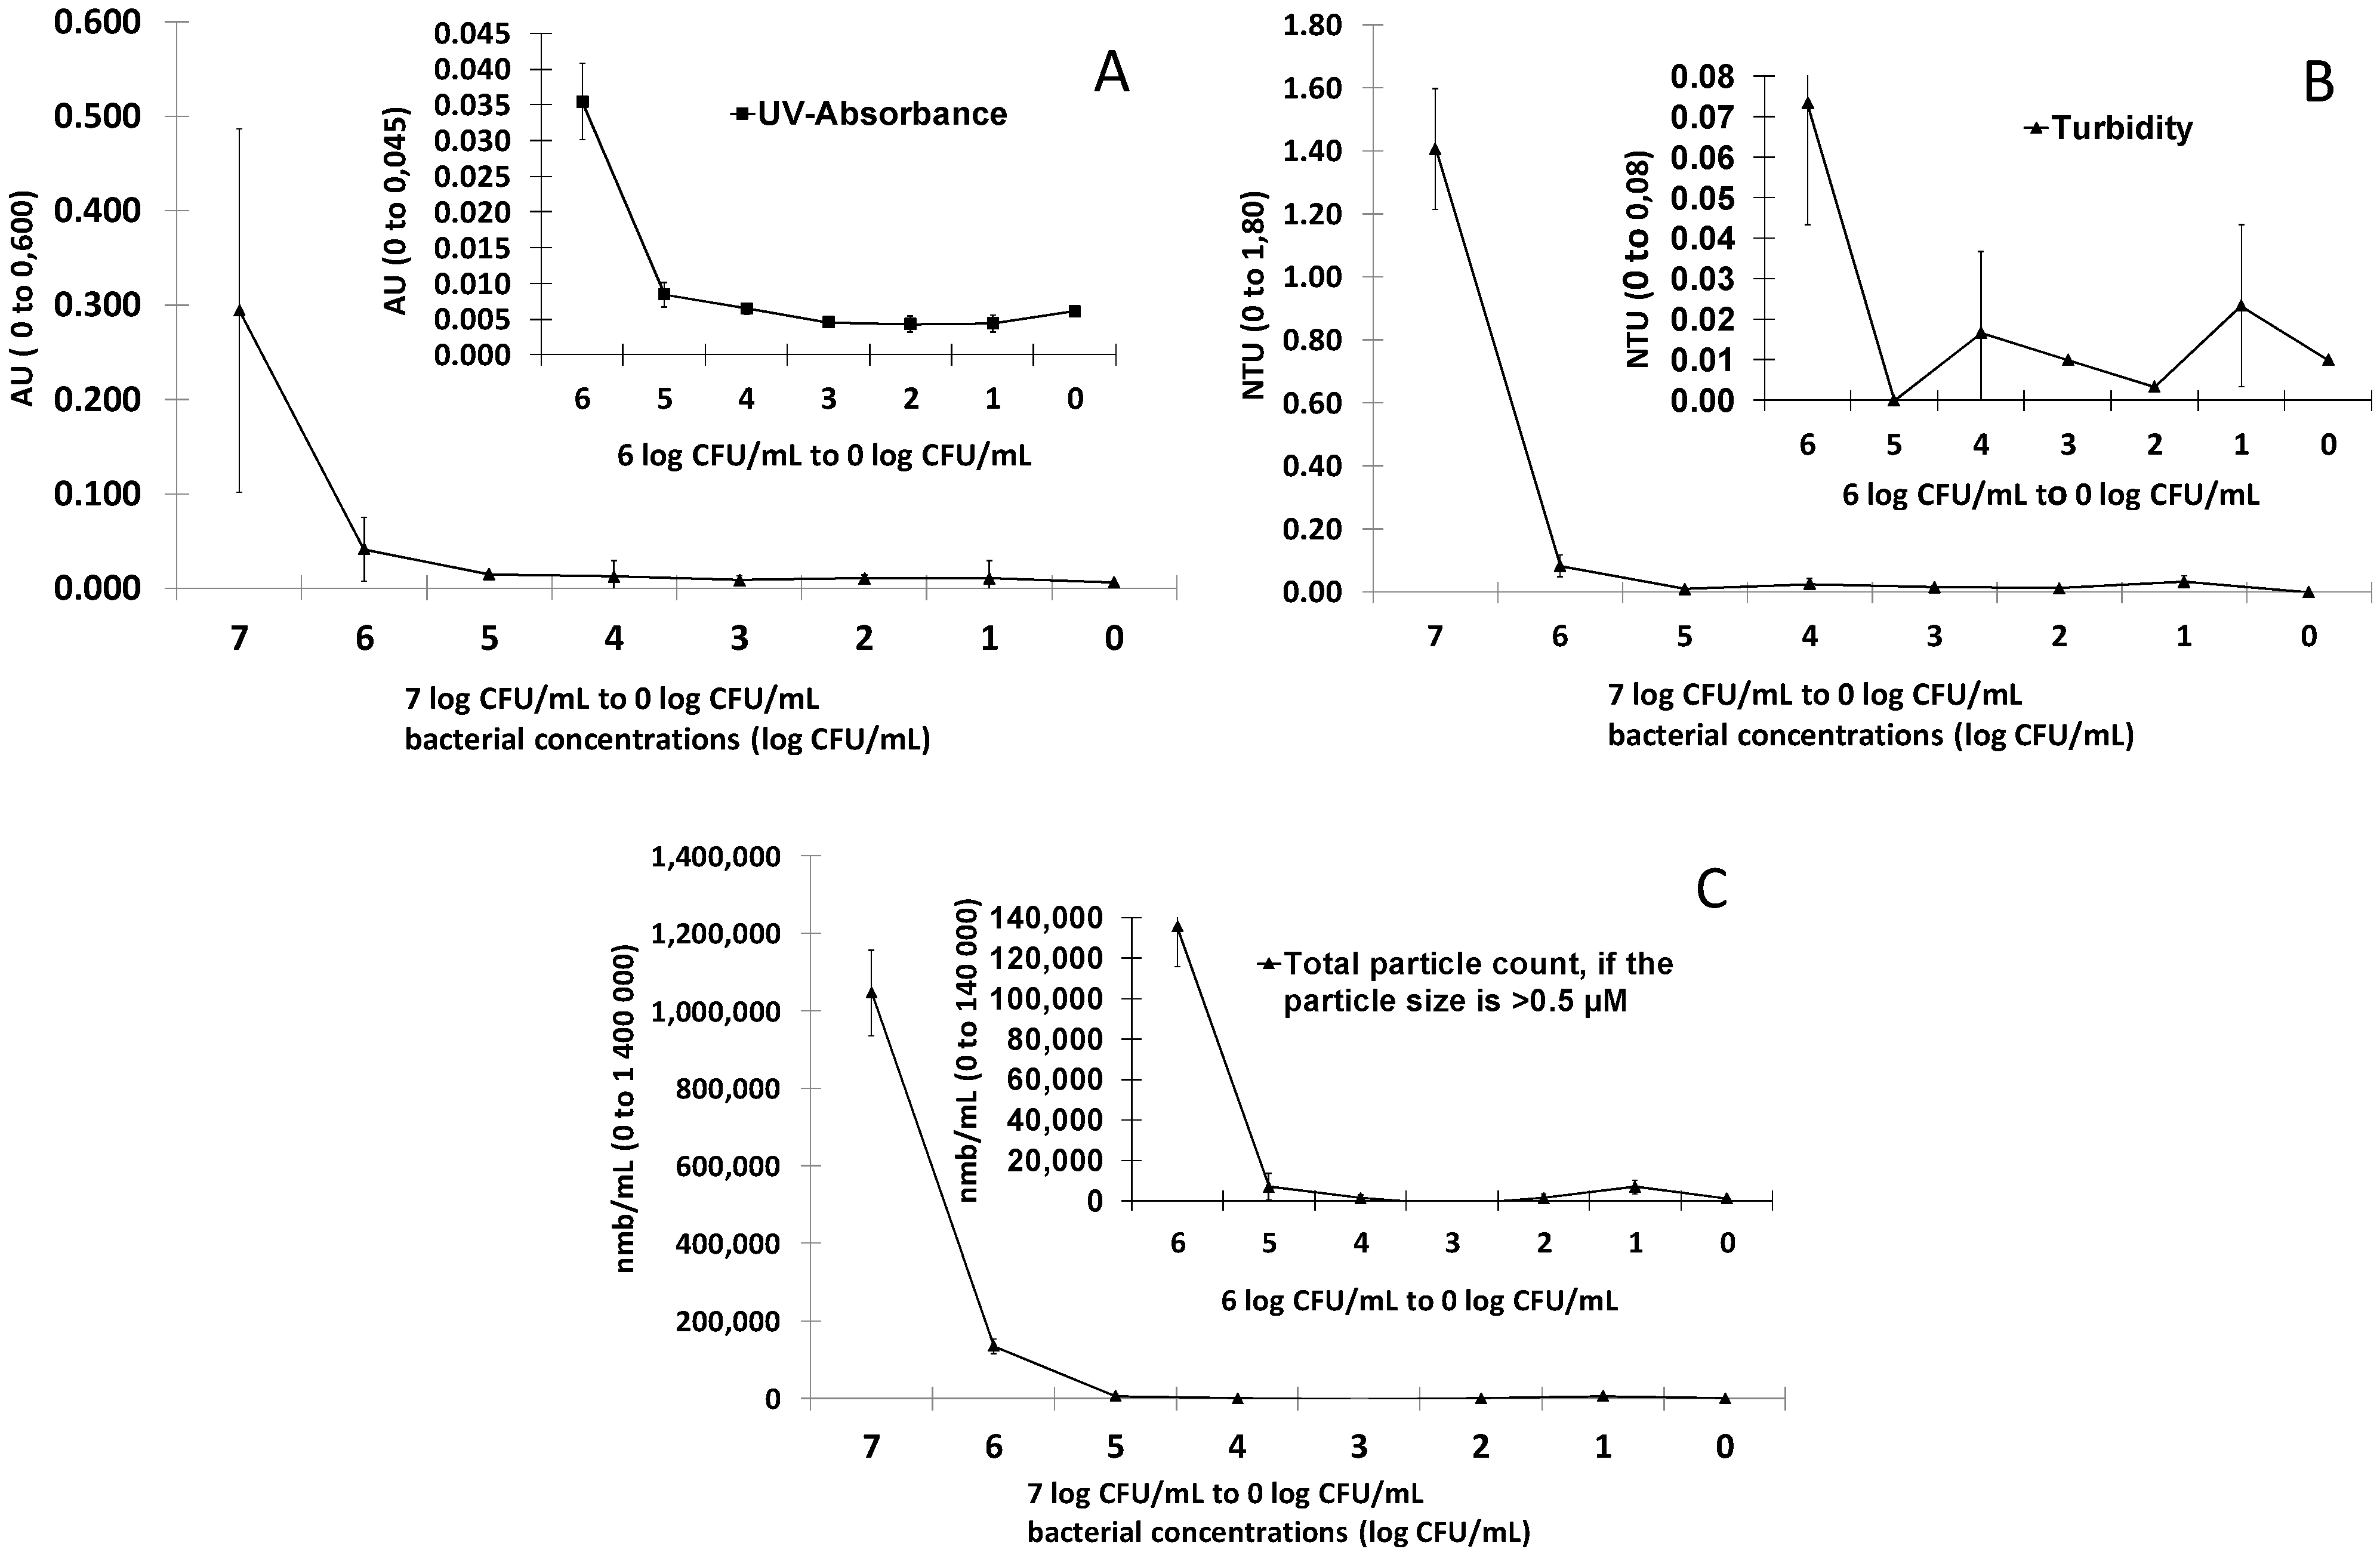
3.2. Detection of E. coli in Spring Water

Dilutions of the E. coli bacteria in spring water were prepared and optical parameters were measured. It was observed that UV-absorbance at 254 nm, turbidity and particle counts decreased over 85% when the bacterial counts decreased from 107 CFU/mL to 106 CFU/mL (Figure 2). The measured values of UV-absorbance at 254 nm and turbidity in the samples with an E. coli concentration of 106 CFU/mL were 0.04 ± 0.01 absorbance units and 0.07 ± 0.03 NTU, respectively. When E. coli concentrations were below 106 CFU/mL, the absorbance and turbidity values lost their relation to the bacterial counts and the measurements were evaluated to be non-reliable (Figure 2). In particle counting with the 0.5 µm sensor, a threshold value of 135,550 ± 19,839 particles/mL was achieved at the E. coli concentration of 106 CFU/mL. With 105 CFU/mL the threshold was 6,707 ± 6,557 particles/mL. In total, 97% of the counted particles were classified to a particle size fraction of 0.5–0.6 µm in accordance with the known size of E. coli cells (0.3–1.0 µm × 1.0–6.0 µm; Brenner and Staley [32]). The UV-absorbance, turbidity and particle count of the commercial spring water without E. coli addition was 0.006 absorbance units, 0.01 NTU and 1,100 particles/mL, respectively.
Figure 2. UV-absorbance at 254 nm (A), turbidity (B) and total particle count (C) values measured from samples with different E. coli concentrations (log CFU/mL). The measurements were repeated three times and error bars indicate the standard errors of the measurements.
Ijerph 10 05349 g002

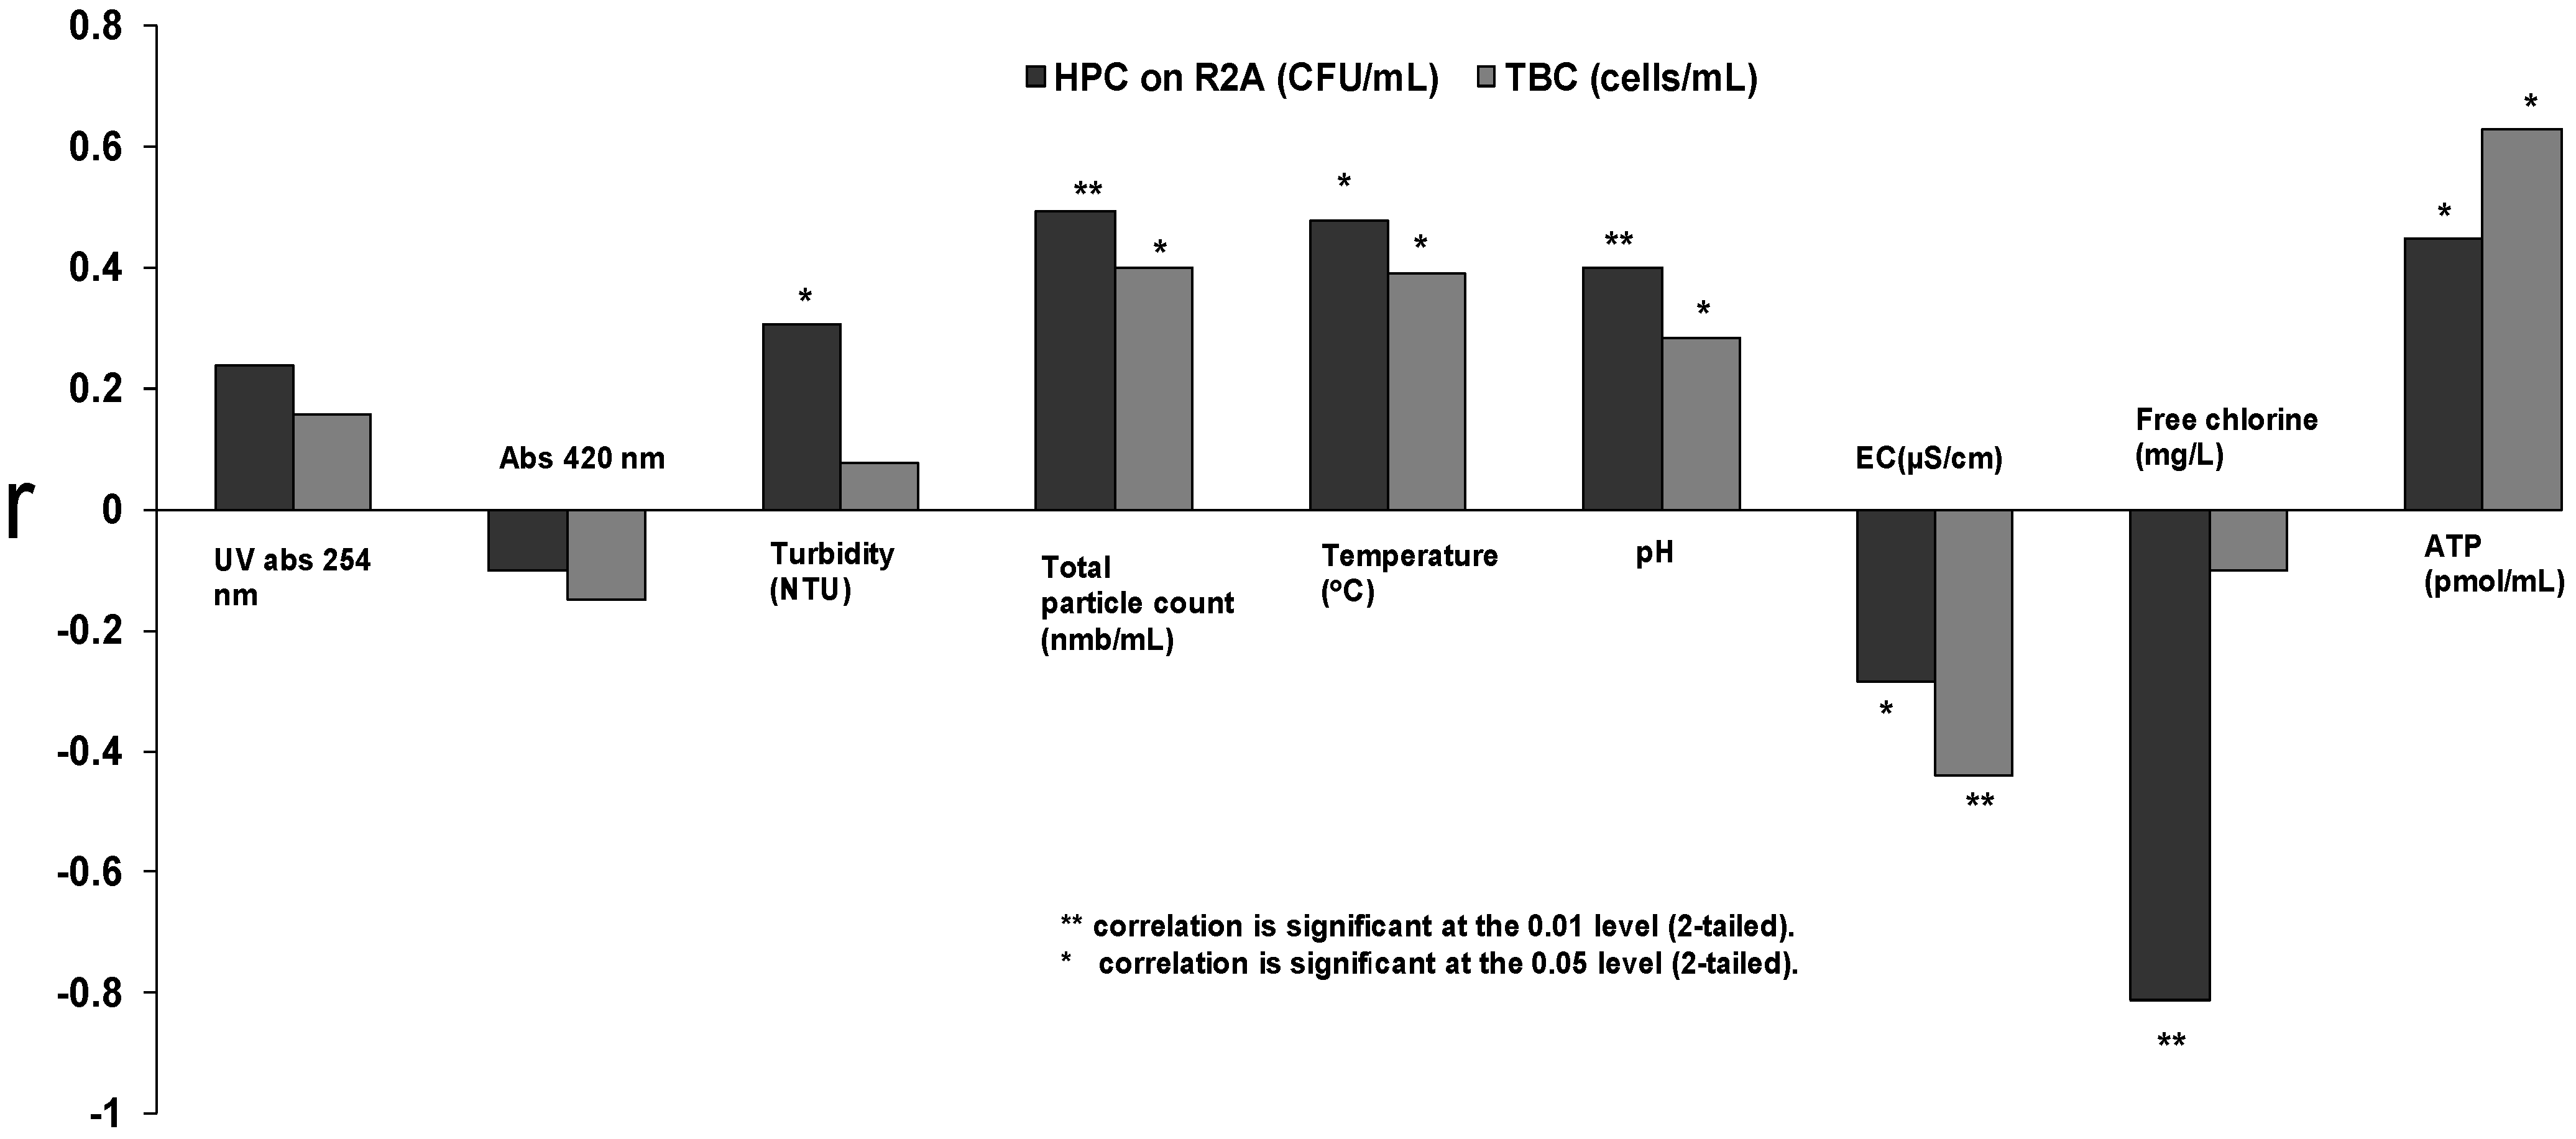
3.3. Monitoring of the Distribution System Water Samples

The descriptive statistics of the measured parameters from the analysed distribution water samples originating from six different distribution systems are presented in Table 2. One colony of coliform bacteria/1,000 mL was detected in three out of 34 drinking water distribution water samples. It was detected from town D, indicating the inefficiency of post-chlorination to prevent regrowth in this distribution. No E. coli or intestinal enterococci were found from the samples. Mean AOC, MAP, TOC and total phosphorus concentrations (±SD) in the distribution system of town D were 126 µg ± 30 AOC-C/L µg/L, 0.04 ± 0.05 µg/L, 2.7 ± 0.6 mg/L, and 1.7 ± 0.6 µg/L, respectively.
Table 2. Descriptive statistics of the parameters measured from the drinking water distribution networks of five towns and one rural community in Finland.
NMedianMin–Max
Optical
Abs 420520.010.001–0.330
UV Abs 254520.1330.019–0.416
Turbidity (NTU)520.2570.04–27.4
Total particle count (nmb/mL)511,7181.1 × 102–6.1 × 10⁴
Physical
Temperature (°C)527.75.1–21.0
pH526.9056.40–8.78
EC(µS/cm)5224918–475
Chemical
Free chlorine (mg/L)180.2250.10–0.64
ATP (pmol/mL)52410.04–119
Bacterial
HPC on R2A (CFU/mL)4865610–1.3 × 105
HPC on YEA (CFU/mL)5130–5.3 × 103
TBC (cells/mL)5255,7841.1 × 103–7.8 × 10⁵
Coliforms (CFU/1,000 mL)34BDL1BDL1
Enterococci (CFU/1,000 mL)34BDLBDL
Nutrients
AOC-C/L µg 1412860.9–179.1
TOC mg/L1431.6–3.3
MAP µg/L130.00850.0007–0.1533
Total-P µg/L141.850.6–3.0
1 Below the detection limit.
Figure 3 shows the relationships between bacterial counts (HPC on R2A and TBC) and measured non-bacterial parameters. With the distribution system samples, no relationship between absorbance measurements and bacterial counts were found and turbidity displayed only a slight connection with HPC on R2A (r = 0.305, p = 0.035). In contrast to the P. fluorescens experiments, particle counts exhibited a significant correlation with HPC on R2A when true distribution system samples were analysed (r = 0.493, p < 0.001) and also had a positive connection with TBC (r = 0.286, p < 0.004). Moreover, particle counts had a connection with HPC on YEA (r = 0.400, p = 0.044), (results that were observed with YEA are not shown). The temperature of water in the distribution systems had a positive connection with HPC on R2A (r = 0.478, p < 0.001), with HPC on YEA (r = 0.435, p < 0.001) as well as with TBC (r = 0.390, p = 0.004). For the TBC, a negative connection (r = −0.439, p < 0.001) was found with EC. pH exhibited a positive connection with HPC on R2A (r = 0.400, p < 0.005) and with TBC (r = 0.284, p < 0.042). Nonetheless, the best surrogate for HPC on R2A in distribution system water samples was free chlorine concentration, which exhibited the highest value for the correlation coefficient (r = −0.811, p < 0.001). Furthermore, the concentration of ATP had a positive connection with HPC on R2A (r = 0.449, p < 0.010) and with TBC (r = 0.629, p < 0.001). HPC on YEA had a significant positive connection with TOC (r = 0.815, p < 0.001) and a significant negative connection with total-P (r = −0.704, p = 0.002).
Figure 3. Spearmann’s rank correlation coefficients (r) between bacterial water quality (HPC on R2A and TBC) and optical, physical and chemical measurements in analysis of drinking water distribution system samples.
Ijerph 10 05349 g003

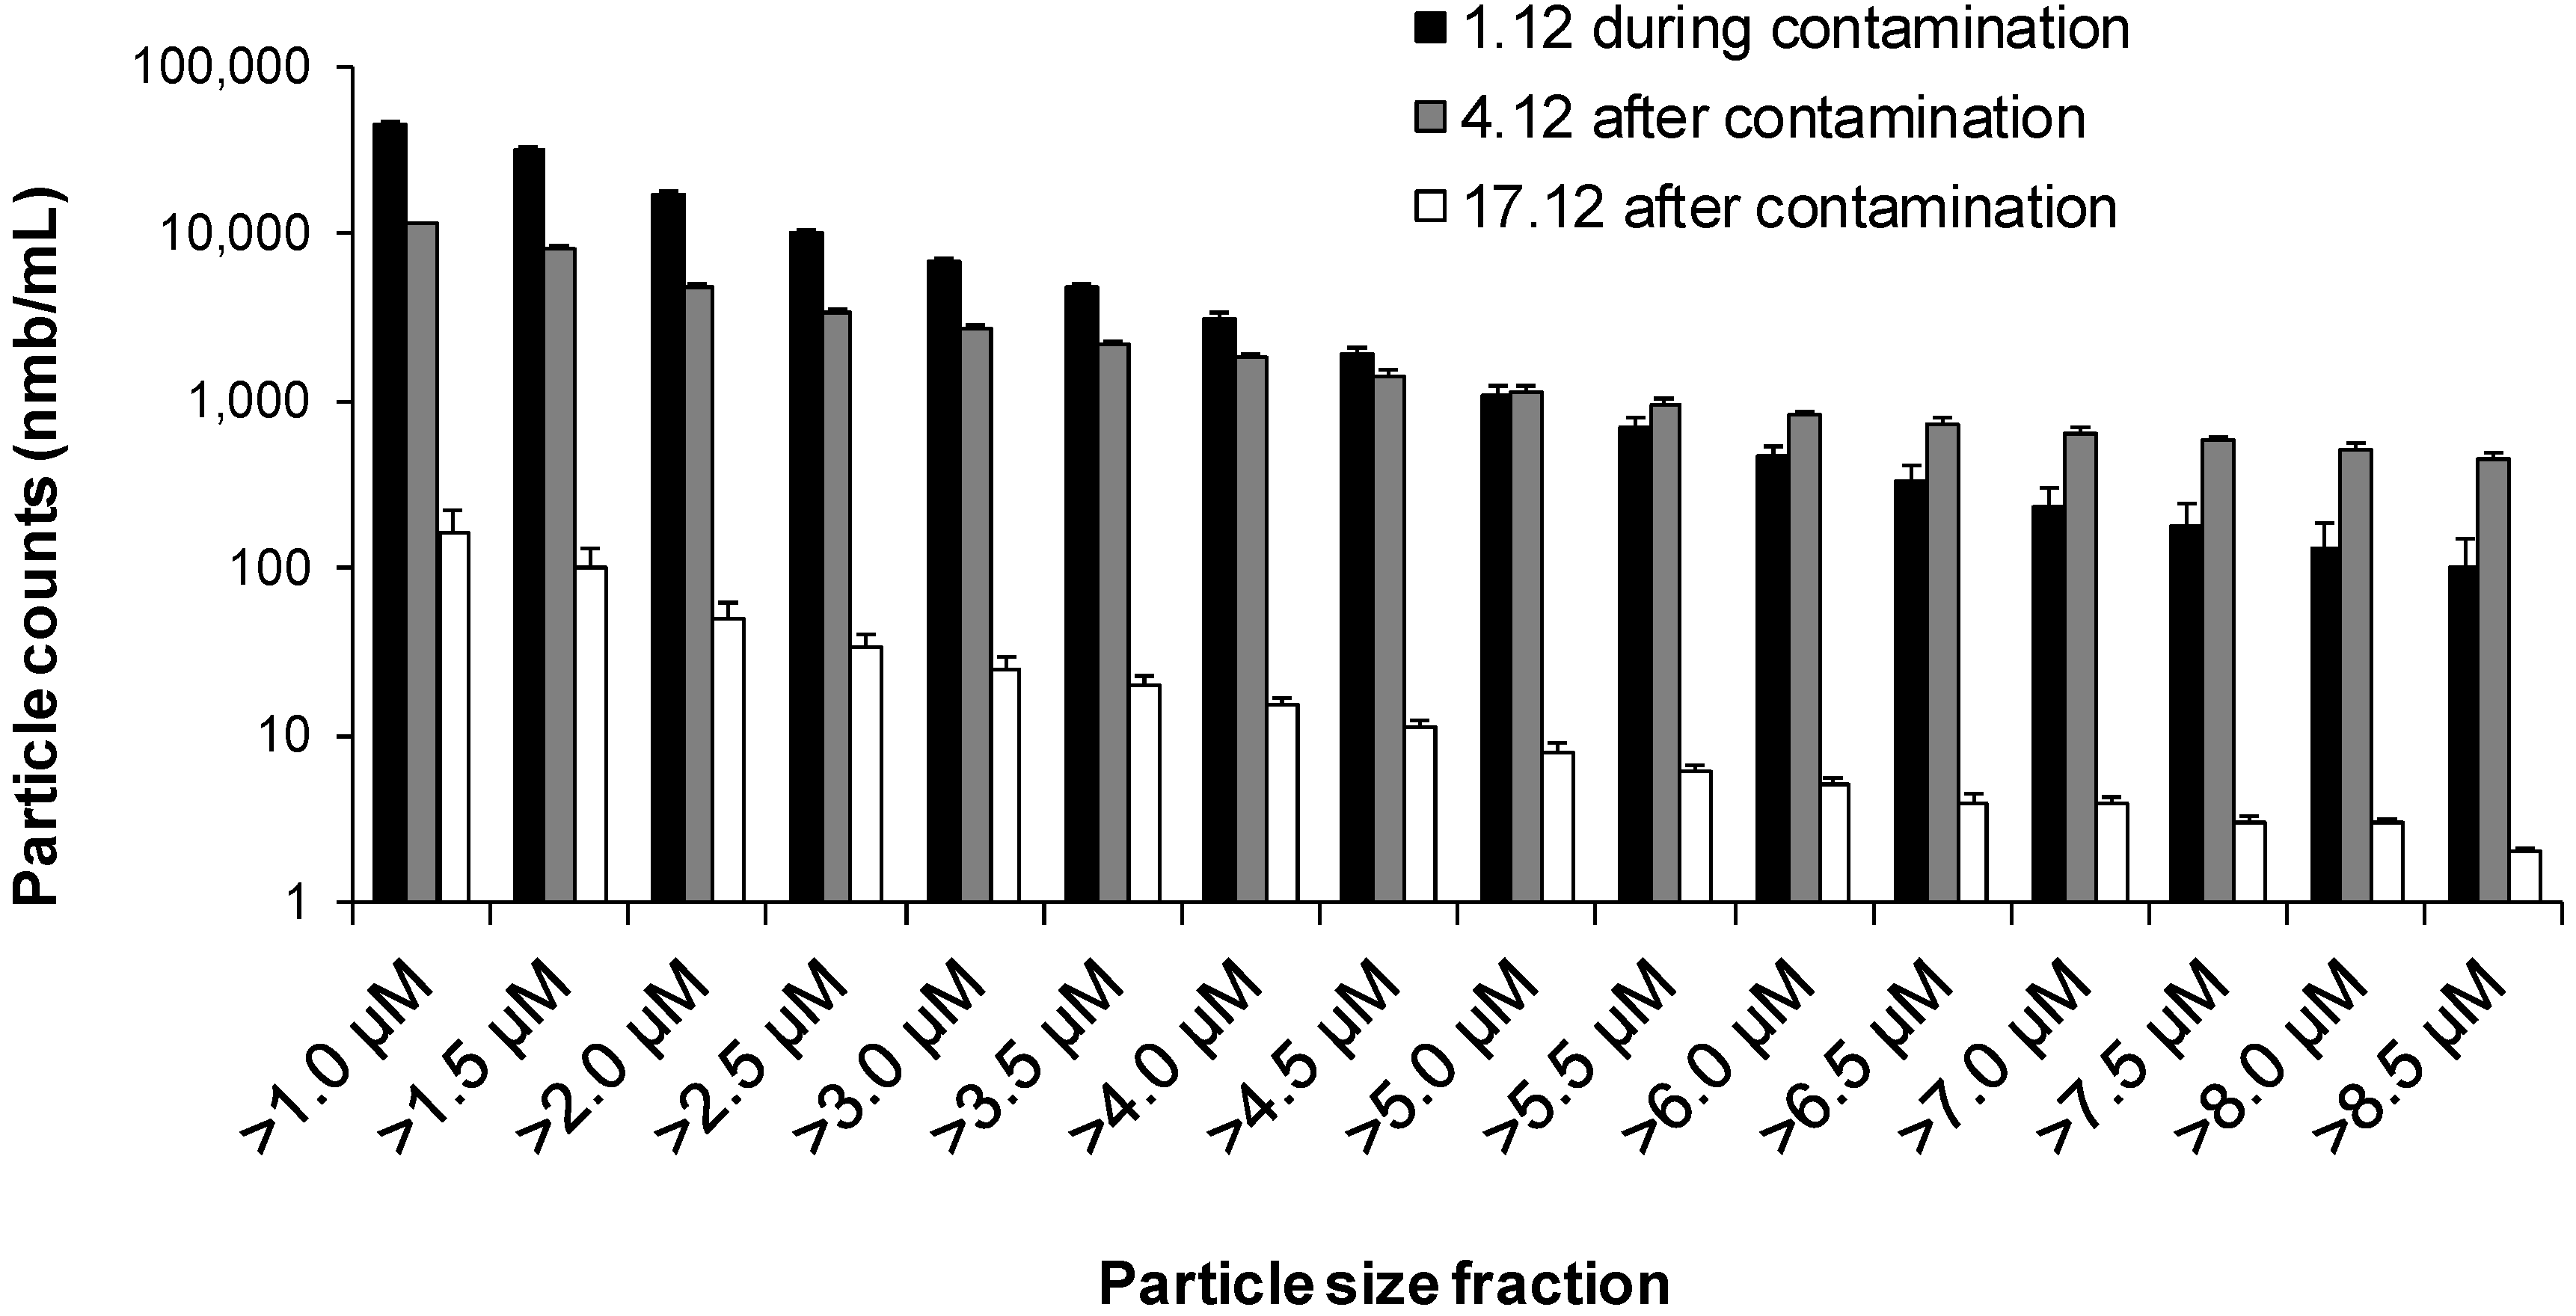
3.4. The Case of an Accidentally Contaminated Distribution Network

The drinking water distribution system of Nokia town was heavily contaminated with a purified sewage intrusion, resulting in the exposure of inhabitants to a wide range of faecal microbes including norovirus, Campylobacter, Giardia, Salmonella as well as high concentrations of faecal indicator bacteria, E. coli, intestinal enterococci and Clostridium perfringens [31].
Particle measurement with a 1 µm detection limit for the particle size was used to examine the drinking water samples originating from the contaminated distribution system of the town. The comparison of total particle counts and particle fractions (Figure 4) during and after the contamination event highlighted the ability of particle counting to function as an early warning tool. HPC on R2A in the water sample taken on 1 December 2007, during the contamination, exceeded 5.0 × 10⁶ CFU/mL. Three days after the contamination event, on the 4th December 2007, the HPC value had declined to 1.8 × 10² CFU/mL. At the same time, the particle counts decreased from 4.4 × 10⁴/mL to 1.2 × 10⁴/mL (Δ74%) and turbidity decreased from 4.6 to 1.2 NTU (Δ74%). At two weeks later, 17 December 2007, the particle count in the water sample was much lower, being 1.7 × 10²/mL (Δ99.6%) and the turbidity value was 0.3 NTU (Δ94%).
Figure 4. Particle size fractions during and after massive sewage contamination in Nokia municipality.
Ijerph 10 05349 g004

4. Discussion

The vulnerability of drinking water distribution systems is well known and the need for rapid, though still affordable detection methods for bacterial quality monitoring of drinking water is well recognized. Drinking water quality deteriorations can be divided into two groups: they can be long-term regrowth problems [4,33,34] or short-term transient intrusion events that might not be noticed at all. Biological instability of the water that causes regrowth of microbes is a stable phenomenon when occurring in a distribution system. Thus it is relatively easy to detect, but difficult to remove. In contrast, the intrusion of contaminating substances into the drinking water distribution is usually caused by a temporary failure that may be difficult to detect, but is often relatively easily fixed, once the cause is identified. Furthermore, seasonal events may reduce the drinking water treatment efficiency [8,35] and subsequently cause a long-lasting reduction of the distributed drinking water quality. In this study, several laboratory-scale measurements were observed to have potential to work as tools in the detection of water quality changes caused by regrowth or the faecal contamination of water.
The optical density of a liquid sample measured as absorbance (UV-absorbance at 254 nm and absorbance at 420 nm) was observed to have a relationship with colony counts and total bacterial count during a P. fluorescens growth experiment (Figure 1). However, the connection between absorbance and colony counts and absorbance and total bacterial count was absent when analysing drinking water samples (Figure 3). The reason for the absence of the connection could be that the analysed samples did not contain substances that absorbed light at the measured wavelengths. The other explanation might be that the bacterial concentration in the analysed drinking water samples remained below the detection limit of the absorbance method. When we studied the detection limits of the optical measurements (UV-absorbance, turbidity and particle counts; Figure 2) using E. coli dilutions in spring water, it was concluded that bacterial concentrations higher than 106 CFU/mL can be measured reliably with the used equipment. However, we tested only three bottle series and 10-fold dilutions. By using smaller dilution steps it might be possible to achieve a detection limit between 105 and 106 CFU/mL. In fact, the measured particles indicated that a level of 105 CFU/mL would be achievable with the method, but so far we could not confirm the observation since the standard error remained high in our experiments. Our results are in accordance with earlier results reported by Chavez, Jimenez and Maya [36], which concluded that the monitoring of particle counts is possible when the faecal coliform count is between 105 and 108 MPN/100 mL.
Turbidity measurements have been used for monitoring total particle concentration in drinking water samples in distribution systems. Turbidity is known as an indirect measurement method that does not provide quantitative information about the water quality. The use of turbidity has been criticised as inadequate and not sufficient to ensure the microbiological safety of a water supply [37]. More recently, particle counting measurements have been used to provide information about water quality in distribution systems [26], which supplements the information from turbidity measurements. When measuring samples from the contaminated distribution system (Figure 4), we observed that the particle counter equipped with a sensor with a 1 µm detection limit for the particle size would be sensitive enough when detecting contamination caused by sewage intrusion. We used the same 1 µm sensor in the P. fluorescens experiments but in the E. coli experiments, a sensor with 0.5 µm detection limit for the particle size was used instead. In the E. coli experiment, nearly all bacterial cells were found from the particle size fraction of 0.5 µm–0.6 µm. As P. fluorescens cells are approximately the same size as E. coli, the use of a 1 µm sensor could explain why no relationship was found between bacterial and particle counts in the P. fluorescens regrowth experiment. The observation suggests that some other substances (such as humus, minerals and organic particles) than bacterial cells are responsible for the increase in particle counts within the analysed distribution water samples.
The correlation of bacterial counts with particle counts measured using a 1 µm sensor (Figure 3) give an indication that changes in the drinking water quality are rarely simply attributable to a pure bacterial contamination. This interpretation is supported by the earlier findings of Pronk, Goldscheider and Zophi [24], as they found that an increase in finer particles (0.9 µm–1 µm) indicated faecal contamination of water. The Nokia incident is a good example of the complexity of contamination events [31]. The samples analysed in this study from the distribution system that was contaminated with sewage water gave us verification that the optical measurements, such as turbidity and particle counting, could be useful as rapid signals in drinking water contamination situations. In the future studies, potential of the use of flow cytometry, which is an advanced form of particle quantification and qualification [21,38,39] should be exploited.
Changes in water temperatures have an effect on the bacterial quality of the distribution system and temperature has been reported as one of the best predictors for the spatiotemporal occurrence of HPC in the distribution systems [40]. During the summer months temperatures are usually higher and seasonal problems with water quality have been observed [1,4]. In this study, the impact of temperature was examined in drinking water samples with three assays for bacterial counts (HPC on R2A, HPC on YEA and TBC) and the relationships were observed. Although it could be assumed that temperature can serve as a parameter predicting bacterial regrowth in a distribution system, the use of temperature alone is insufficient. The main factor regulating the microbial growth is availability of nutrients in drinking water [4,5,41] while the use of disinfection, the pH of the water, and the pipe material also play important roles [42,43]. The regrowth of microbes in distribution systems is difficult to prevent completely, but it can be controlled with residual disinfectant in the distribution [28]. In fact, previous studies have shown that one of the best parameters to predict biological contamination events in the distribution systems is the measurement of free chlorine [44]. In the present study, free chlorine was clearly the best parameter for predicting HPC in the studied distribution system water samples, whereas pH showed only a moderate positive correlation (Figure 3). It has also been postulated that pH and HPC have a positive correlation in water where chlorine is being used as a disinfectant [40,45]. The higher pH value is understood to decrease the efficiency of chlorine disinfection, with chlorination most effective at a pH value of 5 [46]. We found in the P. fluorescens growth test a negative connection between bacterial counts and pH. This connection might be explained by aerobic heterotrophic respiration and formation of CO2 in the bottle since P. fluorescens is an obligate aerobe.
The use of ATP measurement coupled with cultivation-independent flow cytometry method has been proposed [13,21,39]. In this study, the previously detected relationship between the colony counts and ATP [18,19] was confirmed during the growth of P. fluorescens as a proof of the presence of viable micro-organisms in the sample. However, ATP had an even better correlation with TBC than with colony counts, the result possibly being attributable to the presence of VBNC cells.

5. Conclusions

Results here indicated the usefulness of optical, physical and chemical measurements in detecting impurities in drinking water and the ability of these measurements to be used to detect changes when drinking water is undergoing deterioration.
The results confirmed that although turbidity is a good basic measurement for detecting changes in drinking water quality, the particle count gives more precise information. Particle counting was also found to work as a feasible indicator of bacterial counts in a real water contamination incident. Our results also indicated that absorbance measurements (254 nm, 420 nm) have potential to work at some extend as tools that could be used for detecting bacterial regrowth and intrusions in drinking water systems.
Detection limits for the optical measurements of UV-absorbance, turbidity and particle counting were high when pure cultures of bacteria were tested (limits were met at E. coli concentrations of 106 CFU/mL). The uncertainty of measurements increased when bacterial concentrations decreased below the detection limits. It seemed that limit was also there with the analysed non-contaminated drinking water samples were relationship was not found when bacterial counts were below the 106 CFU/mL.
Free chlorine concentration exhibited the strongest correlation with HPC when analysing distribution system water samples, while ATP measurement was found to be a useful tool for assessing the viability of the bacterial cells.

Acknowledgments

This work was performed as a part of research project VESIKKO (3150/31/05), funded by the Finnish Agency for Technology and Innovation (TEKES). Yrjö Hiltunen and Jaakko Rämö and Asko Vepsäläinen are acknowledged for a critical reading of the manuscript. We wish to give special thanks to the staff of the Laboratory at the Water and Health Unit at the National Institute for Health and Welfare.

Conflicts of Interest

The authors declare no conflict of interest.

References

  1. LeChevallier, M.W.; Welch, N.J.; Smith, D.B. Full-scale studies of factors related to coliform regrowth in drinking water. Appl. Environ. Microbiol. 1996, 62, 2201–2211. [Google Scholar]
  2. Gauthier, V.; Gerard, B.; Portal, J.; Block, J.; Gatel, D. Organic matter as loose deposits in a drinking water distribution system. Water Res. 1999, 33, 1014–1026. [Google Scholar] [CrossRef]
  3. Zacheus, O.M.; Lehtola, M.J.; Korhonen, L.K.; Martikainen, P.J. Soft deposits, the key site for microbial growth in drinking water distribution networks. Water Res. 2001, 35, 1757–1765. [Google Scholar]
  4. LeChevallier, M.W.; Babock, T.M.; Lee, R.G. Examination and characterization of distribution system biofilms. Appl. Environ. Microbiol. 1987, 53, 2714–2724. [Google Scholar]
  5. Miettinen, I.T.; Vartiainen, T.; Martikainen, P.J. Phosphorus and bacterial growth in drinking water. Appl. Environ. Microbiol. 1997, 63, 3242–3245. [Google Scholar]
  6. Geldreich, E.E. Coliform noncompliance nightmares in water supply distribution systems. In Water quality: A Realistic Perspective; College of Engineering, University of Michigan; Michigan Water Pollution Control Association; American Water Works Association, Michigan Department of Public Health: Lansing, Michigan, USA, 1988; pp. 55–74. [Google Scholar]
  7. Percival, S.T.; Walker, J.T.; Hunter, P.R. Biofilm Formation in Potable Water. In Microbial Aspects of Biofilms and Drinking Water; Vreeland, R.H., Ed.; CRC Press: Boca Raton, FL, USA, 2000; pp. 85–102. [Google Scholar]
  8. Roig, B.; Delpla, I.; Baures, E.; Jung, A.V.; Thomas, O. Analytical issues in monitoring drinking-water contamination related to short-term, heavy rainfall events. Trac-Trend. Anal. Chem. 2011, 30, 1243–1251. [Google Scholar] [CrossRef]
  9. Council Directive 98/83/EC on the Quality of Water Intended for Human Consumption. Available online: http://faolex.fao.org/cgi-bin/faolex.exe?rec_id=013657&database=FAOLEX&search_type=link&table=result&lang=eng&format_name=@ERALL (accessed on 21 October 2013).
  10. Reasoner, D.J.; Geldreich, E.E. A new medium for the enumeration and subculture of bacteria from potable water. Appl. Environ. Microbiol. 1985, 49, 1–7. [Google Scholar]
  11. Water Quality, Enumeration of Culturable Micro-Organims. Colony Count by Inoculation in a Nutrient Agar Culture Medium; Finnish Standard Association (SFS): Helsinki, Finland, 1999.
  12. Reynolds, D.T.; Fricker, C.R. Application of laser scanning for the rapid and automated detection of bacteria in water samples. J. Appl. Microbiol. 1999, 86, 785–795. [Google Scholar] [CrossRef]
  13. Vital, M.; Dignum, M.; Magic-Knezev, A.; Ross, P.; Rietveld, L.; Hammes, F. Flow cytometry and Adenosine Tri-Phosphate analysis: Alternative possibilities to evaluate major bacteriological changes in drinking water treatment and distribution systems. Water Res. 2012, 46, 4665–4676. [Google Scholar] [CrossRef]
  14. Hobbie, J.E.; Daley, R.J.; Jasper, S. Use of nuclepore filters for counting bacteria by fluorescence microscopy. Appl. Environ. Microbiol. 1977, 33, 1225–1228. [Google Scholar]
  15. Kepner, R.L; Pratt, J.R. Use of fluorochromes for direct enumeration of total bacteria in environmental-samples—Past and present. Microbiol. Rev. 1994, 58, 603–615. [Google Scholar]
  16. Rinta-Kanto, J.M.; Lehtola, M.J.; Vartiainen, T.; Martikainen, P.J. Rapid enumeration of virus-like particles in drinking water samples using SYBR green I-staining. Water Res. 2004, 38, 2614–2618. [Google Scholar] [CrossRef]
  17. Lehtola, M.J.; Pitkänen, T.; Miebach, L.; Miettinen, I.T. Survival of Campylobacter jejuni in potable water biofilms: A comparative study with different detection methods. Water Sci. Technol. 2006, 54, 57–61. [Google Scholar]
  18. van der Kooij, D.; Veenendaal, H.R.; Baars-Lorist, C.; van der Klift, D.W.; Drost, Y.C. Biofilm formation on surfaces of glass and Teflon exposed to treated water. Water Res. 1995, 29, 1655–1662. [Google Scholar]
  19. Delahaye, E.; Welte, B.; Levi, Y.; Leblon, G.; Montiel, A. An ATP-based method for monitoring the microbiological drinking water quality in a distribution network. Water Res. 2003, 37, 3689–3696. [Google Scholar] [CrossRef]
  20. Percival, S.T.; Walker, J.T.; Hunter, P.R. Methods of Sampling Biofilms in Potable Water. In Microbiological Aspects of Biofilms and Drinking Water; Vreeland, R.H., Ed.; CRC Press: Boca Raton, FL, USA, 2000; pp. 156–170. [Google Scholar]
  21. Berney, M.; Vital, M.; Hülshoff, I.; Weilenmann, H.; Egli, T.; Hammes, F. Rapid, cultivation-independent assessment of microbial viability in drinking water. Water Res. 2008, 42, 4010–4018. [Google Scholar] [CrossRef]
  22. Lopez-Roldan, R.; Tusell, P.; Courtois, S.; Luis, J.C. On-line bacteriological detection in water. Trac-Trend. Anal. Chem. 2013, 44, 46–57. [Google Scholar] [CrossRef]
  23. Pronk, M.; Goldscheider, N.; Zopfi, J. Dynamics and interaction of organic carbon, turbidity and bacteria in a Karst aquifer system. Hydrogeol. J. 2006, 14, 473–484. [Google Scholar] [CrossRef]
  24. Pronk, M.; Goldscheider, N.; Zopfi, J. Particle-size distribution as indicator for fecal bacteria contamination of drinking water from Karst springs. Environ. Sci. Technol. 2007, 41, 8400–8405. [Google Scholar] [CrossRef]
  25. van den Broeke, J.; Ross, P.S.; van der Helm, A.W.C.; Baars, E.T.; Rietveld, L.C. Use of on-line UV/Vis-spectrometry in the measurement of dissolved ozone and AOC concentrations in drinking water treatment. Water Sci. Technol. 2008, 57, 1169–1175. [Google Scholar] [CrossRef]
  26. Verberk, J.Q.J.C.; Hamilton, L.A.; O’Halloran, K.J.; van der Horst, W.; Vreeburg, J. Analysis of particle numbers, size and composition in drinking water transportation pipelines: Results of online measurements. Water Sci. Technol. 2006, 6, 35–43. [Google Scholar]
  27. Verberk, J.Q.J.C.; Vreeburg, J.H.G.; Rietveld, L.C.; van Dijk, J.C. Particulate fingerprinting of water quality in the distribution system. Water Sa 2009, 35, 192–199. [Google Scholar]
  28. Lehtola, M.J.; Pursiainen, A.; Hokajärvi, A-M.; Miettinen, I.T. Effects of the New Bank Filtrating Drinking Water Treatment Plant on Microbial Growth in Old Drinking Water Distribution System. In Proceeding of den 7 nordiske drickevanskonference, Copenhagen, Denmark, 7–9 June 2010; Danish Water and Wastewater Association: Skandenborg, Denmark, 2010; pp. 82–88. [Google Scholar]
  29. Miettinen, I.T.; Vartiainen, T.; Martikainen, P.J. Determination of assimilable organic carbon in humus-rich drinking waters. Water Res. 1999, 33, 2277–2282. [Google Scholar]
  30. Lehtola, M.J.; Miettinen, I.T.; Vartiainen, T.; Martikainen, P.J. A new sensitive bioassay for determination of microbially available phosphorus in water. Appl. Environ. Microbiol. 1999, 65, 2032–2034. [Google Scholar]
  31. Laine, J.; Huovinen, E.; Virtanen, M.J.; Snellman, M.; Lumio, J.; Ruutu, P.; Kujansuu, E.; Vuento, R.; Pitkänen, T.; Miettinen, I.; et al. An extensive gastroenteritis outbreak after drinking-water contamination by sewage effluent, Finland. Epidemiol. Infect. 2011, 139, 1105–1113. [Google Scholar] [CrossRef]
  32. Brenner, D.J.; Staley, J.T. The Alpha-, Beta-, Delta-, and Epsilonproteobacteria. In Bergey’s Manual of Systematic Bacteriology; Springer: New York, NY, USA, 2005. [Google Scholar]
  33. Block, J.C.; Haudidier, K.; Paquin, J.L.; Miazga, J.; Levi, Y. Biofilm accumulation in drinking water distribution systems. Biofouling 1993, 6, 333–343. [Google Scholar] [CrossRef]
  34. Flemming, H. Biofouling in water systems—Cases, causes and countermeasures. Appl. Microbiol. Biotechnol. 2002, 59, 629–640. [Google Scholar] [CrossRef]
  35. Sharp, E.L.; Parsons, S.A.; Jefferson, B. Seasonal variations in natural organic matter and its impact on coagulation in water treatment. Sci. Total Envir. 2006, 363, 183–194. [Google Scholar] [CrossRef]
  36. Chavez, A.; Jimenez, B.; Maya, C. Particle size distribution as a useful tool for microbial detection. Water Sci. Technol. 2004, 50, 179–186. [Google Scholar]
  37. Mccoy, W.F.; Olson, B.H. Relationship among turbidity, particle counts and bacteriological quality within water distribution lines. Water Res. 1986, 20, 1023–1029. [Google Scholar] [CrossRef]
  38. Hammes, F.; Berney, M.; Wang, Y.; Vital, M.; Köster, O.; Egli, T. Flow-cytometric total bacterial cell counts as a descriptive microbiological parameter for drinking water treatment processes. Water Res. 2008, 42, 269–277. [Google Scholar]
  39. Liu, G.; van der Mark, E.J.; Verberk, J.Q.J.C.; van Dijk, J.C. Flow cytometry total cell counts: A field study assessing microbial water quality and growth in unchlorinated drinking water distribution systems. BioMed. Res. Int. 2013. [Google Scholar] [CrossRef]
  40. Francisque, A.; Rodriguez, M.J.; Miranda-Moreno, L.F.; Sadiq, R.; Proulx, F. Modeling of heterotrophic bacteria counts in a water distribution system. Water Res. 2009, 43, 1075–1087. [Google Scholar] [CrossRef]
  41. van der Kooij, D. Assimilable organic-carbon as an indicator of bacterial regrowth. J. Amer. Water Work. Assn. 1992, 84, 57–65. [Google Scholar]
  42. LeChevallier, M.W.; Lowry, C.D.; Lee, R.G. Disinfecting biofilms in a model distribution-system. J. Amer. Water Work. Assn. 1990, 82, 87–99. [Google Scholar]
  43. Lehtola, M.J.; Miettinen, K.T.; Keinänen, M.M.; Kekki, T.K.; Laine, O.; Hirvonen, A.; Vartiainen, T.; Martikainen, P.J. Microbiology, chemistry and biofilm development in a pilot drinking water distribution system with copper and plastic pipes. Water Res. 2004, 38, 3769–3779. [Google Scholar]
  44. Helbling, D.E.; VanBriesen, J.M. Continuous monitoring of residual chlorine concentrations in response to controlled microbial intrusions in a laboratory-scale distribution system. Water Res. 2008, 42, 3162–3172. [Google Scholar] [CrossRef]
  45. Carter, J.; Rice, E.; Buchberger, S.; Lee, Y. Relationships between levels of heterotrophic bacteria and water quality parameters in a drinking water distribution system. Water Res. 2000, 34, 1495–1502. [Google Scholar] [CrossRef]
  46. Crittenden, J.C.; Trussell, R.; Hand, D.W.; Howe, K.J.; Tchobanoglous, G. Disinfection. In Water Treatment: Principles and Design; Wiley: Somerset, NJ, USA, 2005; pp. 1035–1162. [Google Scholar]

