Spatially Interpolated Disease Prevalence Estimation Using Collateral Indicators of Morbidity and Ecological Risk


Abstract
:1. Introduction
2. Case Study Application
- (a)
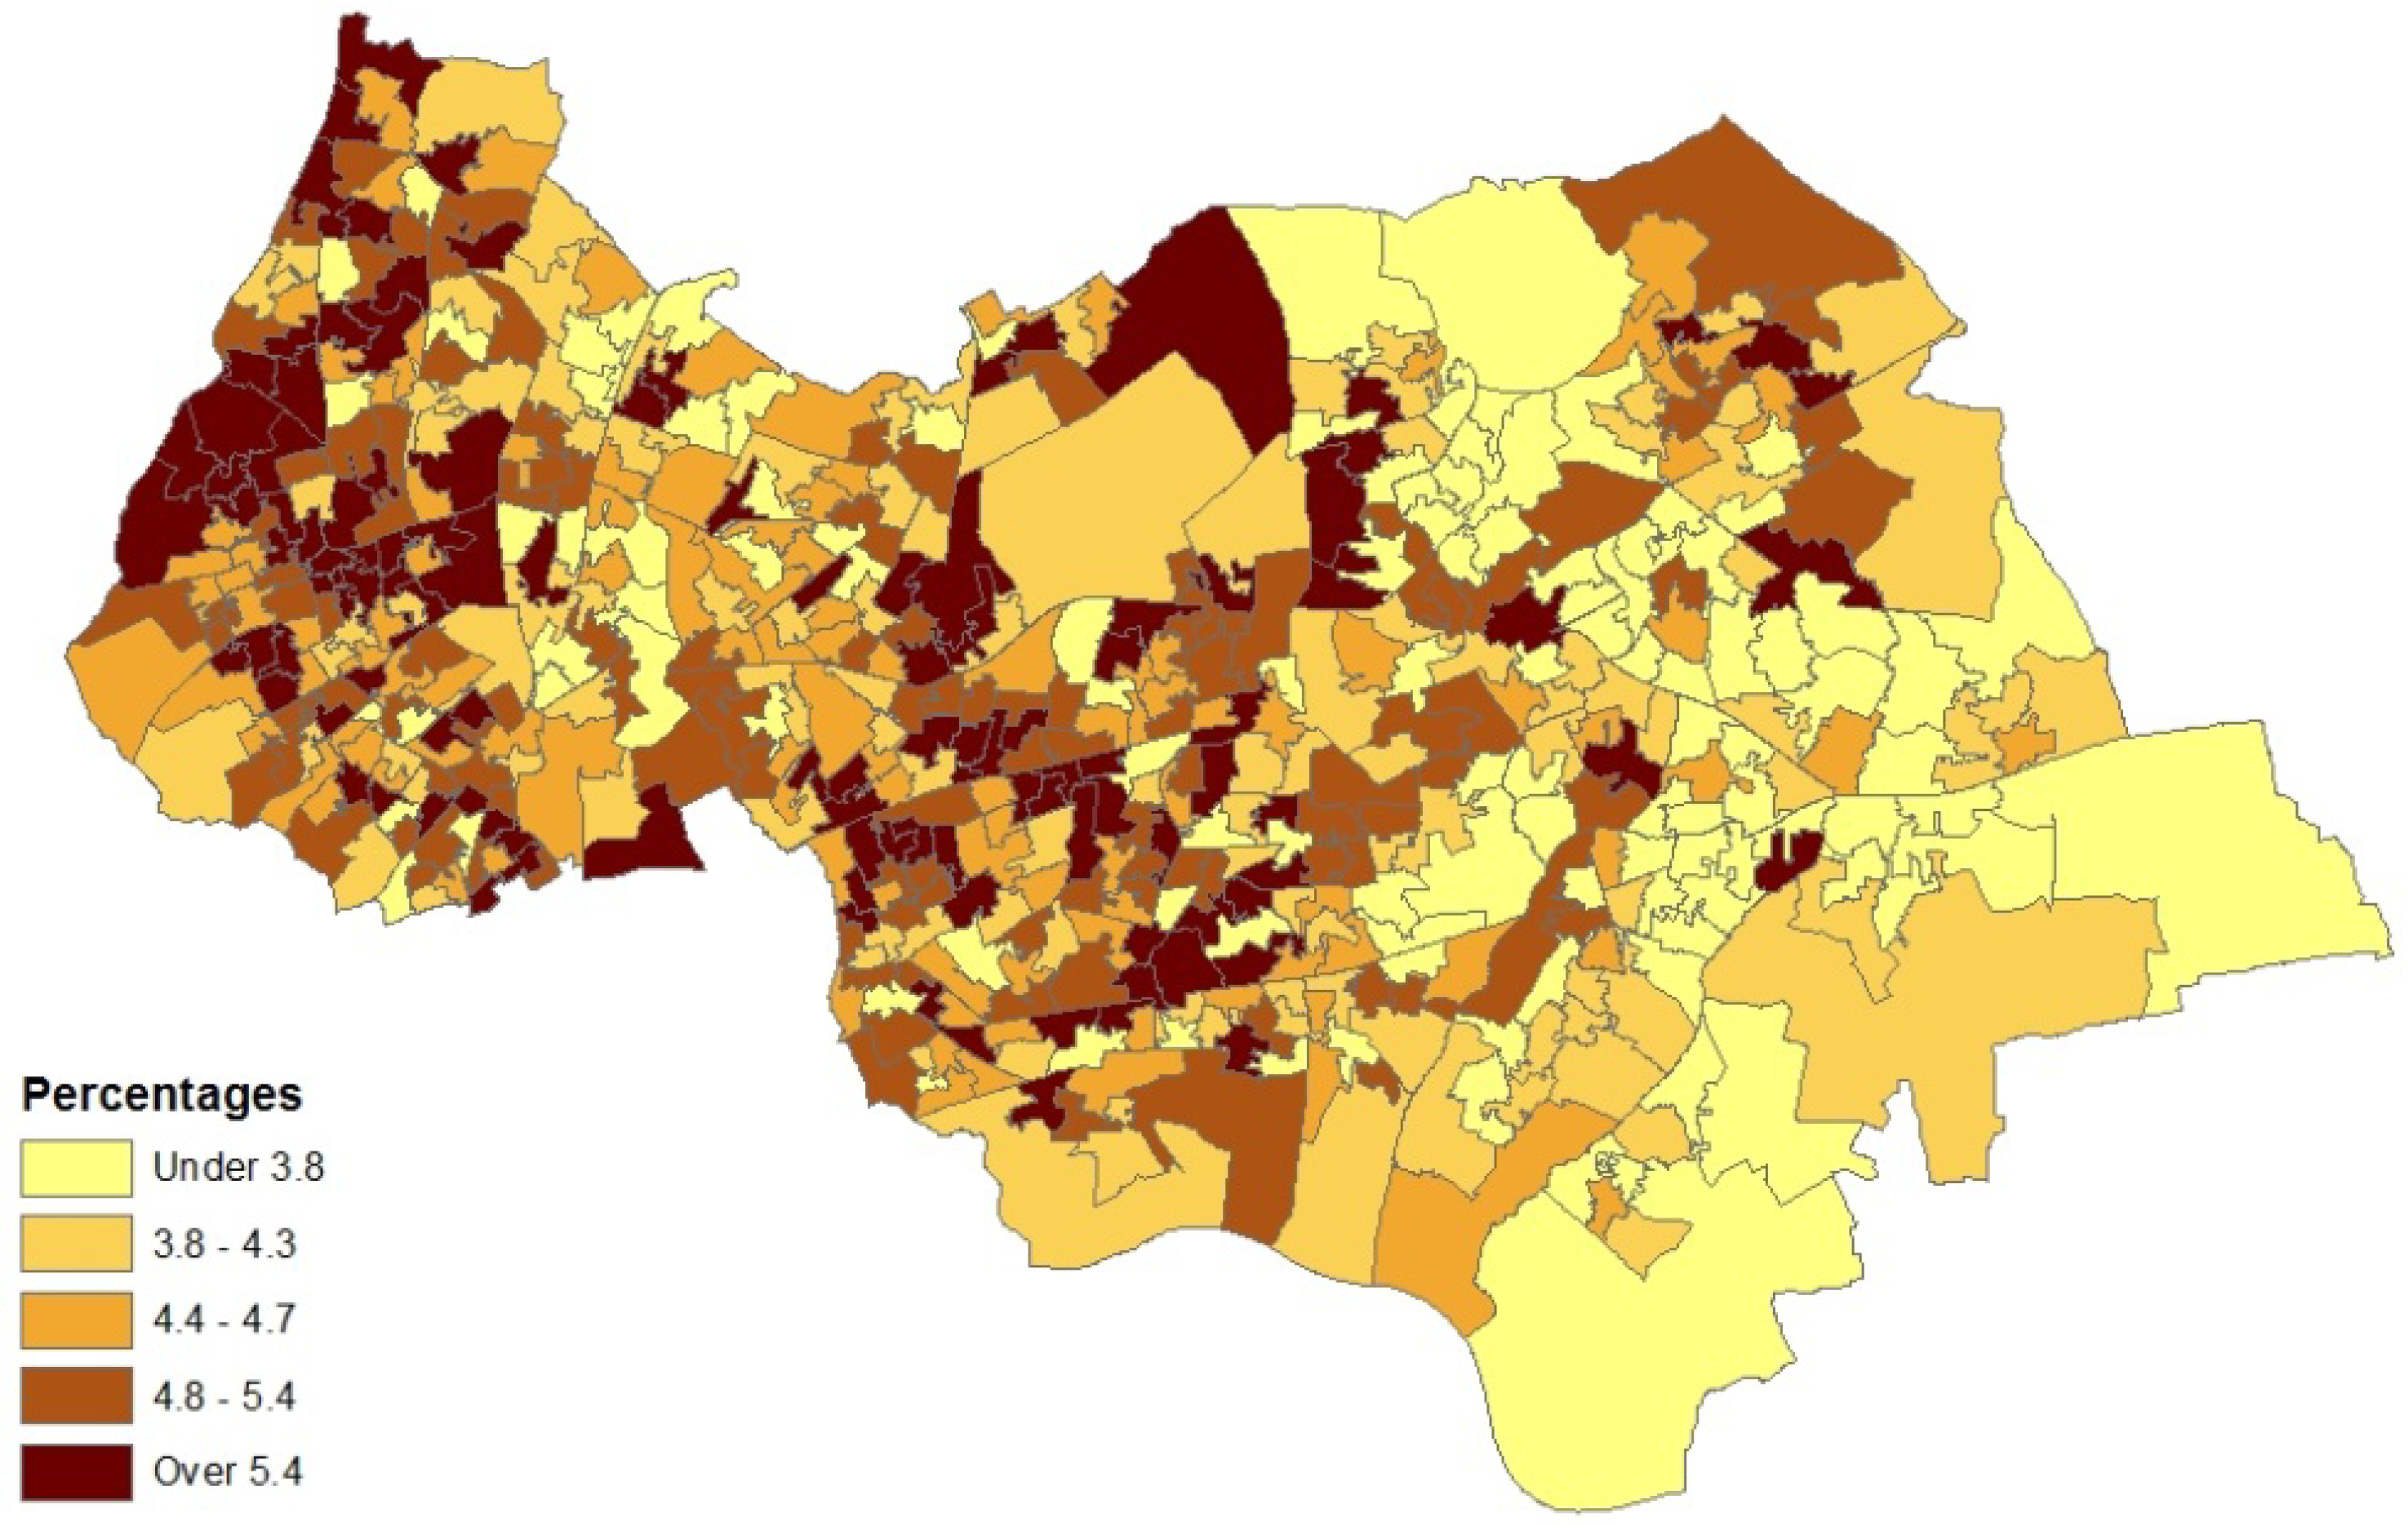
- counts of patients (in the financial year 2010–2011) with diagnosed asthma for GP practice areas (source areas); these counts are released as a single total for each GP practice area with no breakdown by sex or age;
- (b)
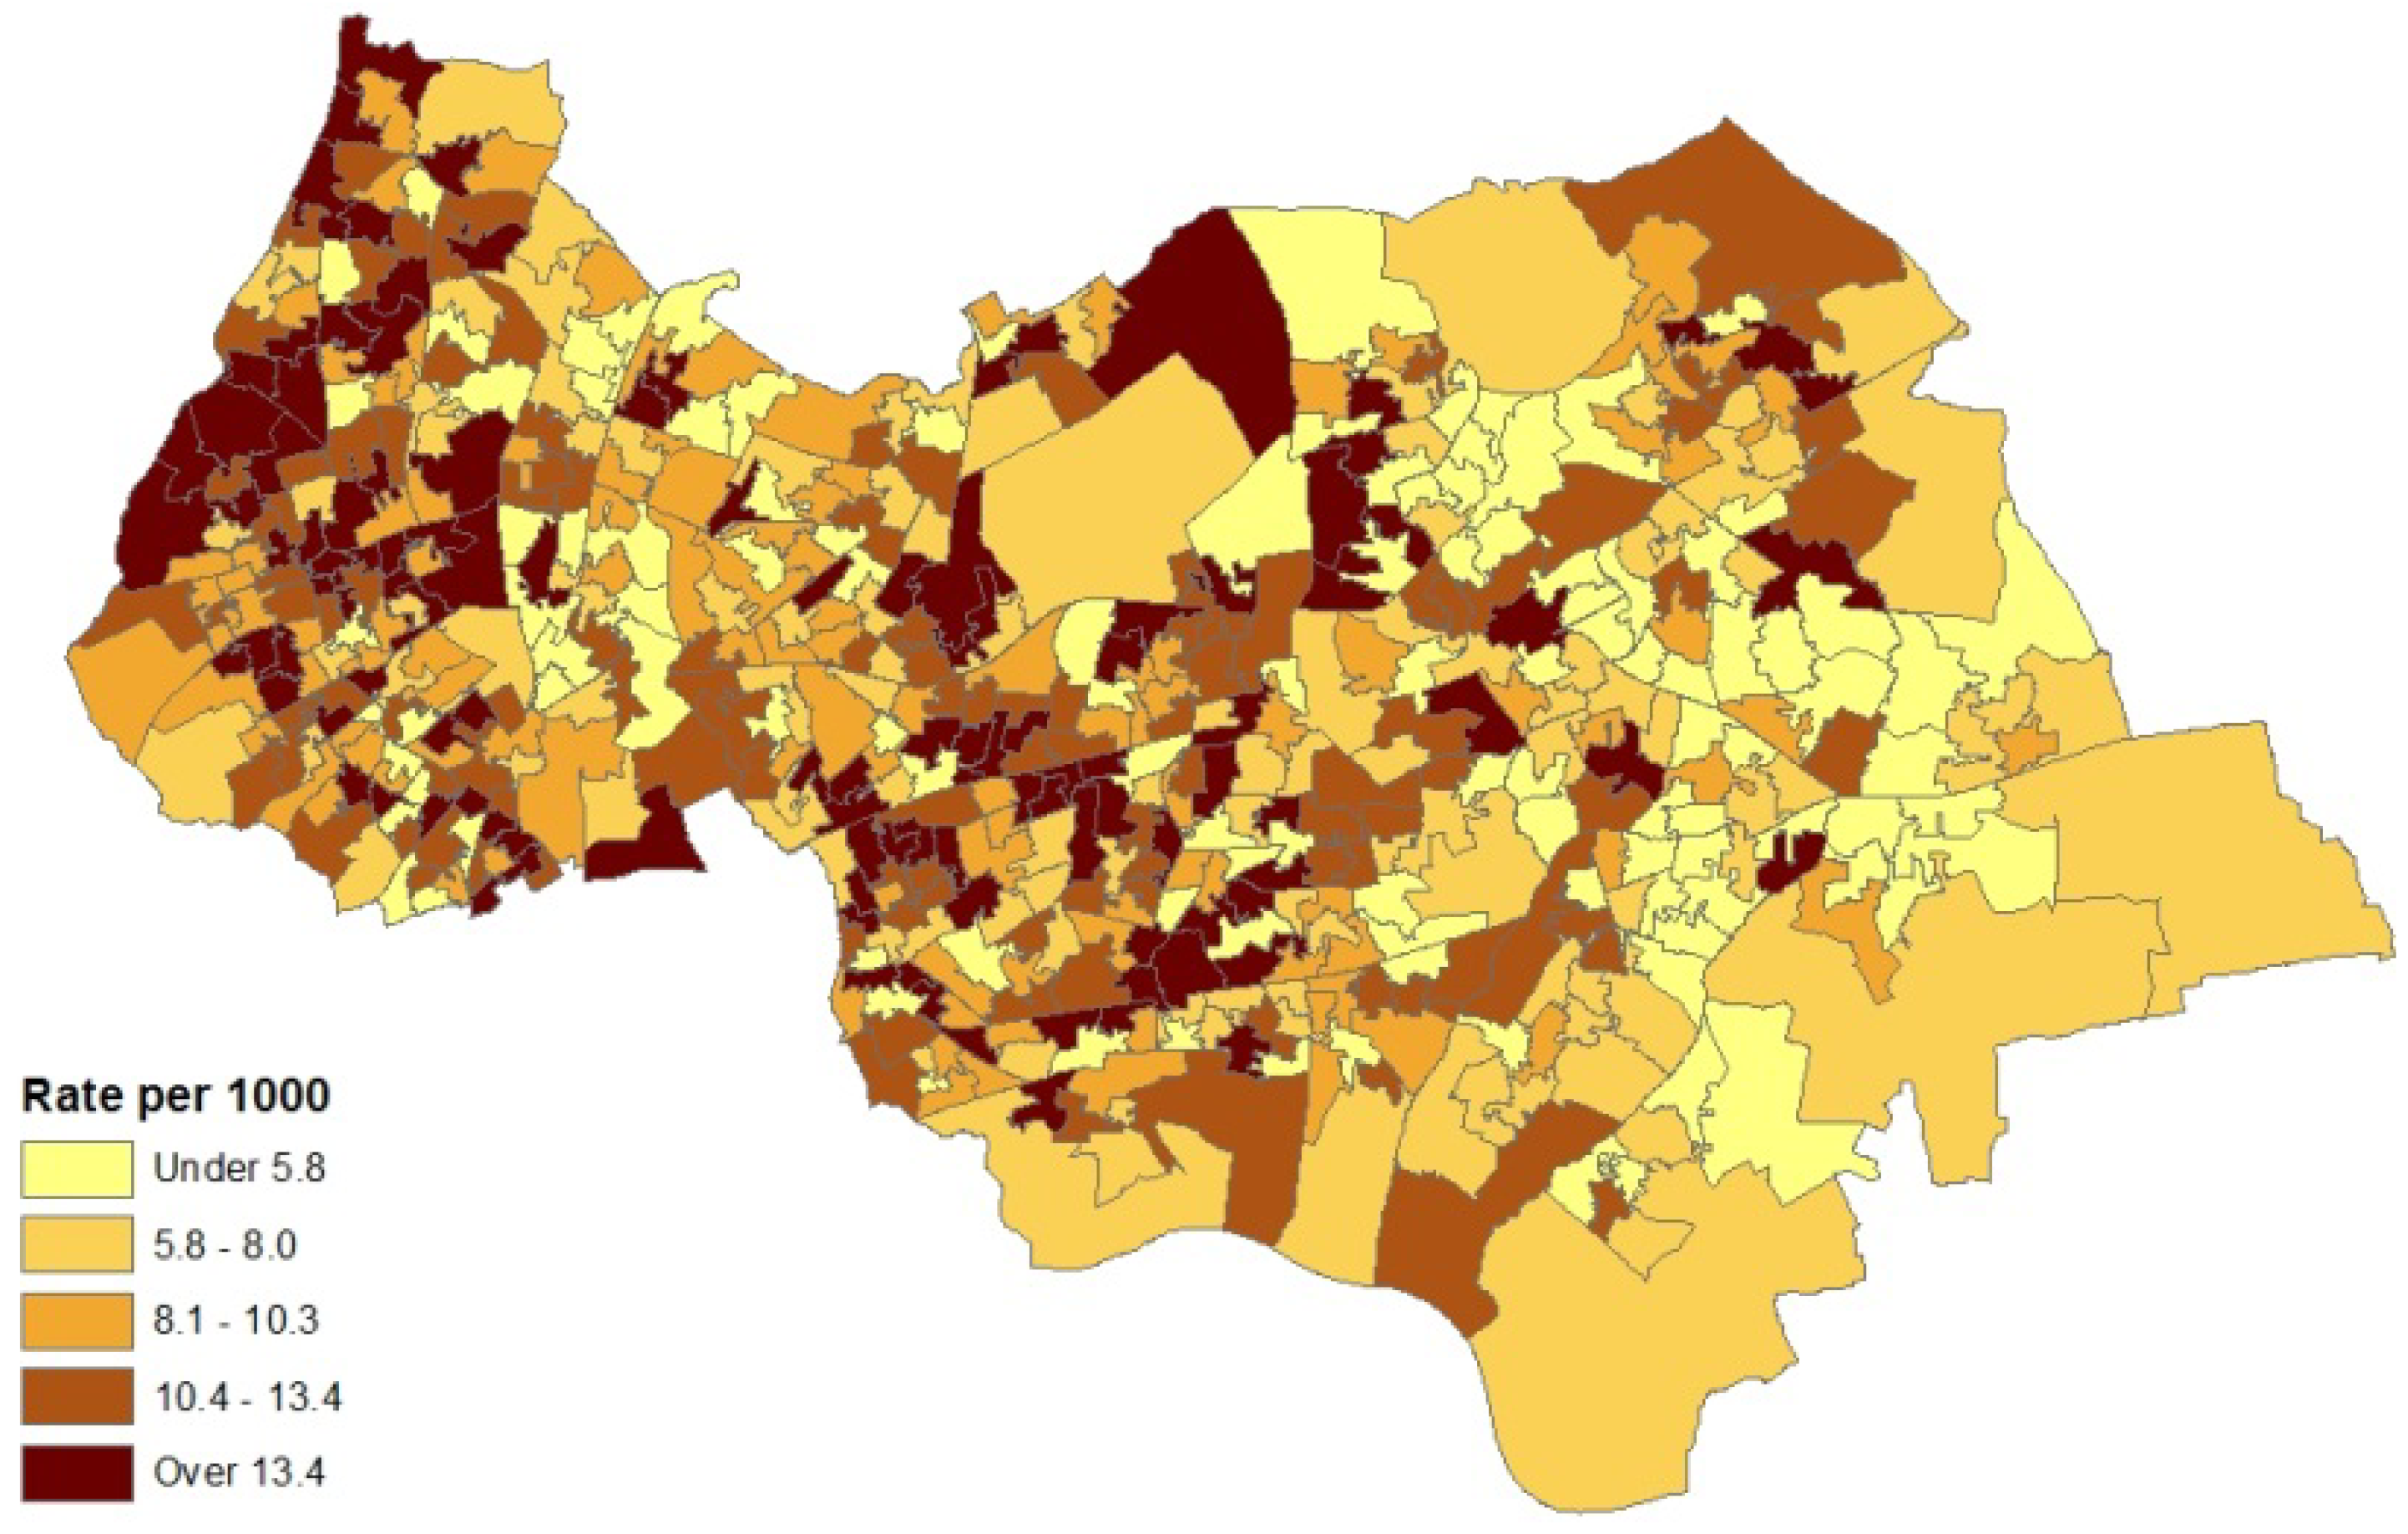
- collateral information on asthma hospital admissions for neighbourhoods (also counts) in 2010–2011; morbidity indicators such as this are taken as reflexive of prevalence for neighbourhoods (target areas), and
- (c)
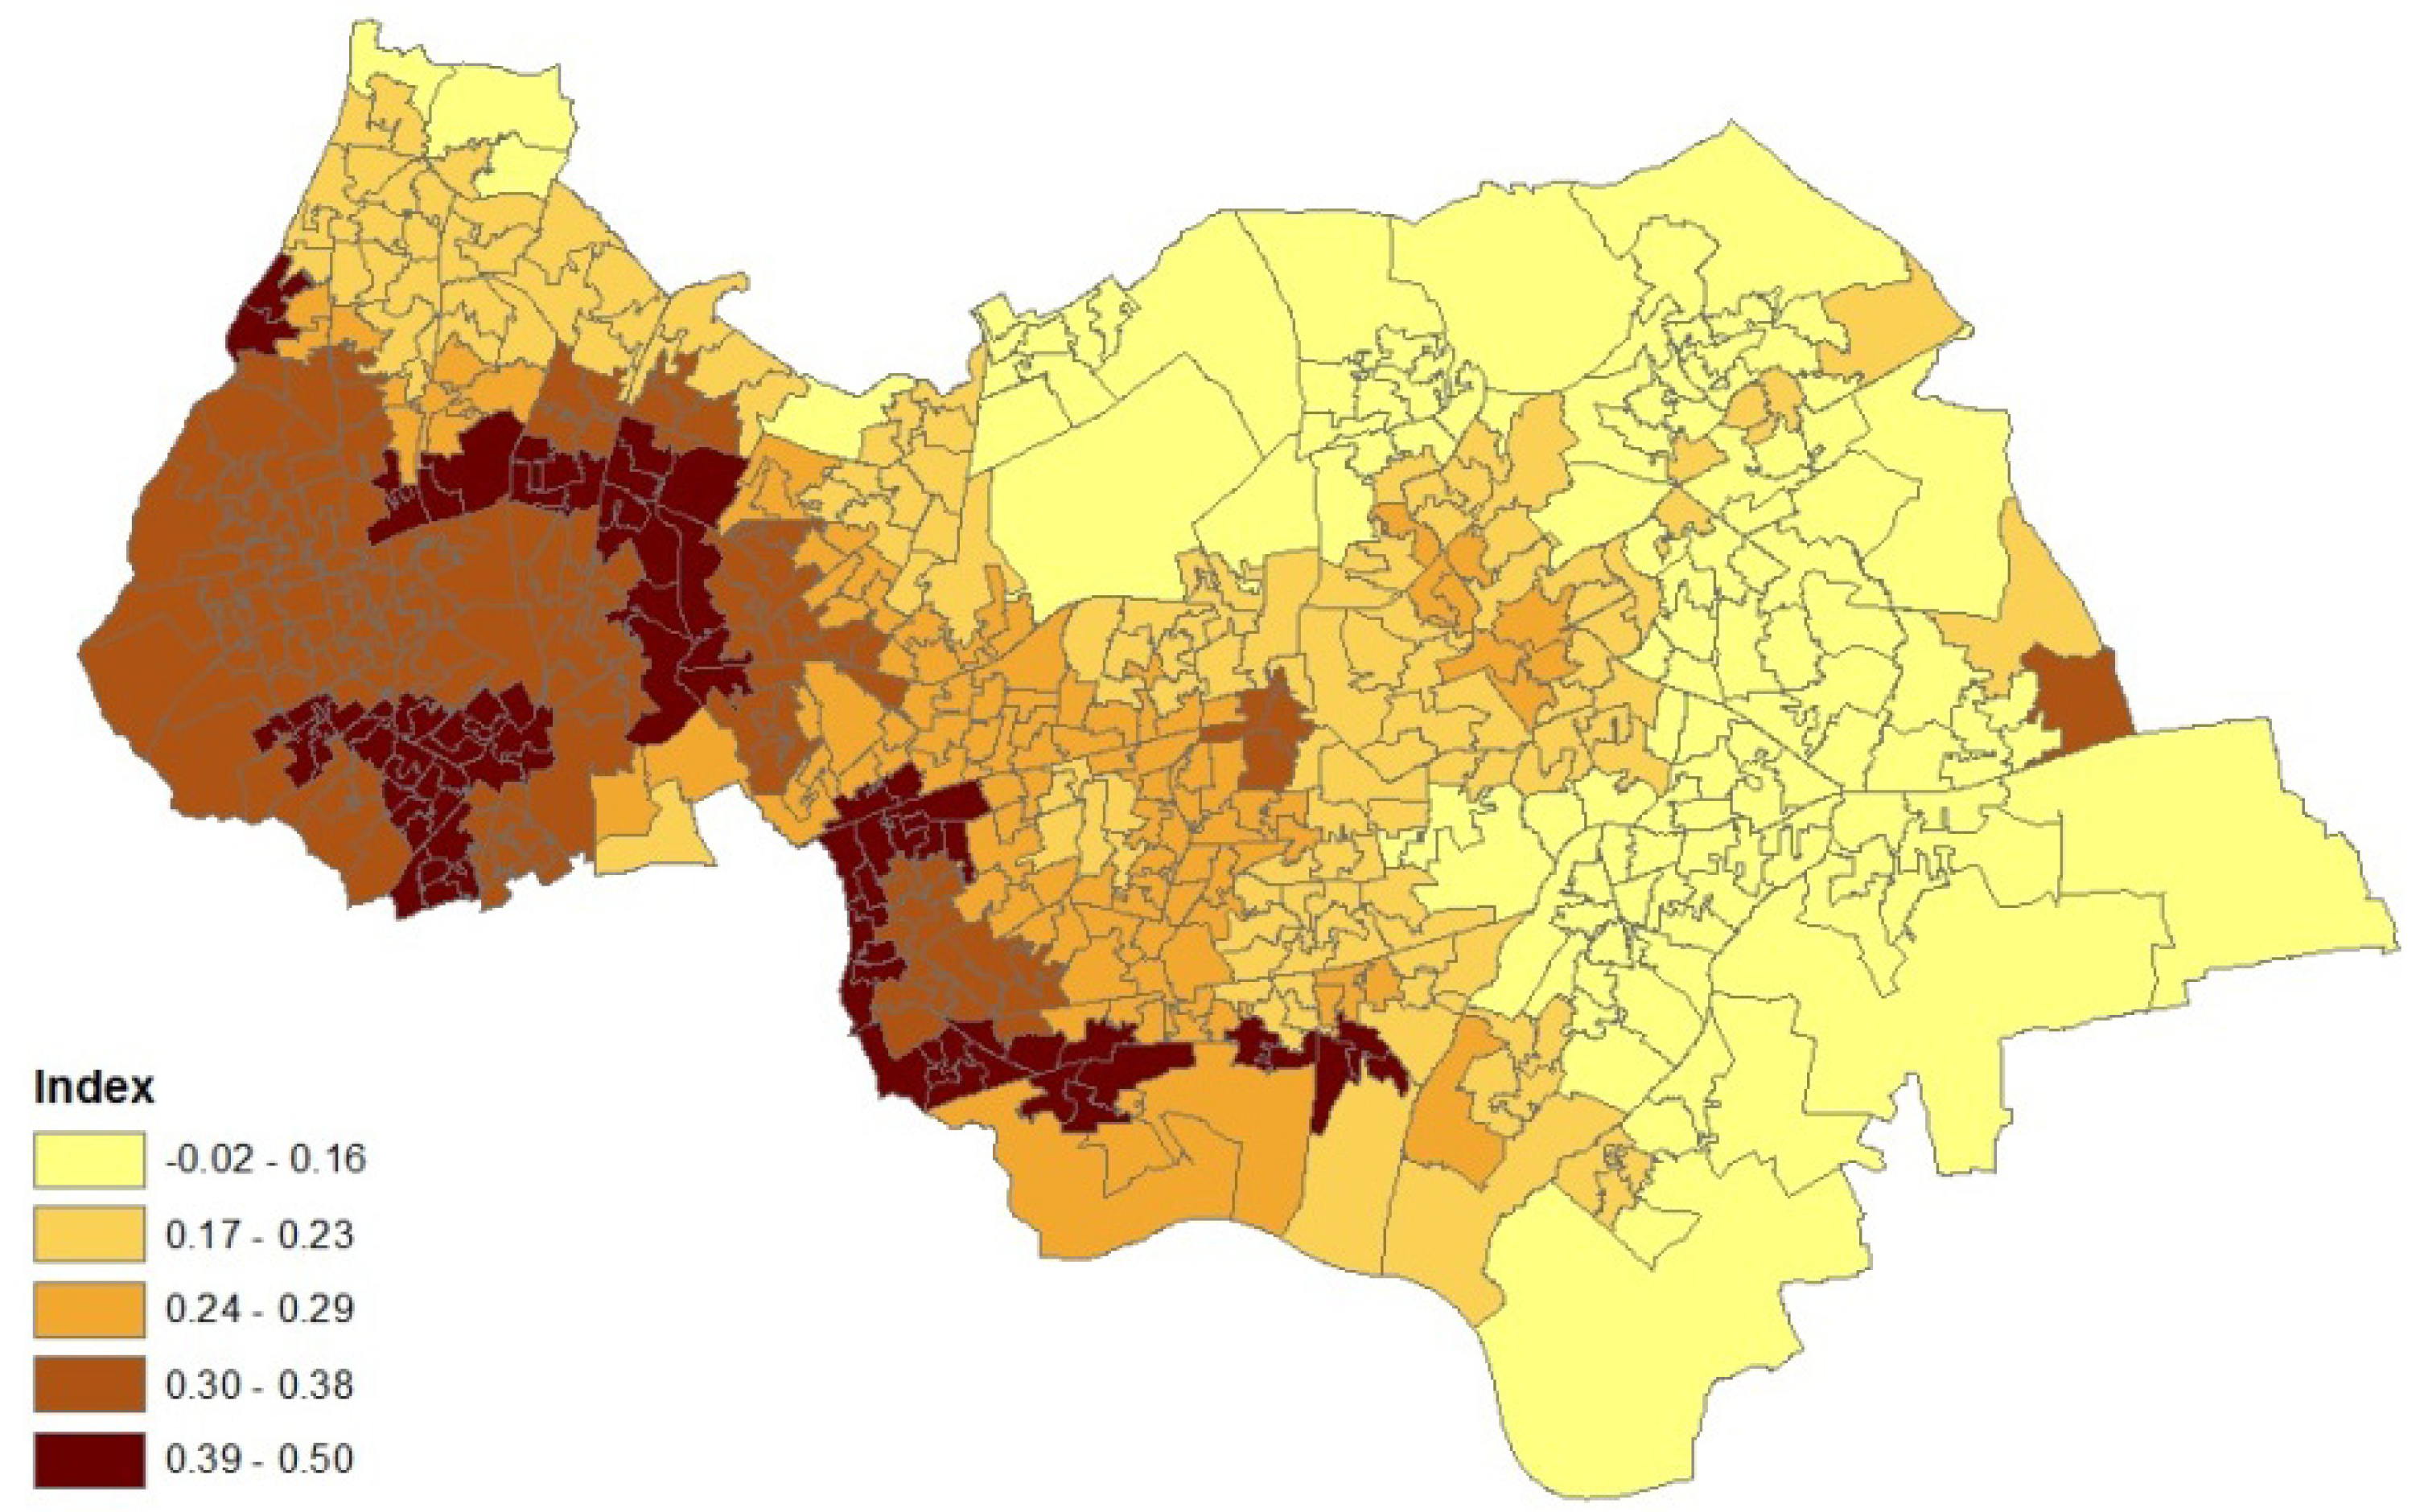
- an air quality index for neighbourhoods in 2008 (target areas), based on levels of nitrogen dioxide, particulates, sulphur dioxide and benzene. The index was developed by the Geography Department at Staffordshire University using data from the UK National Air Quality Archive [7].
3. Methods
3.1. Model for Prevalence Data
3.2. Using Collateral Morbidity and Ecological Covariate Data


3.3. Assumptions Regarding the Spatial Process
3.4. Assessing Alternative Spatial Process Assumptions
- (a)
- localised hot spot probabilities of high asthma risk (excess risk in each neighbourhood without regard to risk in surrounding neighbourhoods),
- (b)
- clustering of excess asthma risk, namely elevated risk in both neighbourhood k and the surrounding neighbourhoods.
4. Analysis and Results
4.1. Analysis Framework

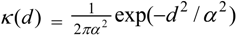
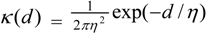
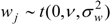
 ) with unknown variance. Model 2 combines a standard exponential kernel (η = 1) with a normal process wj ~ N(0, ). As mentioned by Clark et al. [13], exponential kernels allow for more leptokurtic (more peaked and fat tailed) densities than normal kernels, and so exponential kernels may represent a more flexible assumption for latent prevalence rates ρ and air quality rates x. Model 3 combines a standard normal kernel with a Student t process with five degrees of freedom wj ~ t(0, 5, ), and Model 4 combines a standard exponential kernel with a Student t process with five degrees of freedom. The Student t with low degrees of freedom allows for heavier tails than the normal.

4.2. Results

| Observed Data | |||
|---|---|---|---|
| Model | y | M | x |
| 1 | 376.5 | 1,096.9 | 3.234 |
| 2 | 378.1 | 1,107.7 | 3.223 |
| 3 | 377.5 | 1,104.1 | 3.220 |
| 4 | 379.2 | 1,098.4 | 3.207 |
| Parameter | Interpretation | Model | Mean | 2.5% | 5% | 95% | 97.5% |
|---|---|---|---|---|---|---|---|
| β1 | Prevalence Model Intercept | 1 | −0.25 | −0.35 | −0.33 | −0.17 | −0.16 |
| 2 | −0.22 | −0.32 | −0.31 | −0.11 | −0.08 | ||
| 3 | −0.23 | −0.30 | −0.29 | −0.15 | −0.14 | ||
| 4 | −0.23 | −0.33 | −0.32 | −0.14 | −0.12 | ||
| β2 | Prevalence Model, Pollution Effect | 1 | 0.31 | −0.02 | 0.03 | 0.58 | 0.61 |
| 2 | 0.22 | −0.26 | −0.14 | 0.49 | 0.52 | ||
| 3 | 0.25 | −0.09 | −0.03 | 0.48 | 0.51 | ||
| 4 | 0.25 | −0.08 | −0.03 | 0.58 | 0.65 | ||
| γ1 | Hospitalisation Model Intercept | 1 | −1.82 | −2.06 | −2.04 | −1.62 | −1.60 |
| 2 | −1.78 | −2.05 | −2.01 | −1.56 | −1.53 | ||
| 3 | −1.87 | −2.06 | −2.03 | −1.70 | −1.68 | ||
| 4 | −1.88 | −2.06 | −2.03 | −1.75 | −1.73 | ||
| γ2 | Hospitalisation Model, Prevalence Effect | 1 | 0.38 | 0.33 | 0.33 | 0.43 | 0.43 |
| 2 | 0.36 | 0.30 | 0.31 | 0.42 | 0.43 | ||
| 3 | 0.38 | 0.34 | 0.35 | 0.42 | 0.42 | ||
| 4 | 0.38 | 0.35 | 0.36 | 0.42 | 0.43 | ||
| δ1 | Heteroscedasticity Model, Intercept | 1 | −3.37 | −5.32 | −5.04 | −1.73 | −1.48 |
| 2 | −2.63 | −4.37 | −4.19 | −2.67 | −0.99 | ||
| 3 | −2.55 | −4.42 | −4.16 | −1.32 | −1.01 | ||
| 4 | −2.27 | −4.37 | −4.12 | −0.58 | −0.29 | ||
| δ2 | Heteroscedasticity Model, Slope | 1 | 0.03 | −0.34 | −0.29 | 0.35 | 0.39 |
| 2 | −0.09 | −0.43 | −0.40 | −0.09 | 0.21 | ||
| 3 | −0.12 | −0.41 | −0.36 | 0.17 | 0.24 | ||
| 4 | −0.16 | −0.52 | −0.48 | 0.19 | 0.23 |
| Number of Neighbourhoods (from K = 562) | |||
|---|---|---|---|
| Model | Total Neighbourhoods with Local Exceedance Probabilities > 0.8 | Total Neighbourhoods with Cluster Centre Probabilities > 0.25 | |
| 1 | 66 | 68 | |
| 2 | 75 | 90 | |
| 3 | 74 | 87 | |
| 4 | 80 | 89 | |
| Colocation of local exceedance and cluster centre classifications | |||
| Local exceedance | Model 1 | ||
| Model | No | Yes | |
| 2 | No | 487 | 0 |
| Yes | 9 | 66 | |
| 3 | No | 488 | 0 |
| Yes | 8 | 66 | |
| 4 | No | 482 | 0 |
| Yes | 14 | 66 | |
| Cluster centres | Model 1 | ||
| Model | No | Yes | |
| 2 | No | 472 | 0 |
| Yes | 22 | 68 | |
| 3 | No | 475 | 0 |
| Yes | 19 | 68 | |
| 4 | No | 473 | 0 |
| Yes | 21 | 68 | |
| Distributional Characteristics | ||||
|---|---|---|---|---|
| 1 | 2 | 3 | 4 | |
| Mean | 4.58 | 4.65 | 4.65 | 4.65 |
| Median | 4.50 | 4.56 | 4.57 | 4.58 |
| Skewness | 0.44 | 0.48 | 0.44 | 0.43 |
| 1st percentile | 2.73 | 2.76 | 2.70 | 2.74 |
| 5th percentile | 3.14 | 3.12 | 3.14 | 3.12 |
| 95th percentile | 6.36 | 6.53 | 6.50 | 6.47 |
| 99th percentile | 6.99 | 7.24 | 7.19 | 7.13 |

5. Concluding Remarks
Conflicts of Interest
References
- Goodchild, M.; Anselin, L.; Deichmann, U. A framework for the areal interpolation of socioeconomic data. Environ. Plan. A 1993, 25, 383–397. [Google Scholar]
- Diamantopoulos, A.; Siguaw, J. Formative versus reflective indicators in organizational measure development: A comparison and empirical illustration. Br. J. Manag. 2006, 17, 263–282. [Google Scholar] [CrossRef]
- Congdon, P. Interpolation between spatial frameworks: An application of process convolution to estimating neighbourhood disease prevalence. Stat. Methods Med. Res. 2012, in press. [Google Scholar]
- Higdon, D.; Swall, J.; Kern, J. Non-Stationary Spatial Modeling. In Bayesian Statistics 6; Bernardo, J., Berger, J., Dawid, A., Smith, A., Eds.; Oxford University Press: Oxford, UK, 1999; pp. 761–768. [Google Scholar]
- Lee, H.; Higdon, D.; Calder, C.; Holloman, C. Efficient models for correlated data via convolutions of intrinsic processes. Stat. Model. 2005, 5, 53–74. [Google Scholar] [CrossRef]
- Super Output Areas Explained. Available online: http://neighbourhood.statistics.gov.uk/HTMLDocs/nessgeography/superoutputareasexplained/output-areas-explained.htm (accessed on 10 October 2013).
- Fairburn, J.; Butler, B.; Smith, G. Environmental justice in South Yorkshire: Locating social deprivation and poor environments using multiple indicators. Local Environ. 2008, 14, 139–154. [Google Scholar] [CrossRef]
- Beevers, S.; Dajnak, D.; Westmoreland, E. Air Pollution Modelling, Monitoring And Population Exposure in London; 2004 and 2010; King’s College London: London, UK, 2011. [Google Scholar]
- McNeney, B.; Petkau, J. Overdispersed Poisson regression models for studies of air pollution and human health. Can. J. Stat. 1994, 22, 421–440. [Google Scholar] [CrossRef]
- Koren, H. Associations between criteria air pollutants and asthma. Environ. Health Perspect. 1995, 103, 235–242. [Google Scholar]
- Pénard-Morand, C.; Raherison, C.; Charpin, D.; Kopferschmitt, C.; Lavaud, F.; Caillaud, D.; Annesi-Maesano, I. Long-term exposure to close-proximity air pollution and asthma and allergies in urban children. Eur. Respir. J. 2010, 36, 33–40. [Google Scholar] [CrossRef]
- Austerlitz, F.; Dick, C.; Dutech, C.; Klein, E.; Oddou-Muratorio, S.; Smouse, P.; Sork, V. Using genetic markers to estimate the pollen dispersal curve. Mol. Ecol. 2004, 13, 937–954. [Google Scholar] [CrossRef]
- Clark, J.; Silman, M.; Kern, R.; Macklin, E.; HilleRisLambers, J. Seed dispersal near and far: Patterns across temperate and tropi-cal forests. Ecology 1999, 80, 1475–1494. [Google Scholar] [CrossRef]
- Besag, J.; York, J.; Mollié, A. Bayesian image restoration, with two applications in spatial statistics. Ann. Inst. Stat. Math. 1991, 43, 1–59. [Google Scholar] [CrossRef]
- Spiegelhalter, D.; Best, N.; Carlin, B.; Linde, A. Bayesian measures of model complexity and fit. J. R. Stat. Soc. 2002, 64, 583–639. [Google Scholar] [CrossRef]
- Richardson, S.; Thomson, A.; Best, N.; Elliott, P. Interpreting posterior relative risk estimates in disease-mapping studies. Environ. Health Perspect. 2004, 112, 1016–1025. [Google Scholar] [CrossRef]
- Brooks, S.; Gelman, A. General methods for monitoring convergence of iterative simulations. J. Comput. Graph. Stat. 1998, 7, 434–445. [Google Scholar]
- Luo, W.; Taylor, M.; Parker, S. A comparison of spatial interpolation methods to estimate continuous wind speed surfaces using irregularly distributed data from England and Wales. Int. J. Climatol. 2008, 28, 947–959. [Google Scholar] [CrossRef]
- Goovaerts, P.; Jacquez, G. Accounting for regional background and population size in the detection of spatial clusters and outliers using geostatistical filtering and spatial neutral models: The case of lung cancer in Long Island, New York. Int. J. Health Geogr. 2004, 3, 14. [Google Scholar] [CrossRef] [Green Version]
© 2013 by the authors; licensee MDPI, Basel, Switzerland. This article is an open access article distributed under the terms and conditions of the Creative Commons Attribution license (http://creativecommons.org/licenses/by/3.0/).
Share and Cite
Congdon, P. Spatially Interpolated Disease Prevalence Estimation Using Collateral Indicators of Morbidity and Ecological Risk. Int. J. Environ. Res. Public Health 2013, 10, 5011-5025. https://doi.org/10.3390/ijerph10105011
Congdon P. Spatially Interpolated Disease Prevalence Estimation Using Collateral Indicators of Morbidity and Ecological Risk. International Journal of Environmental Research and Public Health. 2013; 10(10):5011-5025. https://doi.org/10.3390/ijerph10105011
Chicago/Turabian StyleCongdon, Peter. 2013. "Spatially Interpolated Disease Prevalence Estimation Using Collateral Indicators of Morbidity and Ecological Risk" International Journal of Environmental Research and Public Health 10, no. 10: 5011-5025. https://doi.org/10.3390/ijerph10105011