Metabolomic Analyses of Blood Plasma after Oral Administration of D-Glucosamine Hydrochloride to Dogs

Abstract
:1. Introduction
2. Results
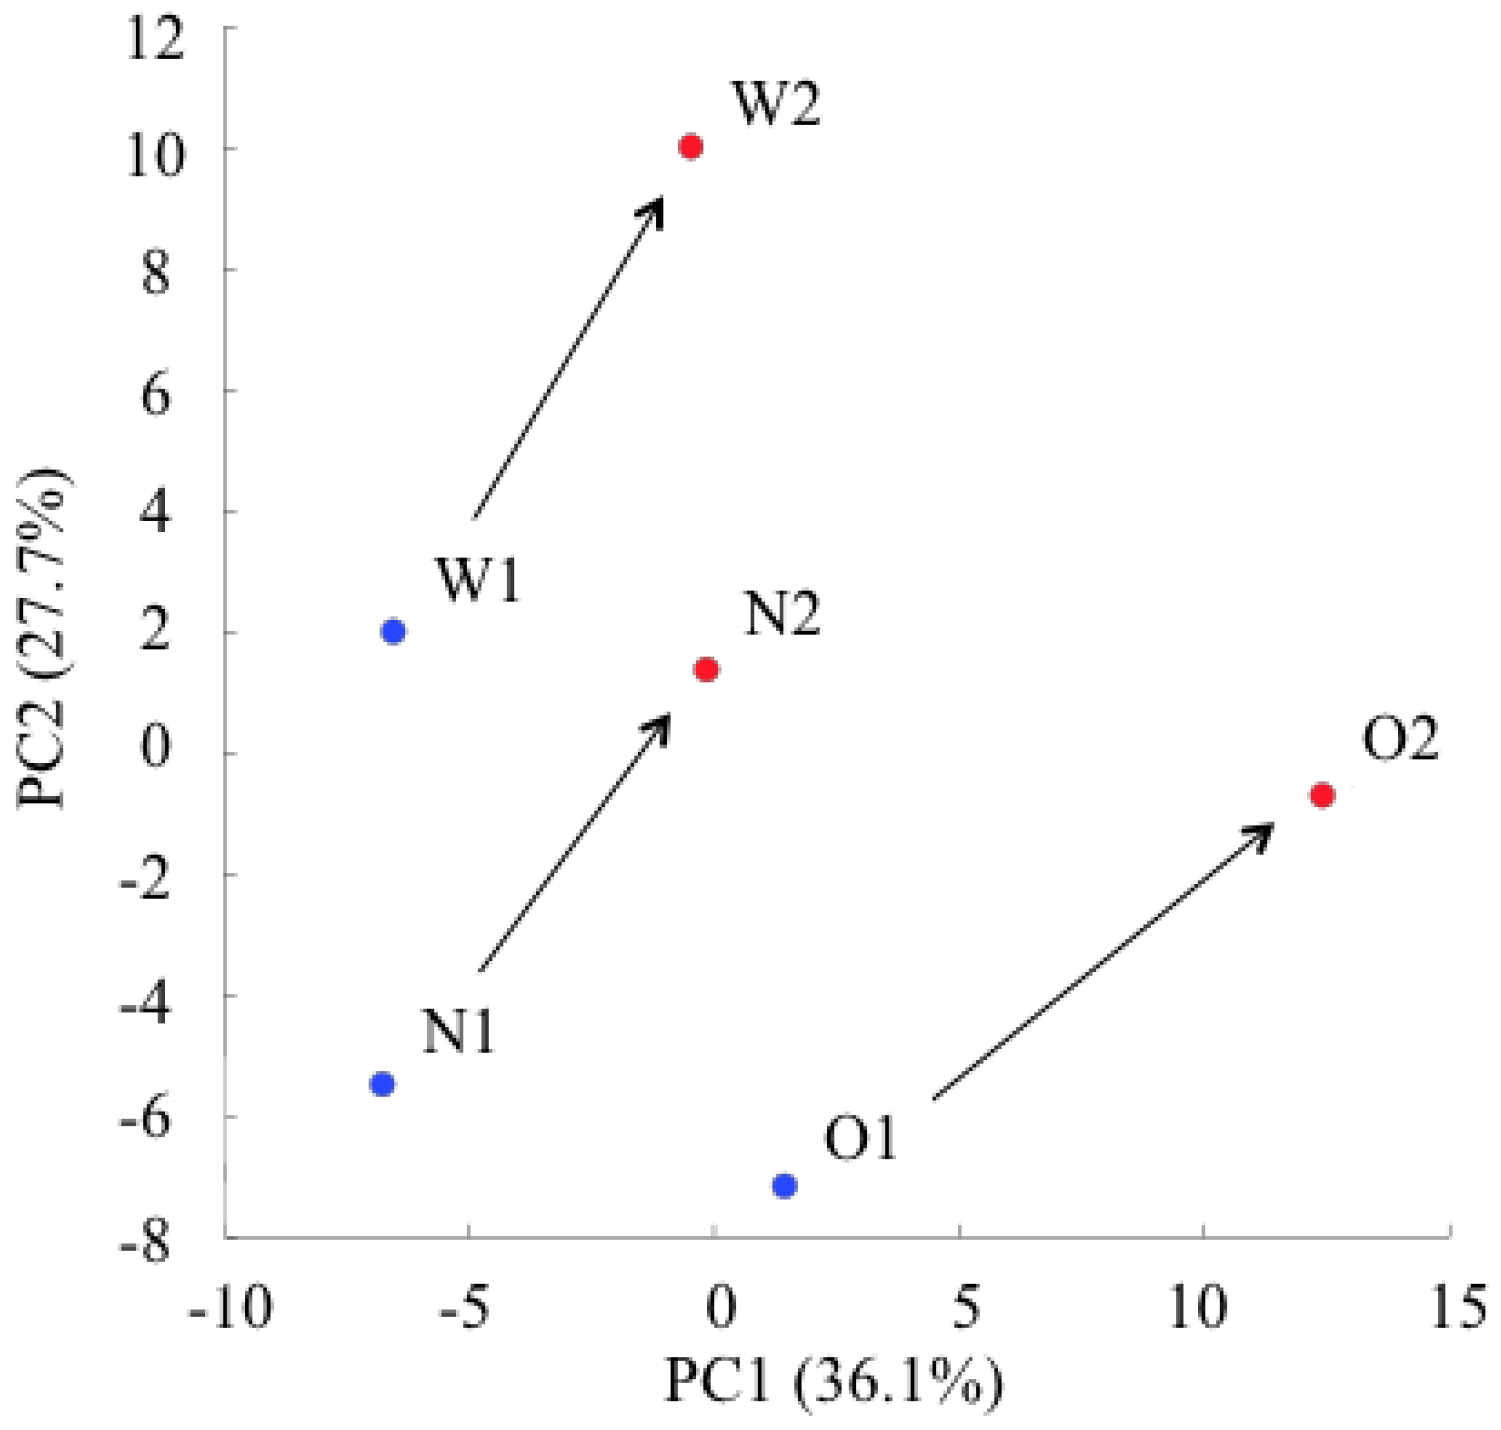
2.1. Principal Component Analysis of the Metabolic Profiles of GlcN∙HCl
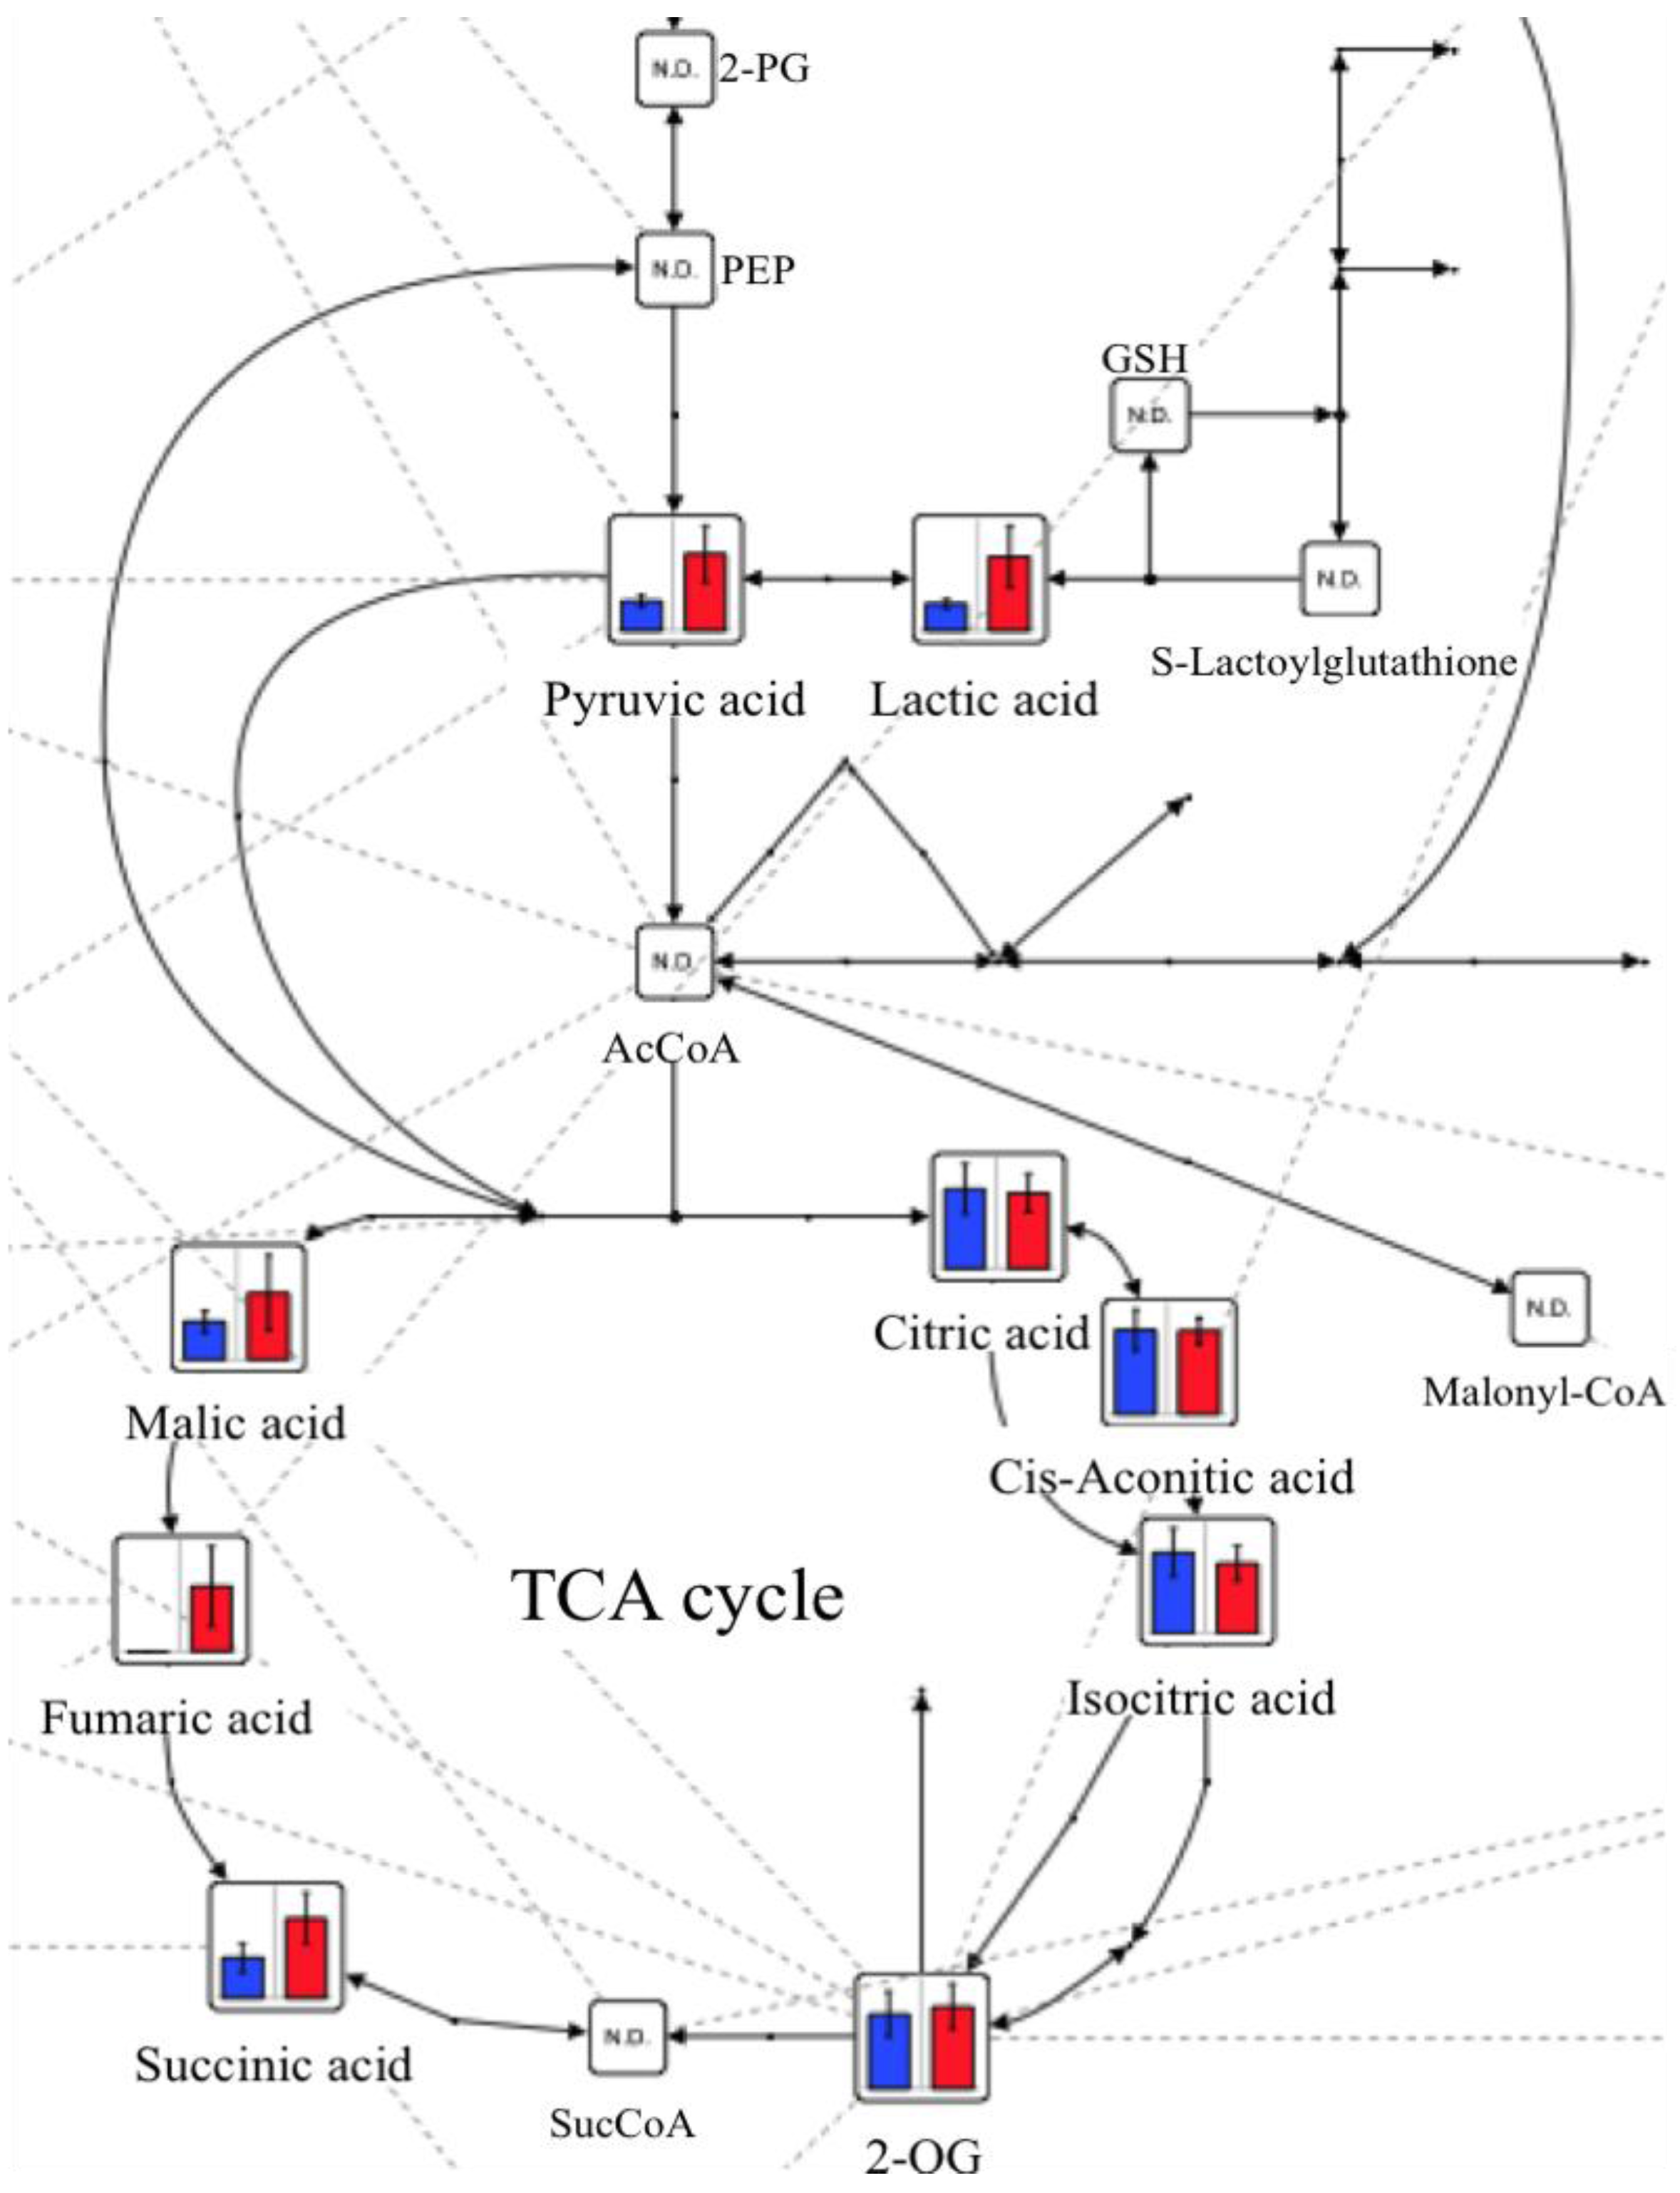
2.2. Changes in Plasma Metabolite Concentrations

| Metabolites | Before | After | ||
|---|---|---|---|---|
| Mean | SD | Mean | SD | |
| Glyoxylic acid | 3.2 | 0.6 | 1.7 | N.A. |
| Pyruvic acid | 94 | 20 | 240 | 89 |
| Lactic acid | 1377 | 263 | 3760 | 1582 |
| 3-Hydroxybutyric acid | 39 | 15 | 28 | 3.0 |
| 2-Hydroxybutyric acid | 34 | 15 | 20 | 7.3 |
| Fumaric acid | N.D. | N.A. | 2.6 | 1.6 |
| 2-Oxoisovaleric acid | 10 | 5.8 | 12 | 6.7 |
| Succinic acid | 7.4 | 2.8 | 15 | 4.8 |
| Malic acid | 7.6 | 2.1 | 13 | 7.6 |
| 2-Oxoglutaric acid | 19 | 5.7 | 20 | 5.6 |
| Glycerol 3-phosphate | 2.8 | 0.5 | 4.0 | 1.1 |
| cis-Aconitic acid | 8.4 | 2.0 | 8.3 | 1.3 |
| 3-Phosphoglyceric acid | 1.0 | 0.3 | 1.6 | 0.3 |
| Citric acid | 281 | 88 | 266 | 68 |
| Isocitric acid | 8.7 | 2.6 | 7.6 | 1.9 |
| Gluconic acid | 5.3 | 1.9 | 6.1 | 1.1 |
| Glycine | 144 | 8.5 | 148 | 25 |
| Putrescine | 0.6 | 0.06 | 0.7 | 0.13 |
| Sarcosine * | 3.8 | 0.6 | 5.9 | 0.3 |
| Alanine * | 291 | 42 | 417 | 39 |
| β-Alanine | 0.6 | 0.2 | 0.7 | 0.2 |
| N,N-Dimethylglycine | 4.9 | 0.9 | 6.1 | 1.6 |
| Choline | 6.3 | 2.9 | 9.5 | 2.2 |
| Serine | 109 | 14 | 132 | 36 |
| Creatinine | 48 | 4.7 | 45 | 3.8 |
| Proline | 87 | 16 | 127 | 26 |
| Betaine | 233 | 31 | 289 | 5.3 |
| Valine | 105 | 42 | 115 | 35 |
| Threonine | 116 | 28 | 150 | 65 |
| Hydroxyproline ** | 3.7 | 0.11 | 5.7 | 0.3 |
| Creatine | 17 | 3.1 | 20 | 9.2 |
| Isoleucine | 36 | 13 | 41 | 5.8 |
| Leucine | 79 | 26 | 96 | 31 |
| Asparagine | 37 | 4.4 | 44 | 8.4 |
| Ornithine | 12 | 4.9 | 13 | 5.1 |
| Aspartic acid ** | 4.1 | 0.3 | 6.4 | 0.5 |
| Glutamine | 755 | 177 | 907 | 204 |
| Lysine | 153 | 103 | 143 | 29 |
| Glutamic acid | 30 | 5.0 | 36 | 7.7 |
| Methionine | 29 | 4.0 | 34 | 2.4 |
| Histidine * | 79 | 3.5 | 93 | 6.9 |
| Phenylalanine | 53 | 8.7 | 56 | 6.4 |
| Arginine | 85 | 14 | 102 | 25 |
| Citrulline | 53 | 22 | 64 | 19 |
| Tyrosine | 37 | 5.8 | 44 | 6.6 |
| Tryptophan | 51 | 17 | 57 | 17 |
| Carnosine | 25 | 3.7 | 31 | 5.7 |
| Cytidine | 0.7 | 0.08 | 1.2 | 0.2 |
| Glutathione (GSSG) divalent | 0.6 | 0.09 | 0.8 | 0.3 |
| Glucosamine | N.D. | N.A. | N.D. | N.A. |
| N-Acetylglucosamine | N.A. | N.A. | N.A. | N.A. |
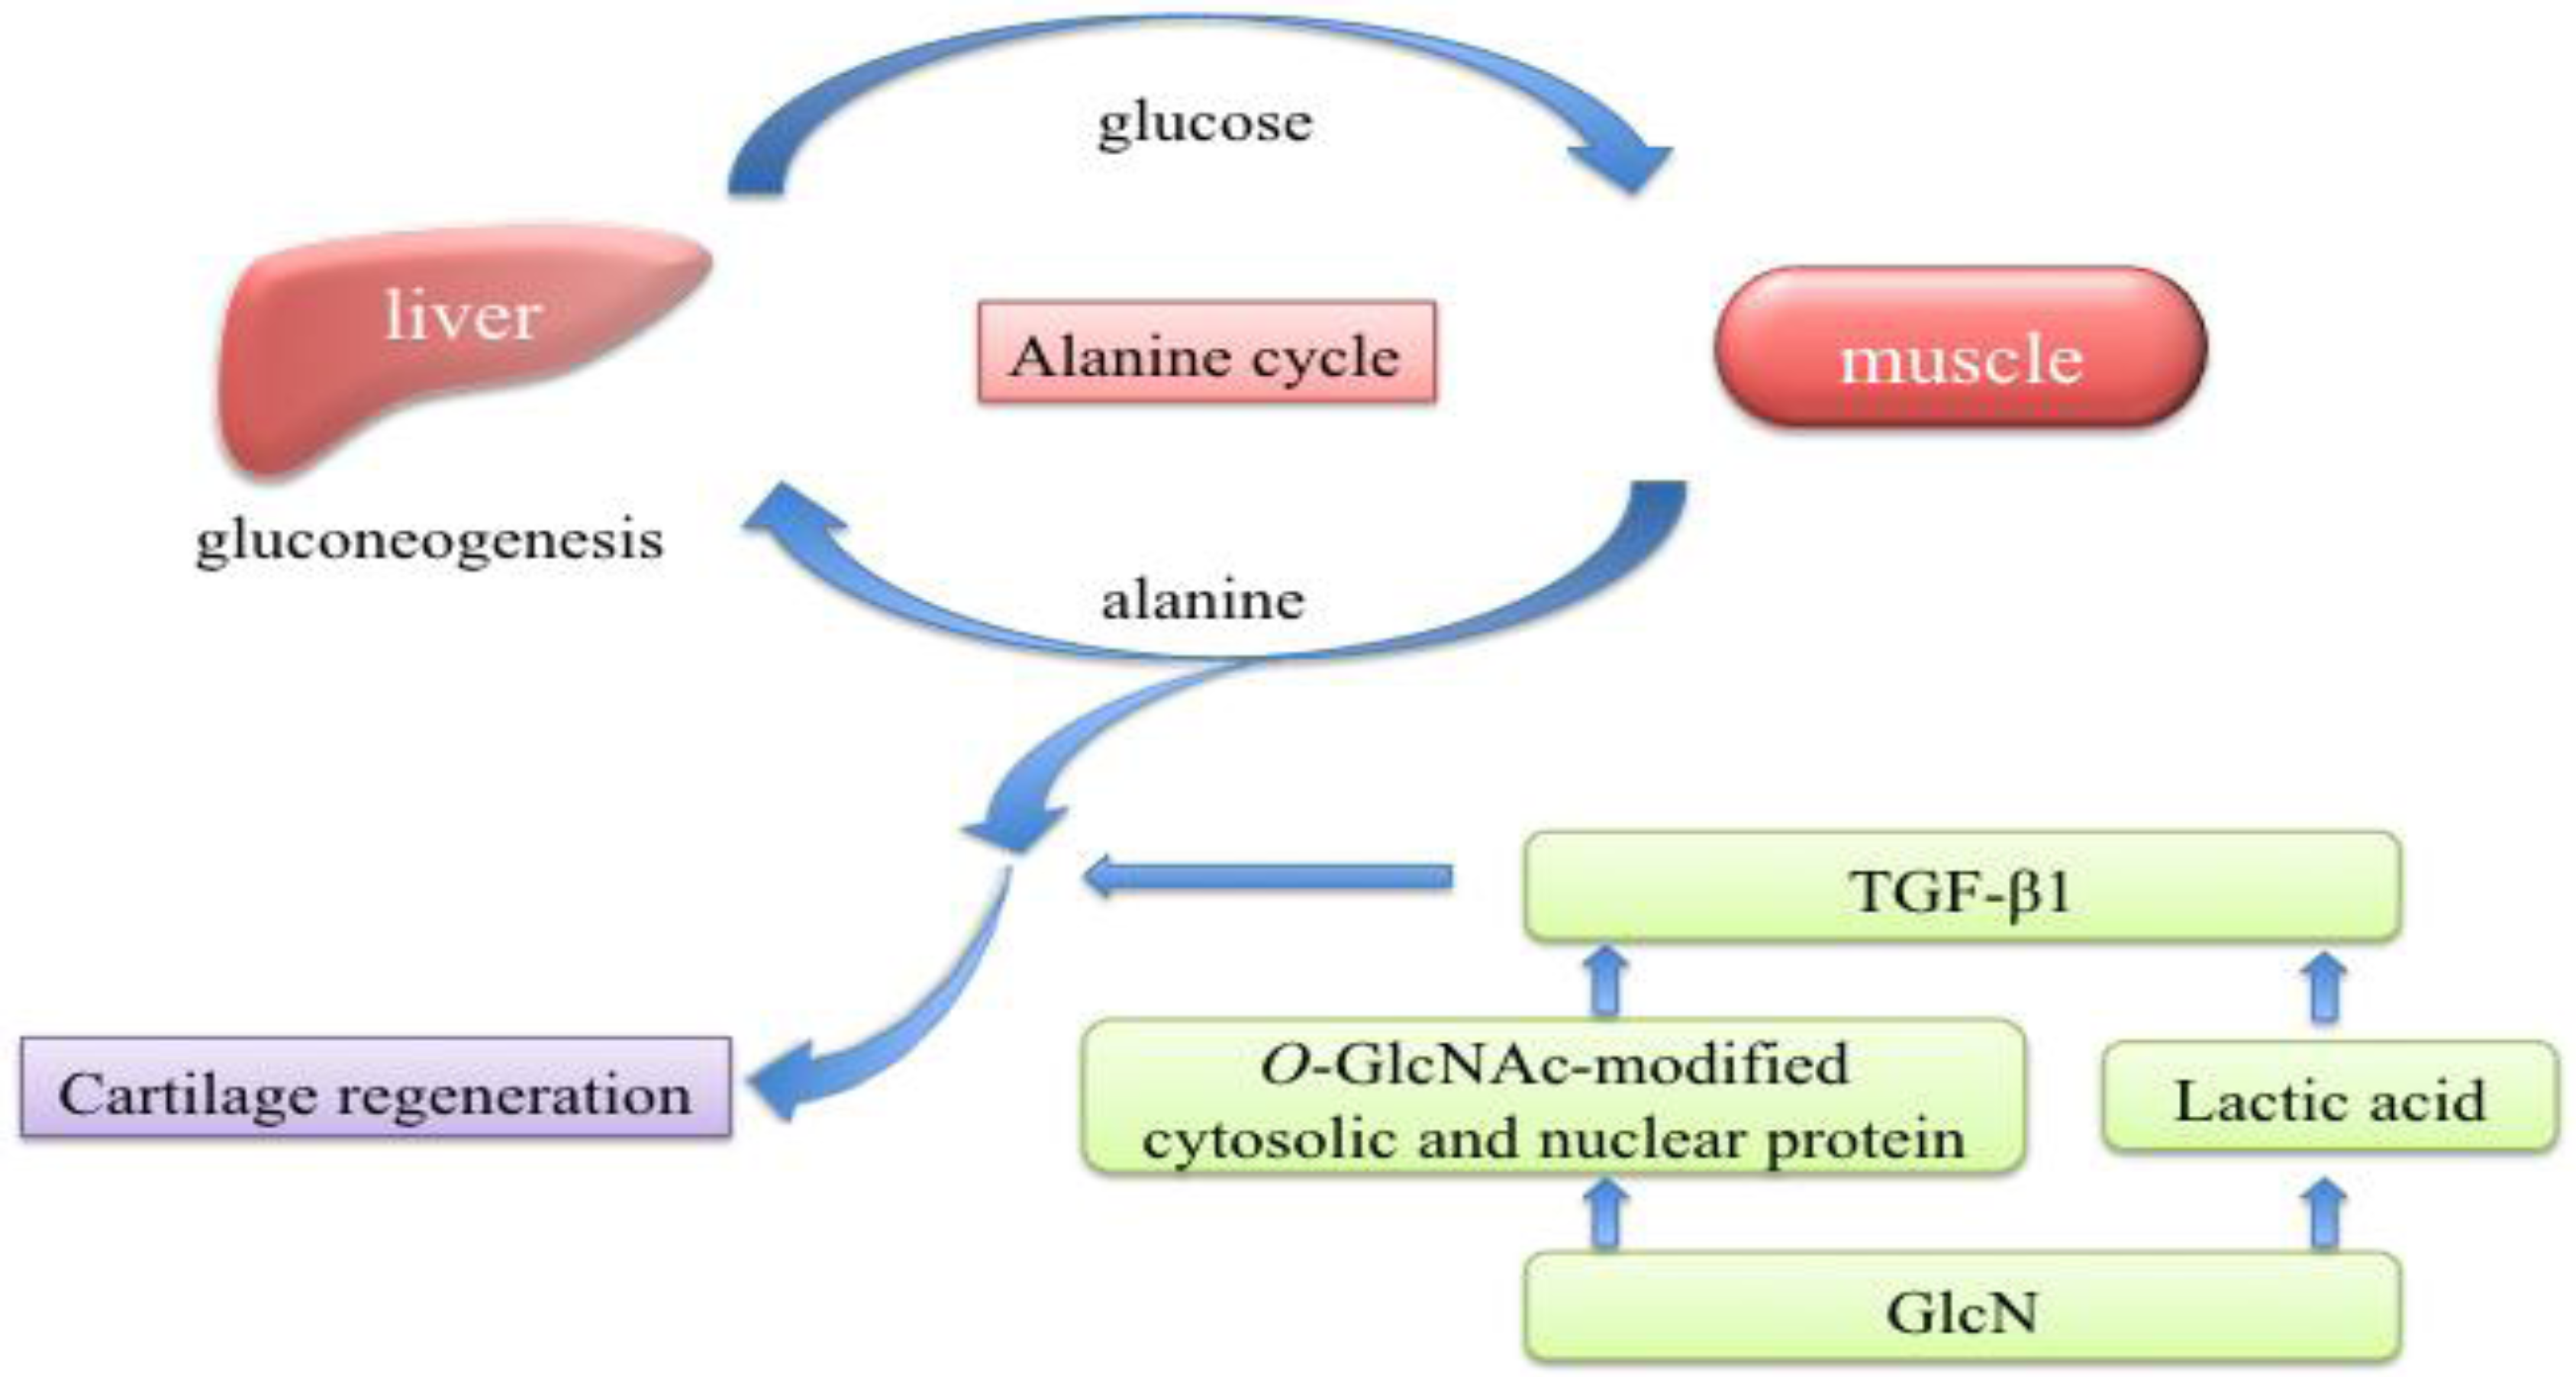
3. Discussion
4. Materials and Methods
4.1. Chemicals
4.2. Animals
4.3. Administration and Blood Sampling
4.4. Instrumentation
4.5. CE-TOFMS Conditions
4.6. Data Analysis
4.7. Statistical Analysis
5. Conclusions
Acknowledgments
References
- Fox, B.A.; Stephens, M.M. Glucosamine hydrochloride for the treatment of osteoarthritis symptoms. Clin. Interv. Aging 2007, 2, 599–604. [Google Scholar]
- Aghazadeh-Habashi, A.; Jamali, F. The glucosamine controversy; a pharmacokinetic issue. J. Pharm. Pharm. Sci. 2011, 14, 264–273. [Google Scholar]
- Clegg, D.O.; Reda, D.J.; Harris, C.L.; Klein, M.A.; O’Dell, J.R.; Hooper, M.M.; Bradley, J.D.; Bingham, C.O., III.; Weisman, M.H.; Jackson, C.G.; et al. Glucosamine, chondroitin sulfate, and the two in combination for painful knee osteoarthritis. N. Engl. J. Med. 2006, 354, 795–808. [Google Scholar] [CrossRef]
- Goodrich, L.R.; Nixon, A.J. Medical treatment of osteoarthritis in the horse—a review. Vet. J. 2006, 171, 51–69. [Google Scholar] [CrossRef]
- Minami, S.; Hata, M.; Tamai, Y.; Hashida, M.; Takayama, T.; Yamamoto, S.; Okada, M.; Funatsu, T.; Tsuka, T.; Imagawa, T.; et al. Clinical application of D-glucosamine and scale collagen peptide on canine and feline orthopedic diseases and spondylitis deformans. Carbohydr. Polym. 2010, 84, 831–834. [Google Scholar]
- Barclay, T.S.; Tsourounis, C.; McCart, G.M. Glucosamine. Ann. Pharmacother. 1998, 32, 574–579. [Google Scholar] [CrossRef]
- Aghazadeh-Habashi, A.; Sattari, S.; Pasutto, F.; Jamali, F. Single dose pharmacokinetics and bioavailability of glucosamine in the rat. J. Pharm. Pharm. Sci. 2002, 5, 181–184. [Google Scholar]
- Adebowale, A.; Du, J.; Liang, Z.; Leslie, J.L.; Eddington, N.D. The bioavailability and pharmacokinetics of glucosamine hydrochloride and low molecular weight chondroitin sulfate after single and multiple doses to beagle dogs. Biopharm. Drug Dispos. 2002, 23, 217–225. [Google Scholar] [CrossRef]
- Du, J.; White, N.; Eddington, N.D. The bioavailability and pharmacokinetics of glucosamine hydrochloride and chondroitin sulfate after oral and intravenous single dose administration in the horse. Biopharm. Drug Dispos. 2004, 25, 109–116. [Google Scholar] [CrossRef]
- Laverty, S.; Sandy, J.D.; Celeste, C.; Vachon, P.; Marier, J.F.; Plaas, A.H. Synovial fluid levels and serum pharmacokinetics in a large animal model following treatment with oral glucosamine at clinically relevant doses. Arthritis Rheum. 2005, 52, 181–191. [Google Scholar] [CrossRef]
- Meulyzer, M.; Vachon, P.; Beaudry, F.; Vinardell, T.; Richard, H.; Beauchamp, G.; Laverty, S. Comparison of pharmacokinetics of glucosamine and synovial fluid levels following administration of glucosamine sulfate or glucosamine hydrochloride. Osteoarthr. Cartil. 2008, 16, 973–979. [Google Scholar]
- Setnikar, I.; Giachetti, C.; Zanolo, G. Absorption, distribution and excretion of radioactivity after a single intravenous or oral administration of [14C] glucosamine to the rat. Pharmatherapeutica 1984, 3, 538–550. [Google Scholar]
- Azuma, K.; Osaki, T.; Tsuka, T.; Imagawa, T.; Okamoto, Y.; Takamori, Y.; Minami, S. Effects of oral glucosamine hydrochloride administration on plasma free amino acid concentrations in dogs. Mar. Drugs 2011, 9, 712–718. [Google Scholar] [CrossRef]
- Tamai, Y.; Miyatake, K.; Okamoto, Y.; Takamori, Y.; Sakamoto, H.; Minami, S. Enhanced healing of cartilaginous injuries by glucosamine hydrochloride. Carbohydr. Polym. 2002, 48, 369–378. [Google Scholar] [CrossRef]
- Tamai, Y.; Miyatake, K.; Okamoto, Y.; Takamori, Y.; Sakamoto, K.; Minami, S. Enhanced healing of cartilaginous injuries by N-acetyl-D-glucosamine and glucuronic acid. Carbohydr. Polym. 54, 251–262.
- Ringnér, M. What is principal component analysis? Nat. Biotechnol. 2008, 26, 303–304. [Google Scholar] [CrossRef]
- Simon, R.R.; Marks, V.; Leeds, A.R.; Anderson, J.W. A comprehensive review of oral glucosamine use and effects on glucose metabolism in normal and diabetic individuals. Diabetes Metab. Res. Rev. 2011, 27, 14–27. [Google Scholar] [CrossRef]
- Kita, K.; Hirawake, H.; Miyadera, H.; Amino, H.; Takeo, S. Role of complex II in anaerobic respiration of the parasite mitochondria from Ascaris suum and Plasmodium falciparum. Biochim. Biophys. Acta 2002, 1553, 123–139. [Google Scholar]
- Hirayama, A.; Kami, K.; Sugimoto, M.; Sugawara, M.; Toki, N.; Onozuka, H.; Kinoshita, T.; Saito, N.; Ochiai, A.; Tomita, M.; et al. Quantitative metabolome profiling of colon and stomach cancer microenvironment by capillary electrophoresis time-of-flight mass spectrometry. Cancer Res. 2009, 69, 4918–4925. [Google Scholar]
- Yalamanchi, N.; Klein, M.B.; Pham, H.M.; Longaker, M.T.; Chang, J. Flexor tendon wound healing in vitro: Lactate up-regulation of TGF-beta expression and functional activity. Plast. Reconstr. Surg. 2004, 113, 625–632. [Google Scholar] [CrossRef]
- Folkman, J.; Klagsbrun, M. Angiogenic factors. Science 1987, 235, 442–447. [Google Scholar]
- Klein, M.B.; Yalamanchi, N.; Pham, H.; Longaker, M.T.; Chang, J. Flexor tendon healing in vitro: Effects of TGF-beta on tendon cell collagen production. J. Hand Surg. Am. 2002, 27, 615–620. [Google Scholar] [CrossRef]
- Felig, P. The glucose-alanine cycle. Metabolism 1973, 22, 179–207. [Google Scholar] [CrossRef]
- Cheatham, B. Enough is enough: Nutrient sensors and insulin resistance. Endocrinology 2004, 145, 2115–2117. [Google Scholar] [CrossRef]
- Uldry, M.; Ibberson, M.; Hosokawa, M.; Thorens, B. GLUT2 is a high affinity glucosamine transporter. FEBS Lett. 2002, 524, 199–203. [Google Scholar] [CrossRef]
- Luo, B.; Soesanto, Y.; McClain, D.A. Protein modification by O-linked GlcNAc reduces angiogenesis by inhibiting Akt activity in endothelial cells. Arterioscler. Thromb. Vasc. Biol. 2008, 28, 651–657. [Google Scholar] [CrossRef]
- Soga, T.; Heiger, D.N. Amino acid analysis by capillary electrophoresis electrospray ionization mass spectrometry. Anal. Chem. 2000, 72, 1236–1241. [Google Scholar] [CrossRef]
- Soga, T.; Ohashi, Y.; Ueno, Y.; Naraoka, H.; Tomita, M.; Nishioka, T. Quantitative metabolome analysis using capillary electrophoresis mass spectrometry. J. Proteome Res. 2003, 2, 488–494. [Google Scholar] [CrossRef]
- Soga, T.; Ueno, Y.; Naraoka, H.; Ohashi, Y.; Tomita, M.; Nishioka, T. Simultaneous determination of anionic intermediates for Bacillus subtilis metabolic pathways by capillary electrophoresis electrospray ionization mass spectrometry. Anal. Chem. 2002, 74, 2233–2239. [Google Scholar] [CrossRef]
- Soga, T.; Ishikawa, T.; Igarashi, S.; Sugawara, K.; Kakazu, Y.; Tomita, M. Analysis of nucleotides by pressure-assisted capillary electrophoresis-mass spectrometry using silanol mask technique. J. Chromatogr. 2007, 1159, 125–133. [Google Scholar]
- Sugimoto, M.; Hirayama, A.; Ihiskawa, T.; Baran, R.; Robert, M.; Uehara, K.; Soga, T.; Tomita, M. Differential metabolomics software for capillary electrophoresis-mass spectrometry data analysis. Metabolomics 2010, 6, 27–41. [Google Scholar] [CrossRef]
- Junker, B.H.; Klukas, C.; Schreiber, F. VANTED: A system for advanced data analysis and visualization in the context of biological networks. BMC Bioinforma. 2006, 7. [Google Scholar] [CrossRef]
- Klukas, C.; Schreiber, F. Integration of -omics data and networks for biomedical research with VANTED. J. Integr. Bioinform. 2010, 7, 112. [Google Scholar]
© 2012 by the authors; licensee MDPI, Basel, Switzerland. This article is an open-access article distributed under the terms and conditions of the Creative Commons Attribution license (http://creativecommons.org/licenses/by/3.0/).
Share and Cite
Osaki, T.; Azuma, K.; Kurozumi, S.; Takamori, Y.; Tsuka, T.; Imagawa, T.; Okamoto, Y.; Minami, S. Metabolomic Analyses of Blood Plasma after Oral Administration of D-Glucosamine Hydrochloride to Dogs. Mar. Drugs 2012, 10, 1873-1882. https://doi.org/10.3390/md10081873
Osaki T, Azuma K, Kurozumi S, Takamori Y, Tsuka T, Imagawa T, Okamoto Y, Minami S. Metabolomic Analyses of Blood Plasma after Oral Administration of D-Glucosamine Hydrochloride to Dogs. Marine Drugs. 2012; 10(8):1873-1882. https://doi.org/10.3390/md10081873
Chicago/Turabian StyleOsaki, Tomohiro, Kazuo Azuma, Seiji Kurozumi, Yoshimori Takamori, Takeshi Tsuka, Tomohiro Imagawa, Yoshiharu Okamoto, and Saburo Minami. 2012. "Metabolomic Analyses of Blood Plasma after Oral Administration of D-Glucosamine Hydrochloride to Dogs" Marine Drugs 10, no. 8: 1873-1882. https://doi.org/10.3390/md10081873