Analysis of Indonesian Spice Essential Oil Compounds That Inhibit Locomotor Activity in Mice


Abstract
: Some fragrance components of spices used for cooking are known to have an effect on human behavior. The aim of this investigation was to examine the effect of the essential oils of basil (Ocimum formacitratum L.) leaves, lemongrass (Cymbopogon citrates L.) herbs, ki lemo (Litsea cubeba L.) bark, and laja gowah (Alpinia malaccencis Roxb.) rhizomes on locomotor activity in mice and identify the active component(s) that might be responsible for the activity. The effect of the essential oils was studied by a wheel cage method and the active compounds of the essential oils were identified by GC/MS analysis. The essential oils were administered by inhalation at doses of 0.1, 0.3, and 0.5 mL/cage. The results showed that the four essential oils had inhibitory effects on locomotor activity in mice. Inhalation of the essential oils of basil leaves, lemongrass herbs, ki lemo bark, and laja gowah rhizomes showed the highest inhibitory activity at doses of 0.5 (57.64%), 0.1 (55.72%), 0.5 (60.75%), and 0.1 mL/cage (47.09%), respectively. The major volatile compounds 1,8-cineole, α-terpineol, 4-terpineol, citronelol, citronelal, and methyl cinnamate were identified in blood plasma of mice after inhalation of the four oils. These compounds had a significant inhibitory effect on locomotion after inhalation. The volatile compounds of essential oils identified in the blood plasma may correlate with the locomotor-inhibiting properties of the oil when administered by inhalation.1. Introduction
The fragrance of essential oils of aromatic plants is known to influence locomotor activity [1-4]. Kovar et al. [5] investigated the activity of essential oil of rosemary and its main constituent, 1.8-cineole in this context. Locomotor activity of the test animals increased significantly after they inhaled the oil. Furthermore, Buchbauer et al. [6] reported that 40 fragrances and six essential oils from Europe were observed to have the ability to reduce the locomotor activity of test animals. Studies conducted by Sangat and Roematyo [7] in the field of etnopharmacology indicated that some 49 species of Indonesian plants from 22 families are traditionally used in aromatherapy, but publications of data, especially those concerning active compounds of plant volatile oils responsible for the activity are very rare. We have previously studied essential oils of nutmeg seeds that showed a higher inhibitory effect on locomotor activity than lavender oils. Inhalation at a dose of 0.5 mL decreased locomotion by 68.62%, while the doses of 0.1 mL and 0.3 mL inhibited locomotion by 62.81% and 65.33%, respectively [8]. In this study, we have investigated the effect of essential oils of four Indonesian spices, basil (Ocimum formacitratum), lemongrass (Cymbopogon citratus.), ki lemo (Litcea cubeba L.) and laja gowah (Alpinia malaccencis Roxb.) on locomotor activity in mice.
In the West Java region of Indonesia, basil is used as a salad and seasoning in chicken steam processing and lemongrass, which has strong fragrance, is commonly used to reduce fishy smells in food processing. Ki lemo barks are used as a flavor enhancer in soup by the Sudanese people in West Java, whereas laja gowa, which is usually applied as spice in meat processing, is also widely used as a traditional antiemetic medicine. In addition the essential oils of the four spices are commonly used in aromatherapy as massage oils or by inhalation [9]. In Europe and the US [10,11], basil leaf oils are commercialized as aromatherapeutic materials and the citronella oil of lemongrass is also used in aromatherapy. Thesse properties led us to investigate those four essential oils for their pharmacological activity and active components.
As in our previous study the essential oil of nutmeg seeds caused inhibition of locomotor activity [8], this investigation has been conducted to examine the inhibitory effects of the essential oils of the four spices, basil, lemongrass, ki lemo, and laja gowah, on locomotor activity in mice and identify the active component(s) that might be responsible for that activity. The essential oils were administered by inhalation at doses of 0.1, 0.3, and 0.5 mL/cage and the effect on locomotor activity was observed using a rotatory wheel cage method. The plasma concentrations of essential oil compounds were measured by off-line SPE and GC-MS.
2. Results and Discussion
2.1. Composition of Essential Oils
Essential oil of basil leaves contained a high content of geranial (19.3%) and linalool (8.17%) and that of lemongrass had α-citral (32.70%), β-citral (28.99%), linalool (1.6%), citronellal (0.65%) and methyl cinnamate (0.23 %). In the essential oil of ki lemo bark, 1.8-cineole (26.59%) and citonellol (21.69%) were the major components, whereas in that of laja gowah rhizomes, methyl cinnamate (64.4%), α-pinene (14.95%), β-pinene (12.44%) and 1,8-cineole (9.89%) were identified as the compounds with the highest levels.
2.2. Locomotor Activity of Mice after Inhalation of Essential Oils
In this study, the effect of essential oils of four Indonesian spices on locomotor activity in mice was compared with that caused by lavender oil. The latter was used as a positive control because it is reported to reduce the locomotor activity of female and male laboratory animals [4]. The locomotor activity data are shown in Table 1. As may be seen, in general the four essential oils have a significant locomotor inhibitory activity compared to control. Inhalation of basil leaves and lemongrass essential oils decreased mice locomotor activity in a dose-dependent manner, contrary to the effect seen with the other two oils. The essential oil of basil leaves at doses of 0.1, 0.3, and 0.5 mL decreased locomotor activity by 50.48, 55.33 and 58.36%, respectively, and that of lemongrass at the same doses caused a locomotor activity decreases of 45.21, 50.99 and 66.66%, respectively. These dose-dependent effects might be due to higher concentrations of active components in the higher doses. On the other hand, the ki lemo bark oil showed strong but not dose-dependent inhibitory effects, in that the dose of 0.3 mL had a lower effect (54.97%) than that of 0.1 (58.16%) and 0.5 mL (61.41%). Strange results were observed with the effect of the laja gowah rhizome oil, whereby increasing the doses decreased the inhibitory effect. A 0.1 mL dose gave the highest effect on locomotor activity and it might be the most effective dose for the tested oil.
2.3. Application SPE-GC/MS for Analysis of Lead Compounds in Blood Plasma of Mice after Inhalation of Essential Oils of Spices
In our previous study [8], we successfully applied SPE methods to isolate volatile compounds from blood plasma before detection and quantification of the compounds by GC-MS.
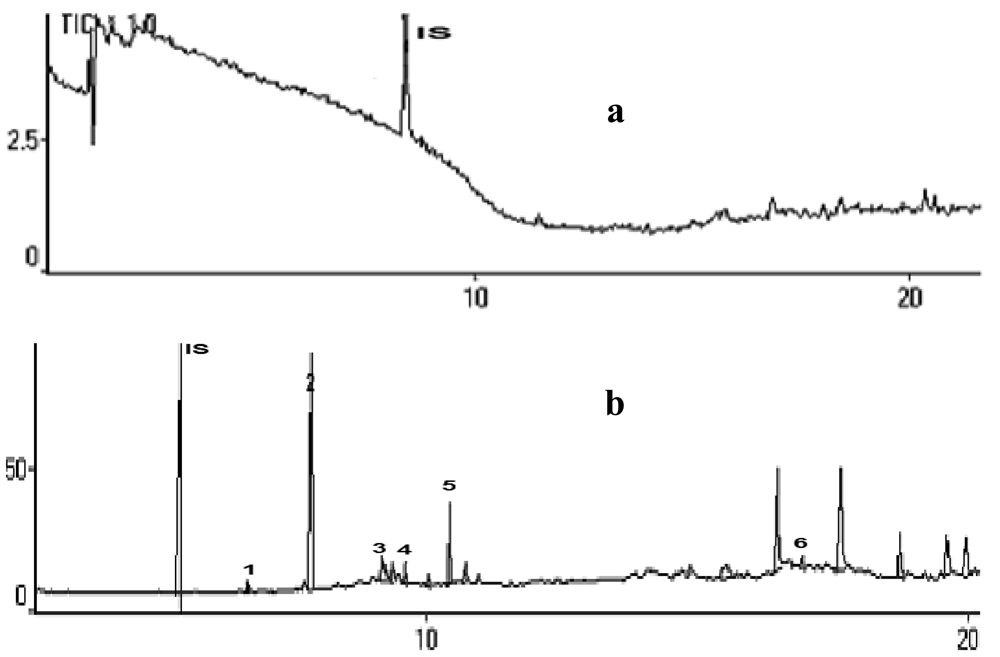
A mixture of methanol and water (60:40) was used for sample preparation to reduce solvent volume and time. The recovery of this analysis was increased to 90%. This method also increased reproducibility and recovery from the matrix and reduced interferences from the blood plasma matrix, as shown in Figure 1.
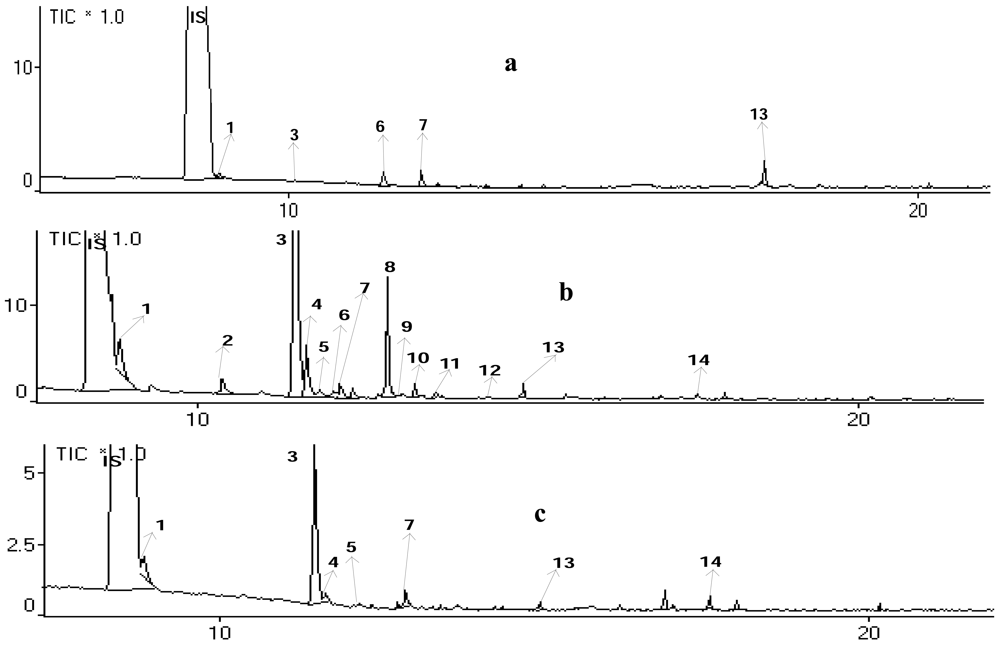
In addition, reproducibility was shown consistently on replication of the analysis in which the retention times of each interesting compound were very similar. Figure 2 shows that three chromatograms generated by different treatments of blood samples gave the same ion chromatogram pattern after inhalation of ki lemo bark oils, and many volatile compounds could be detected. Compounds identified in blood plasma with high bioavailability after 30 to 120 min of exposure might be active compounds responsible for the observed locomotor effects and thus they might be interesting lead compounds [6].
2.3.1. Basil leaf essential oil compounds detected in mice blood plasma after different inhalation durations
As shown in Table 2, compounds were identified in blood plasma after one and 2 h inhalation of essential oils of basil leaves. The main compounds identified were linalool, linalyl acetate, 4-terpineole and α-terpineol. They have been proven to show anxiolytic, anticonvulsant and sedative activity [6,12-15].
2.3.2. Lemongrass herb essential oil compounds detected in mice blood plasma after different inhalation durations
Citronellal was a dominant compound in the blood plasma of mice after inhalation of essential oils of lemongrass herbs, as seen in Table 3, although in this oil the content of citronellal and methyl cinnamate is small.
This fact might be connected with the previous findings that the oils are absorbed into the blood through the lungs or skin, and citronellal at low concentrations (10 and 30 pM) potentiates the response in the presence of GABA, because they probably bind to the site of action in GABAA receptors and they have high affinity for the GABAA receptor [13].
2.3.3. Laja gowa rhizome essential oil compounds detected in mice blood plasma after different inhalation durations
As shown in Table 4, the compounds 1,8-cineole and methyl cinnamate were found at very high concentrations in blood plasma after one and 2 h inhalation. However, α and β-pinenes, known as the major components in the essential oils of laja gowa rhizomes, were strangely not detected.
2.3.4. Ki lemo bark essential oil compounds detected in mice blood plasma after different inhalation durations
Citronelol, citronellal, α-terpineol, and 1.8-cineole were identified in blood plasma of mice after inhalation of ki lemo bark essential oil (Figure 3 and Table 5).
These results were in accordance with the previous study [13]. The mixture of 4-terpineol and cineole or citral give greater potentiation than that of citral, cineole, or butanol, but less than that caused by 4-terpineol [13,17]. Figure 2 shows that peaks no. 1 (1,8-cineole), 3 (citronellal), 7 (α-terpineol), and 8 (citronelol) appeared in the ½, 1 and 2 h inhalations. The level of those compounds in blood plasma was higher after 1-hour inhalation as compared with that after ½ and 2 h inhalation.
2.4. Locomotor Activity Effects of Single Identified Compounds in Mice
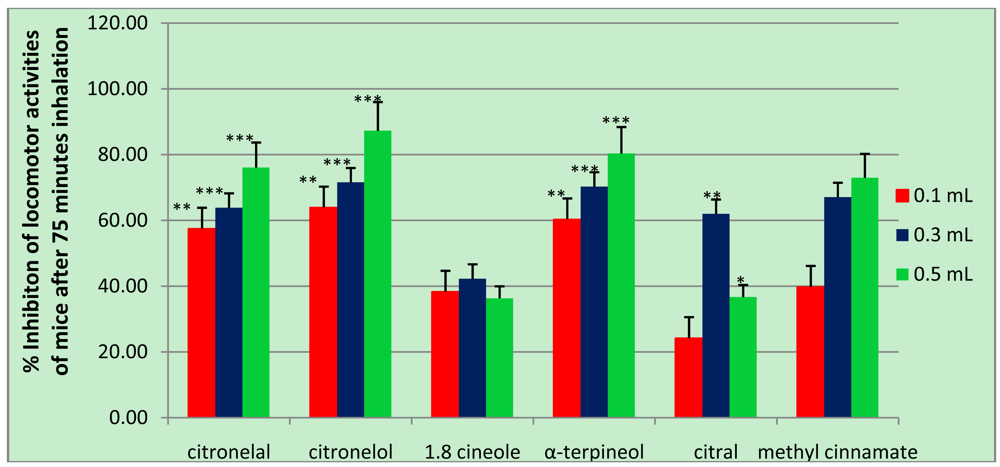
The dominant compounds, 1,8-cineole, α-terpineol, citronelol, citronelal, and methyl cinnamate were thought to have a role in inhibiting locomotor activity, thus, they we sought to examine them individually for their activity in mice. These compounds were all detected in more than one essential oil and at a concentration of more than 1 μg/mL. In this study, not all compounds identified in the four spices were tested for their activity, and 4-terpineol, for example, was not examined because it was already known to have up to 79% inhibitory activity on locomotion in mice [8]. For the examination of methyl cinnamate, 70% ethanol was used as control since methyl cinnamate was dissolved in 70% ethanol. As shown in Table 6 and Figure 3, all compounds tested significantly inhibited locomotor activity in mice in a dose-dependent manner, except 1.8 cineole and citral. Among them, citronelol gave the highest effect followed by α-terpineol, citronelal, and methyl cinnamate. Other two compounds, 1.8 cineole and citral, showed optimal inhibition at a dose of 0.3 mL, but for 1.8 cineole, the effects of its three doses were not significantly different according to ANOVA and Duncan post hoc test analysis.
These results suggest that all compounds might be responsible for the inhibitory activity on locomotor caused by the four spices tested. In the basil sample, α-terpineol and 1.8 cineole were thought to cause inhibition in locomotor activity in addition to 4-terpineol, as reported [8]. In the other three spices, the compounds responsible for the inhibitory activity might be citronelal, methyl cinnamate, and citral for lemongrass, citronelol, citronelal, and 1.8 cineole for ki lemo, and methyl cinnamate and 1.8 cineole for laja gowa. This assumption was based on the fact that those active compounds were contained in the corresponding spice plant. However, other compounds present in the four spice plants probably have the inhibitory activity because as mentioned above, that not all compounds contained in the four spice plants were tested for the activity. This study reported that the volatile compounds detected in blood samples might be related to the observed depressed locomotor activity in mice. This hypothesis was supported by the facts that depressed locomotor activity caused by essential oil is due, at least in part, to a direct pharmacological action of one or more of its constituents [8,13].
3. Experimental
3.1. Materials
Spice materials: The plant materials used were basil leaves (Ocimum formacitratum L.) obtained from the Cileunyi traditional market, lemongrass herbs (Cymbopogon citratus L.) and laja gowah (Alpinia malaccencis Roxb.) rhizome from Tanjungkerta, Sumedang, and ki lemo (Litcea cubeba L.) bark from Lembang, West Java. Specimens were identified by the Herbarium Laboratory, Department of Biology, Faculty of Mathematical and Natural Sciences of Universitas Padjadjaran and voucher specimens are deposited at the Herbarium of the Department of Biology of the Faculty of Mathematic and Natural Sciences, Universitas Padjadjaran.
Animals: Male mice weighing 25 to 30 g and 2 to 3 months old were used. The mice were adapted for one week to the laboratory in which locomotor activity experiments were conducted and were selected for wheel rotations of between 150 to 300 rpm before the experiments were started.
Chemicals—Methanol puriss. p.a. (Merck) was used as eluent for SPE. Heparin tubes (Boehringer) were used for blood collection. Pure lavender (Lavandula officinalis) oils were obtained from Martina Bertho. C8-C20, C21-C40 alkane standards, 1,4-dichlorobenzene and methyl cinnamate were obtained from Sigma. Citronelal, citronelol, 1,8-cineole, and α-terpineole were purchased from Dragoco.
3.2. Methods
3.2.1. Isolation of essential oils
Dried samples of each plant (500 g) were submitted to water-distillation in Monaco Lembang, West Java, for 3 h to isolate the essential oils. The oils were stored at −20 °C after the addition of sodium sulphate. Essential oils of basil leaves, herbal lemongrass, laja gowah rhizome, and ki lemo bark were obtained at 0.07%, 0.94%, 1.22%, and 1% yield, respectively.
3.2.2. Mouse locomotor activity tests
Locomotor activity of mice was measured using a wheel cage, in which mice ran and the number of rotations was recorded by a meter. Cage inhalators contained a glass fiber (20 cm × 20 cm × 30 cm) and were equipped with an electric fan for the evaporation and distribution of volatile compounds. The mice were selected by weight (25 to 30 g) and by their ability to rotate the wheel cage up to 300 times in 30 min; eligible mice were then divided into three groups: a control group, a lavender oil group as positive control group (using 0.1, 0.3, and 0.5 mL/cage), and a essential oils tested as treatment group (using 0.1, 0.3, and 0.5 mL/cage). The application of the doses were based on the preliminary examination in which those doses were reasonable to be used and based on Kovar et al. [5]. Each group consisting of five mice was tested three separate times. After 30 min of inhalation, the mice were placed into the wheel cage and after 5 min; the number of rotations was recorded for 75 min in 15-minute intervals.
3.2.3. GC/MS analysis
Analyses have been done according to a previously published method [8]. Measurements were performed using a Shimadzu QP-5050A gas chromatograph coupled to a VG Autospec Mass Spectrometer at 70 eV, 40–550 amu with a fused silica capillary column (DB-5MS, 30 m × 0.25 mm) using helium as a carrier gas and with temperature programming from 60 °C/5 min to 300 °C/min (10 °C/min) for blood plasma and 60 °C/5 min to 300 °C/2 min (10 °C/min) for essential oils. The MS was operated using an interface temperature of 240 °C, and an electron impact ionization of 70 eV with a scan mass range of 40–350 m/z (sampling rate of 1.0 scan/s).
3.2.4. Qualitative analysis
Identification of the compounds was conducted by comparing their linear retention indices (LRI) with literature values and their mass spectral data with those from the MS data system (Wiley-229 lib, Nist-62 library and Nist-12 library) [16]. Linear retention indices were calculated using GC data of a homologous series of saturated aliphatic hydrocarbons (C8 to C40) separated on the same column using the same conditions as for GC analysis of the essential oils and the blood samples. The blood samples were collected from the corner parts of the eyes using capillary tubes and placed in a heparin tube. Blood samples were collected immediately after the mice inhaled the essential oil for a period of ½, 1 or 2 h.
3.2.5. Quantitative analysis
Detailed analysis was performed using a modification of the methods in [5] and [18,19]. The blood samples (500 to 600 μL), obtained according to Jirovetz [18], were centrifuged (1,800 rpm/10 min) at room temperature and concentrated on a C18-column (100 mg). Volatile compounds were separated using a mobile phase of the mixture of methanol—bidistilled water (60:40). Five microlitres re-injected into the GC-MS. Quantification of the volatile compounds in the blood samples was accomplished using 1,4-dichlorobenzene 0.5% (500 μL) as an internal standard as according to the following [8] equation:
where: C = concentration (g/g); IS = GC peak area of Internal Standard; A = GC peak area of compounds of essential oils; % EO = yield of essential oils.
3.2.6. Statistical analyses
All locomotor activity test data are presented as mean ± S.E.M. Data were analyzed by ANOVA followed by Duncan post hoc test. Results were considered significant at p < 0.05. Data were analyzed using MINITAB® 13.5 software.


| Average Numbers of Locomotors ± SDa | % Inhibitory effect | |||||||
|---|---|---|---|---|---|---|---|---|
| Minutes | ||||||||
| 0–15 | 15–30 | 30–45 | 45–60 | 60–75 | Average | |||
| Controls | 0 | 280.4 ± 20.5 | 294.4 ± 4.3 | 311.4 ± 17.2 | 303.4 ± 14.6 | 297.4 ± 9.7 | 1,487 | 0 |
| Lavender oils | 0.1 | 217.6 ± 18.1 | 200.4 ± 12.3 | 195.6 ± 9.6 | 197.4 ± 7.9 | 193.2 ± 11.9 | 1,003.8 | 31.14 * |
| Basil leaf oils | 0.1 | 171.8 ± 53.3 | 151.2 ± 39.6 | 150.6 ± 52.2 | 130.4 ± 11.2 | 145.0 ± 42.8 | 749 | 49.63 * |
| Ki lemo bark oils | 0.1 | 129.0 ± 5.7 | 134.4 ± 9.7 | 132 ± 23.7 | 122 ± 19.7 | 115.4 ± 8.7 | 632.8 | 57.44 *** |
| Lemongrass herb oils | 0.1 | 166.1 ± 20.3 | 187.3 ± 22.5 | 161.5 ± 18.9 | 177.6 ± 22.4 | 136.1 ± 27.4 | 828.6 | 55.72 ** |
| Laja gowah rhizome oils | 0.1 | 180.4 ± 24.8 | 174.3 ± 33.2 | 157.2 ± 29.7 | 146.8 ± 34.7 | 128.0 ± 22.9 | 786.7 | 47.09 ** |
*F6,35 = 3.15 P < 0.05, as compared with the contol treatment. (by ANOVA followed by Duncan post hoc test);**F6,35 = 6.05 P < 0.01, as compared with the contol treatment. (by ANOVA followed by Duncan post hoc test);***F6,35 = 14.26 P < 0.001, as compared with the contol treatment. (by ANOVA followed by Duncan post hoc test).
| ½ h (Rc = 80 %) | 1 hr (R c = 88 %) | 2 hr (R c = 88 %) | ||||||
|---|---|---|---|---|---|---|---|---|
| LRI Exp b | Conc. μg/mL | LRI Eksp b | Conc. μg/mL | LRI Eksp b | Conc. μg/mL | |||
| 1. | 1,8-Cineole | nd | nd | 1,035 | 0.8 | nd | nd | 1,033 |
| 2. | Linalool | nd | nd | 1,090 | 25.8 | 1,090 | 5.9 | 1,098 |
| 3. | Borneol | nd | nd | 1,159 | 2.1 | nd | nd | 1,156 |
| 4. | 4-Terpineol | nd | nd | 1,166 | 3.9 | 1,165 | 1.9 | 1,177 |
| 5. | α-Terpimeol | nd | nd | 1,178 | 2.6 | 1,178 | 1.3 | 1,189 |
| 6. | Linalyl acetate | nd | nd | 1,216 | 9.6 | 1,216 | 0.6 | 1,257 |
| 7. | α-Humulene | nd | nd | nd | nd | 1,446 | 2.2 | 1,454 |
nd = not detected;aLRI reference in Adams [16] with a DB5 column;bLRI experiment with DB5-MS column;cRecovery (n = 2) was calculated on the basis of comparison between 1,4-dichlorobenzene (methanol diluted) in blood plasma and 1,4-dichlorobenzene in methanol only.
| No. | Name | LRI Exp b | Inhalation concentration (μg/mL) | LRI References a | ||
|---|---|---|---|---|---|---|
| ½ h (Rc = 82%) | 1 hr (Rc = 87%) | 2 hr (Rc = 90%) | ||||
| 1. | Linalool | 1,098 | nd | 8.7 | 3.4 | 1,098 |
| 2. | Citronellal | 1,153 | nd | 122.5 | 8.9 | 1,156 |
| 3. | Citral | 1,238 | nd | 4.7 | 4.6 | 1,240 |
| 4. | Methyl cinnamate | 1,388 | nd | 11.5 | 3.2 | 1,379 |
nd = not detected;aLRI reference in Adams [16] with DB5 column;bLRI experiment with DB5-MS column;cRecovery (n = 2) was calculated on the basis of comparison between 1,4-dichlorobenzene (methanol diluted) in blood plasma and 1,4-dichlorobenzene in methanol only.
| No. | Name | LRI Exp b | Concentration (μg/mL) | LRI References a | ||
|---|---|---|---|---|---|---|
| ½ h (R c = 83%) | 1 hr (R c = 85%) | 2 hr (R c = 83%) | ||||
| 1. | 1,8-Cineole | 1,033 | nd | 122.5 | 8.9 | 1.156 |
| 2. | Methyl cinnamate | 1,376 | nd | 140.5 | 98.9 | 1.379 |
| 3. | Methyl hexadecanoate | 1,779 | nd | nd | 0.09 | 1.961 |
| 4. | Methyl octadecanoate | 2,049 | nd | 0.69 | 0.90 | 2.200 |
nd = no detected;aLRI reference in Adams [16] with DB5 column;bLRI experiment with DB5-MS column;cRecovery (n = 2) was calculated on the basis of comparison between 1,4-dichlorobenzene (methanol diluted) in blood plasma and 1,4-dichlorobenzene in methanol only.
| No. | Name | LRI Exp b | Concentration (μg/mL) | LRI References a | ||
|---|---|---|---|---|---|---|
| ½ h (R c = 82%) | Referencesa | 2 hr(R c = 83%) | ||||
| 1. | 1,8-Cineole | 1,032 | 5.5 | 59.9 | 14.3 | 1,033 |
| 2. | Linalool | 1,098 | nd | 10.4 | nd | 1,098 |
| 3. | Citronellal | 1,153 | 14.9 | 39.3 | 37.1 | 1,156 |
| 4. | neo-Isopulegol | 1,161 | nd | 35.6 | nd | 1,145 |
| 5. | Isopulegol | 1,171 | nd | 6.9 | 0.5 | 1,146 |
| 6. | 4-Terpineol | 1,180 | nd | 4.2 | nd | 1,181 |
| 7. | α-Terpineol | 1,196 | 8.1 | 5.6 | nd | 1,189 |
| 8. | Citronellol | 1,225 | 22.3 | 53.1 | 33.8 | 1,228 |
| 9. | Neral | 1,238 | nd | 4.7 | nd | 1,240 |
| 10. | Linalyl acetate | 1,246 | nd | 1.5 | nd | 1,257 |
| 11. | Nerol | 1,249 | nd | 6.5 | nd | 1,228 |
| 12. | Geranial | 1,267 | nd | 2.9 | nd | 1,270 |
| 13. | β-Terpenyl acetate | 1,347 | nd | 5.7 | 0.9 | 1,350 |
| 14. | (E)-Caryophylene | 1,427 | nd | 1.0 | 0.6 | 1,418 |
nd = not detected,aLRI reference in Adams [16] with DB5 column,bLRI experiment with DB5-MS column,cRecovery (n = 2) was calculated on the basis of comparison between 1,4-dichlorobenzene (methanol diluted) in blood plasma and 1,4-dichlorobenzene in methanol only.
| Treatment | Doses (mL) | Mean Instead of Number of Average (minutes) | Inhibitory Effect (%) | ||||||
|---|---|---|---|---|---|---|---|---|---|
| 0–15 | 15–30 | 30–45 | 45–60 | 60–75 | 75–90 | Total Number | |||
| Normal control | Control | 373.2 ± 41.2 | 387.5 ± 32.3 | 253.5 ± 22.5 | 302.4 ± 38.5 | 213.2 ± 28.6 | 255.46 ± 19.34 | 1785.26 | 0 |
| 0.1 mL | 134.5 ± 12.1 | 128.9 ± 17.6 | 123.4 ± 19.6 | 130.5 ± 11.2 | 123.6 ± 12.4 | 118.4 ± 15.4 | 759.30 | 57.47 ** | |
| Citronelal | 0.3 mL | 120.3 ± 9.5 | 120.4 ± 15.4 | 118.3 ± 12.7 | 107.4 ± 16.4 | 88.9 ± 13.2 | 90.2 ± 13.0 | 645.50 | 63.84 *** |
| 0.5 mL | 110.2 ± 8.9 | 118.9 ± 9.1 | 67.1 ± 15.6 | 70.2 ± 7.5 | 40.6 ± 7.2 | 20.2 ± 3.2 | 427.20 | 76.07 *** | |
| 0.1 mL | 119.2 ±29.8 | 115.4 ± 35.7 | 118.7 ± 25.7 | 102.3 ± 20.1 | 89.7 ± 18.6 | 99.3 ± 10.8 | 644.60 | 63.89 ** | |
| Citronelol | 0.3 mL | 100.3 ±10.5 | 98.9 ± 26.3 | 83.2 ± 14.4 | 90.2 ± 18.5 | 78.8 ± 16.1 | 56.3 ± 15.8 | 507.70 | 71.56 *** |
| 0.5 mL | 57.2 ±8.8 | 48.6 ± 7.6 | 50.3 ± 7.5 | 32.2 ± 7.5 | 18.9 ± 4.8 | 20.2 ± 1.3 | 227.40 | 87.26 *** | |
| 0.1 mL | 223.2 ±27.6 | 189.2 ± 24.3 | 190.3 ± 29.8 | 180.7 ± 35.1 | 157.5 ± 26.4 | 160.6 ± 22.3 | 1101.50 | 38.30 * | |
| 1.8-Cineole | 0.3 mL | 200.2 ± 31.18 | 180.5 ± 27.5 | 167.8 ± 26.22 | 207.5 ± 12.2 | 144.3 ± 11.8 | 130.2 ± 16.54 | 1030.50 | 42.28 * |
| 0.5 mL | 192.7 ± 34.8 | 187.8 ± 35.7 | 188.4 ± 36.8 | 179.4 ± 32.1 | 190.1 ± 31.3 | 198.7 ± 34.4 | 1137.10 | 36.31 * | |
| 0.1 mL | 120.3 ± 33.55 | 128.7 ± 23.4 | 119.8 ± 22.8 | 112.8 ± 32.3 | 117.7 ± 22.1 | 109.5 ± 32.32 | 708.80 | 60.30 ** | |
| α-Terpineol | 0.3 mL | 111.1 ± 11.2 | 98.8 ± 17.2 | 88.6 ± 12.7 | 99.2 ± 12.8 | 76.8 ± 18.1 | 56.2 ± 17.4 | 530.70 | 70.27 *** |
| 0.5 mL | 99.8 ± 9.7 | 78.6 ± 12.5 | 60.4 ± 18.4 | 43.4 ± 12.7 | 38.7 ± 8.6 | 30.1 ± 6.8 | 351.00 | 80.34 *** | |
| 0.1 mL | 289.4 ± 38.5 | 300.8 ± 32.4 | 240.3 ± 42.1 | 196.1 ± 36.3 | 176.4 ± 29.8 | 150.4 ± 31.3 | 1353.40 | 24.19 | |
| Citral | 0.3 mL | 208.6 ± 31.18 | 108.2 ± 27.5 | 100.81 ± 26.22 | 96.6 ± 12.2 | 90.2 ± 11.8 | 74.1 ± 16.54 | 678.51 | 61.99 ** |
| 0.5 mL | 222.3 ± 31.18 | 220.4 ± 27.5 | 199.3 ± 26.22 | 200.3 ± 12.2 | 187.5 ± 11.8 | 100.6 ± 16.54 | 1130.40 | 36.68* | |
| 70 %ethanol as control | 0.1 mL | 292.2 ± 38.4 | 280.9 ± 37.2 | 300.2 ± 35.4 | 302.9 ± 36.5 | 280.4 ± 32.8 | 285.4 ± 34.1 | 1742.00 | 0 |
| 0.3 mL | 300.2 ± 38.1 | 304.4 ± 39.5 | 289.2 ± 35.5 | 290.8 ± 35.4 | 288.7 ± 30.8 | 302.3 ± 29.9 | 1775.60 | 0 | |
| 0.5 mL | 311.2 ± 32.1 | 296.5 ± 38.7 | 296.3 ± 30.20 | 311.2 ± 32.5 | 300.2 ± 33.1 | 301.4 ± 35.6 | 1816.80 | 0 | |
| Methyl cinnamate | 0.1 mL | 250.2 ± 38.22 | 200.1 ± 33.4 | 180.7 ± 32.3 | 165.4 ± 25.5 | 120.5 ± 32.2 | 132.2 ± 37.5 | 1049.10 | 39.78 * |
| 0.3 mL | 120.4 ± 28.8 | 100.2 ± 29.2 | 111.1 ± 25.7 | 98.8 ± 14.4 | 86.7 ± 10.6 | 67.4 ± 9.4 | 584.60 | 67.08 ** | |
| 0.5 mL | 98.6 ± 31.18 | 99.8 ± 27.5 | 90.7 ± 26.22 | 90.1 ± 12.2 | 67.7 ± 11.8 | 44.4 ± 16.54 | 491.30 | 72.96 *** | |
*F6,35 = 3.30 P < 0.05, as compared with the contol treatment. (by ANOVA followed by Duncan post hoc test).**F6,35 = 14.10 P < 0.01, as compared with the contol treatment. (by ANOVA followed by Duncan post hoc test).***F6,35= 26.10 P < 0.001, as compared with the contol treatment. (by ANOVA followed by Duncan post hoc test).
Acknowledgements
We gratefully acknowledge the Rector of Universitas Padjadjaran and the Indonesian Ministry of National Education for funding this work through the LITSAR 2004 and DIKS 2005 research grant, and Gerhard Buchbauer, M. Phil and L. Jirovetz, M. Phil of the Institute Pharmaceutical Chemistry of Vienna University for the gift of their paper and methods related to this research.
References
- Buckle, J. Use of aromatherapy as a complementary treatment for chronic pain. Altern. Ther. Health Med. 1999, 5, 42–51. [Google Scholar]
- Diego, M.A.; Jones, N.A.; Field, T.; Hernandez-Reif, M.; Schanberg, S.; Kuhn, C.; McAdam, V.; Galamaga, R.; Galamaga, M. Aromatherapy positively affects mood, EEG patterns of alertness and math computations. Int. J. Neurosci. 1998, 96, 217–224. [Google Scholar]
- Martin, G.N. Human electroencephalographic (EEG) response to olfactory stimulation: Two experiments using the aroma of food. Int. J. Psychophysiol. 1998, 30, 287–302. [Google Scholar]
- Buchbauer, G.; Jirovetz, L.; Jager, W.; Dietrich, H.; Plank, C. Aromatherapy: Evidence for sedative effects of the essential oil of lavender after inhalation. Z Naturforsch. C 1991, 46, 1067–1072. [Google Scholar]
- Kovar, K.A.; Gropper, B.; Friess, D.; Ammon, H.P. Blood levels of 1,8-cineole and locomotor activity of mice after inhalation and oral administration of rosemary oil. Planta Med. 1987, 53, 315–318. [Google Scholar]
- Buchbauer, G.; Jirovetz, L.; Jager, W.; Plank, C.; Dietrich, H. Fragrance compounds and essential oils with sedative effects upon inhalation. J. Pharm. Sci. 1993, 82, 660–664. [Google Scholar]
- Sangat, H.; Roematyo. Aromatherapy Plants: A Etnopharmacology Study; Gandawidjaja, D., Panggabean, G., Wahjoedi, B., Mustafa, A., Hadad, E.A.M., Eds.; Pusat Penelitian dan Pengembangan Biologi: Bogor, Indonesia, 1995; pp. 679–683. [Google Scholar]
- Muchtaridi; Subarnas, A.; Apriyantono, A.; Mustarichie, R. Identification of compounds in the essential oil of nutmeg seeds (Myristica fragrans Houtt.) that inhibit locomotor activity in mice. Int. J. Mol. Sci. 2010, 11, 4771–4781. [Google Scholar]
- Oyen, L.P.A.; Nguyen, X.D. Plant Resources of South-East Asia; LIPI Press: Bogor, Indonesia, 1999; Volume 19, pp. 61–63. [Google Scholar]
- Zheljazkov, V.D.; Callahan, A.; Cantrell, C.L. Yield and oil composition of 38 basil (Ocimum basilicum L.) accessions grown in Mississippi. J. Agric. Food Chem. 2008, 56, 241–245. [Google Scholar]
- Simon, J.E.; Morales, M.R.; Phippen, W.B.; Vieira, R.F.; Hao, Z. Basil: A source of aroma compounds and popular culinary and ornamental herb. In Perspectives on New Crops and New Uses; Janck, J.S., J., E., Eds.; ASHS Press: Alexandria, VA, USA, 1999; pp. 499–505. [Google Scholar]
- Buchbauer, G. On the biological properties of fragrance compounds and essential oils. Wien. Med. Wochenschr. 2004, 154, 539–547. [Google Scholar]
- Aoshima, H.; Hamamoto, K. Potentiation of GABAA receptors expressed in Xenopus oocytes by perfume and phytoncid. Biosci. Biotechnol. Biochem. 1999, 63, 743–748. [Google Scholar]
- Ilmberger, J.; Heuberger, E.; Mahrhofer, C.; Dessovic, H.; Kowarik, D.; Buchbauer, G. The influence of essential oils on human attention. I: Alertness. Chem. Senses 2001, 26, 239–245. [Google Scholar]
- Gomes, P.B.; Feitosa, M.L.; Silva, M.I.; Noronha, E.C.; Moura, B.A.; Venancio, E.T.; Rios, E.R.; de Sousa, D.P.; de Vasconcelos, S.M.; Fonteles, M.M.; de Sousa, F.C. Anxiolytic-like effect of the monoterpene 1,4-cineole in mice. Pharmacol. Biochem. Behav. 2010, 96, 287–293. [Google Scholar]
- Adams, R.P. Identification of Essential Oil Components by Gas Chromatography/Mass Spectroscopy; Allured Publishing Corporation: Carol Stream, IL, USA, 1995. [Google Scholar]
- Hossain, S.J.; Hamamoto, K.; Aoshima, H.; Hara, Y. Effects of tea components on the response of GABA(A) receptors expressed in Xenopus Oocytes. J. Agric. Food Chem. 2002, 50, 3954–3960. [Google Scholar]
- Jirovetz, L.; Buchbauer, G.; Jager, W.; Woidich, A.; Nikiforov, A. Analysis of fragrance compounds in blood samples of mice by gas chromatography, mass spectrometry, GC/FTIR and GC/AES after inhalation of sandalwood oil. Biomed. Chromatogr. 1992, 6, 133–134. [Google Scholar]
- Jirovetz, L.; Jager, W.; Buchbauer, G.; Nikiforov, A.; Raverdino, V. Investigations of animal blood samples after fragrance drug inhalation by gas chromatography/mass spectrometry with chemical ionization and selected ion monitoring. Biol. Mass. Spectrom. 1991, 20, 801–803. [Google Scholar]
© 2011 by the authors; licensee MDPI, Basel, Switzerland. This article is an open access article distributed under the terms and conditions of the Creative Commons Attribution license (http://creativecommons.org/licenses/by/3.0/).
Share and Cite
Muchtaridi; Diantini, A.; Subarnas, A. Analysis of Indonesian Spice Essential Oil Compounds That Inhibit Locomotor Activity in Mice. Pharmaceuticals 2011, 4, 590-602. https://doi.org/10.3390/ph4040590
Muchtaridi, Diantini A, Subarnas A. Analysis of Indonesian Spice Essential Oil Compounds That Inhibit Locomotor Activity in Mice. Pharmaceuticals. 2011; 4(4):590-602. https://doi.org/10.3390/ph4040590
Chicago/Turabian StyleMuchtaridi, Adjeng Diantini, and Anas Subarnas. 2011. "Analysis of Indonesian Spice Essential Oil Compounds That Inhibit Locomotor Activity in Mice" Pharmaceuticals 4, no. 4: 590-602. https://doi.org/10.3390/ph4040590