3D Digital Surveying and Modelling of Cave Geometry: Application to Paleolithic Rock Art

 ,
,  ,
, 
Abstract
:1. Introduction
1.1. Archaeologists' Needs and Requirements
- First, the acquired information can be integrated with digital images taken from terrestrial, aerial or satellite platforms, in order to effectively support the investigation and the location of those archaeological sites which are partially known and of those which have been not yet discovered.
- Second, archaeological findings can be represented and geo-referenced in a spatial context according to their dimensions (for example, an open gallery, a chamber with elevated walls, a complex panel with convex and concave shapes, etc).
- Third, the three-dimensional character of the acquired dataset provides new elements of artistic interpretation through the three-dimensional analysis of the archaeologist.
- Fourth, digital documentation allows for a more effective and wider dissemination of the results obtained in different archaeological campaigns, thanks to the improvements in representation and visualisation capabilities related to the generation of photorealistic models and virtual animations.
1.2. From Classical Techniques to New Technologies: Previous Work
- Topographic methods. Topographic work in subterranean sites [2] has been limited until lately. Methods based on angles, distances and height variations measurements are really useful in the caves and karst studies when possible. The equipment used is composed of accurate and appropriate theodolites or total stations. When the point to be determined is inaccessible indirect methods such as single or multiple intersections are used [3]. New developments have been incorporated into total stations, such as the measurement of distances without reflector element by means of laser rays, reducing the fieldwork considerably. However, the morphologic complexity of caves not only affects the data acquisition, but also the way these datasets are represented, usually with simple cross-sections and ground plans. As a result, the documentation of caves was usually performed with expeditious methods such as: compass, clinometers, tap measure and supported by the use of a specific symbology.
- Terrestrial photogrammetric methods. By correcting images from lens and perspective distortions, photogrammetry allows to extract accurate measurements from photographs. A scaled drawing or 3D model can then be made on the computer directly from the corrected images. In this context, photogrammetrists have developed several approaches to record rock art in 3D: from the classical techniques based on stereoscopic vision to multiple image-based modelling supported by bundle adjustment. Nevertheless, although the acquisition of digital images remains a universal and low-cost alternative, particularly for simple recording and qualitative use, the extraction of quantitative data from photographs is less common in the rock art framework where the fieldwork conditions are very specific and the geometry presents great complexity, requiring time, skill and knowledge related to photogrammetry. Trying to improve this last drawback, [4] present a low-cost methodology that enables to generate both accurate and dense DEMs and orthophotographs by non-expert in photogrammetry. These data are able to record detailed morphology, generate three dimensional visualizations and the ubiquitous fly through model. The methodology was developed and tested using a series of case studies, representing a diverse selection of aboriginal rock art. On the other hand, in a series of related projects [5] and [6], Ogleby and Rivett demonstrated the benefits of photogrammetry for recording rock art, particularly pictographs. Fieldwork was conducted at a series of sites around Australia and their “Handbook of Photogrammetry” was a key text of its day describing how to perform a photogrammetric survey in archaeological field. Afterwards, [7] has continued to demonstrate the benefits of photogrammetry to a wider archaeological audience including the Ayutthaya temple in Thailand and the Olympiad. In these two examples, an important final product has been the virtual model, enabling the visualization of the site from any perspective.
- Laser scanning methods. In the last years, the emergence of the Terrestrial Laser Scanner (TLS) as an effective surveying technology has opened up new perspectives for the recording and 3D reconstruction of rock art, as well as a multidisciplinary framework in which professionals and researchers with a different background have the opportunity to take part. Based on laser technology, TLS systems allow to perform dense and accurate measurements of real objects in very short time, producing the well known “pointcloud”. Two different principles for distance measurement are in use: ranging lasers using the “time-of-flight” or “phase measurement” principle, and instruments using CCD cameras where distance measurement is based on the principle of “triangulation”. The time-of-flight scanners base their ranging measurement determining the time-of-flight of a light pulse, i.e., by measuring the travelling time between the emitted and received pulse. The phase measurement scanners base their ranging principle measuring the phase difference between the transmitted and the received signal backscattered from the object surface. This method is applied with lasers that continuously emit light. Ranging scanners are able to measure much longer distances than instruments that work by triangulation. They are, however, less accurate and especially so at close range. The accuracy is between one millimetre and two or three centimetres, depending to some extent on the distance between the object and the scanner. This ranging accuracy is a key parameter. According to time-o-flight scanners, ranging accuracy basically depends on the time interval measurement, while for the phase measurement scanners this accuracy fundamentally depends on the wavelength of the ranging signal. Triangulation scanners are based on a simple triangulation principle. A light spot or stripe is projected onto an object surface and the position of the spot on the object is recorded by one or more CCD cameras. The angle of the laser beam leaving the scanner is internally recorded and the fixed base length between laser source and camera is known from calibration. The distance from the object to the instrument is geometrically determined from the recorded angle and base length. This type of scanner reaches 3D point standard deviations of less than one millimetre at very close range (less than 2 meters). The ranging accuracy depends on both the length of the scanner base and the object distance. With a fixed base length, the standard deviation of the distance measurement will increase in proportion to the square of the distance.One way or another, laser technology has being widely used so far in several scientific fields such as architectural heritage, civil engineering, industrial reconstruction or geology [8-11], but its use underground is not very common. Caves and karst studies represent a specific case (given the geometric and environmental conditions) with great social relevance since cave preservation seems more vulnerable to subsequent events, agents and processes. Nevertheless, this last aspect has contributed positively to local authorities starting to be more concerned about the special importance of recording and modelling rock art using non-destructive techniques, such as laser scanning. In this sense, in [12] use a triangulation-based laser range scanner to physically replicate the cave at Altamira in Northern Spain. Numerous modeling and CAD software tools were used and the data was fed into a milling machine to create the cave replica. The rock art was physically painted onto the replica. In [13] a case of study for recording and monitoring the rock art erosion based on triangulation laser scanner is presented. The 3D laser scanner method is able to produce a precise digital model of the carved rock and provides accurate geo-referenced data in sub-millimetre resolution, thus allowing the quantitative assessment of surface erosion and deterioration of the rock art by comparison with future recordings. In [14] the authors present data processing techniques for the recording of rock art using a TLS. Particularly, they use a triangulation laser scanner for the documentation of petroglyphs. The most interesting contribution is their comparison with traditional rock art recording methods (rubbing and tracing). However, a point that is not investigated in this paper is the possibility of establishing an integration with terrestrial photogrammetry in order to process and visualize the results. [15] uses a phase measurement laser scanner and modelling software to produce an accurate three-dimensional model of a carved rock surface from the Upper Palaeolithic site of Cap Blanc in southwest France. However, the approach presented is really simple since only the geometry provided by the laser is processed. Additional information such as texture is not considered so far and the methodology presented only applies the classical laser scanning workflow. More recently, [16] establish a comparison between classical photogrammetry (stereoscopic) and modern laser scanning. Particularly, separate surveys are carried out using time-of-flight and triangulation laser scanners, as well as using stereo-paired photography. The resulting mesh surfaces are analyzed and compared. The strengths and weaknesses of each approach are scrutinised, alongside a practical and methodological evaluation of each technique in view of the aims of the survey. Finally, in a more sophisticated approach, in [17] an original method based on Multi-Resolution Digital 3D Imaging System is presented and put in practise into the Grotta dei Cervi (Italy). They used a prototype multi-resolution 3D laser imaging scanner that combines high-accuracy 3D laser imaging, very high-resolution perspective colour projection, and on-site geometric calibration of the intrinsic and extrinsic parameters. However, this approach needs a camera attached to a laser scanner in order to obtain an automatic colour texture projection.
2. Methodology
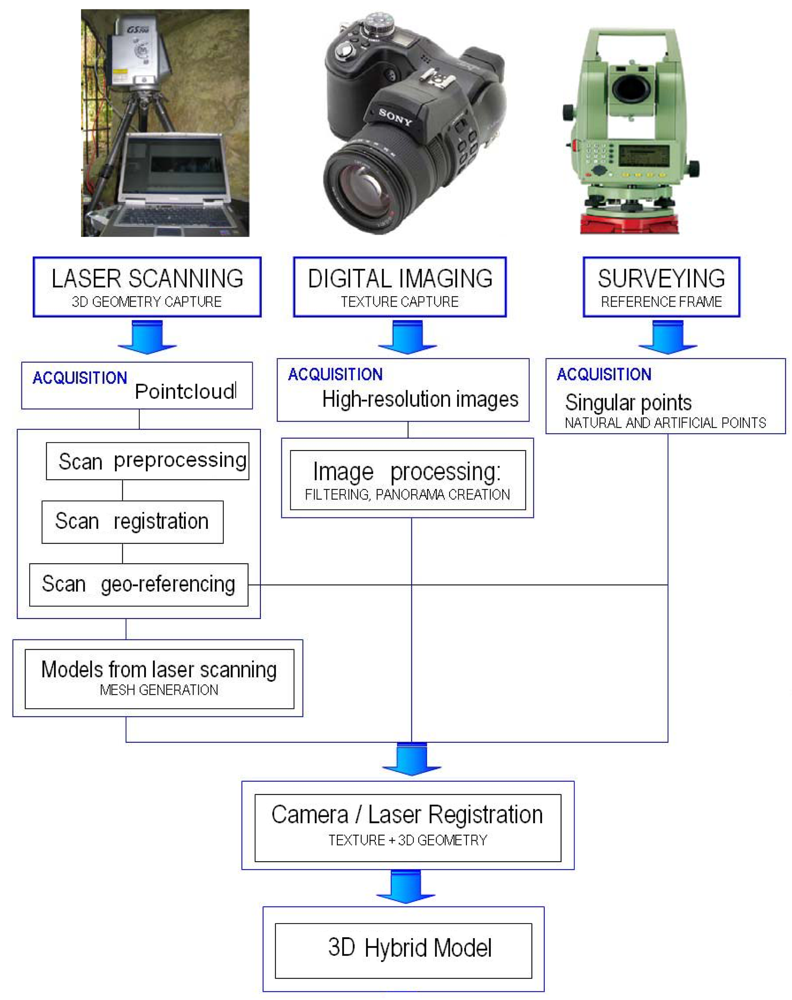
2.1. Equipment Employed
Measuring sensors
- A Trimble GS200 TLS based on the time-of-flight principle. This instrument is motorized and allows for angular and distance accuracies of about 2.5 mgon (0.00225°) and 1.5 mm at distances below 50 m, respectively. The scanner uses an auto focus method for the laser which shows to be very useful mainly for close range applications. This feature guarantees a constant small laser spot even at different distances within a scan. The beam diameter varies from 0.3 mm at 5 m up to 1.5 mm at a distance of 25 m. In addition, special head gear, Manfrotto 400, is adapted to the laser scanner structure in order to overcome vertical range limitation.
- A Leica TPS 800 laser total station. This instrument is used in order to provide a common reference system according to the local reference frame established with each sensor independently. The total station has the following technical features: magnification 30×; electronic level sensitivity: 20 in/2 mm; twofold axis compensator; measurement accuracy of distances with prism: 2 mm + 2 ppm; measurements accuracy of distances without prism: 3 mm + 2 ppm.
- A non metric digital camera, Sony DSC F828. This camera is fitted with fixed-focus optics granting stability in the inner orientation. The CCD image sensor provides image sizes of 3,360 × 2,460 pixels, storing files in JPEG format.
Specific software tools
- An educational laser scanner software [18], which allows a co-registration and hybrid modelling of dataset provided by laser scanners and conventional digital cameras.
2.2. Field Work
- Planning: before initiating any documentation work, objectives must be defined in a clear and accurate way. Poorly defined objectives will clearly affect the quality of the results, especially when recording subterranean places where the different conditions that can be found under ground could be really adverse: from physical features i.e. a difficult access, reduced illumination and high humidity, to technical features that have to be solved with an adequate methodology and specific instruments.
- Camera calibration. Considering that perform a calibration of the camera directly (self-calibration) from project images at caves or subterranean places is often not possible, a precise and reliable camera calibration including all lens distortion parameters will be required before data capture. With this aim, a specific camera calibration is performed on a laboratory using a grid of surveyed control points. Precise camera calibration including all lens distortion parameters is essential for sensor integration, especially if we try to guarantee more automatism and quality in the process.
- Range data acquisition: TLS dataset are taken following the basic principles defined in [19]. As a result, two types of range data are acquired: global range data set up with an average grid resolution of 20 mm at 10 meters of distance, with the aim of recording the whole cave geometry; detailed range data set up with an average grid resolution of 2mm at a distance of 10 meters, with the aim of recording the Paleolithic engravings and paintings with enough high accuracy.
- Image data acquisition: photographs are taken according to the basic principles of photography. The following aspects should be taken into account: using the right lighting conditions, avoiding shadows, reflections, backlights or burned photographs; calculating the depth of field, the speed of the camera and framing, which can vary depending on the type of images. As a result, three types of images are acquired: multiple and convergent images are taken following specific rules [20] and provide the input data to perform a photogrammetric image-based modelling; independent high-resolution images are used to generate metric texture maps from detailed range data; panoramic images are used to provide a 360-degree panorama background at the caves and to map the textures over the global range dataset. These panoramic images are acquired incorporating a specific lens (fish-eye) to the digital camera together with a specific pano-head (MrotatorTCPShort) and its tripod.
- Control points acquisition: a set of artificial targets (planar and spheres) are surveyed with total station with a twofold purpose: to register datasets in a common reference system and to geo-reference datasets into the archaeological frame provided by the prehistorian. Besides, this reference system provides a definition of the vertical direction without ambiguity.
2.3. Data Processing
- A feature extraction process based on interest point detection, particularly Förstner operator [26] is used. This operator exhibits the following advantages compared to other alternatives: high accuracy and reliability in the localization of the interest points. Besides, different thresholds and parameters are established such as the ellipse circularity parameter and the point weight as expressed by the following formulae (1), so a non- maximum suppression is applied in order to extract the interest pointswhere q is the ellipse circularity parameter, λ1 and λ2 are the eigenvalues, w the point weight and N the Hessian matrix. The use of q-parameter allows us to avoid features which are not suitable for the purposes of the co-registration.
- A robust matching strategy that combines various scientific proven techniques (ABM-Area Based Matching and LSM-Least Square Matching) is applied.Firstly, for each extracted point in the high-resolution image an area-based matching is computed using the cross-correlation coefficient (2). In ABM, each point to be matched is the centre of a small window of pixels (patch) in a reference image (template) which is statistically compared with equal sized windows of pixels in another (target) image. Particularly, area-based image matching is performed with cross-correlation as a similarity measure (2).where p is the cross-correlation coefficient, σHR is the covariance between the windows of high-resolution and range image; σH is the high-resolution image deviation and σR is range image deviation. Interest points matching are based on proximity and similarity of their intensity neighbourhood.Cross-correlation works fast and well if the patches contain enough signal without too much high-frequency content (noise) and if geometrical and radiometric distortions are minimal. To overcome these problems, the approximations found with cross-correlation are refined considerably using Least Squares Matching (LSM) [27], which provides precise and sub-pixel location of the matching elements, considering image reshaping parameters and radiometric corrections. The location and shape of the matched window is estimated with respect to some initial values and computed until the grey-level differences between the deformed patch and the template one reach a minimum (3),where F and G represent the reference and corresponding searching images respectively, a,b,c,d,Δx and Δy constitute the geometric corrections of an affine transformation, while r1 and r0 are the radiometric corrections, more specifically contrast and bright corrections respectively.
- An estimation step which allows us to obtain a first approximation of co-registration parameters based on Direct Linear Transformation (DLT) [28]. This transformation is linear with respect to the transformation parameters and is constituted by eleven parameters (three for the interior orientation, six for the exterior orientation and two additional parameters that contains a scale difference between the two images camera axes and non-orthogonality of these axes). Hence, the DLT is most suitable for the processing of non-metric images, such as amateur cameras. Since, it is not, however, a least squares adjustment its accuracy is limited and thus the results of DLT are used as approximations for a subsequent adjustment based on central perspective relations.
- A computation step, in which a re-weighted least square adjustment is applied. A re-projection strategy based on collinearity condition allows us to refine the DLT solution and thus to compute accurate and reliable co-registration parameters.
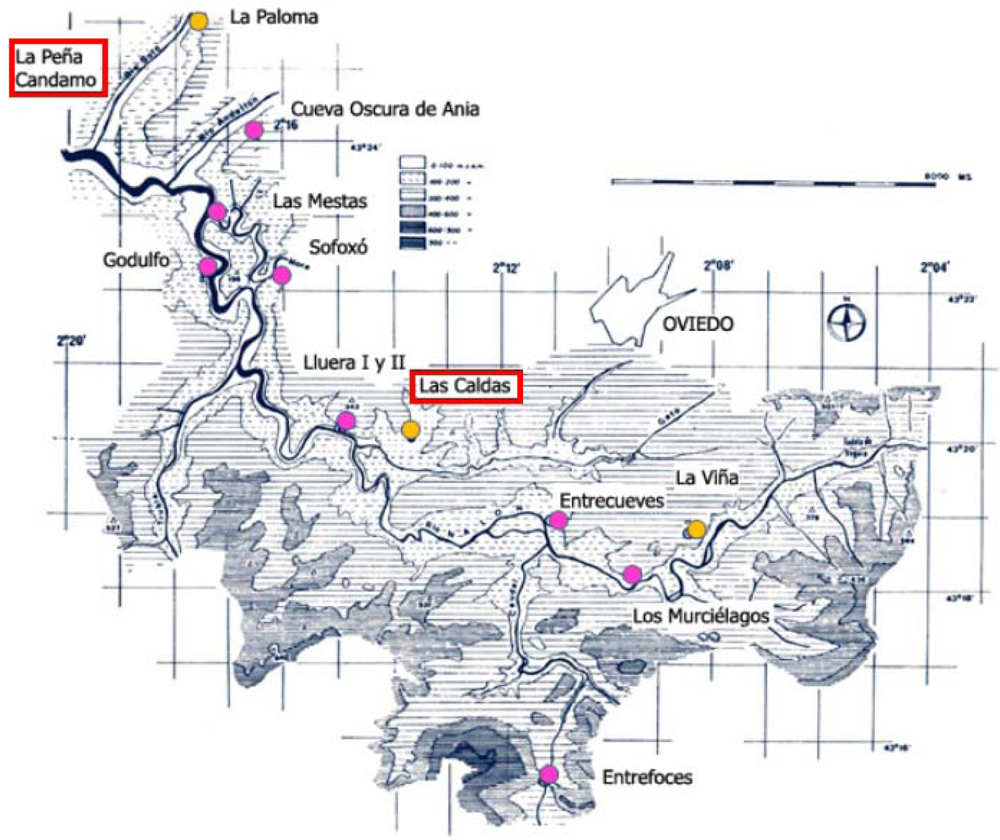
3. Application to Archaeology Study Case: “Las Caldas” and “Peña de Candamo” Caves
4. Discussion and Conclusions
- A hierarchical and robust matching process that combines several proven scientific techniques in close range photogrammetry and computer vision has been developed and applied to real and complex rock art cases successfully.
- Particularly, the presented flowline exhibits the following improvements in comparison with other existing approaches discussed previously:
- -
- No user interaction is required.
- -
- No restrictions such as stereoscopic setup or physical attachment between both sensors are required.
- -
- Neither special targets nor geometric constraints (vanishing points) are necessary.
- Use of new sensors (thermal and hyperspectral cameras) and filters for the digital camera in order to apply spectral analysis to the acquired data, could provide interesting results focused on pictorial materials, and the analysis of anomalous areas.
- Improving the feature extraction process developed. Particularly, the Scale Invariant Feature Transform (SIFT) approach developed by [32] could transform the camera and range images into a large collection of local feature vectors, each of which would be invariant to image translation, scaling, and rotation, and partially invariant to illumination changes and affine or 3D projection. This would have the further advantage that any change in perspective or rotation between both images would not affect the feature extraction process. Likewise, the procedure for co-registration of both sensors could be further improved by adding an approach for managing the occlusions problem.
Acknowledgments
References and Notes
- Fossati, A.; Jaffe, L.; Abreu, M. Rupestrian Archaeology. Techniques and Terminology. A Methodological Approach: Petroglyphs, Cerveno. In Ricerche Archeologiche, 1(I); Edizioni della Cooperativa Archeologica Le Orme dell Uomo: Val Camonica, Brescia, Italia, 1990. [Google Scholar]
- Lopetegui, A; Valle-Melon, J.M.; Rodriguez, A. Modelo de represenatción y difusión de cavidades. Cueva de Fraile Aitz I. Deba, Guipúzcoa. Proceedings of TOPCART 2004 Congress, Madrid, Spain; 2004. [Google Scholar]
- Chueca, M.; Herraez, J.; Berne, J.L. Tratado de Topografía I: Teoría de Errores e Instrumentación; Paraninfo, S. A., Ed.; Madrid, 1996. (in Spanish) [Google Scholar]
- Chandler, J.H.; Fryer, J.G. Recording aboriginal rock art using cheap digital cameras and digital photogrammetry. Proceedings of CIPA XX International Symposium, Torino, Italy; 2005. [Google Scholar]
- Ogleby, C; Rivett, L.J. Handbook of Heritage Photogrammetry; Australian Government Publishing Service: Canberra, 1985. [Google Scholar]
- Rivett, L.J. The application of photogrammetry to the recording of rock art and archaeological sites in the Kakadu National Park. In Report to Australian National Parks and Wildlife Service; Canberra, 1979. [Google Scholar]
- Ogleby, C. From rubble to virtual reality: photogrammetry and the virtual world of ancient Ayuthaya, Thailand. Photogramm. Rec. 1999, 16, 651–670. [Google Scholar]
- Chow, K.L. Engineering Survey Applications of Terrestrial Laser Scanner. Proceedings of the XXX FIG General Assembly and Working Week, Hong Kong, China; 2007. [Google Scholar]
- Dold, C.; Brenner, K. Registration of terrestrial laser scanning data using planar patches and image data. ISPRS Archives, Dresden, Germany, Sept 25-27, 2006; pp. 78–83.
- Mccaffrey, K.J.W.; Jones, R.R.; Holdsworth, R.E.; Wilson, R.W.; Clegg, P.; Imber, J.; Holliman, N.; Trinks, I. Unlocking the spatial dimension: digital technologies and the future of geoscience fieldwork. J. Geol. Soc. 2005, 162, 927–938. [Google Scholar]
- Reshetyuk, Y. Calibration of terrestrial laser scanners for the purposes of geodetic engineering. Proceedings of the 3rd IAG Symposium on Geodesy for Geotechnical and Structural Engineering and 12th FIG Symposium on Deformation Measurements, Baden, Austria; 2006. [Google Scholar]
- Donelan, J. Making prehistory. Computer Graphics World 2002, 32–33. [Google Scholar]
- Barnett, T.; Chalmers, A.; Diaz-Andreu, M.; Ellis, G.; Longhurst, P.; Sharpe, K.; Trinks, I. 3D laser scanning for recording and monitoring rock art erosion. International Newsletter on Rock Art (INORA) 2005, 41, 25–29. [Google Scholar]
- Trinks, I; Diaz-Andreu, M.; Hobbs, R.; Sharpe, K.E. Digital rock art recording: visualising petroglyphs using 3D laser scanner data. J. Rock Art Res. 2005, 22, 131–139. [Google Scholar]
- Robson Brown, K.A.; Chalmers, A.; Saigol, T.; Green, C.; D'errico, F. An automated Laser scan survey of the Upper Palaeolithic Rock Shelter of Cap Blanc. J. Archaeol. Sci. 2001, 28, 283–289. [Google Scholar]
- Cavers, G.; Hepher, J.; Hale, A. Recording Rock Art: a comparison of techniques for digital recording and monitoring of rock art used at Ormaig, Argyll and Bute. Proceedings of the World Archaeological Congress, Dublin, Ireland; 2008. [Google Scholar]
- Beraldin, J.A.; Blais, F.; Cournoyer, L.; Picard, M.; Gamache, D.; Valzano, V.; Bandiera, A.; Gorgoglione, M. Multi-resolution digital 3D imaging system applied to the recording of Grotto Sites: the case of the Grotta dei Cervi. Proceedings of the 7th International Symposium on Virtual Reality, Archaeology and Cultural Heritage VAST, Nicosia, Cyprus; 2006. [Google Scholar]
- Aguilera, D.; Rodríguez, P.; Gomez, J. Automatic co-registration of terrestrial laser scanner and digital camera for the generation of hybrids models. Proceedings of the IAPRS. Commission III, Helsinki, Finland; 2007. [Google Scholar]
- Boehler, W.; Heinz, G.; Marbs, A. The potential of non-contact close range laser scanners for Cultural heritage recording. Proceedings of CIPA International Symposium, Potsdam, Germany; 2001. [Google Scholar]
- Waldhäusl, P.; Ogleby, C. 3-by-3- Rules for Simple Photogrammetric Documentation of Architecture. Proceedings of the Symposium of Commission V of ISPRS, Melbourne, Australia; 1994. [Google Scholar]
- Rocchini, C.; Cignomi, P.; Montani, C.; Scopigno, R. Multiple textures stitching and blending on 3D objects. Proceedings 10th Eurographics Workshop on Rendering, Granada, Spain; 1999. [Google Scholar]
- Elstrom, M. A. Stereo-based technique for the registration of color and LIDAR images. M.S. Thesis, University of Tennessee, 1998. [Google Scholar]
- Ikeuchi, K.; Nakazawa, A.; Nishino, K.; Oishi, T. Creating virtual buddha statues through observation. Proceedings IEEE/CVPR Workshop on Applications of Computer Vision in Archaeology, Wisconsin, USA; 2003. [Google Scholar]
- Aguilera, D.G.; Lahoz, J.G. Terrestrial laser scanner and high-resolution camera registration through single image-based modeling. Proceedings VAST: International Symposium on Virtual Reality, Archaeology and Intelligent Cultural Heritage, Nicosia, Cyprus; 2006. [Google Scholar]
- Al-Manasir, K.; Fraser, C. Registration of terrestrial laser scanner data using imagery. Photogramm. Rec. 2006, 21, 255–268. [Google Scholar]
- Förstner, W.; Gülch, E. A fast operator for detection and precise location of distinct points, corners and centres of circular features. Proceedings of the ISPRS Workshop, Interlaken, Switzerland; 1987. [Google Scholar]
- Grün, A. Adaptive least squares correlation: a powerful image matching technique. S. Afr. J. Photogramm. Remote Sens. Cartogr. 1985, 14, 23–37. [Google Scholar]
- Abdel-Aziz, Y.I.; Karara, H.M. Direct linear transformation from comparator coordinates into space coordinates in close range photogrammetry. Proceedings of the Symposium on Closerange Photogrammetry, Falls Church, United States; 1971. [Google Scholar]
- Hanke, K.; Grussenmeyer, P.; Grimm-Pitzinger, A.; Weinold, T. First experiences with the Trimble GX scanner. ISPRS Archives, Dresden, Germany, Sept 25-27, 2006.
- Lahoz, J.G.; Aguilera, D.G.; Finat, J.; Martínez, J.; Fernández, J.J.; San Jose, J. Terrestrial laser scanning metric control: assessment of metric accuracy for cultural heritage modeling. ISPRS Archives, Dresden, Germany, Sept 25-27, 2006.
- Lichti, D.D. Error modelling, calibration and analysis of an AM–CW terrestrial laser scanner system. ISPRS-J. Photogramm. Remote Sens. 2007, 61, 307–324. [Google Scholar]
- Lowe, D.G. Object recognition from local scale-invariant features. Proceedings of International Conference on Computer Vision, Kerkyra, Greece; 1999. [Google Scholar]


© 2009 by the authors; licensee Molecular Diversity Preservation International, Basel, Switzerland. This article is an open access article distributed under the terms and conditions of the Creative Commons Attribution license (http://creativecommons.org/licenses/by/3.0/).
Share and Cite
González-Aguilera, D.; Muñoz-Nieto, A.; Gómez-Lahoz, J.; Herrero-Pascual, J.; Gutierrez-Alonso, G. 3D Digital Surveying and Modelling of Cave Geometry: Application to Paleolithic Rock Art. Sensors 2009, 9, 1108-1127. https://doi.org/10.3390/s90201108
González-Aguilera D, Muñoz-Nieto A, Gómez-Lahoz J, Herrero-Pascual J, Gutierrez-Alonso G. 3D Digital Surveying and Modelling of Cave Geometry: Application to Paleolithic Rock Art. Sensors. 2009; 9(2):1108-1127. https://doi.org/10.3390/s90201108
Chicago/Turabian StyleGonzález-Aguilera, Diego, Angel Muñoz-Nieto, Javier Gómez-Lahoz, Jesus Herrero-Pascual, and Gabriel Gutierrez-Alonso. 2009. "3D Digital Surveying and Modelling of Cave Geometry: Application to Paleolithic Rock Art" Sensors 9, no. 2: 1108-1127. https://doi.org/10.3390/s90201108
APA StyleGonzález-Aguilera, D., Muñoz-Nieto, A., Gómez-Lahoz, J., Herrero-Pascual, J., & Gutierrez-Alonso, G. (2009). 3D Digital Surveying and Modelling of Cave Geometry: Application to Paleolithic Rock Art. Sensors, 9(2), 1108-1127. https://doi.org/10.3390/s90201108