Methods for Improving Image Quality and Reducing Data Load of NIR Hyperspectral Images

Abstract
:1. Introduction
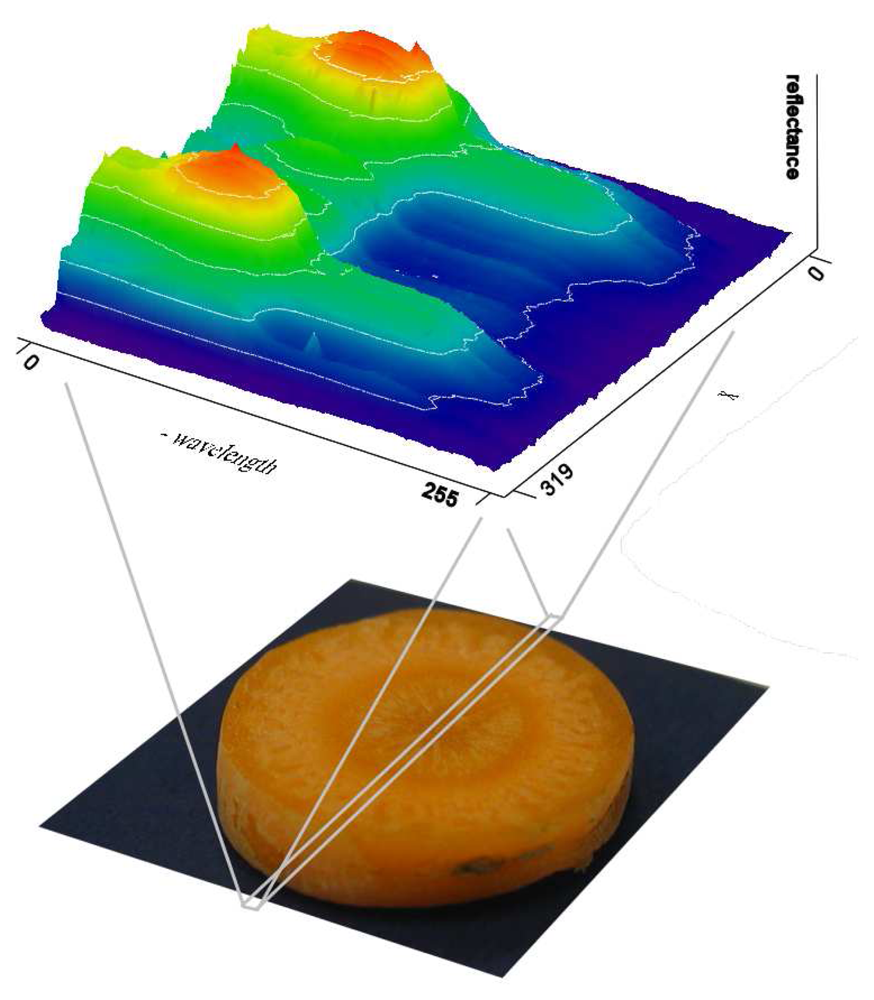
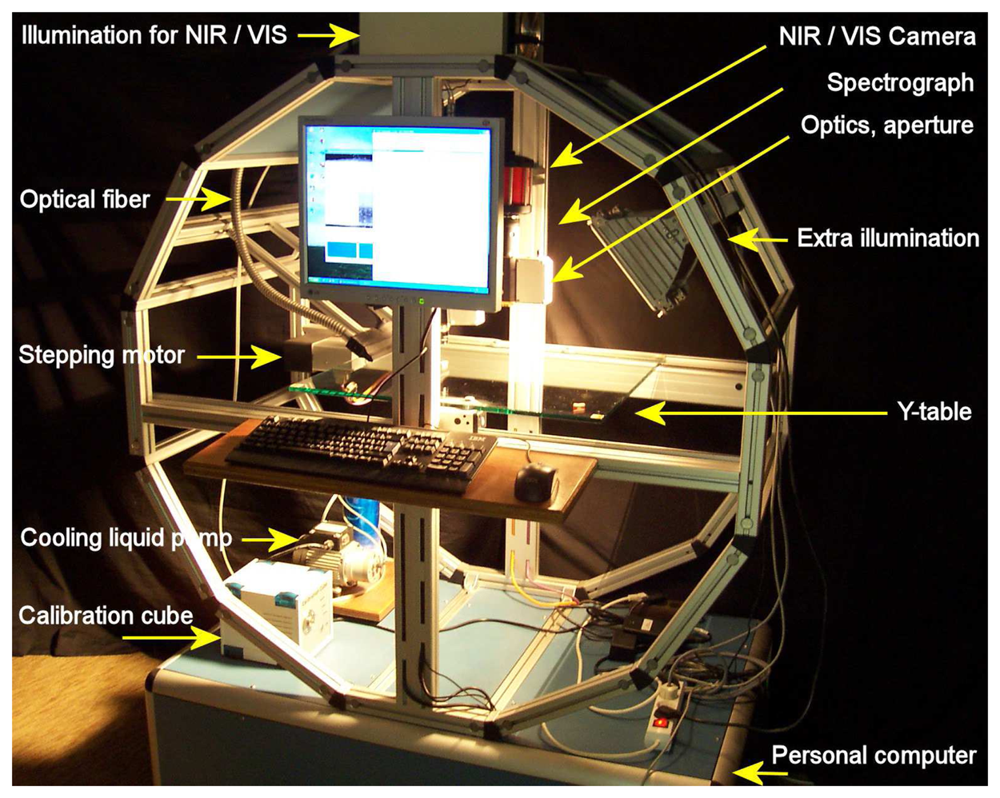
2. Hyperspectral imaging system
3. Methodology
3.1. Unserviceable NIR sensor pixels
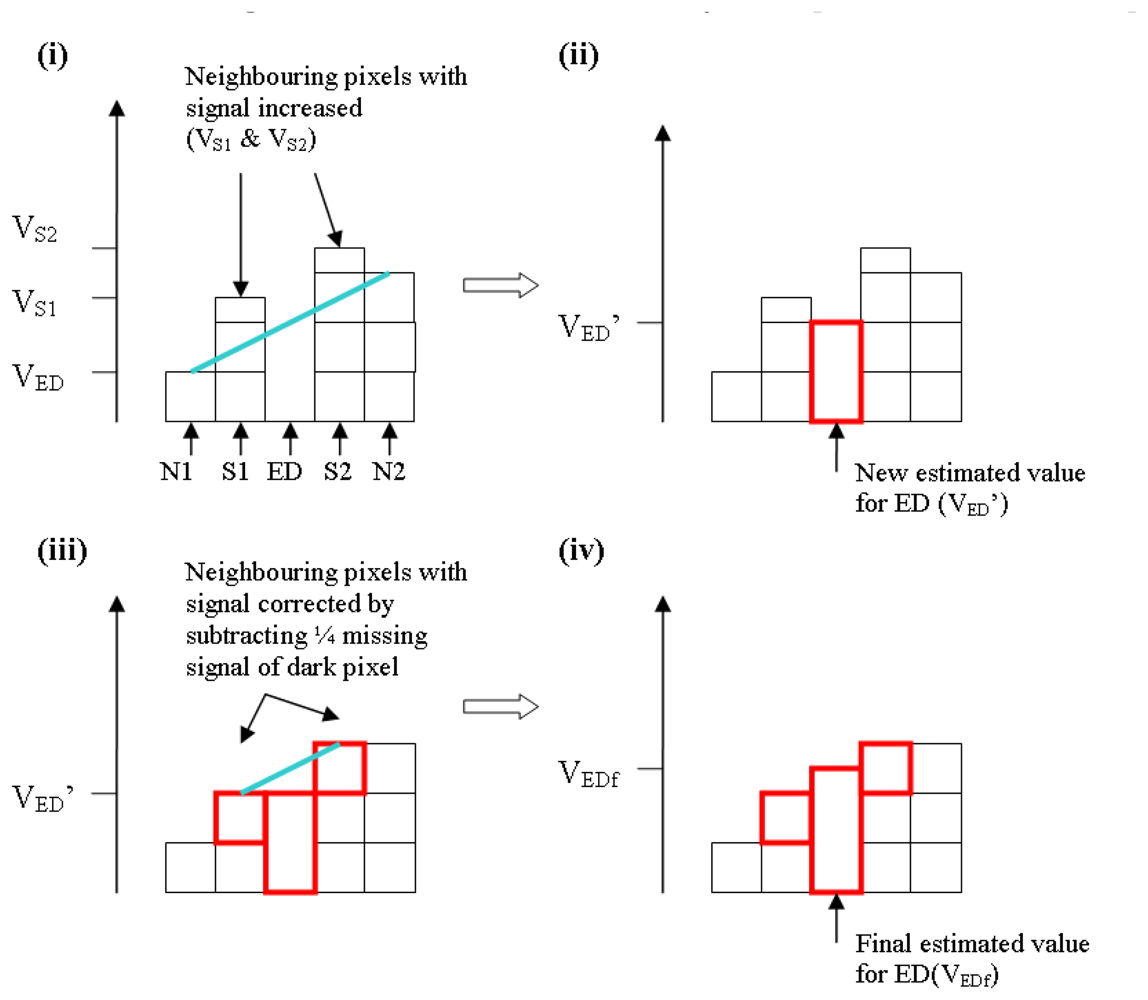
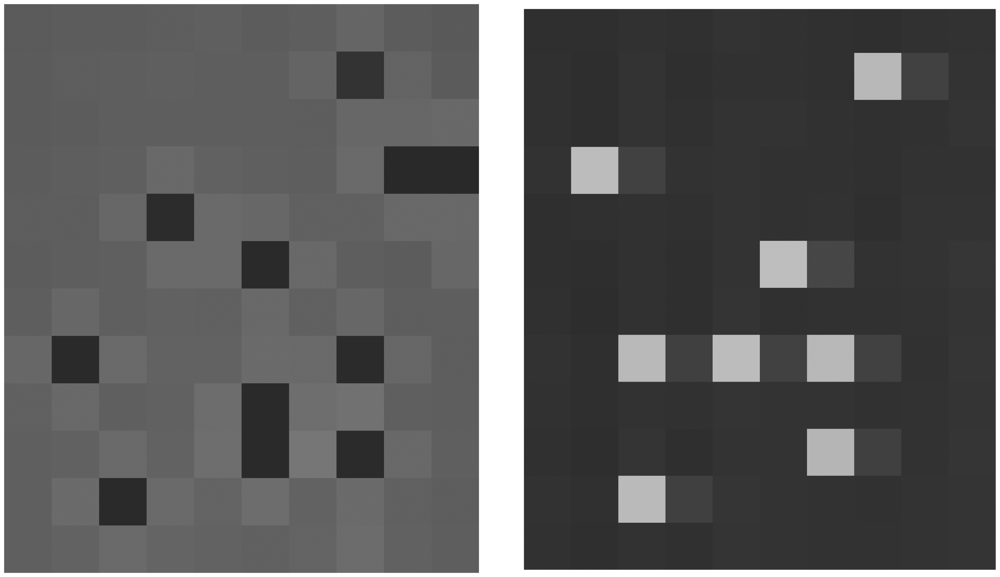
- Extraordinarily dark pixels: These pixels behave like a stone dropped into water, resulting in a slightly higher intensity level for their four neighbours [Figure 3 (a)]. The superposition effects were additive, therefore one fourth of the missing signal of dark pixels had to be subtracted from that of the four neighbours.
- Extraordinarily bright pixels: These pixels resulted in a “light shadow” on the pixel directly to their right; this “light shadow” also affected far neighbours with exponentially decreasing intensity [Figure 3(b)].
A. Identification of extraordinarily dark and bright pixels
B. Correction of extraordinarily dark and bright pixels
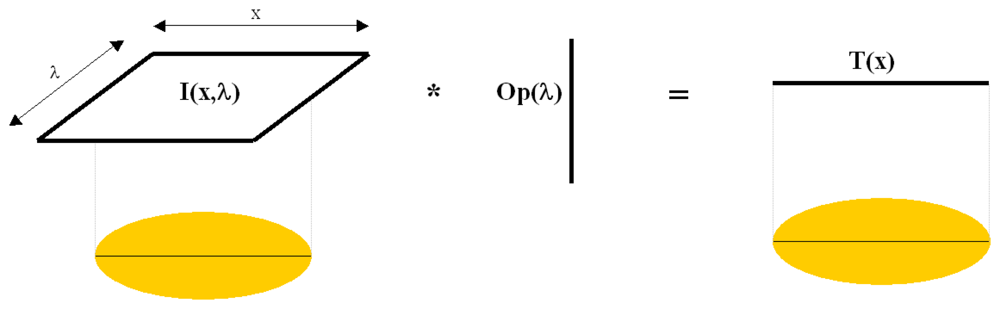
3.2. Real-time data reduction
4. Experiments
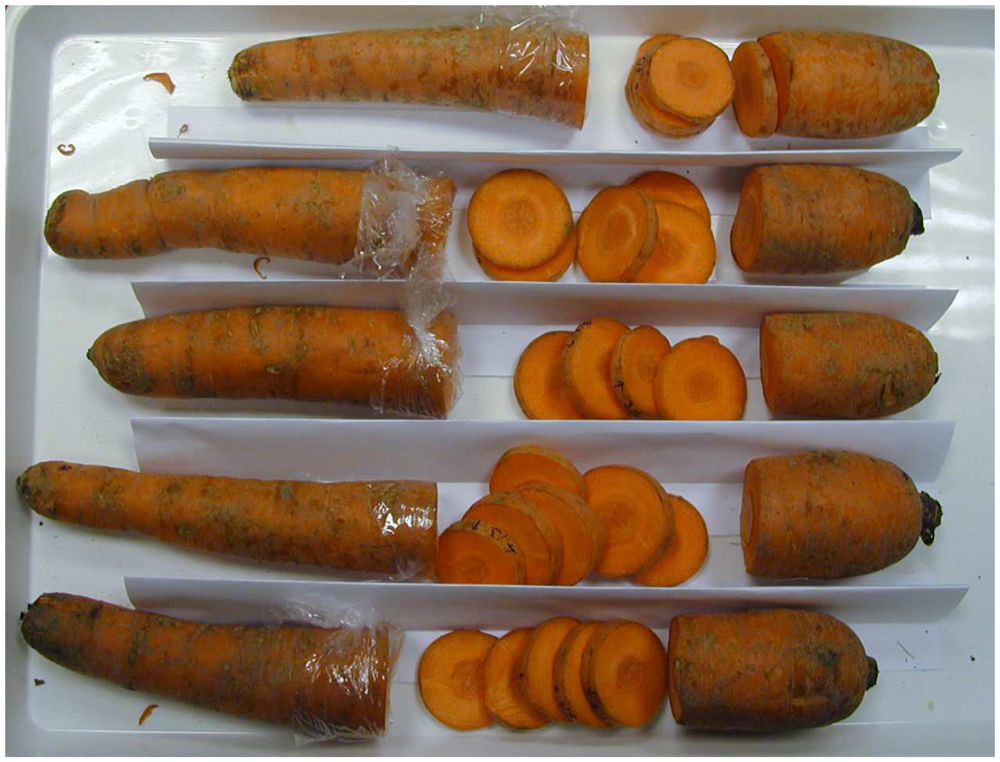
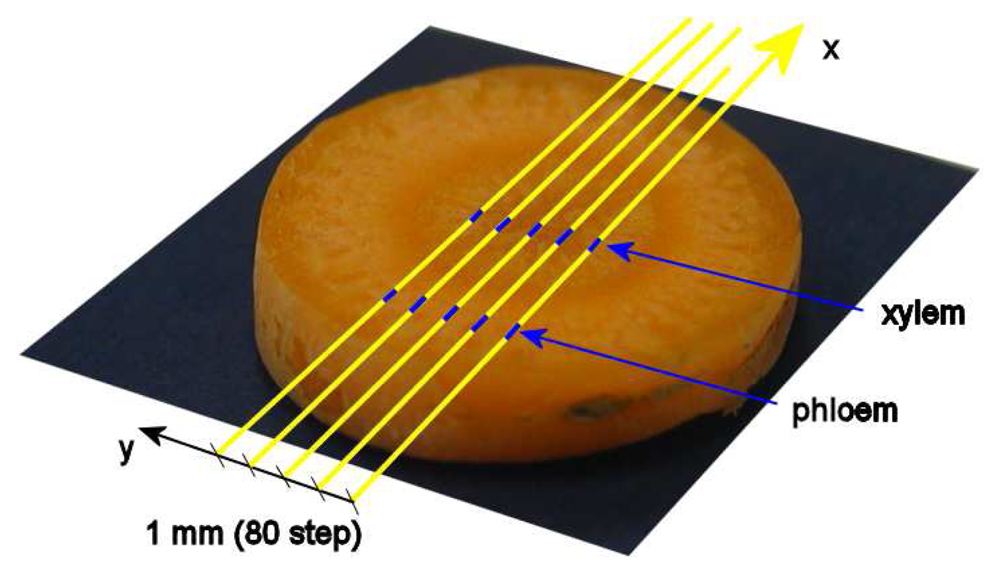
Sample preparation
5. Results
6. Conclusions
Acknowledgments
References and Notes
- Throop, J.A.; Aneshansley, D.J.; Upchurch, B.L. Near-IR and color imaging for bruise detection on Golden Delicious apples. Proc. SPIE 1993, 1836, 33–44. [Google Scholar]
- Daley, W.; Carey, R.; Thompson, C. Poultry grading/inspection using color imaging. Proc. SPIE 1993, 1907, 124–132. [Google Scholar]
- Chao, K.; Chen, Y.R.; Early, H.; Park, B. Color image classification systems for poultry viscera inspection. Appl. Eng. Agric. 1999, 15, 363–369. [Google Scholar]
- Scotter, C. Use of near infrared spectroscopy in the food industry with particular reference to its applications to on/in-line food processes. Food Control 1990, 1, 142–149. [Google Scholar]
- Saranwong, S.; Kawano, S. A simple method of instrument standardization for an NIR sorting machine: the utilization of average spectra as input vectors. J. Near Infrared Spec. 2004, 12, 359–364. [Google Scholar]
- Walsh, K.B.; Golic, M.; Greensill, C.V. Sorting of fruit using near infrared spectroscopy: application to a range of fruit and vegetables for soluble solids and dry matter content. J. Near Infrared Spec. 2004, 12, 141–148. [Google Scholar]
- Goetz, A.F.H.; Vane, G.; Solomon, J.; Rock, B.N. Imaging spectrometry for Earth remote sensing. Science 1985, 228, 1147–1153. [Google Scholar]
- Gowen, A.A.; O'Donnell, C.P.; Cullen, P.J.; Downey, G.; Frias, J.M. Hyperspectral imaging an emerging process analytical tool for food quality and safety control. Trends Food Sci. Technol. 2007, 18, 590–598. [Google Scholar]
- Lawrence, K.C.; Park, B.; Windham, W.R.; Mao, C. Calibration of a pushbroom hyperspectral imaging system for agricultural inspection. Trans. ASAE 2003, 46, 513–521. [Google Scholar]
- Reich, G. Near-infrared spectroscopy and imaging: Basic principles and pharmaceutical applications. Adv. Drug Deliv. Rev. 2005, 57, 1109–1143. [Google Scholar]
- CIE Publication No 17.4. International Lighting Vocabulary, 4th Ed. ed; Commission Internationale de l'Eclairage: Paris, 1987. [Google Scholar]
- Wold, S.; Esbensen, K.; Geladi, P. Principal component analysis. Chemometr. Intell. Lab. Sys. 1987, 2, 37–52. [Google Scholar]
- Zude, M.; Birlouez-Aragon, I.; Paschold, P-J.; Rutledge, N. D. Non-invasive spectrophotometric sensing of carrot quality from harvest to consumption. Postharv. Biol. Technol. 2007, 45, 30–37. [Google Scholar]
- Büning-Pfaue, H. Analysis of water in food by near infrared spectroscopy. Food Chem. 2003, 82, 107–115. [Google Scholar]


| predicted group membership | ||||
| original group | xylem | phloem | ||
| learning set: 2*630 spectra | count | xylem | 630 | 0 |
| phloem | 0 | 630 | ||
| % | xylem | 100.0 | 0.0 | |
| phloem | 0.0 | 100.0 | ||
| test set: 2*2520 spectra | count | xylem | 2504 | 16 |
| phloem | 20 | 2500 | ||
| % | xylem | 99.4 | 0.6 | |
| phloem | 0.8 | 99.2 | ||
| predicted group membership | ||||||||
| group | 0 | 90 | 180 | 270 | 360 | 450 | ||
| learning set: 6*210 spectra | % | 0 | 100.0 | 0.0 | 0.0 | 0.0 | 0.0 | 0.0 |
| 90 | 0.0 | 98.6 | 1.4 | 0.0 | 0.0 | 0.0 | ||
| 180 | 0.0 | 4.3 | 95.7 | 0.0 | 0.0 | 0.0 | ||
| 270 | 0.0 | 0.0 | 0.0 | 81.0 | 15.7 | 3.3 | ||
| 360 | 0.0 | 0.0 | 0.0 | 5.2 | 80.5 | 14.3 | ||
| 450 | 0.0 | 0.0 | 0.0 | 4.8 | 11.9 | 83.3 | ||
| test set: 6*840 spectra | % | 0 | 98.1 | 1.9 | 0.0 | 0.0 | 0.0 | 0.0 |
| 90 | 0.1 | 91.2 | 8.7 | 0.0 | 0.0 | 0.0 | ||
| 180 | 0.0 | 7.5 | 92.5 | 0.0 | 0.0 | 0.0 | ||
| 270 | 0.0 | 0.0 | 0.0 | 78.6 | 16.9 | 4.5 | ||
| 360 | 0.4 | 0.1 | 1.0 | 41.0 | 41.9 | 15.7 | ||
| 450 | 0.0 | 0.0 | 0.0 | 38.9 | 26.2 | 34.9 | ||
© 2008 by the authors; licensee Molecular Diversity Preservation International, Basel, Switzerland. This article is an open-access article distributed under the terms and conditions of the CreativeCommons Attribution license ( http://creativecommons.org/licenses/by/3.0/).
Share and Cite
Firtha, F.; Fekete, A.; Kaszab, T.; Gillay, B.; Nogula-Nagy, M.; Kovács, Z.; Kantor, D.B. Methods for Improving Image Quality and Reducing Data Load of NIR Hyperspectral Images. Sensors 2008, 8, 3287-3298. https://doi.org/10.3390/s8053287
Firtha F, Fekete A, Kaszab T, Gillay B, Nogula-Nagy M, Kovács Z, Kantor DB. Methods for Improving Image Quality and Reducing Data Load of NIR Hyperspectral Images. Sensors. 2008; 8(5):3287-3298. https://doi.org/10.3390/s8053287
Chicago/Turabian StyleFirtha, Ferenc, András Fekete, Tímea Kaszab, Bíborka Gillay, Médea Nogula-Nagy, Zoltán Kovács, and David B. Kantor. 2008. "Methods for Improving Image Quality and Reducing Data Load of NIR Hyperspectral Images" Sensors 8, no. 5: 3287-3298. https://doi.org/10.3390/s8053287
APA StyleFirtha, F., Fekete, A., Kaszab, T., Gillay, B., Nogula-Nagy, M., Kovács, Z., & Kantor, D. B. (2008). Methods for Improving Image Quality and Reducing Data Load of NIR Hyperspectral Images. Sensors, 8(5), 3287-3298. https://doi.org/10.3390/s8053287