Role of Satellite Sensors in Groundwater Exploration

Remote sensing Applications laboratory, School of Environmental Sciences, Jawaharlal Nehru University, New Mehrauli Road, New Delhi-110067, India
Sensors 2008, 8(3), 2006-2016; https://doi.org/10.3390/s8032006
Submission received: 1 November 2007
/
Accepted: 7 February 2008
/
Published: 24 March 2008
(This article belongs to the Special Issue Remote Sensing of Natural Resources and the Environment)
Abstract
:Spatial as well as spectral resolution has a very important role to play in water resource management. It was a challenge to explore the groundwater and rainwater harvesting sites in the Aravalli Quartzite-Granite-Pegmatite Precambrian terrain of Delhi, India. Use of only panchromatic sensor data of IRS-1D satellite with 5.8-meter spatial resolution has the potential to infer lineaments and faults in this hard rock area. It is essential to identify the location of interconnected lineaments below buried pediment plains in the hard rock area for targeting sub-surface water resources. Linear Image Self Scanning sensor data of the same satellite with 23.5-meter resolution when merged with the panchromatic data has produced very good results in delineation of interconnected lineaments over buried pediment plains as vegetation anomaly. These specific locations of vegetation anomaly were detected as dark red patches in various hard rock areas of Delhi. Field investigation was carried out on these patches by resistivity and magnetic survey in parts of Jawaharlal Nehru University (JNU), Indira Gandhi national Open University, Research and Referral Hospital and Humayuns Tomb areas. Drilling was carried out in four locations of JNU that proved to be the most potential site with ground water discharge ranging from 20,000 to 30,000 liters per hour with 2 to 4 meters draw down. Further the impact of urbanization on groundwater recharging in the terrain was studied by generating Normalized difference Vegetation Index (NDVI) map which was possible to generate by using the LISS-III sensor of IRS-1D satellite. Selection of suitable sensors has definitely a cutting edge on natural resource exploration and management including groundwater.
1. Introduction
In view of the scarcity of piped water in the city of Delhi increasingly the dependence for non-drinking requirements has been on groundwater availability. The groundwater table has declined and the extraction of ground water is not sustainable. As a result there has been reported draw down in the wells/tube wells/submersible pumps and some of them having been abandoned due to poor yields or gone dry. Information on the existing land use pattern, the spatial distribution and its changes is required for planning, utilization and formulation of policies and programs for sustainable development [3, 5, 6, and 7]. Humans transform the land for different activities based on their needs and quantifiable information on these dominating activities is necessary to develop future plans. Soil properties and land use patterns are major contributing factors to the hydromorphogeology of a particular area. Historical monuments and other urban features have been analyzed by satellite imagery. Remote sensing data are helpful in the studies changes in land use patterns, which are located in the recharge areas of elevated parts of Aravalli hill region [1, 9]. It is essential to identify suitable location in this area by using multisensor satellite data for groundwater replenishment [4]. Multispectral and multitemporal data from SPOT, IRS- 1A, IRS- 1B and IRS -1C when integrated with Land use, Geological, Geomorphologic, Hydro-geological and magnetic data have potentiality for identification of suitable areas for construction of check dams [10]. Interception of surface runoff by check dams across drainage at appropriate locations is one method for artificial recharge.
Leading institutes, hospitals and buildings of archeological importance covers substantial portion of Aravalli ridge area. Jawaharlal Nehru University (J.N.U.), Research and referral Hospital (RRH), Indira Gandhi National University (IGNOU), Humayuns Tomb (HT) areas are lacking sufficient surface water bodies, and palaeochannels. Very thin soil cover in this area is also not supporting the dug well structures. Groundwater occurrence is restricted to the deep-seated fracture zones only [2, 12, and 13]. High-resolution satellite data has the potential to infer buried pediment plains and interconnected fracture zones for the selection of groundwater exploration and artificial recharge sites. IRS-1D PAN and LISS-III data has better capability to infer these landform units in comparison to the IRS-P6-AWIFS data of limited spatial and spectral resolution (Figure 1 and Figure 2). Extraction of groundwater from non-potential aquifer may lead to land subsidence and destruction of vegetation in surrounding areas [8]. For selection of artificial recharge areas the radiance values of pixels in near infrared region of IRS satellite data were studied. Due to high recharge the soil moisture were less as well as the vegetation also. Lineaments are passing through the proposed check dams, which were selected based on their low spectral reflectance and low magnetic values over the weathered ferruginous quartzite, which are prevailing geologic suite of the study area. Groundwater level was gone down in this area, which increased after the artificial recharge. Plantations of suitable area specific species are restoring eco-conservation in the stressed aravallis (Figure.4).
Keeping in view the identical geological and spectral reflectance of the space sensor data, JNU area has been selected as type area for the investigation in this Aravalli ridge. The area under study is a 2km.X2.5 km. region situated on a low relief hill, northwest of Mehrauli and southwest of Hauz Khas in South Delhi, India. Satellite data products inferred Land use, Geological, Hydromorphogeological and ecological information. The satellite imageries covering the area were analyzed digitally to prepare a Geomorphologic map on 1:50,000 scales.
2. Methodology
2.1 Landuse studies
Environmental impact of anthropogenic activities on its surrounding area is dramatic. Land use change and over exploitation of groundwater has reduced the water table in ridge areas of Aravalli quartzite terrain of Delhi, India. These changed land use patterns were inferred from the high albedo structure in satellite images [11]. Fluctuation in water level in a part of South Delhi has been noticed since several years. Fall in water level was found during 1994-95 in RR Hospital, IIMC, Munirka Vihar, JNU old campus, Ber Sarai, JNU and Vasant Kunj of Aravalli ridge area. The recharge area for these points is Masoodpur and surroundings, which is inferred by lineament and geological attitude of Quartzite rocks. Further changes in these features may lead to lowering down of the water level which may even lead to land subsidence due to increased effective geostatic pressure.
2.2 Geological studies
With ferruginous stains or siliceous character containing bands of mica schist, grits and argillaceous material. Intrusions of pegmatites are present in quartzite along the shear zones and when altered, they give rise to morrum (coarse grained sand) and China clay.
Geological formation exposed in the southern ridge area belongs to the Alwar group of the Delhi Super Group of the Precambrian age. They are predominantly, thick bedded, massive, compact, Grey colored quartzites with subordinate argillites. They are fine to medium grained in general, but form gritty, arcosic and ferruginous, often giving brownish to reddish colors and streaks.
2.3 Structural geology by remote sensing techniques
The formation of the study area strikes along NS to NE-SW and dip steeply on either side indicating isoclinal folds. In ridge area satellite images show a series of folds in the western parts with N-S axes
The quartzites are characterized by several sets of well-developed fractures and joints. Of these the following sets are more prominent in the study area.
- *
- NNE-SSW (parallel to bedding) with steep easterly dips
- *
- E-W to ENE-WSW, vertical
- *
- NE-SE, vertical. Perpendicular to strike.
A few lineaments have also been identified in the area from satellite images. Of these, the two nearly E-W trending lineaments traced in the northern part of the campus are prominent. The less conspicuous lineaments/fractures identified in the images are along NW-SE. These lineaments have a control over the drainage in the area.
Vein quartz and pegmatites have been emplaced along fractures and joints in quartzite. Pegmatites contain feldspars, muscovite, quartz and tourmaline. Clay (kaolin) derived from weathering of pegmatite is extensively mined in the area west of the campus.
The compact, Grey quartzites are highly resistant to weathering and they stand out as jointed, blocky or sub rounded boulders as a result of intersecting joints. But weathering is more prominent along sheared gritty, arcosic and ferruginous quartzites, which result in sandy or gritty, red soil.
Over the eroded surfaces of Alwar quartzites and in the elongated depressions between the quartzite ridges, are deposited the weathered agleam and alluvial materials and soil, which include clay, loam, silt, grit, gravel and kankar of recent to sub recent origin.
Delhi ridge lineaments were inferred by using RESOURSESAT-1 (IRS-P6 Sensor-AWIFS data show a strong trend in NE-SW direction only further the area was studied by using IRS-1D Panchromatic and LISS-III sensor has shown detailed lineament which passes though Asola Bhati sanctuary, J.N.U. sports, complex (stadium), RR Hospital and extends up to Bahadurgarh in Haryana (adjacent to north west Delhi). Panchromatic sensor shows detailed land use patterns of Delhi area, which are useful information in water resource management [Figure.3]. Measurements were taken along this lineament, which is inferred as sudden decrease in magnetic values (average magnetic value of Delhi region is 47,000 gammas). Groundwater recharge map of whole Delhi and specifically ridge area has been prepared by using multisensor satellite data and geophysical investigations (Figure.5 and Figure.6). Based on the spot magnetic values in and around J.N.U. eleven profiles were done. Contour maps were made along the profile. Contour lines were drawn at every ten gammas interval; Low magnetic values were noticed in lineaments on ferruginous quartzite. Selection of check dams was based on the points inferred by magnetometer showing low magnetic values and interconnected lineaments.
A Geographic Information system map was prepared for J.N.U. area showing geology, lineament and magnetic anomaly.
2.4 Surface water management: Rainwater harvesting
Interception of surface run-off by check dams across drainage at appropriate locations is one method of surface water management. Three check dams have been constructed in JNU.
In JNU campus, a series of check bunds with pipe outlets have been proposed to construct for rainwater harvesting. Locations for such structures have been selected where the valley section is narrow and maximum spreading up of steam, with least bearing on the height of the structure is possible. Thus 14 sites have been selected for check dams extend outside the campus.
Out of these three check dams are already constructed in western stream and another in northern stream. The rise in water level in 16 piezometers is being monitored every month. The results are encouraging. It is observed that there is substantial increase in water level in the JNU campus after the recharge through check dams. Merged sensors data of IRS-PAN and LISS-III has been interpreted using ERDAS image processing and Arc GIS software for the whole Delhi area.
2.5 Eco-conservation of using multisensor data
The Delhi master plan of August 1990 clearly states that the ridge ″ should be conserved with utmost care and should be afforested with indigenous species with minimum of artificial landscape. Within urbanized areas of southern ridge some areas of the ridge have successfully retained and regenerated their bio-diversity and also sustained a considerable variety of fauna, including some rare species, other parts have suffered substantial denudation, soil erosion, etc.
The water level in some parts of JNU, RR Hospital has already risen by over ten meters in less than two years and the water discharge in bore wells in neighboring areas of JNU has shown remarkable improvement. Also the check dams are creating water bodies, which the master plan says, “should be developed to act as major lung spaces and to attract migratory birds and for improving the microclimate”.
Multi-date satellite images infer changes in vegetation canopy cover from 1987 to 1997. This appears to be due to increase in soil moisture by artificial recharge in JNU campus. There has been about 1.104 square kilometer (46.96 percent) increase in dense vegetation canopy cover due to increase in groundwater level. This increase is mainly reported in JNU valley and Sanjay Van and its eastern parts.
It is now planned to recreate the forest cover of the large denuded parts of the JNU ridge through planting of new trees of indigenous varieties, which are native to the ridge. Based on the soil type, thickness moisture retaining capacity and slope of the area plantation scheme has already started. The areas where it was decided to do planting on a priority basis were:
- a)
- On sides of roads where no trees have been planted so far or where trees have died.
- b)
- In selected forest areas especially around the check dams so as to increase the percolation of water and to prevent silting through soil erosion.
- c)
- Any areas where excessive denudation has occurred.
Being situated on a structural hill made up of hard, massive quartzite rocks and buried pediment, the flora of this campus is unique. An attempt was made to classify the suitable Hydromorphogeological niche for new plantation. IRS-1C and SPOT data were used for this purpose. Ground truth was done by resistively meter and ground truth radiometer. In areas where resistively value is ranging in between 20 to 300 ohm meter the geomorphologic unit is classified as buried pediment. Pediments and ridges show relatively higher resistivity values. A new terminology is being introduced here “Eco-hydromorphogeology” which infers suitable hydrology, geology, morphology for the ecology of the area. Some species selected for roadside planting are Prosopis cineraria (Khejri), for shallow buried pediment Acacia leucophloea (safed kikar), Acacia senegal (kumta) Cordia rothii (gondi), etc., Suitable plants for sandy soil near Check dam sites are Salvadora persica (Pilu), Boswellia serrata (salai) etc. Suitable draught resistant plant would be Acacia modesta (phulanhi). Fast growing plants in Buried pediment plain (Deep) are suitable for Zizyphus nummularia (Kokanber). The eco-hydromorphogeology of Aravalli ridge (Table 1) gives a clear guideline of suitability of plant species in this varied terrain.
2.6 Qualitative improvement in groundwater by rainwater harvesting
The quality of water for domestic consumption is of paramount significance as the chemical and microbiological contamination of potable water can lead to serious health hazards/body disorders through a waterborne disease of toxic chemicals. Qualitative improvement in groundwater quality in JNU campus can be quantified by pre and post rainwater harvesting water quality studies. Table 2 shows the qualitative improvement of groundwater after artificial recharge. This work has a long-term economic importance as well as useful for improvement of groundwater quality For selection of artificial recharge areas the radiance values of pixels in near infrared region of IRS satellite data were studied, otherwise, the cost of water treatment would have levied measurable recurring financial burden on the University.
3. Results
From 1996 to 2006 four rainfall cycles were identified each year in Delhi ridge area and their effects of recharging to groundwater regime were observed in sixteen piezometers in JNU campus, tapping shallow and deep aquifers. These piezometers were installed downstream along its course and lateral to it. The depth to water level in the area prior to check dam construction was ranging in between 17-22 meter below land surface. From 1996, the rise of water level was noticed between 5.26 and 12.50 meter in the piezometers about 166 and 44 meters from the dam respectively. It was computed that 90, 000 cubic meter of water was recharged per year to the shallow and deep aquifers and 2000 cubic meter were lost due to evaporation. Out of total quantity of water resource available, about 98% had been recharged to the aquifers. Due to increase in soil moisture, the total area under dense and sparse vegetation canopy cover has increased. Dense vegetation has increased 46.96%; sparse vegetation has increased 24.30%. Area without vegetation has shown 2.14% vegetation.
4. Conclusion
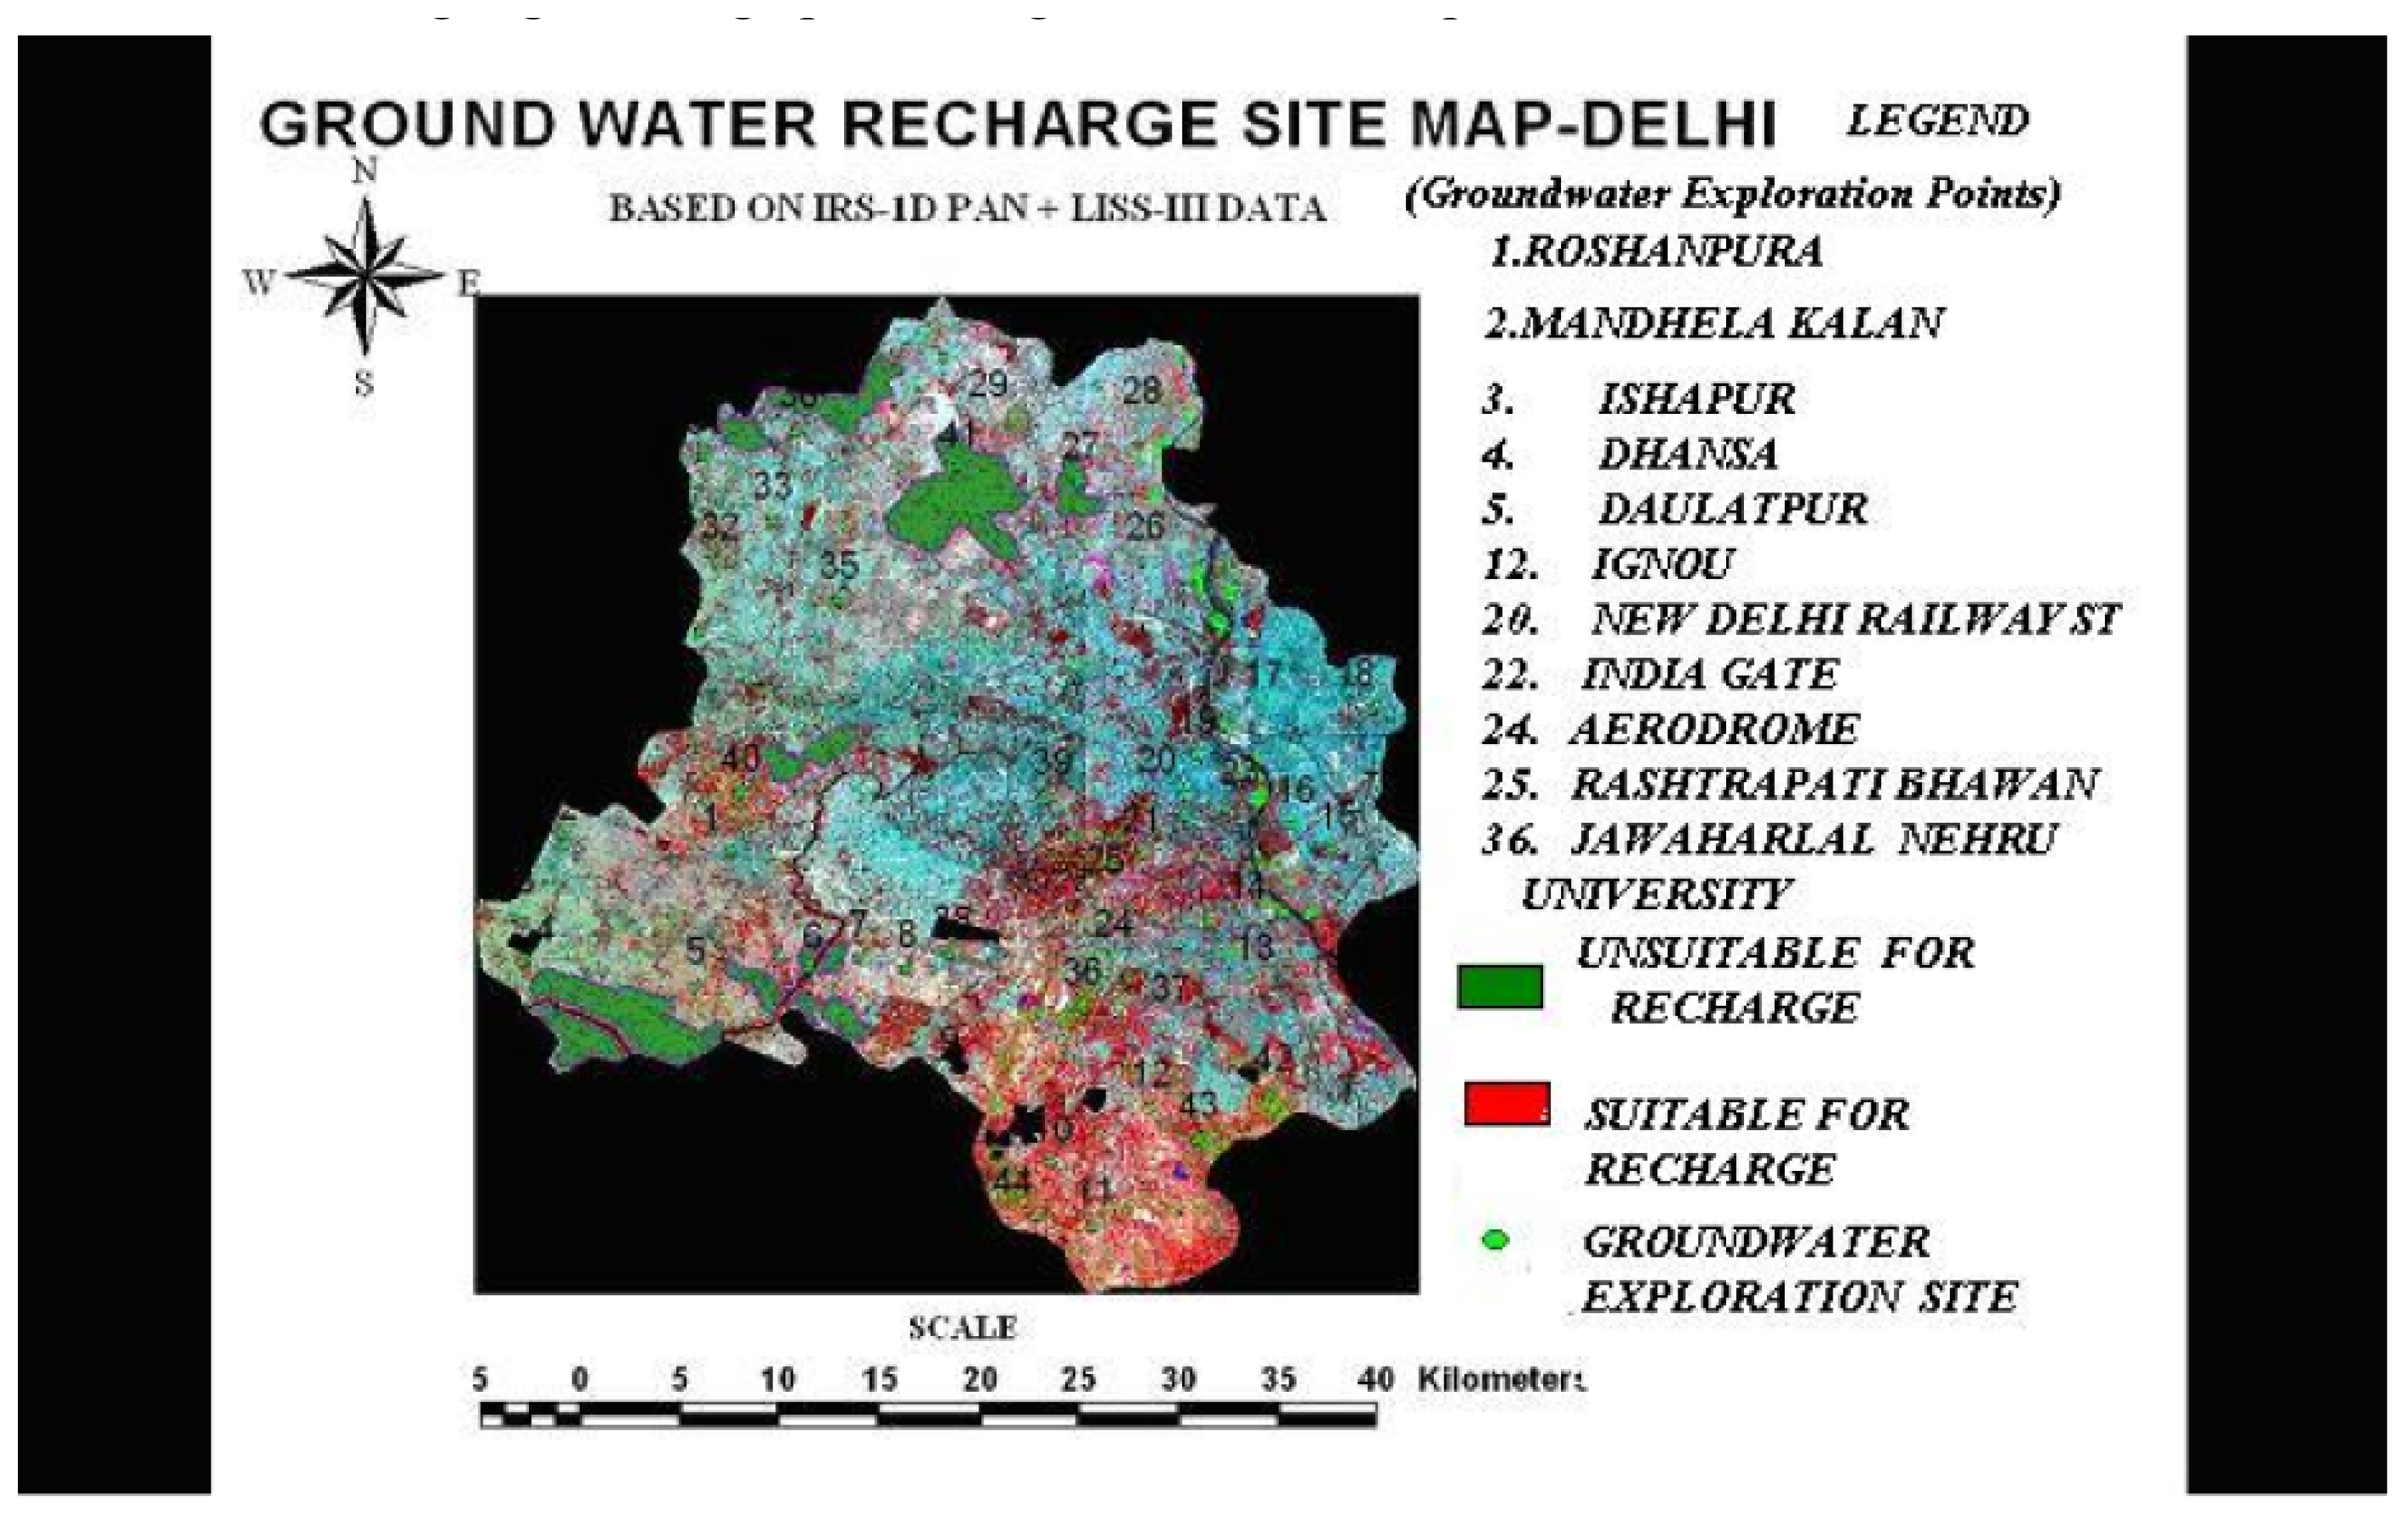
Selection of drilling sites for ground water was based on spectral reflectance from multispectral high-resolution satellite data for identification of interconnected fractures exposed and hidden within the soil and vegetation cover. Within Delhi a total 44 points were selected as suitable for groundwater exploration. These locations are as following: 1. Roshanpura 2. Mandhela Kalan 3. Isapur 4. Dhansa 5. Daulatpur 6. Najafgarh Drain 7. Tihar Central Jail 8. Jahanabad 9. Kapashera 10. Dinapur 11. Dera Mandi 12. IGNOU 13. Lotus Temple 14. Nehru Stadium 15. Mayur Vihar 16. Shashtri Nagar 17. Brahmapuri 18. Ramnagar 19. Delhi Railway Station 20. New Delhi Railway Station 21. Connaught Place 22. India Gate 23. Indira Gandhi International Airport 24. Aerodrome 25. Rashtrapati Bhawan 26. Burati 27. Nathupura 28. Tajpur Kalan 29.Narela 30. Daryapur Kalan 31. Qutubgarh 32. Jauni 33. Salahpur 34. Rashidpur 35. Karala 36. JNU 37. Hauz Khas 38. IGI Airport 39.Pusa Institute 40. Didhon 41.Halambi Khurd 42.Vocational Training Institute 43. Asola Wild Life sanctuary 44.Mandi. Normalized Difference Vegetation Index (NDVI) was generated in vegetated areas and relative soil moisture in buried pediment plains and soil covers were detected from the non-vegetated surface areas.
Based on the results of the multispectral sensor data interpretation water resource management in the Aravalli ridge area was successfully implemented.
Eco-hyrdromorphogeological plantations in this area will be useful in reducing the air pollution. Other parts of Delhi also require similar type of rainwater harvesting practices to improve groundwater environment and for Eco-conservation.
Acknowledgments
Author is grateful to CGWB, Government of India for help in drilling and construction of check dams in various parts of Delhi.
References
- Bhanumurty, Y.R.; Dimri, D.B.H. Geophysical investigations for the geotechnical project of Delhi metropolitan area. Geological Survey of India 1978, Misc. Pub. 43. 35–43. [Google Scholar]
- Jaisawal, R.K.; Krishnamurthy, J.; Mukherjee, S. Role of Remote sensing and GIS techniques for generation of groundwater prospect zones towards rural development- an approach. International Journal of Remote Sensing 2003, 24(5), 993–1008. [Google Scholar]
- Kale, P. Sustainable development: critical issues. Journal of Indian Society of Remote Sensing 1992, 20(4), 183–186. [Google Scholar]
- Mishra, J.K.; Aarthi, R.; Joshi, M.O. Remote sensing quantification and change detection of natural resources over Delhi. Atmospheric Environment 1994, 28(19), 3131–3137. [Google Scholar]
- Mukherjee, S. Change in groundwater environment with land use pattern in a part of South Delhi: a remote sensing approach. Asian-Pacific Remote Sensing and GIS journal 1997, 9(2), 9–14. [Google Scholar]
- Mukherjee, S.; Mukherjee, A. Quantitative and qualitative improvement in groundwater by artificial recharge; a case study in JNU, New Delhi. In Proceeding 10th International Rainwater catchment systems; 2001; Margrav-Verlag: Mannheim, Germany. [Google Scholar]
- Mukherjee, S. Eco-conservation of a part of JNU campus, by GIS analysis. In Proceeding National Symposium on artificial recharge of groundwater; 1998; New Delhi, India. [Google Scholar]
- Mukherjee, S. Land subsidence in middle Andaman: A case study. Hydrology journal 1986, 13(3), 150–156. [Google Scholar]
- Mukherjee, S. Text Book of Environmental remote Sensing; Macmillan India Limited: New Delhi India, 2004; ISBN: 1403922357; pp. 139–148. [Google Scholar]
- Murthy, K.S.R. Groundwater potential in a semi-arid region of Andhra Pradesh: A geographical Information System approach. International journal of Remote Sensing 2000, 21(9), 1867–1884. [Google Scholar]
- Rao, L.K.M. Remote sensing for land use planning. International Journal of Remote Sensing 1995, 16(1), 53–60. [Google Scholar]
- Saraf, A.K.; Chaudhary, P.R. Integrated remote sensing and GIS for groundwater exploration and identification of artificial recharges sites. International Journal of Remote Sensing 1998, 19(10), 1825–1841. [Google Scholar]
- Singh, A.K.; Prakash, S.R. Delineation of groundwater potential zones in Bakhar sub-watershed Mirzapur & Sonebhadra districts, U.P., using integrated studies of Remote Sensing, Geoelectrical and GIS techniques. Proceeding of ISRS National symposium 2000, held at Kanpur, India. 320–329. [Google Scholar]
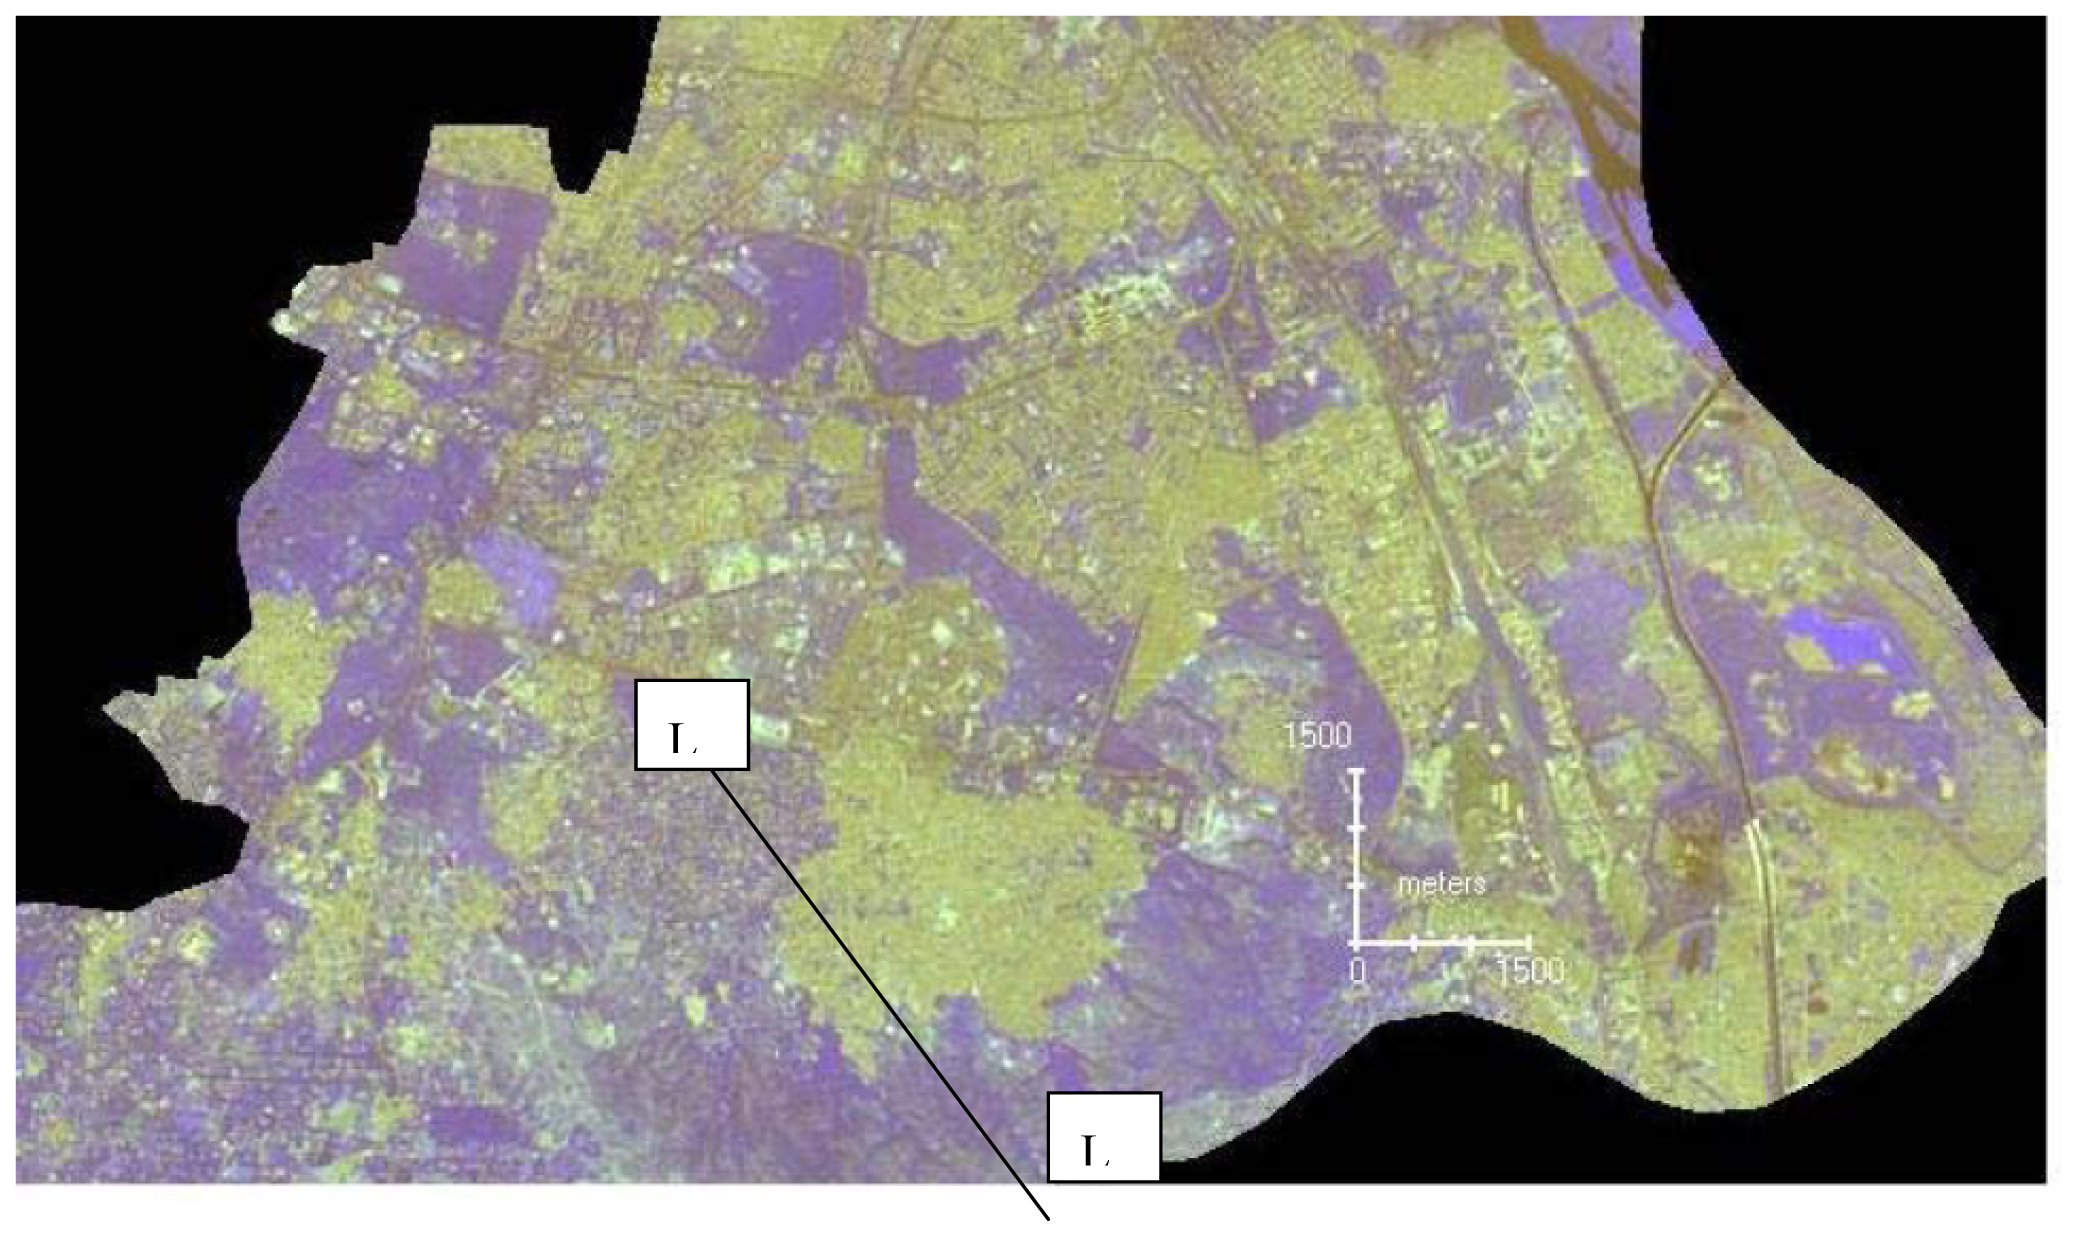
Figure 1.
AWIFS sensor showing lineaments (L) in south Delhi but detailed information of hydrogeology is not possible to infer for water resource management.
Figure 1.
AWIFS sensor showing lineaments (L) in south Delhi but detailed information of hydrogeology is not possible to infer for water resource management.
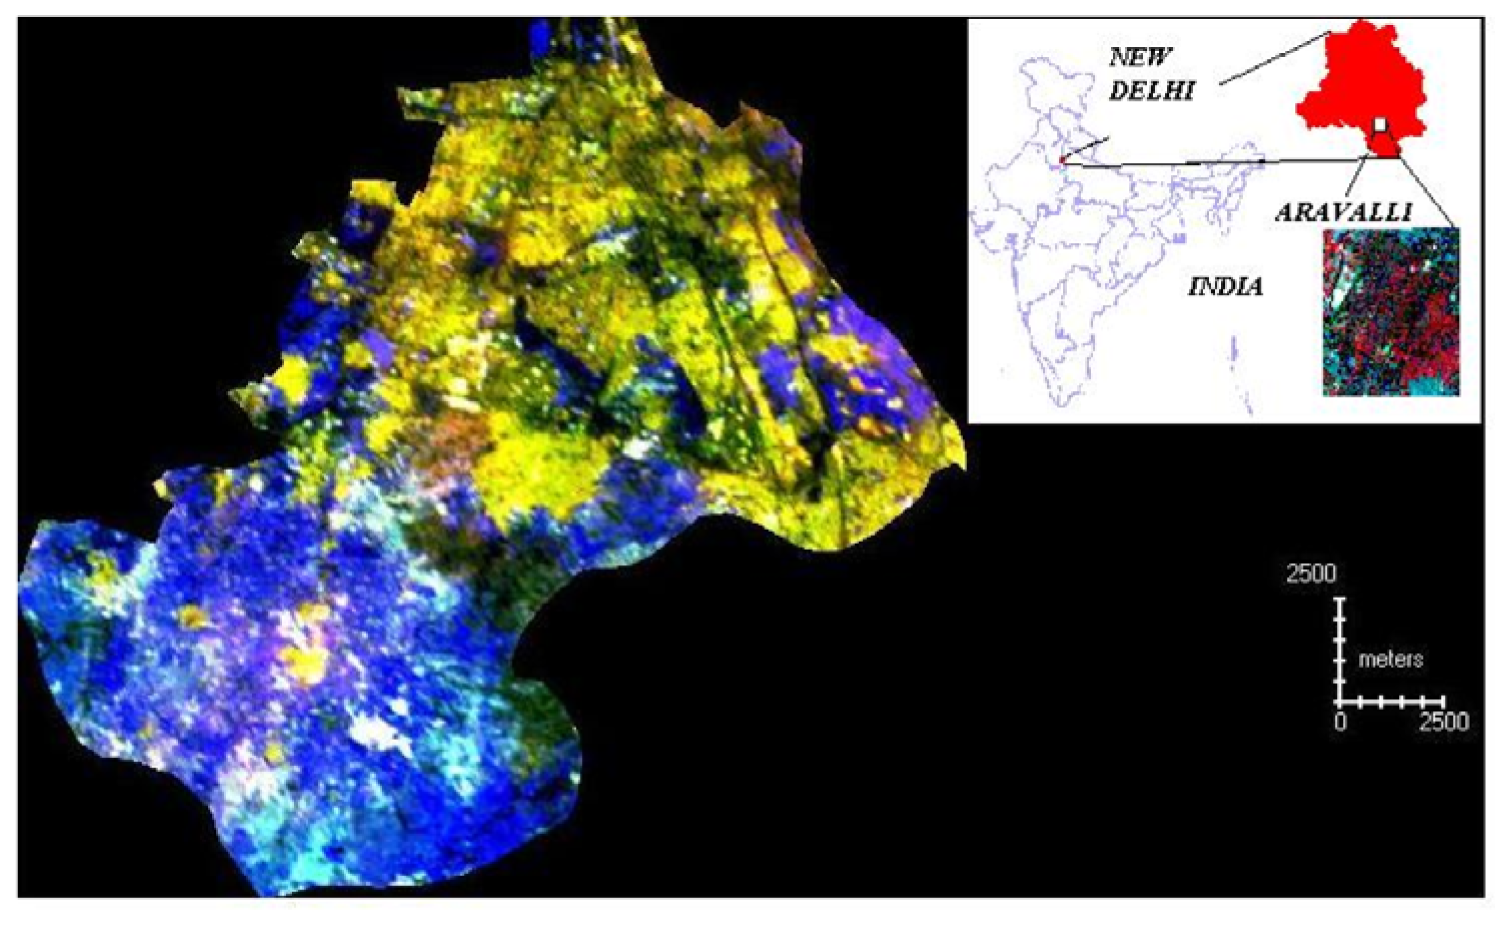
Figure 2.
IRS-1D LISS-III sensor data using ERDAS software showing details of lineaments (L) and detailed hydrogeological information of whole Delhi for ground water management.
Figure 2.
IRS-1D LISS-III sensor data using ERDAS software showing details of lineaments (L) and detailed hydrogeological information of whole Delhi for ground water management.

Figure 3.
IRS-1D Panchromatic sensor data using ERDAS software showing detailed landuse useful in pinpoint location of groundwater recharge points.
Figure 3.
IRS-1D Panchromatic sensor data using ERDAS software showing detailed landuse useful in pinpoint location of groundwater recharge points.
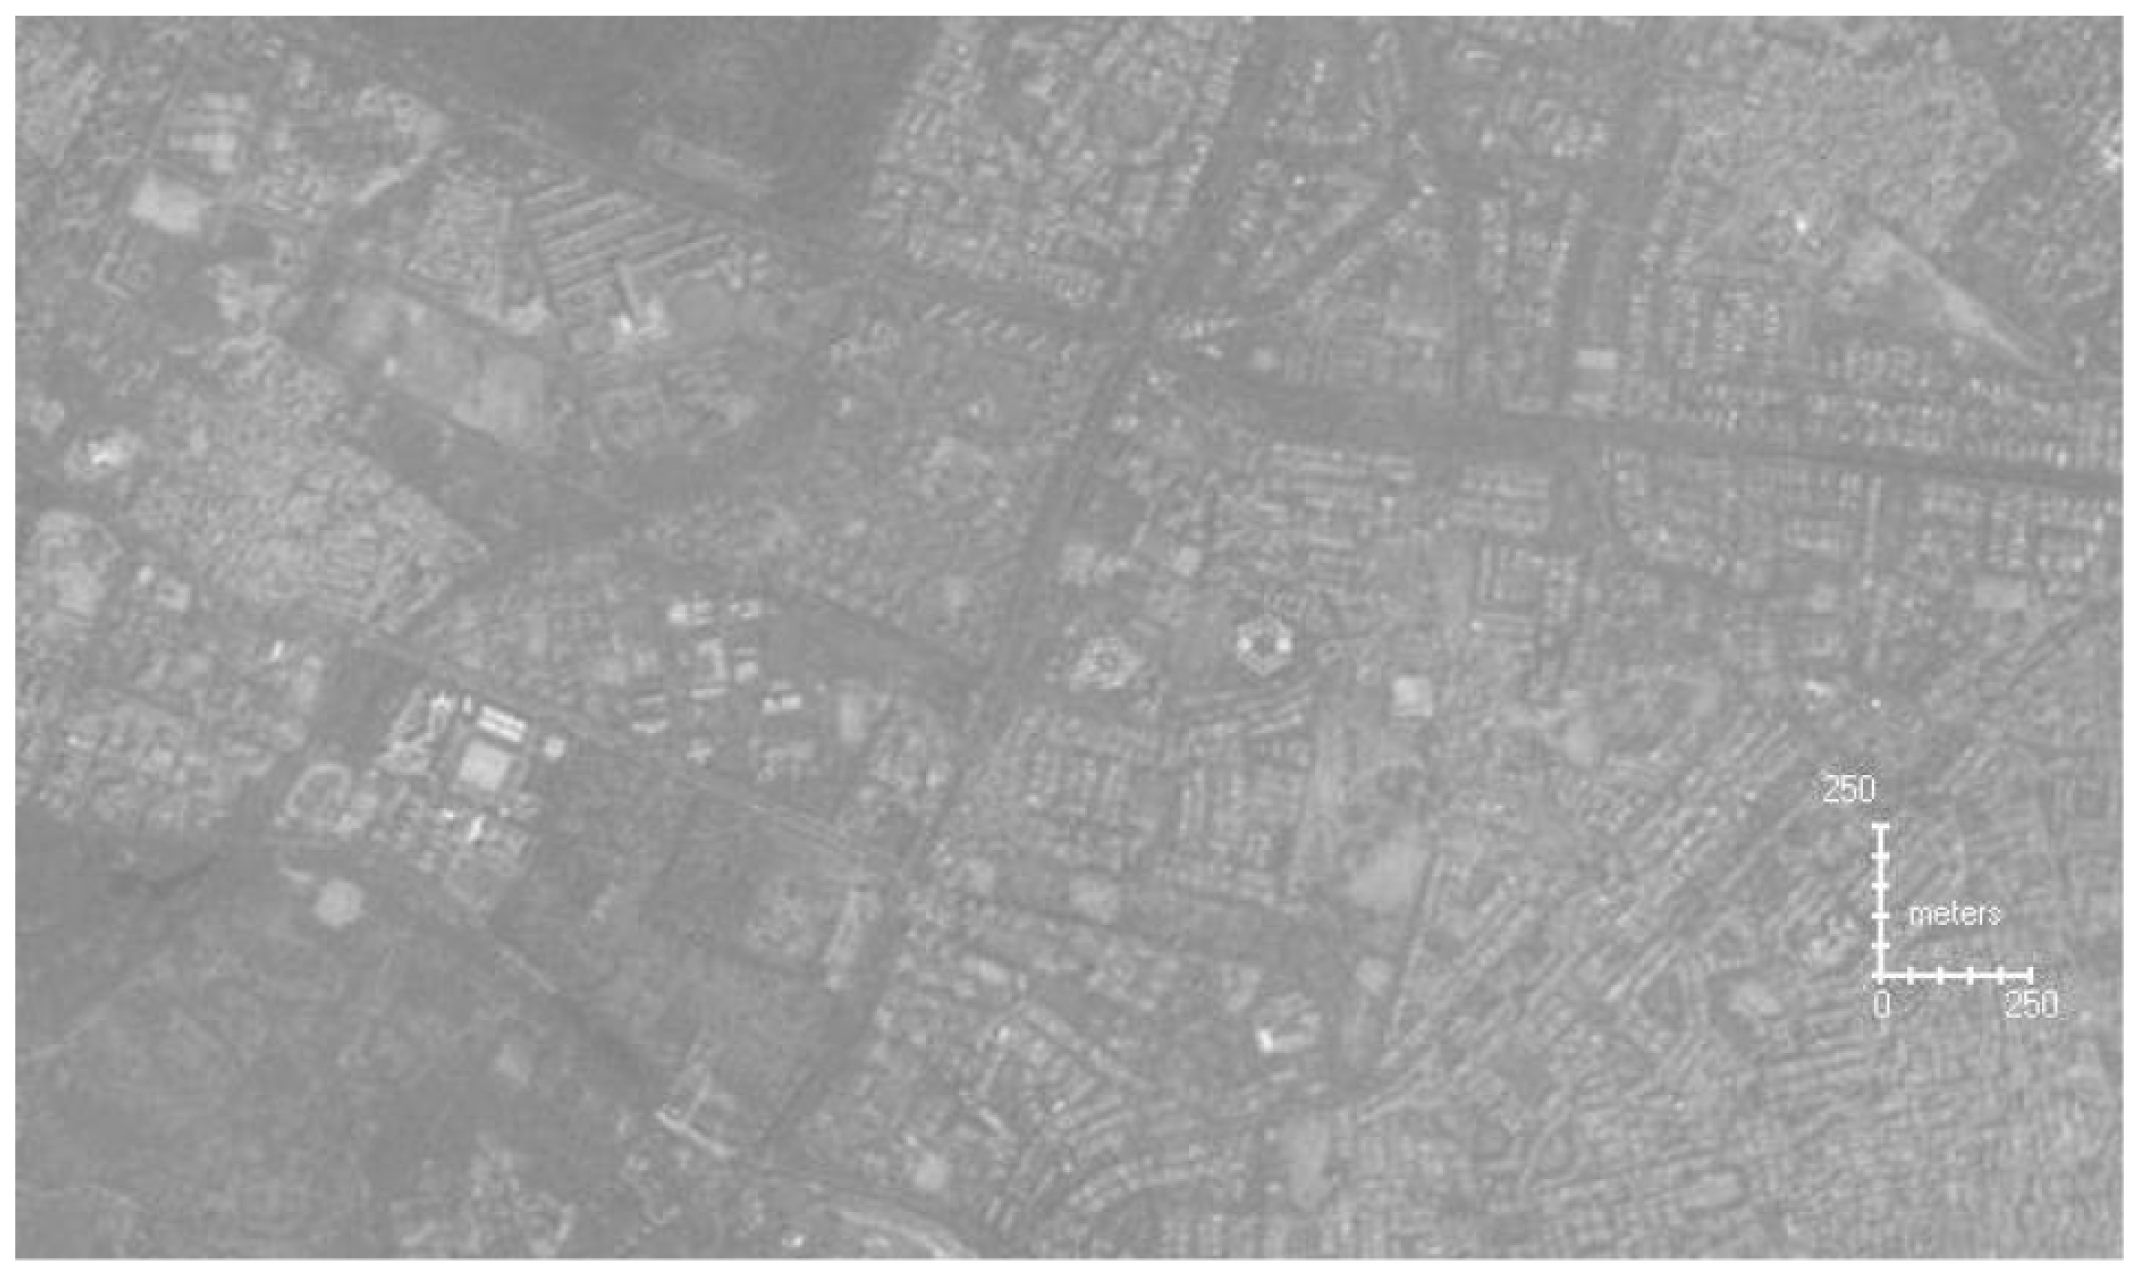
Figure 4.
Change in NDVI study by IRS-1D LISS-III and PAN sensor data showing more vegetation as black patch in JNU, a part of Aravalli Quartzite ridge in New Delhi, India. This data was used for selection and monitoring of groundwater recharge (check dam).
Figure 4.
Change in NDVI study by IRS-1D LISS-III and PAN sensor data showing more vegetation as black patch in JNU, a part of Aravalli Quartzite ridge in New Delhi, India. This data was used for selection and monitoring of groundwater recharge (check dam).
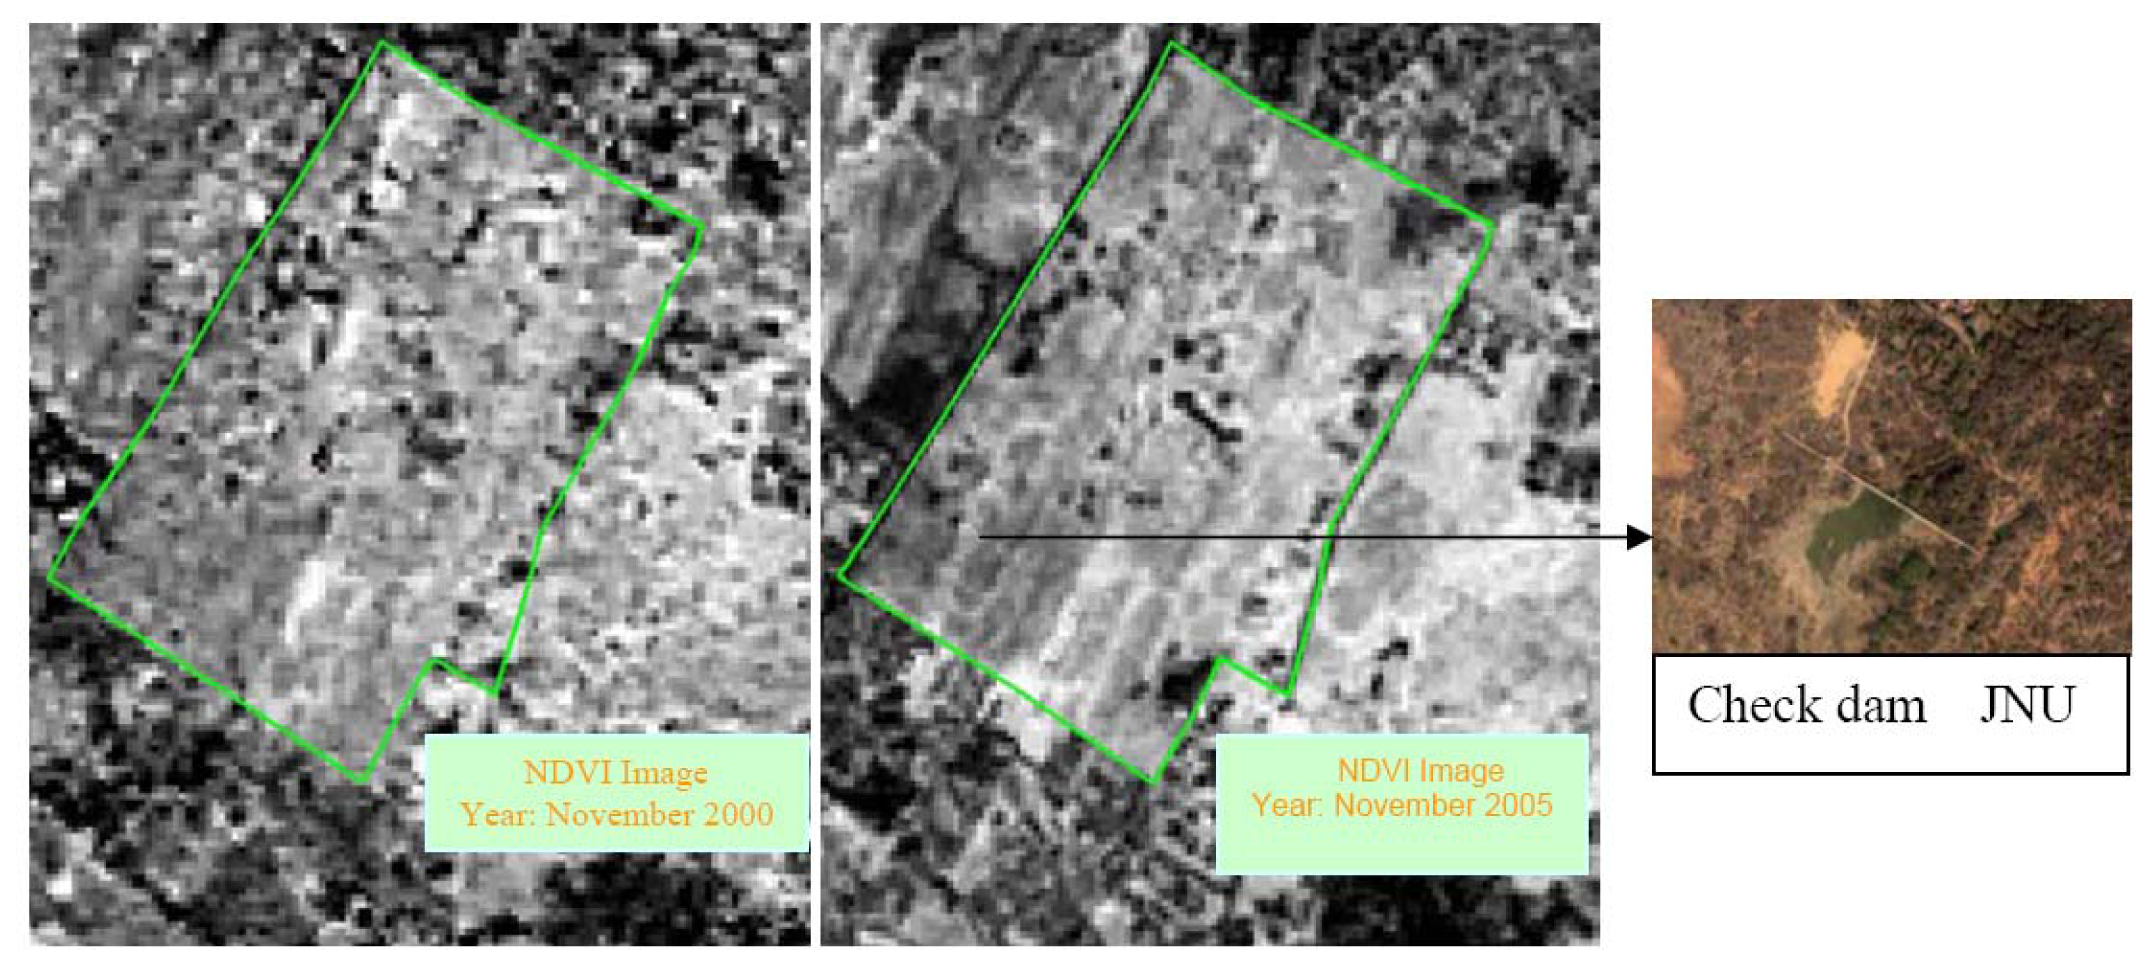
Figure 5.
Merged data (PAN+ LISS-III sensor) of RR Hospital area, part of Aravalli ridge showing higher value of Normalized Difference Vegetation Index (NDVI) in increasing suitability for groundwater exploration with increasing red colour of satellite image.
Figure 5.
Merged data (PAN+ LISS-III sensor) of RR Hospital area, part of Aravalli ridge showing higher value of Normalized Difference Vegetation Index (NDVI) in increasing suitability for groundwater exploration with increasing red colour of satellite image.
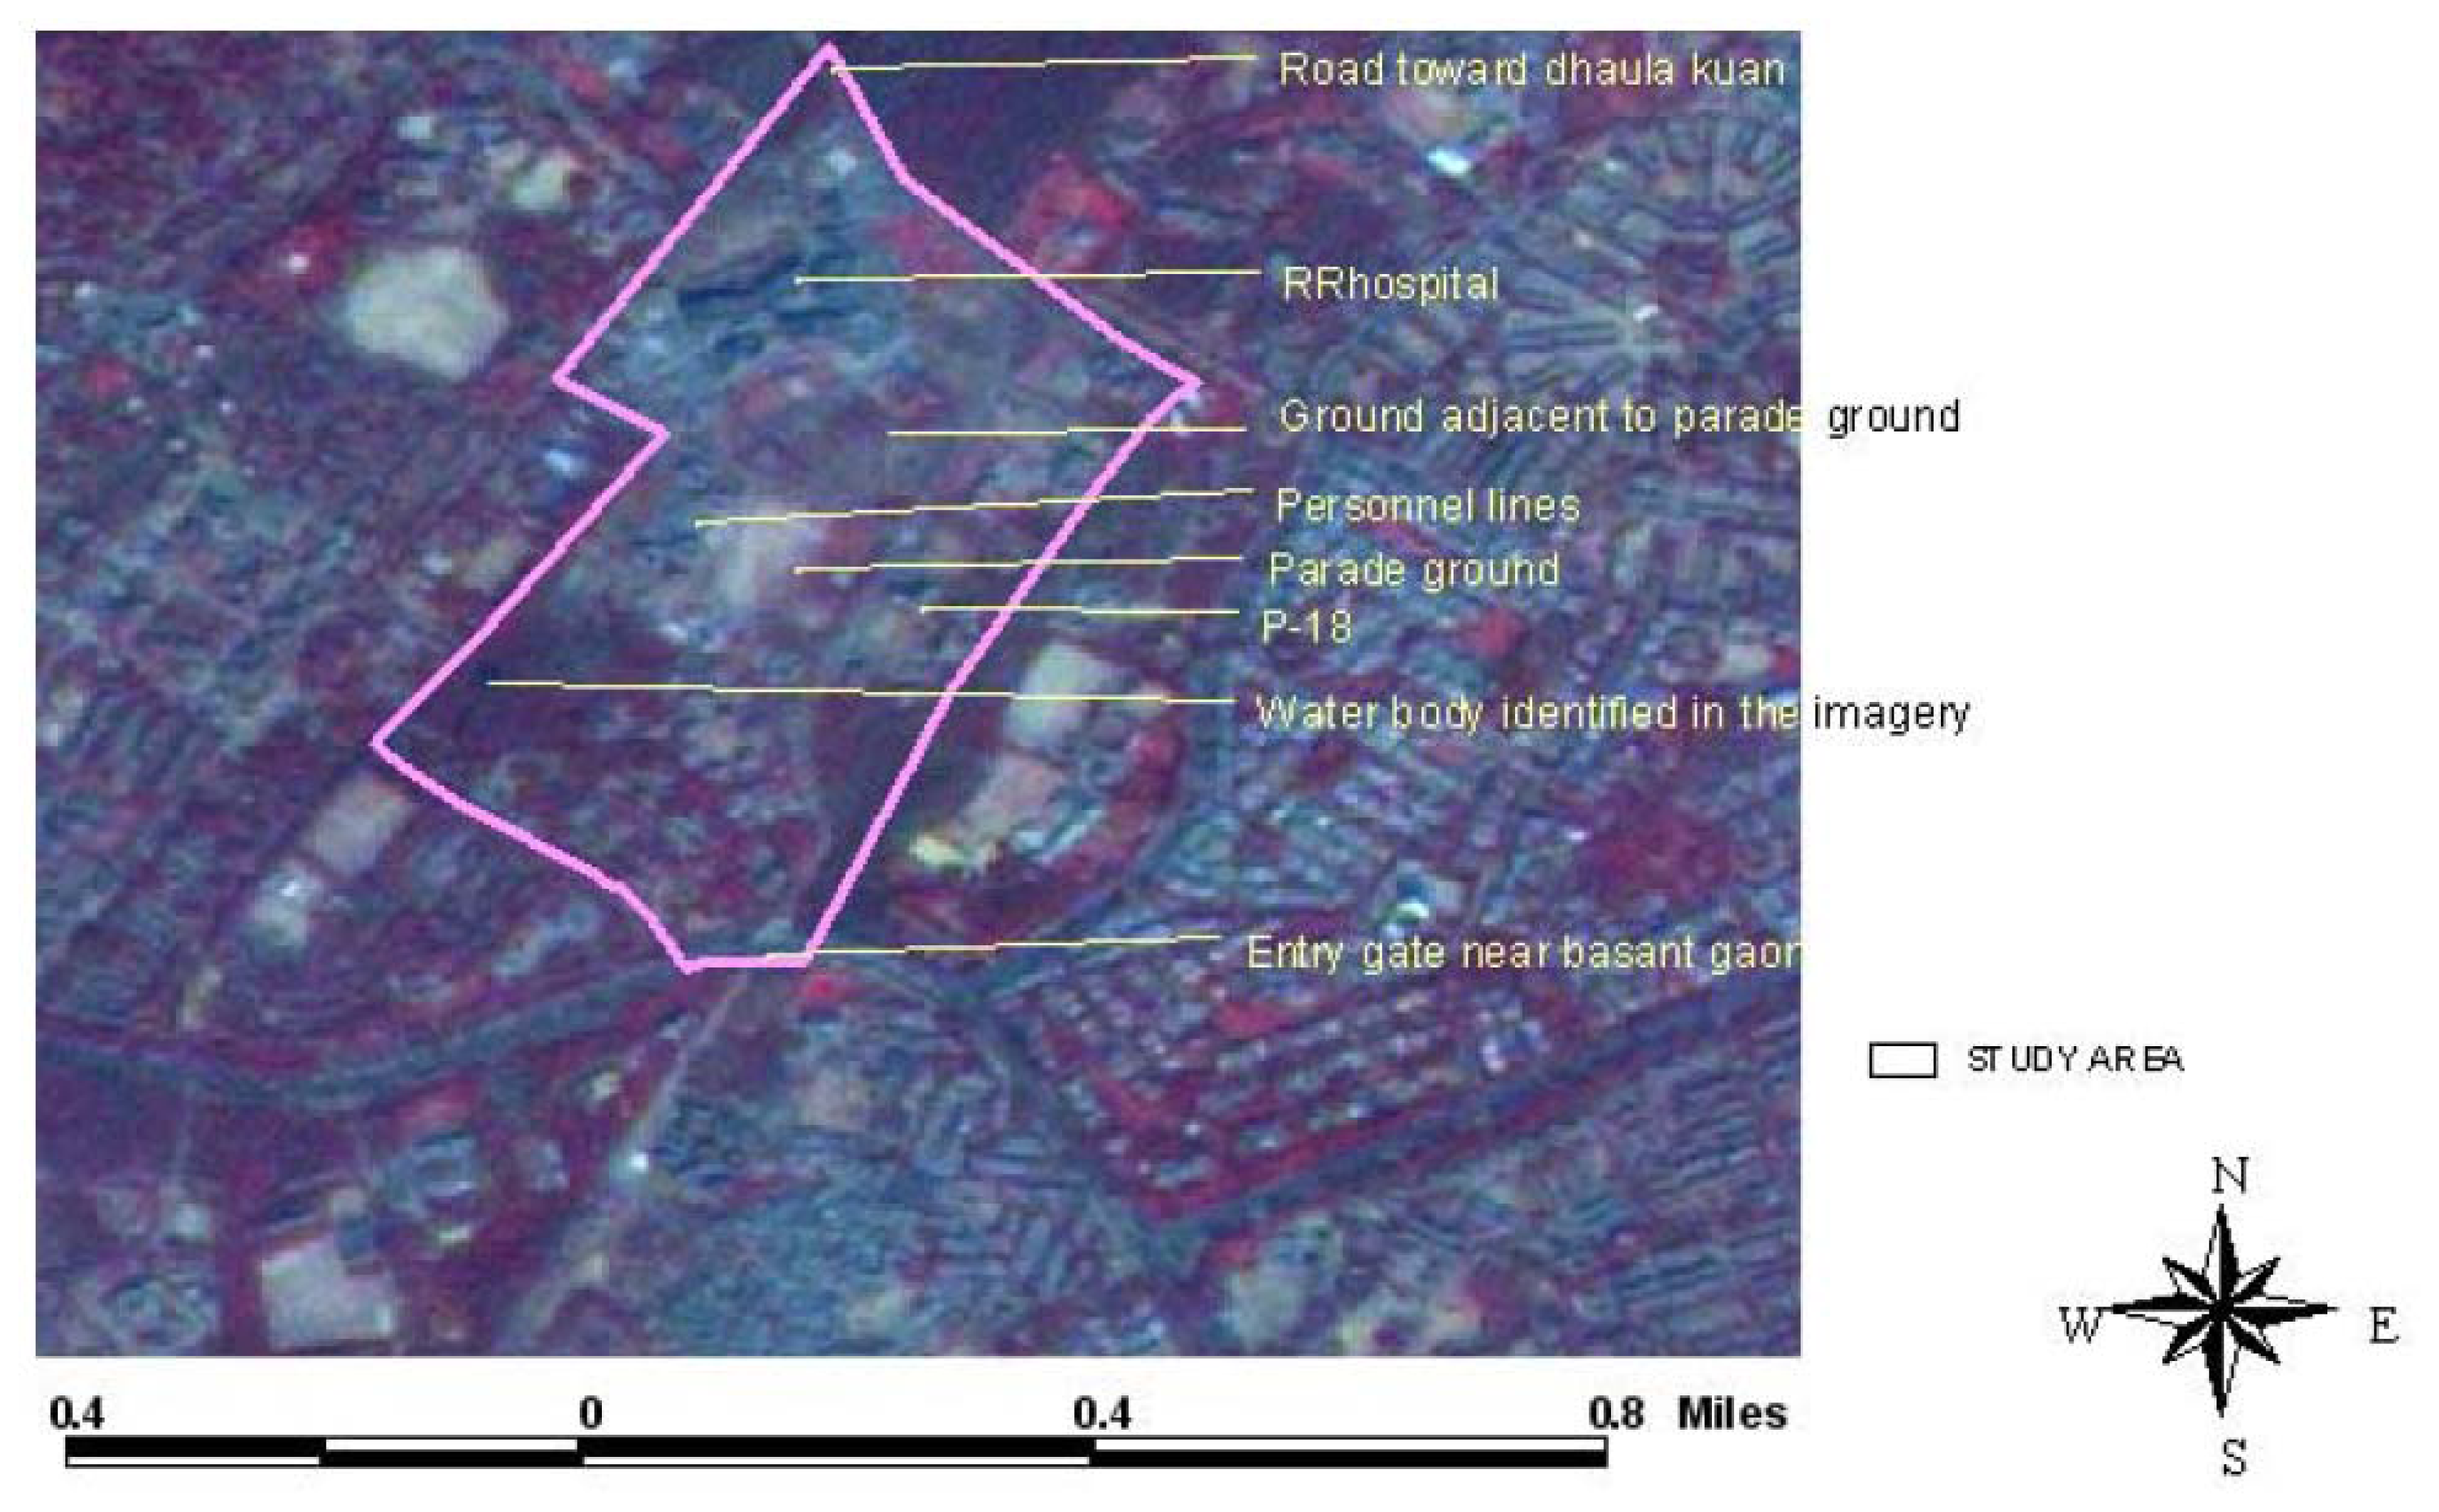
Figure 6.
Merged sensor data shows high accuracy groundwater recharge site map of whole Delhi using digital image processing and GIS techniques.
Figure 6.
Merged sensor data shows high accuracy groundwater recharge site map of whole Delhi using digital image processing and GIS techniques.


| Geomorphic Unit | Landform | Hydrogeology | Suitable flora | Sensor |
|---|---|---|---|---|
| Residual/structural hills | Rocky ridges tors and mounds. | Massive compact jointed quartzites. Poor ground water | Prosopisjulfiflora (Kabulikikar) Azadirachta indica (Neem) Miragyna parviflora (Kadamb) | Lineaments intersection and species identification is possible with IRS-1D LISS-III merged with PAN data. |
| Pediment | Undulating, eroded and dissected, shallow buried pediment with rock exposures. Thickly vegetated with scrub. | Weathered coarse gritty or arcosic quartzite with cover of clayey and silty soil along stream course. Moderate to good ground water prospects along fracture and shear zones. | Acacia Senegal (Kumta) Wringhitia tinctoria (Dudhi) Balanites aegyptiaca (Hingot) Streculia urens (Kullu) Boswellia serrata (Salai) | Groundwater potential Pediment and NDVI based species identification possible in AWIFS, IRS-LISS-III and PAN data. |
| Buried Pediment | Plain to gently sloping ground with occasional rock outcrops. | Silty clayey and at places gravelly soil derived from weathering of arcosic and gritty quartzite. Good ground water prospects | Ficus benghalensis (Bargad) Cassia fistula (Amaltas) Albizzia lebbeck (Siras) Fics religiosa (Peepal) Ficus infectoria (Pilkhan) Terminalia arjuna (Arjun) Bauhinia variegata (Kachnar) | Buried Pediment delineation with Pediment is possible by using IRS-PAN and LISS-III merged data but the landform units are difficult to infer by using AWIFS data. |
| pH | EC micromohos/cm | Hardness CaCO3(mg/l) | Ca (mg/l) | Mg (mg/l) | NO3(mg/l) | F (mg/l) | |||||||
|---|---|---|---|---|---|---|---|---|---|---|---|---|---|
| Prior | After | Prior | After | Prior | After | Prior | After | Prior | After | Prior | After | Prior | After |
| 8.5 | 7.0 | 694 | 137 | 460 | 394.5 | 92 | 148 | 73.3 | 22.06 | 296 | 148.2 | 0.9 | 0.9 |
© 2008 by MDPI Reproduction is permitted for noncommercial purposes.
Share and Cite
MDPI and ACS Style
Mukherjee, S. Role of Satellite Sensors in Groundwater Exploration. Sensors 2008, 8, 2006-2016. https://doi.org/10.3390/s8032006
AMA Style
Mukherjee S. Role of Satellite Sensors in Groundwater Exploration. Sensors. 2008; 8(3):2006-2016. https://doi.org/10.3390/s8032006
Chicago/Turabian StyleMukherjee, Saumitra. 2008. "Role of Satellite Sensors in Groundwater Exploration" Sensors 8, no. 3: 2006-2016. https://doi.org/10.3390/s8032006